
#onchaindata
onchaindata
683,075 views
3,978 Discussing
Hot
Latest


·
--
Verified
DOGECOIN ($DOGE ) — Complete Market & On-Chain Research | November 14, 2026
Market Overview: Dogecoin (DOGE) is trading around $0.06313, down 3.20% in 24 hours and 12.90% over seven days. Its 24-hour trading volume is approximately $582.46 million, with a market capitalization of $9.90 billion. DOGE ranks #13 on CoinGecko, with approximately 156.729 billion DOGE circulating and no maximum supply. CoinGecko +1
ETF Activity: The latest detailed ETF report, covering November 12, shows zero net flows among the reporting funds (2 of 3 reported). Reported ETF net assets stand at approximately $11.3 million, with cumulative net inflows of $15.1 million and 2026 YTD inflows of $12.7 million. Crypto ETF +1
On-Chain Activity: Dogecoin recorded approximately 37,197 daily active addresses and 193,442 transactions during the week of November 7, representing declines of 27% and 17%, respectively, year over year. Weekly payments reached 183,885. Native base-layer TVL and stablecoin supply are not established reporting metrics. Dogechain
Recent Developments: DOGE recently reached its lowest price since October 2023 despite reported whale accumulation. Meanwhile, DogeOS is approaching mainnet launch, with its first-version development and audits reportedly completed. More than 100 builders are working on applications and integrations. No confirmed launch date has been announced. Pluang +1
Market Context: Dogecoin currently faces declining network activity, weak seven-day price performance and limited ETF inflows. Its upcoming ecosystem expansion represents an important development to monitor, while actual adoption and sustained network activity remain key indicators of progress.
#CryptoResearch #OnChainData #CryptoMarket #ETF #Blockchain
DOGECOIN ($DOGE ) — Complete Market & On-Chain Research | November 14, 2026
Market Overview: Dogecoin (DOGE) is trading around $0.06313, down 3.20% in 24 hours and 12.90% over seven days. Its 24-hour trading volume is approximately $582.46 million, with a market capitalization of $9.90 billion. DOGE ranks #13 on CoinGecko, with approximately 156.729 billion DOGE circulating and no maximum supply. CoinGecko +1
ETF Activity: The latest detailed ETF report, covering November 12, shows zero net flows among the reporting funds (2 of 3 reported). Reported ETF net assets stand at approximately $11.3 million, with cumulative net inflows of $15.1 million and 2026 YTD inflows of $12.7 million. Crypto ETF +1
On-Chain Activity: Dogecoin recorded approximately 37,197 daily active addresses and 193,442 transactions during the week of November 7, representing declines of 27% and 17%, respectively, year over year. Weekly payments reached 183,885. Native base-layer TVL and stablecoin supply are not established reporting metrics. Dogechain
Recent Developments: DOGE recently reached its lowest price since October 2023 despite reported whale accumulation. Meanwhile, DogeOS is approaching mainnet launch, with its first-version development and audits reportedly completed. More than 100 builders are working on applications and integrations. No confirmed launch date has been announced. Pluang +1
Market Context: Dogecoin currently faces declining network activity, weak seven-day price performance and limited ETF inflows. Its upcoming ecosystem expansion represents an important development to monitor, while actual adoption and sustained network activity remain key indicators of progress.
#CryptoResearch #OnChainData #CryptoMarket #ETF #Blockchain
Market Overview: Dogecoin (DOGE) is trading around $0.06313, down 3.20% in 24 hours and 12.90% over seven days. Its 24-hour trading volume is approximately $582.46 million, with a market capitalization of $9.90 billion. DOGE ranks #13 on CoinGecko, with approximately 156.729 billion DOGE circulating and no maximum supply. CoinGecko +1
ETF Activity: The latest detailed ETF report, covering November 12, shows zero net flows among the reporting funds (2 of 3 reported). Reported ETF net assets stand at approximately $11.3 million, with cumulative net inflows of $15.1 million and 2026 YTD inflows of $12.7 million. Crypto ETF +1
On-Chain Activity: Dogecoin recorded approximately 37,197 daily active addresses and 193,442 transactions during the week of November 7, representing declines of 27% and 17%, respectively, year over year. Weekly payments reached 183,885. Native base-layer TVL and stablecoin supply are not established reporting metrics. Dogechain
Recent Developments: DOGE recently reached its lowest price since October 2023 despite reported whale accumulation. Meanwhile, DogeOS is approaching mainnet launch, with its first-version development and audits reportedly completed. More than 100 builders are working on applications and integrations. No confirmed launch date has been announced. Pluang +1
Market Context: Dogecoin currently faces declining network activity, weak seven-day price performance and limited ETF inflows. Its upcoming ecosystem expansion represents an important development to monitor, while actual adoption and sustained network activity remain key indicators of progress.
#CryptoResearch #OnChainData #CryptoMarket #ETF #Blockchain

515

·
--
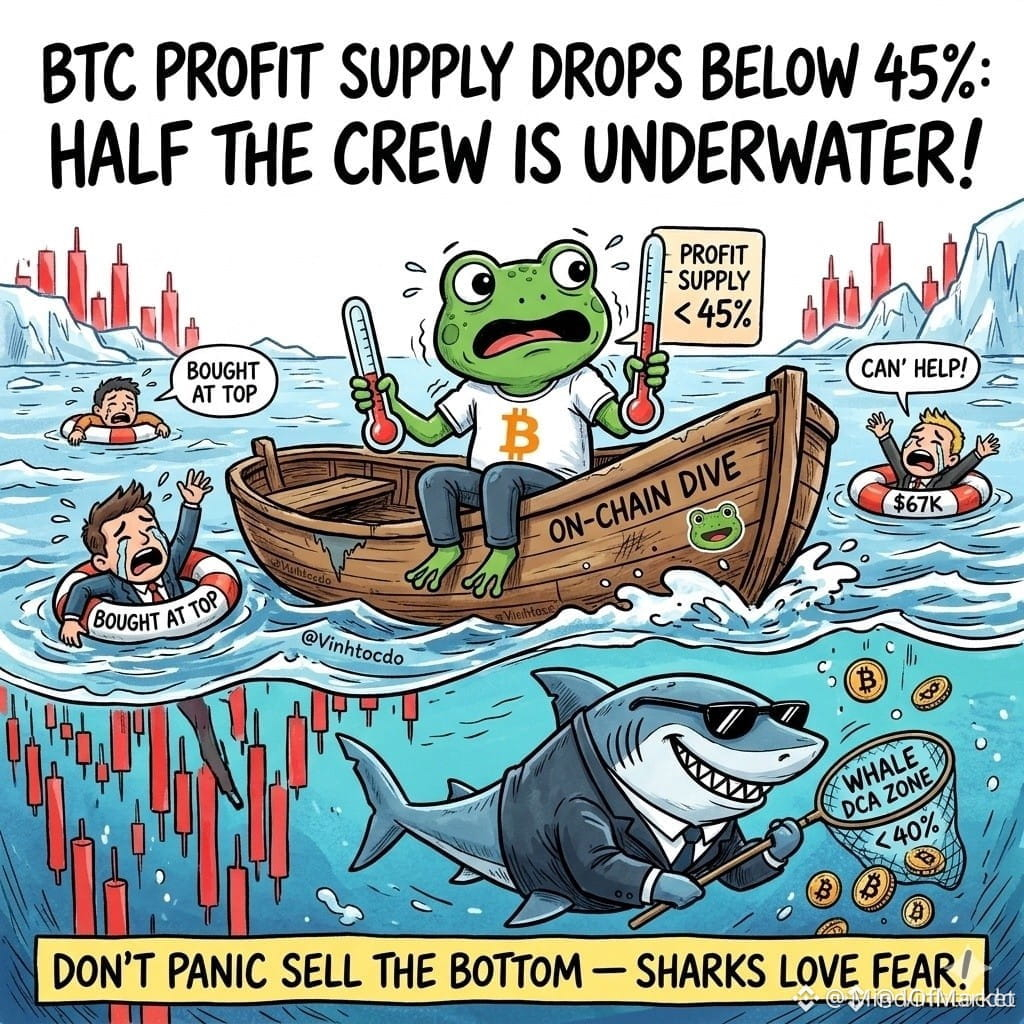
🦈 $BTC ACTIVE SUPPLY IN PROFIT DROPS BELOW 45% AS SMART MONEY ACCUMULATES
Entry: 67,000 ⚡
On-chain metrics reveal a severe flush as circulating $BTC in profit plunges beneath 45 percent during this retest of 67,000. Historically, this structural capitulation phase marks where institutional liquidity absorbs retail panic while leveraged participants exit at a loss.
Institutional positioning favors methodical dollar-cost averaging and disciplined cash preservation over aggressive margin exposure. 💬 Are you scaling into spot positions here or waiting for a deeper liquidity sweep?
⚠️ Not financial advice. Always manage your risk. 🛡️
🏷️ #BTC #OnChainData #CryptoMarket #BuyTheDip
💎
🦈 $BTC ACTIVE SUPPLY IN PROFIT DROPS BELOW 45% AS SMART MONEY ACCUMULATES
Entry: 67,000 ⚡
On-chain metrics reveal a severe flush as circulating $BTC in profit plunges beneath 45 percent during this retest of 67,000. Historically, this structural capitulation phase marks where institutional liquidity absorbs retail panic while leveraged participants exit at a loss.
Institutional positioning favors methodical dollar-cost averaging and disciplined cash preservation over aggressive margin exposure. 💬 Are you scaling into spot positions here or waiting for a deeper liquidity sweep?
⚠️ Not financial advice. Always manage your risk. 🛡️
🏷️ #BTC #OnChainData #CryptoMarket #BuyTheDip
💎
Entry: 67,000 ⚡
On-chain metrics reveal a severe flush as circulating $BTC in profit plunges beneath 45 percent during this retest of 67,000. Historically, this structural capitulation phase marks where institutional liquidity absorbs retail panic while leveraged participants exit at a loss.
Institutional positioning favors methodical dollar-cost averaging and disciplined cash preservation over aggressive margin exposure. 💬 Are you scaling into spot positions here or waiting for a deeper liquidity sweep?
⚠️ Not financial advice. Always manage your risk. 🛡️
🏷️ #BTC #OnChainData #CryptoMarket #BuyTheDip
💎
4

·
--
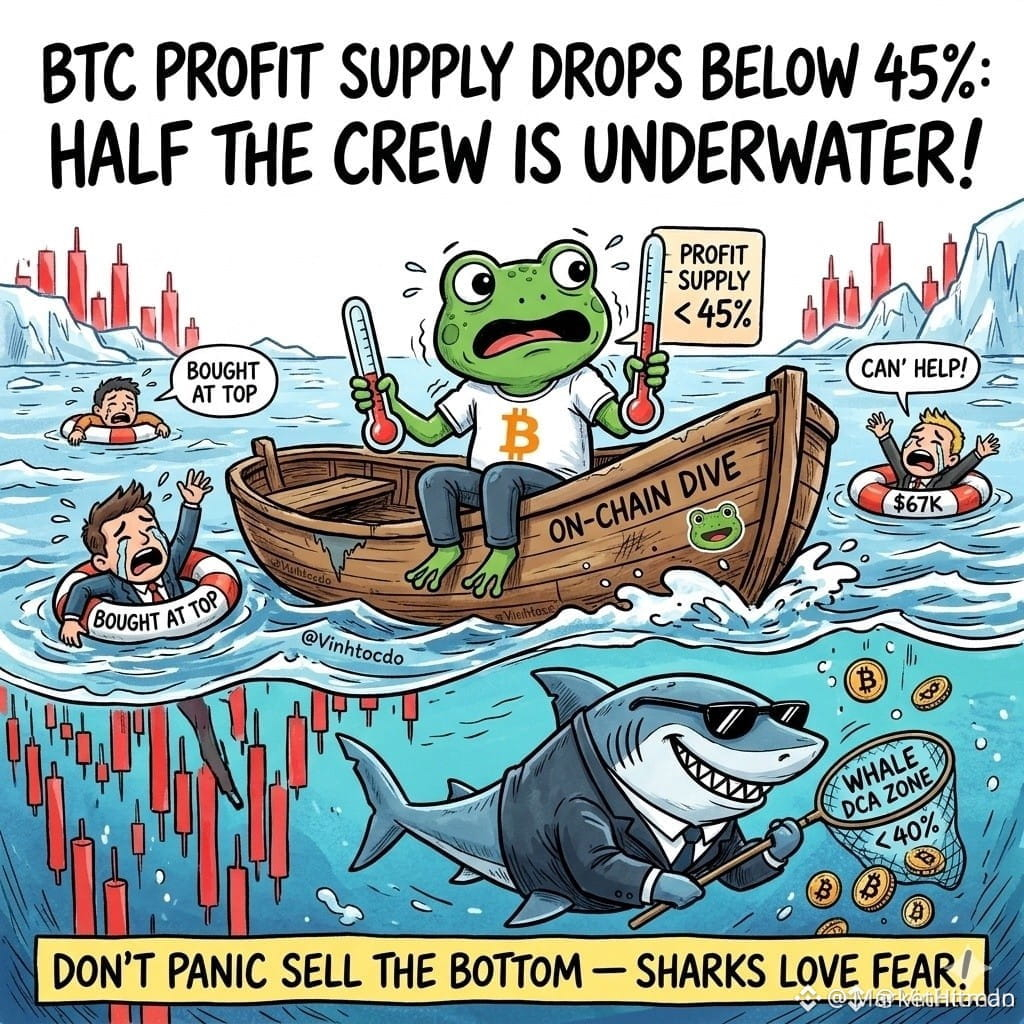
🦈 OVER 50% OF RECENT BUYERS ARE UNDERWATER AS $BTC TESTS THE 67,000 ZONE 📉
Entry: 67,000 ⚡
On-chain data reveals that the active supply in profit has cratered below forty-five percent as price sweeps back into major support. 📊 When retail hands start bleeding and surrender their bags in panic, institutional balance sheets quietly absorb the floating supply. 🦈
History shows these deep flushouts precede the real macro trend continuation, while aggressive leverage gets brutally wiped clean. ⚡ Instead of chasing emotions, scale in gradually through disciplined DCA and keep dry powder ready. 💬 Are you accumulating this discount or waiting for confirmation? 👇
⚠️ Not financial advice. Always manage your risk. 🛡️
🏷️ #BTC #OnChainData #Accumulation #CryptoMarket
🔥 💎
🦈 OVER 50% OF RECENT BUYERS ARE UNDERWATER AS $BTC TESTS THE 67,000 ZONE 📉
Entry: 67,000 ⚡
On-chain data reveals that the active supply in profit has cratered below forty-five percent as price sweeps back into major support. 📊 When retail hands start bleeding and surrender their bags in panic, institutional balance sheets quietly absorb the floating supply. 🦈
History shows these deep flushouts precede the real macro trend continuation, while aggressive leverage gets brutally wiped clean. ⚡ Instead of chasing emotions, scale in gradually through disciplined DCA and keep dry powder ready. 💬 Are you accumulating this discount or waiting for confirmation? 👇
⚠️ Not financial advice. Always manage your risk. 🛡️
🏷️ #BTC #OnChainData #Accumulation #CryptoMarket
🔥 💎
Entry: 67,000 ⚡
On-chain data reveals that the active supply in profit has cratered below forty-five percent as price sweeps back into major support. 📊 When retail hands start bleeding and surrender their bags in panic, institutional balance sheets quietly absorb the floating supply. 🦈
History shows these deep flushouts precede the real macro trend continuation, while aggressive leverage gets brutally wiped clean. ⚡ Instead of chasing emotions, scale in gradually through disciplined DCA and keep dry powder ready. 💬 Are you accumulating this discount or waiting for confirmation? 👇
⚠️ Not financial advice. Always manage your risk. 🛡️
🏷️ #BTC #OnChainData #Accumulation #CryptoMarket
🔥 💎
2

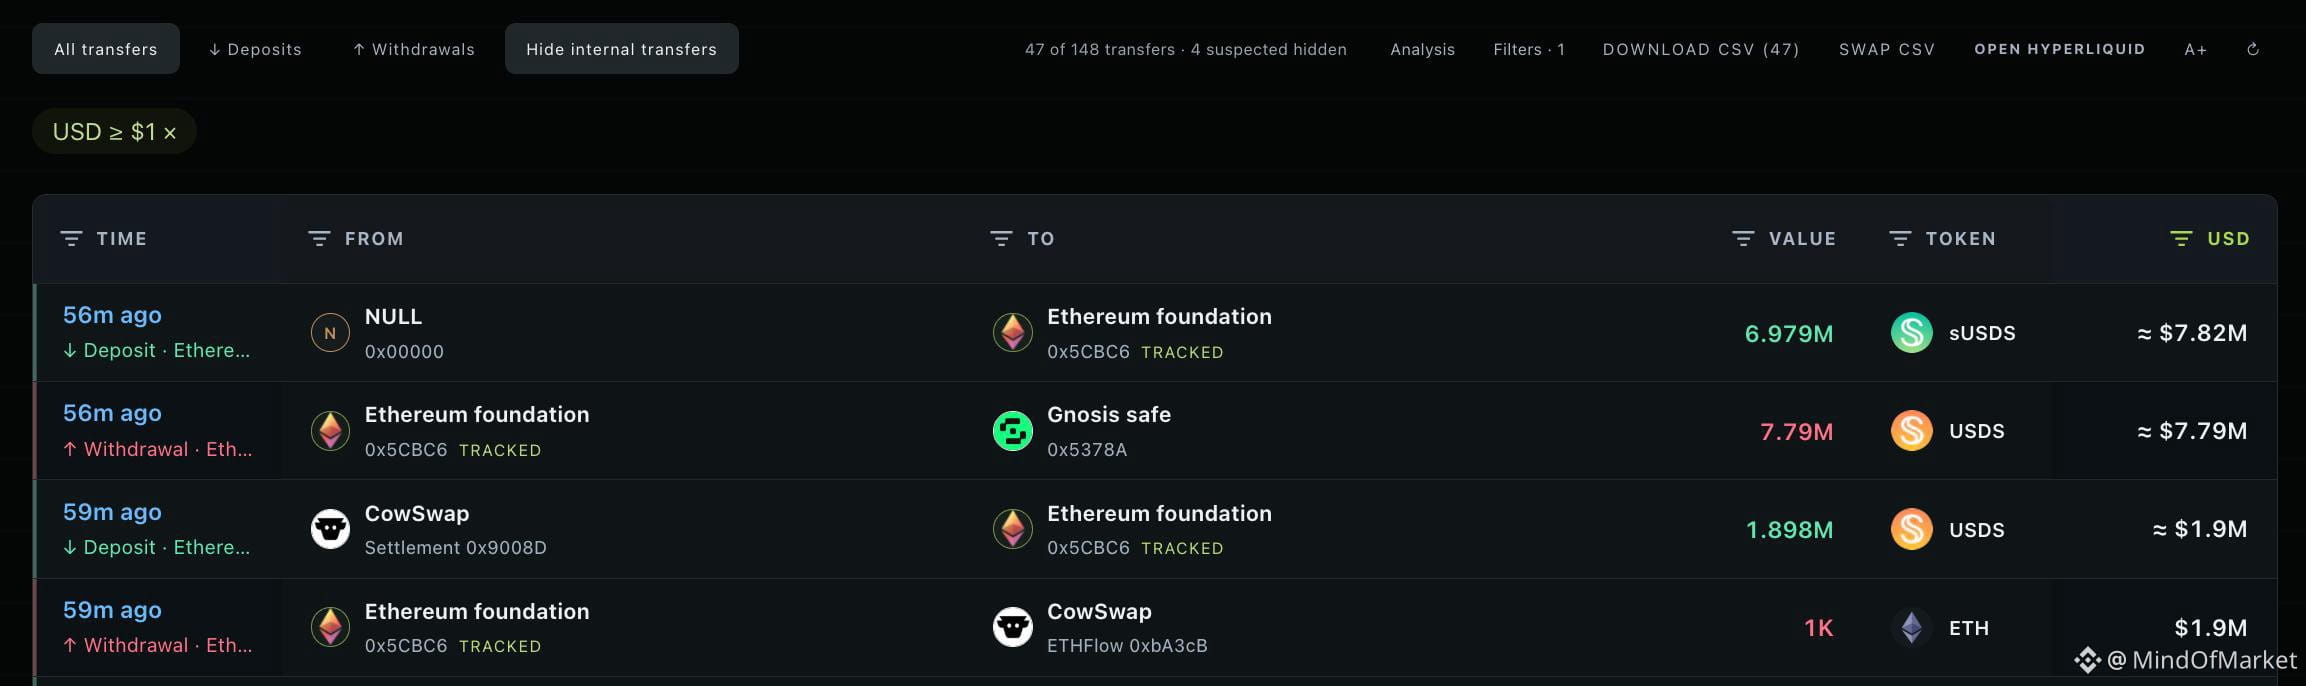
A tracked Ethereum address completed a 1,000 ETH swap into about 1.898 million USDS through CoW Protocol at 02:37 UTC on Nov. 14, according to the on-chain settlement record: https://etherscan.io/tx/0x67bd6e6a23fa2ed9abdd0df5b7ea88d6e7fb0c95d91117cc1b67f23ddc5a36fb
Onchain Lens describes the wallet as Ethereum Foundation-linked and reports 5,000 ETH swapped over four days; Ai 姨 separately identifies the same address and reports 7,785 ETH sold since Oct. 26. https://x.com/OnchainLens/status/2121448283654721935 · https://x.com/ai_9684xtpa/status/2121435306587246606
Important caveat: the Foundation connection and longer-period totals are third-party wallet-monitor attributions, not an official Ethereum Foundation statement. The 1,000 ETH swap itself is visible on-chain; one treasury transaction alone does not establish broader policy or predict ETH’s next move. Which would you watch next: further wallet flows or an official explanation?
Conclusion: The swap is confirmed on-chain, while wallet attribution and market impact should be read cautiously. $ETH Official Binance Spot chart: https://binance.bnstatic.com/en/trade/ETH_USDT?type=spot. Check the chart for yourself, do your own research, and trade responsibly. #Ethereum #ETH #OnchainData #CryptoTreasury
A tracked Ethereum address completed a 1,000 ETH swap into about 1.898 million USDS through CoW Protocol at 02:37 UTC on Nov. 14, according to the on-chain settlement record: https://etherscan.io/tx/0x67bd6e6a23fa2ed9abdd0df5b7ea88d6e7fb0c95d91117cc1b67f23ddc5a36fb
Onchain Lens describes the wallet as Ethereum Foundation-linked and reports 5,000 ETH swapped over four days; Ai 姨 separately identifies the same address and reports 7,785 ETH sold since Oct. 26. https://x.com/OnchainLens/status/2121448283654721935 · https://x.com/ai_9684xtpa/status/2121435306587246606
Important caveat: the Foundation connection and longer-period totals are third-party wallet-monitor attributions, not an official Ethereum Foundation statement. The 1,000 ETH swap itself is visible on-chain; one treasury transaction alone does not establish broader policy or predict ETH’s next move. Which would you watch next: further wallet flows or an official explanation?
Conclusion: The swap is confirmed on-chain, while wallet attribution and market impact should be read cautiously. $ETH Official Binance Spot chart: https://binance.bnstatic.com/en/trade/ETH_USDT?type=spot. Check the chart for yourself, do your own research, and trade responsibly. #Ethereum #ETH #OnchainData #CryptoTreasury
Onchain Lens describes the wallet as Ethereum Foundation-linked and reports 5,000 ETH swapped over four days; Ai 姨 separately identifies the same address and reports 7,785 ETH sold since Oct. 26. https://x.com/OnchainLens/status/2121448283654721935 · https://x.com/ai_9684xtpa/status/2121435306587246606
Important caveat: the Foundation connection and longer-period totals are third-party wallet-monitor attributions, not an official Ethereum Foundation statement. The 1,000 ETH swap itself is visible on-chain; one treasury transaction alone does not establish broader policy or predict ETH’s next move. Which would you watch next: further wallet flows or an official explanation?
Conclusion: The swap is confirmed on-chain, while wallet attribution and market impact should be read cautiously. $ETH Official Binance Spot chart: https://binance.bnstatic.com/en/trade/ETH_USDT?type=spot. Check the chart for yourself, do your own research, and trade responsibly. #Ethereum #ETH #OnchainData #CryptoTreasury

83
·
--
🚨 INSTITUTIONAL TREASURY FLOWS: $ETH FOUNDATION OFFLOADS ANOTHER BATCH OF ASSETS!
The institutional footprint shows the foundation continuing its systematic treasury distribution, offloading another one thousand units through decentralized execution routes. 📊 Over the past four days, cumulative distribution has reached five thousand tokens, aggressively cycling capital into stable assets and multisig architecture.
When heavy stakeholders adjust balance sheet composition like this, smart money reads it as structural positioning for upcoming operational expenditures. How does this heavy foundation selling alter your perspective on near-term spot accumulation dynamics? 👇
⚠️ Not financial advice. Always manage your risk. 🛡️
🏷️ #ETH #SmartMoney #OnChainData #Crypto
🔥 💎
🚨 INSTITUTIONAL TREASURY FLOWS: $ETH FOUNDATION OFFLOADS ANOTHER BATCH OF ASSETS!
The institutional footprint shows the foundation continuing its systematic treasury distribution, offloading another one thousand units through decentralized execution routes. 📊 Over the past four days, cumulative distribution has reached five thousand tokens, aggressively cycling capital into stable assets and multisig architecture.
When heavy stakeholders adjust balance sheet composition like this, smart money reads it as structural positioning for upcoming operational expenditures. How does this heavy foundation selling alter your perspective on near-term spot accumulation dynamics? 👇
⚠️ Not financial advice. Always manage your risk. 🛡️
🏷️ #ETH #SmartMoney #OnChainData #Crypto
🔥 💎
The institutional footprint shows the foundation continuing its systematic treasury distribution, offloading another one thousand units through decentralized execution routes. 📊 Over the past four days, cumulative distribution has reached five thousand tokens, aggressively cycling capital into stable assets and multisig architecture.
When heavy stakeholders adjust balance sheet composition like this, smart money reads it as structural positioning for upcoming operational expenditures. How does this heavy foundation selling alter your perspective on near-term spot accumulation dynamics? 👇
⚠️ Not financial advice. Always manage your risk. 🛡️
🏷️ #ETH #SmartMoney #OnChainData #Crypto
🔥 💎
14

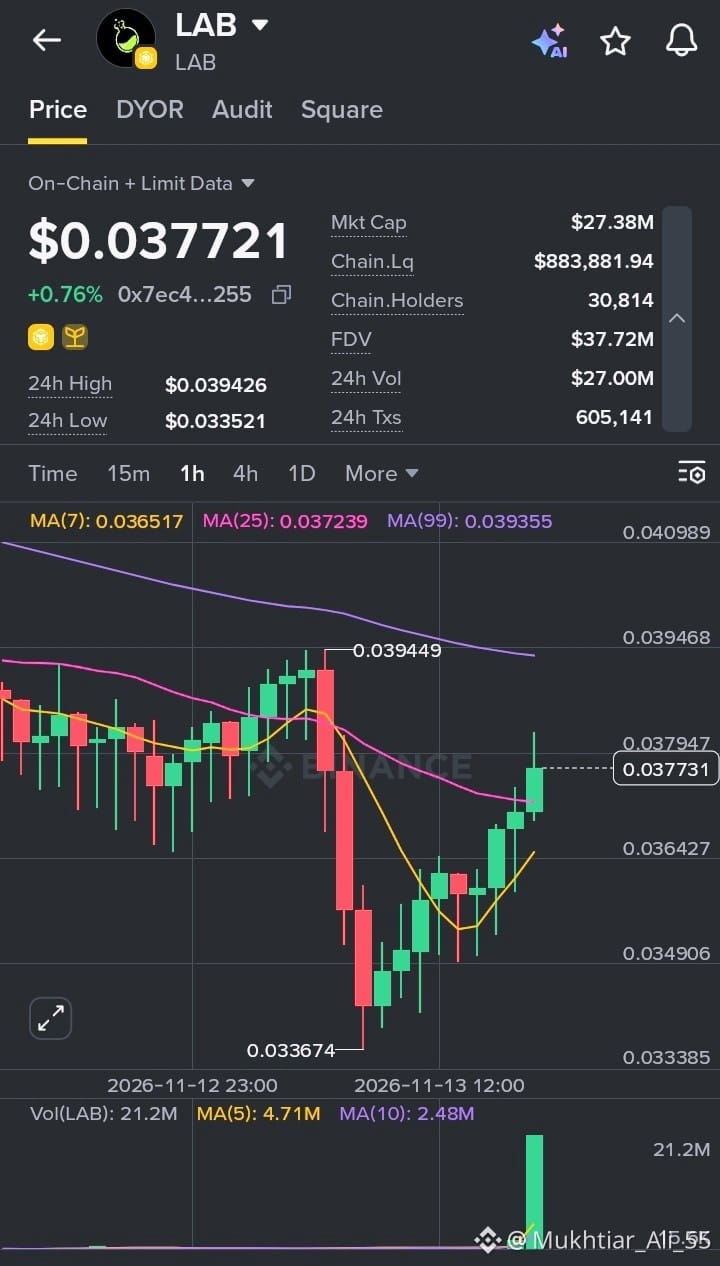
LAB Climbs Back After a Sharp Drop, and Volume Just Exploded
LAB is trading at $0.037721, up 0.76% on the day. The small percentage hides a much more interesting session underneath.
Over the last 24 hours price ranged from a low of $0.033521 to a high of $0.039426. On the 1h chart, LAB held a steady range before a heavy red candle pushed it down to around $0.0337. Since then it has recovered with a clean run of higher lows and green candles, and the latest one has pushed back above the MA(25) at 0.037239 and the MA(7) at 0.036517. The MA(99) at 0.039355 is the next big level overhead.
What the data shows:
Volume spike: the latest hourly candle printed around 21.2M in volume, far above the MA(5) of 4.71M. That kind of surge usually signals a real shift in interest, though it can cut both ways.
Heavy trading activity: 24h volume of $27.00M against a $27.38M market cap, with 605,141 transactions.
Thin liquidity: on-chain liquidity sits at $883,881.94, so price can move fast on relatively small orders.
Holder base: 30,814 on-chain holders, much smaller than larger community tokens, which adds to volatility.
FDV: $37.72M versus a $27.38M market cap, so supply dynamics are worth tracking.
My take: the recovery looks constructive, and reclaiming the short-term averages on strong volume is a good sign. But the price is still below the MA(99), and one big volume candle doesn’t make a trend. I’m watching whether it can hold above 0.0372 and then challenge the 0.0394 area. A failure to hold the moving averages would put the 0.0336 low back in play.
#LAB #CryptoAnalysis #BinanceSquare #AltcoinWatch #OnChainData
$LAB
{future}(LABUSDT)
LAB Climbs Back After a Sharp Drop, and Volume Just Exploded
LAB is trading at $0.037721, up 0.76% on the day. The small percentage hides a much more interesting session underneath.
Over the last 24 hours price ranged from a low of $0.033521 to a high of $0.039426. On the 1h chart, LAB held a steady range before a heavy red candle pushed it down to around $0.0337. Since then it has recovered with a clean run of higher lows and green candles, and the latest one has pushed back above the MA(25) at 0.037239 and the MA(7) at 0.036517. The MA(99) at 0.039355 is the next big level overhead.
What the data shows:
Volume spike: the latest hourly candle printed around 21.2M in volume, far above the MA(5) of 4.71M. That kind of surge usually signals a real shift in interest, though it can cut both ways.
Heavy trading activity: 24h volume of $27.00M against a $27.38M market cap, with 605,141 transactions.
Thin liquidity: on-chain liquidity sits at $883,881.94, so price can move fast on relatively small orders.
Holder base: 30,814 on-chain holders, much smaller than larger community tokens, which adds to volatility.
FDV: $37.72M versus a $27.38M market cap, so supply dynamics are worth tracking.
My take: the recovery looks constructive, and reclaiming the short-term averages on strong volume is a good sign. But the price is still below the MA(99), and one big volume candle doesn’t make a trend. I’m watching whether it can hold above 0.0372 and then challenge the 0.0394 area. A failure to hold the moving averages would put the 0.0336 low back in play.
#LAB #CryptoAnalysis #BinanceSquare #AltcoinWatch #OnChainData
$LAB
LAB is trading at $0.037721, up 0.76% on the day. The small percentage hides a much more interesting session underneath.
Over the last 24 hours price ranged from a low of $0.033521 to a high of $0.039426. On the 1h chart, LAB held a steady range before a heavy red candle pushed it down to around $0.0337. Since then it has recovered with a clean run of higher lows and green candles, and the latest one has pushed back above the MA(25) at 0.037239 and the MA(7) at 0.036517. The MA(99) at 0.039355 is the next big level overhead.
What the data shows:
Volume spike: the latest hourly candle printed around 21.2M in volume, far above the MA(5) of 4.71M. That kind of surge usually signals a real shift in interest, though it can cut both ways.
Heavy trading activity: 24h volume of $27.00M against a $27.38M market cap, with 605,141 transactions.
Thin liquidity: on-chain liquidity sits at $883,881.94, so price can move fast on relatively small orders.
Holder base: 30,814 on-chain holders, much smaller than larger community tokens, which adds to volatility.
FDV: $37.72M versus a $27.38M market cap, so supply dynamics are worth tracking.
My take: the recovery looks constructive, and reclaiming the short-term averages on strong volume is a good sign. But the price is still below the MA(99), and one big volume candle doesn’t make a trend. I’m watching whether it can hold above 0.0372 and then challenge the 0.0394 area. A failure to hold the moving averages would put the 0.0336 low back in play.
#LAB #CryptoAnalysis #BinanceSquare #AltcoinWatch #OnChainData
$LAB
1
41

🚨 $BNB ECOSYSTEM ONCHAIN LIQUIDITY SHIELDED AS AUTHORITIES RECOVER BILLIONS 💥
Onchain transparency is proving to be a double-edged sword for bad actors as law enforcement claws back billions in compromised funds. 🌊 Speed matters in crypto, and rapid cross-chain tracking is shutting down escape routes through privacy mixers and bridges faster than ever before. 📊
Meanwhile, social engineering vectors are evolving with deepfake video calls targeting unsuspecting participants in the space. 💡 Security is our primary alpha, so verify every interaction before deploying capital. 🔍 Are you tightening your personal operational security protocols after these recent exploits? 👇
⚠️ Not financial advice. Always manage your risk. 🛡️
🏷️ #BNB #CryptoSecurity #OnchainData #Web3
🔥 💎
🚨 $BNB ECOSYSTEM ONCHAIN LIQUIDITY SHIELDED AS AUTHORITIES RECOVER BILLIONS 💥
Onchain transparency is proving to be a double-edged sword for bad actors as law enforcement claws back billions in compromised funds. 🌊 Speed matters in crypto, and rapid cross-chain tracking is shutting down escape routes through privacy mixers and bridges faster than ever before. 📊
Meanwhile, social engineering vectors are evolving with deepfake video calls targeting unsuspecting participants in the space. 💡 Security is our primary alpha, so verify every interaction before deploying capital. 🔍 Are you tightening your personal operational security protocols after these recent exploits? 👇
⚠️ Not financial advice. Always manage your risk. 🛡️
🏷️ #BNB #CryptoSecurity #OnchainData #Web3
🔥 💎
Onchain transparency is proving to be a double-edged sword for bad actors as law enforcement claws back billions in compromised funds. 🌊 Speed matters in crypto, and rapid cross-chain tracking is shutting down escape routes through privacy mixers and bridges faster than ever before. 📊
Meanwhile, social engineering vectors are evolving with deepfake video calls targeting unsuspecting participants in the space. 💡 Security is our primary alpha, so verify every interaction before deploying capital. 🔍 Are you tightening your personal operational security protocols after these recent exploits? 👇
⚠️ Not financial advice. Always manage your risk. 🛡️
🏷️ #BNB #CryptoSecurity #OnchainData #Web3
🔥 💎

9
·
--
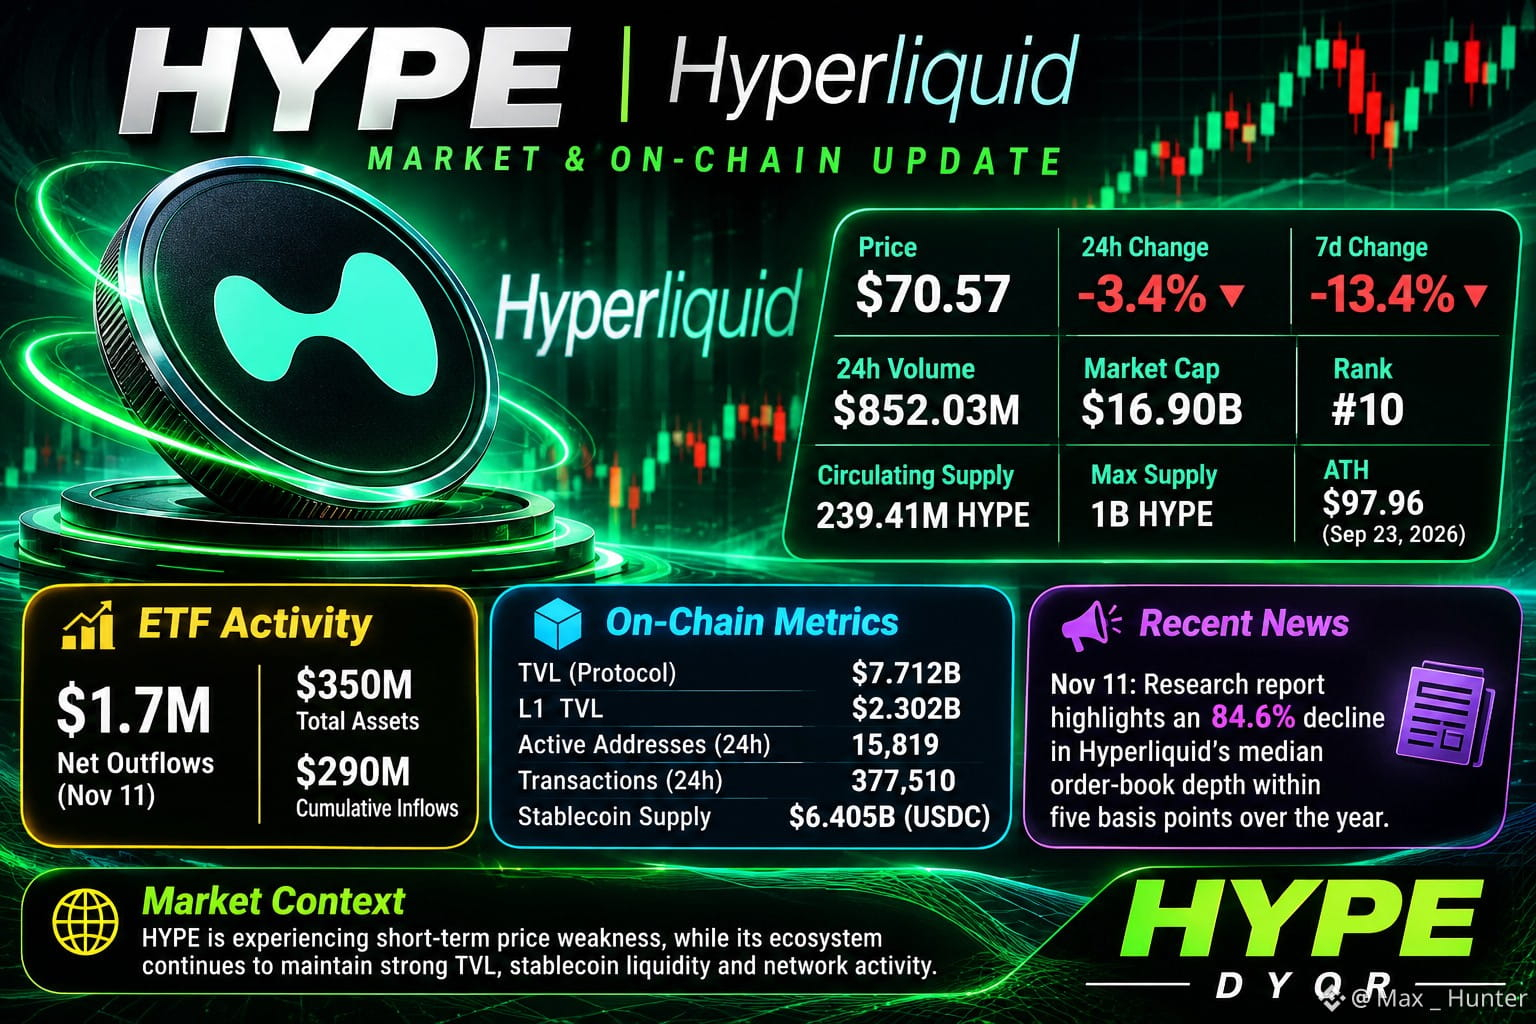
$HYPE (Hyperliquid) | Complete Market & On-Chain Research Update
Assuming you mean HYPE (Hyperliquid), not HPYE.
Market Overview (November 12, 2026)
* Price: $70.57
* 24-hour change: -3.4%
* 7-day change: -13.4%
* 24-hour volume: $852.03M
* Market cap: $16.90B
* Market ranking: #10
* Circulating supply: 239.41M HYPE
* Maximum supply: 1 billion HYPE
* ATH: $97.96 (September 23, 2026). Block Insider +1
ETF Activity
Hyperliquid spot ETFs recorded approximately $1.7M in net outflows on November 11. Their combined reported net assets were approximately $350M, with cumulative net inflows around $290M. Crypto ETF
On-Chain Metrics
According to DeFiLlama:
* Protocol TVL: $7.712B
* Hyperliquid L1 TVL: $2.302B
* Active addresses (24h): 15,819
* Transactions (24h): 377,510
* Stablecoin supply: approximately $6.405B, predominantly USDC. DefiLlama +2
Recent Developments
A November 11 research report highlighted an 84.6% decline in Hyperliquid's median order-book depth within five basis points over the year to November 1, raising questions about liquidity conditions. COINOTAG
Market Context
HYPE is experiencing short-term price weakness, while its ecosystem continues to maintain substantial TVL, stablecoin liquidity and network activity. Protocol TVL has declined approximately 9.9% over 30 days, indicating a changing capital environment. DefiLlama +1
Overall, HYPE currently reflects a combination of significant ecosystem activity, ETF participation and reduced short-term market liquidity. DYOR.
#Hyperliquid #DeFi #CryptoResearch #OnChainData #CryptoMarket
$HYPE (Hyperliquid) | Complete Market & On-Chain Research Update
Assuming you mean HYPE (Hyperliquid), not HPYE.
Market Overview (November 12, 2026)
* Price: $70.57
* 24-hour change: -3.4%
* 7-day change: -13.4%
* 24-hour volume: $852.03M
* Market cap: $16.90B
* Market ranking: #10
* Circulating supply: 239.41M HYPE
* Maximum supply: 1 billion HYPE
* ATH: $97.96 (September 23, 2026). Block Insider +1
ETF Activity
Hyperliquid spot ETFs recorded approximately $1.7M in net outflows on November 11. Their combined reported net assets were approximately $350M, with cumulative net inflows around $290M. Crypto ETF
On-Chain Metrics
According to DeFiLlama:
* Protocol TVL: $7.712B
* Hyperliquid L1 TVL: $2.302B
* Active addresses (24h): 15,819
* Transactions (24h): 377,510
* Stablecoin supply: approximately $6.405B, predominantly USDC. DefiLlama +2
Recent Developments
A November 11 research report highlighted an 84.6% decline in Hyperliquid's median order-book depth within five basis points over the year to November 1, raising questions about liquidity conditions. COINOTAG
Market Context
HYPE is experiencing short-term price weakness, while its ecosystem continues to maintain substantial TVL, stablecoin liquidity and network activity. Protocol TVL has declined approximately 9.9% over 30 days, indicating a changing capital environment. DefiLlama +1
Overall, HYPE currently reflects a combination of significant ecosystem activity, ETF participation and reduced short-term market liquidity. DYOR.
#Hyperliquid #DeFi #CryptoResearch #OnChainData #CryptoMarket
Assuming you mean HYPE (Hyperliquid), not HPYE.
Market Overview (November 12, 2026)
* Price: $70.57
* 24-hour change: -3.4%
* 7-day change: -13.4%
* 24-hour volume: $852.03M
* Market cap: $16.90B
* Market ranking: #10
* Circulating supply: 239.41M HYPE
* Maximum supply: 1 billion HYPE
* ATH: $97.96 (September 23, 2026). Block Insider +1
ETF Activity
Hyperliquid spot ETFs recorded approximately $1.7M in net outflows on November 11. Their combined reported net assets were approximately $350M, with cumulative net inflows around $290M. Crypto ETF
On-Chain Metrics
According to DeFiLlama:
* Protocol TVL: $7.712B
* Hyperliquid L1 TVL: $2.302B
* Active addresses (24h): 15,819
* Transactions (24h): 377,510
* Stablecoin supply: approximately $6.405B, predominantly USDC. DefiLlama +2
Recent Developments
A November 11 research report highlighted an 84.6% decline in Hyperliquid's median order-book depth within five basis points over the year to November 1, raising questions about liquidity conditions. COINOTAG
Market Context
HYPE is experiencing short-term price weakness, while its ecosystem continues to maintain substantial TVL, stablecoin liquidity and network activity. Protocol TVL has declined approximately 9.9% over 30 days, indicating a changing capital environment. DefiLlama +1
Overall, HYPE currently reflects a combination of significant ecosystem activity, ETF participation and reduced short-term market liquidity. DYOR.
#Hyperliquid #DeFi #CryptoResearch #OnChainData #CryptoMarket
233
·
--
$HYPE (Hyperliquid) | Comprehensive Market & On-Chain Research — 12 November 2026
Market Overview: HYPE is trading around $72.00, with approximately +0.05% 24-hour performance and a 24-hour volume of $984.1 million. Its market capitalization is approximately $18.21 billion, ranking it #9 among cryptocurrencies. The 7-day performance is approximately -6.7%. Circulating supply stands at 252.9 million HYPE against a maximum supply of approximately 949.9 million. FDV is around $68.39 billion. CoinMarketCap +1
ETF Activity: Three US spot products from Grayscale, Bitwise and 21Shares provide institutional exposure to HYPE. Their combined assets are approximately $359 million. Available ETF flow tracking estimates around $1.7 million in net outflows on November 11, although reporting feeds differ. The Block +1
On-Chain Metrics: According to DeFiLlama's November 11 data, Hyperliquid L1 recorded approximately $2.35 billion in DeFi TVL, $6.405 billion in stablecoin supply, 21,561 active addresses and 449,724 daily transactions. USDC represents approximately 98.7% of stablecoin supply. Daily perpetuals volume reached $10.14 billion, while DEX volume was approximately $236.4 million. Broader protocol TVL was approximately $7.71 billion on November 12. DefiLlama +2
Recent Developments: Upbit introduced HYPE markets against KRW, BTC and USDT on November 10. Bitso also integrated access to more than 200 Hyperliquid perpetual markets through its Alpha platform. UnderHyper +1
Market Context: HYPE's recent weekly price performance remains negative, while perpetuals activity continues at substantial levels. However, stablecoin supply declined 3.22% over seven days, indicating a contraction in available on-chain liquidity. These figures reflect mixed market and network conditions rather than a single directional trend. DefiLlama +1
#HYPE #Hyperliquid #CryptoResearch #DeFi #OnChainData #CryptoMarket
$HYPE (Hyperliquid) | Comprehensive Market & On-Chain Research — 12 November 2026
Market Overview: HYPE is trading around $72.00, with approximately +0.05% 24-hour performance and a 24-hour volume of $984.1 million. Its market capitalization is approximately $18.21 billion, ranking it #9 among cryptocurrencies. The 7-day performance is approximately -6.7%. Circulating supply stands at 252.9 million HYPE against a maximum supply of approximately 949.9 million. FDV is around $68.39 billion. CoinMarketCap +1
ETF Activity: Three US spot products from Grayscale, Bitwise and 21Shares provide institutional exposure to HYPE. Their combined assets are approximately $359 million. Available ETF flow tracking estimates around $1.7 million in net outflows on November 11, although reporting feeds differ. The Block +1
On-Chain Metrics: According to DeFiLlama's November 11 data, Hyperliquid L1 recorded approximately $2.35 billion in DeFi TVL, $6.405 billion in stablecoin supply, 21,561 active addresses and 449,724 daily transactions. USDC represents approximately 98.7% of stablecoin supply. Daily perpetuals volume reached $10.14 billion, while DEX volume was approximately $236.4 million. Broader protocol TVL was approximately $7.71 billion on November 12. DefiLlama +2
Recent Developments: Upbit introduced HYPE markets against KRW, BTC and USDT on November 10. Bitso also integrated access to more than 200 Hyperliquid perpetual markets through its Alpha platform. UnderHyper +1
Market Context: HYPE's recent weekly price performance remains negative, while perpetuals activity continues at substantial levels. However, stablecoin supply declined 3.22% over seven days, indicating a contraction in available on-chain liquidity. These figures reflect mixed market and network conditions rather than a single directional trend. DefiLlama +1
#HYPE #Hyperliquid #CryptoResearch #DeFi #OnChainData #CryptoMarket
Market Overview: HYPE is trading around $72.00, with approximately +0.05% 24-hour performance and a 24-hour volume of $984.1 million. Its market capitalization is approximately $18.21 billion, ranking it #9 among cryptocurrencies. The 7-day performance is approximately -6.7%. Circulating supply stands at 252.9 million HYPE against a maximum supply of approximately 949.9 million. FDV is around $68.39 billion. CoinMarketCap +1
ETF Activity: Three US spot products from Grayscale, Bitwise and 21Shares provide institutional exposure to HYPE. Their combined assets are approximately $359 million. Available ETF flow tracking estimates around $1.7 million in net outflows on November 11, although reporting feeds differ. The Block +1
On-Chain Metrics: According to DeFiLlama's November 11 data, Hyperliquid L1 recorded approximately $2.35 billion in DeFi TVL, $6.405 billion in stablecoin supply, 21,561 active addresses and 449,724 daily transactions. USDC represents approximately 98.7% of stablecoin supply. Daily perpetuals volume reached $10.14 billion, while DEX volume was approximately $236.4 million. Broader protocol TVL was approximately $7.71 billion on November 12. DefiLlama +2
Recent Developments: Upbit introduced HYPE markets against KRW, BTC and USDT on November 10. Bitso also integrated access to more than 200 Hyperliquid perpetual markets through its Alpha platform. UnderHyper +1
Market Context: HYPE's recent weekly price performance remains negative, while perpetuals activity continues at substantial levels. However, stablecoin supply declined 3.22% over seven days, indicating a contraction in available on-chain liquidity. These figures reflect mixed market and network conditions rather than a single directional trend. DefiLlama +1
#HYPE #Hyperliquid #CryptoResearch #DeFi #OnChainData #CryptoMarket
124
·
--
🦈 CRITICAL EXCHANGE RESERVE DATA REVEALS A MASSIVE $SHIB LIQUIDITY BASELINE! 📊
On-chain analytics via CryptoQuant highlight a fascinating structural footprint with roughly 86.04 trillion units resting on exchange order books, holding a valuation near $382.87 million. 📊
With overall market depth remaining relatively thin, the $380 million valuation zone is establishing itself as a critical baseline for institutional positioning and order flow absorption. ⚡
Monitoring how smart money interacts with this concentration will dictate the next major directional expansion. 🔍 Are you tracking exchange reserve shifts or waiting for a structural breakout confirmation? 👇
⚠️ Not financial advice. Always manage your risk. 🛡️
🏷️ #SHIB #SmartMoney #OnChainData #CryptoAnalysis
🦈 ⚖️
🦈 CRITICAL EXCHANGE RESERVE DATA REVEALS A MASSIVE $SHIB LIQUIDITY BASELINE! 📊
On-chain analytics via CryptoQuant highlight a fascinating structural footprint with roughly 86.04 trillion units resting on exchange order books, holding a valuation near $382.87 million. 📊
With overall market depth remaining relatively thin, the $380 million valuation zone is establishing itself as a critical baseline for institutional positioning and order flow absorption. ⚡
Monitoring how smart money interacts with this concentration will dictate the next major directional expansion. 🔍 Are you tracking exchange reserve shifts or waiting for a structural breakout confirmation? 👇
⚠️ Not financial advice. Always manage your risk. 🛡️
🏷️ #SHIB #SmartMoney #OnChainData #CryptoAnalysis
🦈 ⚖️
On-chain analytics via CryptoQuant highlight a fascinating structural footprint with roughly 86.04 trillion units resting on exchange order books, holding a valuation near $382.87 million. 📊
With overall market depth remaining relatively thin, the $380 million valuation zone is establishing itself as a critical baseline for institutional positioning and order flow absorption. ⚡
Monitoring how smart money interacts with this concentration will dictate the next major directional expansion. 🔍 Are you tracking exchange reserve shifts or waiting for a structural breakout confirmation? 👇
⚠️ Not financial advice. Always manage your risk. 🛡️
🏷️ #SHIB #SmartMoney #OnChainData #CryptoAnalysis
🦈 ⚖️
16

·
--
Bearish
📉🐕 SHIB WHALES ARE MOVING MILLIONS OFF EXCHANGES… BUT THE PRICE DIDN'T GET THE MEMO. 💀
While SHIB holders are waiting for a comeback, whale wallets are making moves.
Here's what the data shows:
🐋 $27.3 MILLION in SHIB withdrawn from exchanges over 7 days.
🔻 Only $2.1 MILLION deposited.
💰 That's approximately $25.3 MILLION NET OUTFLOW, across 22 tracked Ethereum whale wallets.
Sounds bullish? Hold that victory dance. 😂
There's a catch…
Exchange withdrawals can reduce immediately available selling supply, but they don't automatically prove fresh buying or guarantee a price rally.
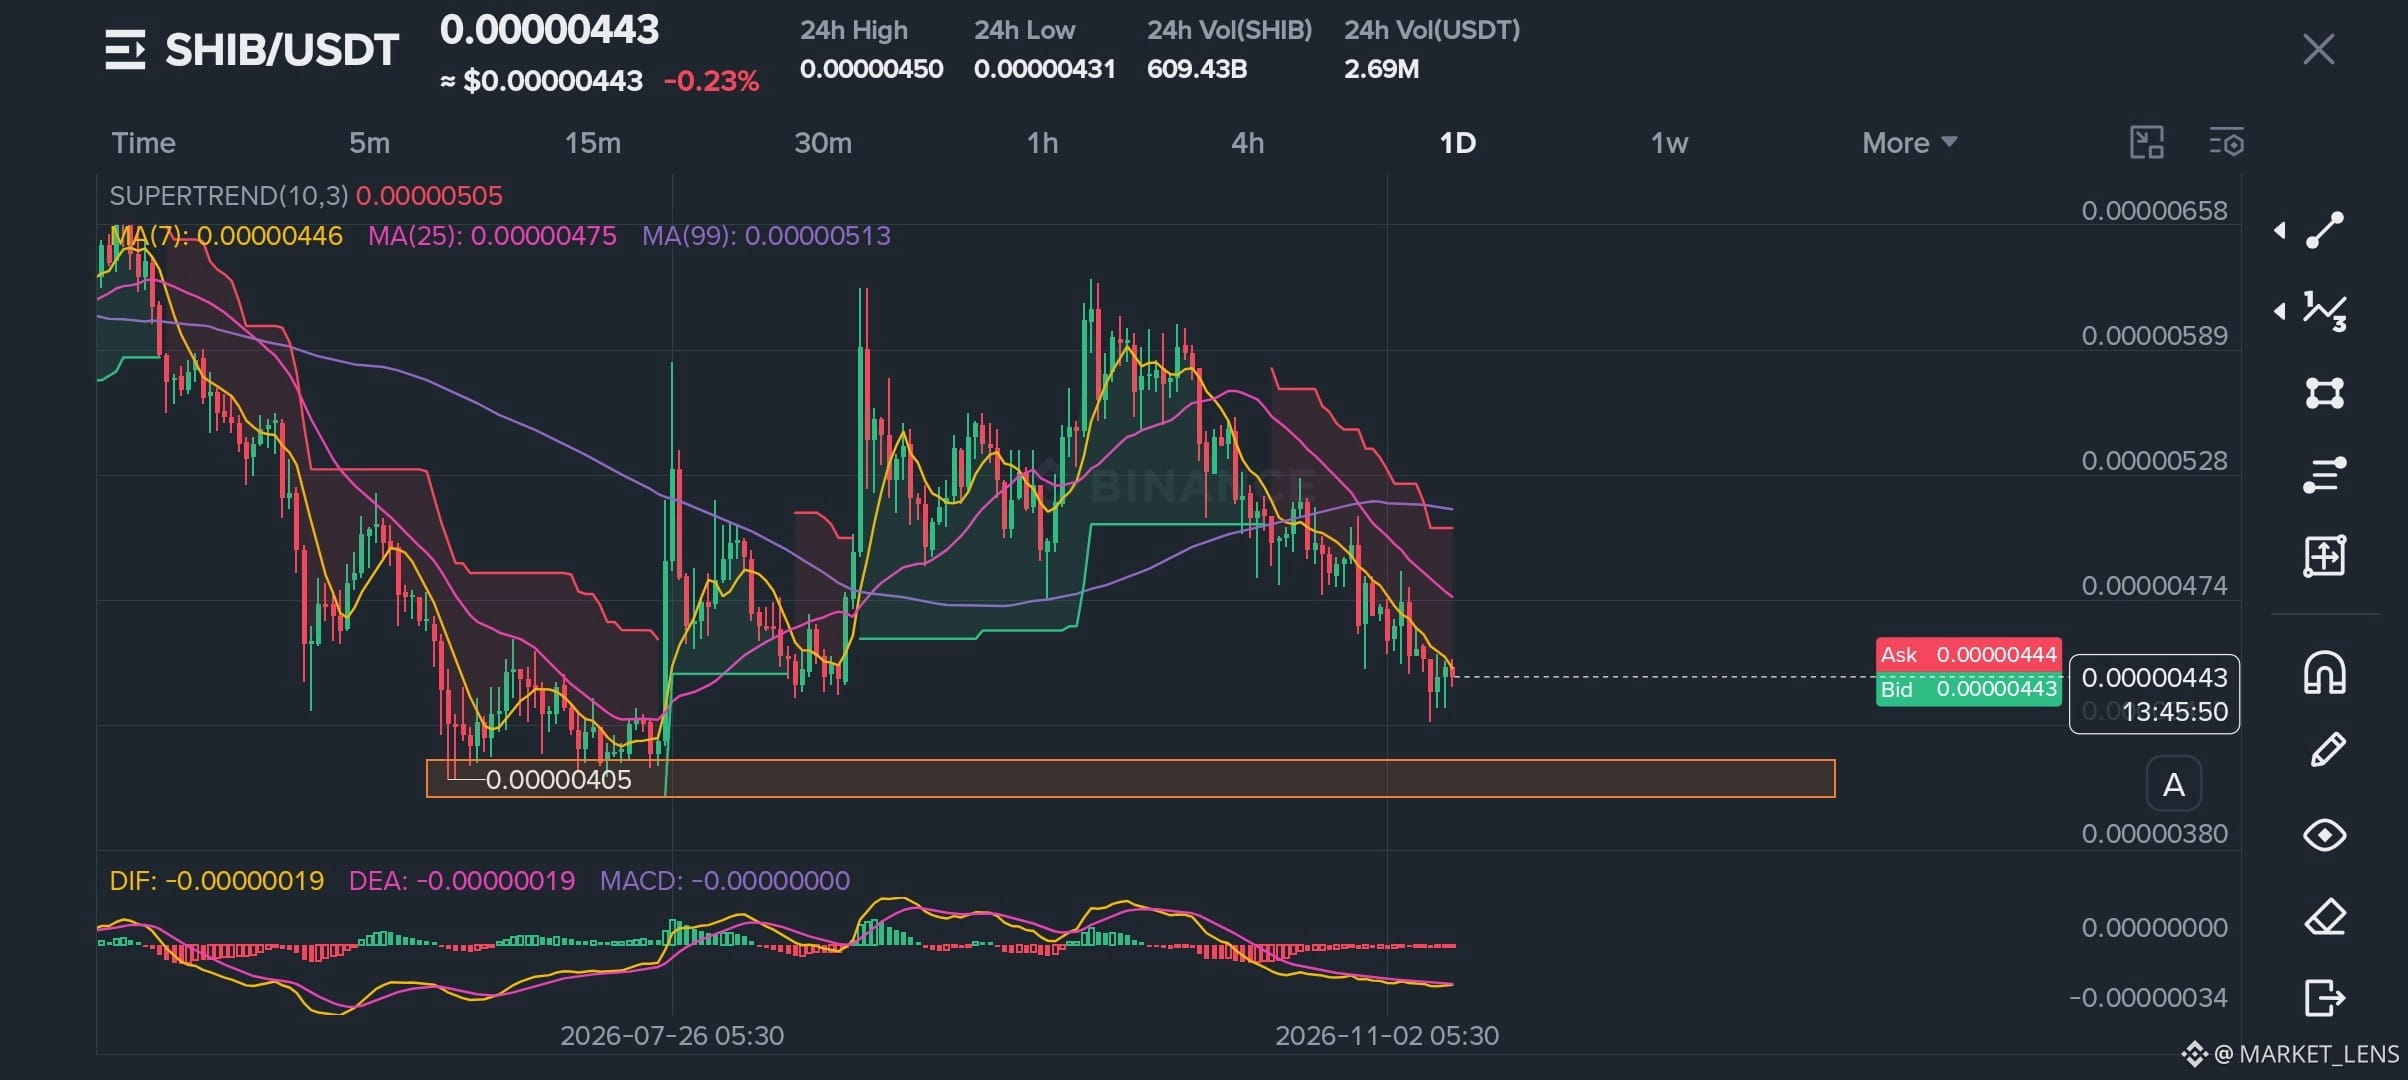
And SHIB's daily chart isn't exactly celebrating:
📉 Price: $0.00000443 (chart snapshot)
🔹 MA(7): $0.00000446
🔹 MA(25): $0.00000475
🔹 MA(99): $0.00000513
🔹 Supertrend: $0.00000505
THE LEVELS TO WATCH:
🟢 Bulls need to reclaim $0.00000475 first. The $0.00000505–$0.00000513 area is the next major hurdle.
🔴 Below $0.00000431, the marked $0.00000398–$0.00000415 demand zone comes into focus.
MARKETLENS TAKE: Whale withdrawals are interesting, but the daily trend remains bearish. Until price confirms a recovery, don't confuse wallet movements with a guaranteed pump.
👇 Your take:
Are SHIB whales quietly accumulating… or just moving their bags somewhere safer? 😂
#MarketLens #SHIB #ShibaInu #onchaindata #cryptotrading
$SHIB
{spot}(SHIBUSDT)
📉🐕 SHIB WHALES ARE MOVING MILLIONS OFF EXCHANGES… BUT THE PRICE DIDN'T GET THE MEMO. 💀
While SHIB holders are waiting for a comeback, whale wallets are making moves.
Here's what the data shows:
🐋 $27.3 MILLION in SHIB withdrawn from exchanges over 7 days.
🔻 Only $2.1 MILLION deposited.
💰 That's approximately $25.3 MILLION NET OUTFLOW, across 22 tracked Ethereum whale wallets.
Sounds bullish? Hold that victory dance. 😂
There's a catch…
Exchange withdrawals can reduce immediately available selling supply, but they don't automatically prove fresh buying or guarantee a price rally.
And SHIB's daily chart isn't exactly celebrating:
📉 Price: $0.00000443 (chart snapshot)
🔹 MA(7): $0.00000446
🔹 MA(25): $0.00000475
🔹 MA(99): $0.00000513
🔹 Supertrend: $0.00000505
THE LEVELS TO WATCH:
🟢 Bulls need to reclaim $0.00000475 first. The $0.00000505–$0.00000513 area is the next major hurdle.
🔴 Below $0.00000431, the marked $0.00000398–$0.00000415 demand zone comes into focus.
MARKETLENS TAKE: Whale withdrawals are interesting, but the daily trend remains bearish. Until price confirms a recovery, don't confuse wallet movements with a guaranteed pump.
👇 Your take:
Are SHIB whales quietly accumulating… or just moving their bags somewhere safer? 😂
#MarketLens #SHIB #ShibaInu #onchaindata #cryptotrading
$SHIB
While SHIB holders are waiting for a comeback, whale wallets are making moves.
Here's what the data shows:
🐋 $27.3 MILLION in SHIB withdrawn from exchanges over 7 days.
🔻 Only $2.1 MILLION deposited.
💰 That's approximately $25.3 MILLION NET OUTFLOW, across 22 tracked Ethereum whale wallets.
Sounds bullish? Hold that victory dance. 😂
There's a catch…
Exchange withdrawals can reduce immediately available selling supply, but they don't automatically prove fresh buying or guarantee a price rally.
And SHIB's daily chart isn't exactly celebrating:
📉 Price: $0.00000443 (chart snapshot)
🔹 MA(7): $0.00000446
🔹 MA(25): $0.00000475
🔹 MA(99): $0.00000513
🔹 Supertrend: $0.00000505
THE LEVELS TO WATCH:
🟢 Bulls need to reclaim $0.00000475 first. The $0.00000505–$0.00000513 area is the next major hurdle.
🔴 Below $0.00000431, the marked $0.00000398–$0.00000415 demand zone comes into focus.
MARKETLENS TAKE: Whale withdrawals are interesting, but the daily trend remains bearish. Until price confirms a recovery, don't confuse wallet movements with a guaranteed pump.
👇 Your take:
Are SHIB whales quietly accumulating… or just moving their bags somewhere safer? 😂
#MarketLens #SHIB #ShibaInu #onchaindata #cryptotrading
$SHIB
CryptoAmeer:
I followed you, do you follow me?
1
8
2.7k

·
--
A BTC wallet dormant for 16 years awakens, with its $6.9 million in coins surging 1.15 million-fold
A Bitcoin mined in 2010 has been reawakened and moved, with its book value increasing approximately 1.15 million-fold over 16 years. This on-chain event has once again brought the behavior of long-term holders and BTC’s supply elasticity into focus.
According to Decrypt, two Bitcoin mining rewards from September 2010 were moved within minutes of each other. At current market prices, the awakened coins are worth nearly $6.9 million, representing an increase of approximately 1.15 million-fold. The coins in question are $BTC mined in Bitcoin’s early days—a classic case of dormant assets coming back to life.
Why is this event worth analyzing from a capital-flow perspective? The key is that it touches on a structural feature of BTC’s supply: a large amount of early-era coins have remained inactive for a long time. Once they move, even if the amount is negligible relative to the overall market, they leave a clear on-chain signal of “supply being released.” Such awakenings are often interpreted by the market as a change in long-term holder behavior, rather than simply as selling pressure.
The data shows that this awakening involved approximately $6.9 million, an amount that has an extremely limited impact on BTC’s overall circulating market capitalization. The real talking point is the approximately 1.15 million-fold increase in value—reflecting the vast gap between the extremely low acquisition cost in 2010 and today’s price. The impact is more narrative than a sign of substantial capital movement.
How might the market react? Taken on its own, this event is likely to have a limited direct impact on BTC’s price or capital flows. Historical experience shows that dormant wallet awakenings can occasionally trigger short-term sentiment swings, but in most cases the market absorbs them quickly. What bears watching is whether events like this recur in the near term and whether they coincide with larger-scale on-chain activity by long-term holders.
The counterarguments are also clear: $6.9 million is negligible compared with BTC’s average daily trading volume, and a single event is unlikely to change the supply picture. Meanwhile, if an extreme figure like 1.15 million-fold is amplified, the story can become headline-driven and requires more on-chain data to support it.
What should you watch next? If you’re following BTC, it’s more useful from a trading perspective to watch for whether these awakenings form a cluster and whether long-term holders’ positions undergo systematic changes, rather than focusing on the amount involved in a single event. Whether price and trading volume confirm supply pressure will be key to assessing what happens next.
$BTC #Bitcoin #OnChainData
The above is a summary of information and personal analysis, and does not constitute investment advice.
Follow me for ongoing coverage of key market changes and data.
A BTC wallet dormant for 16 years awakens, with its $6.9 million in coins surging 1.15 million-fold
A Bitcoin mined in 2010 has been reawakened and moved, with its book value increasing approximately 1.15 million-fold over 16 years. This on-chain event has once again brought the behavior of long-term holders and BTC’s supply elasticity into focus.
According to Decrypt, two Bitcoin mining rewards from September 2010 were moved within minutes of each other. At current market prices, the awakened coins are worth nearly $6.9 million, representing an increase of approximately 1.15 million-fold. The coins in question are $BTC mined in Bitcoin’s early days—a classic case of dormant assets coming back to life.
Why is this event worth analyzing from a capital-flow perspective? The key is that it touches on a structural feature of BTC’s supply: a large amount of early-era coins have remained inactive for a long time. Once they move, even if the amount is negligible relative to the overall market, they leave a clear on-chain signal of “supply being released.” Such awakenings are often interpreted by the market as a change in long-term holder behavior, rather than simply as selling pressure.
The data shows that this awakening involved approximately $6.9 million, an amount that has an extremely limited impact on BTC’s overall circulating market capitalization. The real talking point is the approximately 1.15 million-fold increase in value—reflecting the vast gap between the extremely low acquisition cost in 2010 and today’s price. The impact is more narrative than a sign of substantial capital movement.
How might the market react? Taken on its own, this event is likely to have a limited direct impact on BTC’s price or capital flows. Historical experience shows that dormant wallet awakenings can occasionally trigger short-term sentiment swings, but in most cases the market absorbs them quickly. What bears watching is whether events like this recur in the near term and whether they coincide with larger-scale on-chain activity by long-term holders.
The counterarguments are also clear: $6.9 million is negligible compared with BTC’s average daily trading volume, and a single event is unlikely to change the supply picture. Meanwhile, if an extreme figure like 1.15 million-fold is amplified, the story can become headline-driven and requires more on-chain data to support it.
What should you watch next? If you’re following BTC, it’s more useful from a trading perspective to watch for whether these awakenings form a cluster and whether long-term holders’ positions undergo systematic changes, rather than focusing on the amount involved in a single event. Whether price and trading volume confirm supply pressure will be key to assessing what happens next.
$BTC #Bitcoin #OnChainData
The above is a summary of information and personal analysis, and does not constitute investment advice.
Follow me for ongoing coverage of key market changes and data.
A Bitcoin mined in 2010 has been reawakened and moved, with its book value increasing approximately 1.15 million-fold over 16 years. This on-chain event has once again brought the behavior of long-term holders and BTC’s supply elasticity into focus.
According to Decrypt, two Bitcoin mining rewards from September 2010 were moved within minutes of each other. At current market prices, the awakened coins are worth nearly $6.9 million, representing an increase of approximately 1.15 million-fold. The coins in question are $BTC mined in Bitcoin’s early days—a classic case of dormant assets coming back to life.
Why is this event worth analyzing from a capital-flow perspective? The key is that it touches on a structural feature of BTC’s supply: a large amount of early-era coins have remained inactive for a long time. Once they move, even if the amount is negligible relative to the overall market, they leave a clear on-chain signal of “supply being released.” Such awakenings are often interpreted by the market as a change in long-term holder behavior, rather than simply as selling pressure.
The data shows that this awakening involved approximately $6.9 million, an amount that has an extremely limited impact on BTC’s overall circulating market capitalization. The real talking point is the approximately 1.15 million-fold increase in value—reflecting the vast gap between the extremely low acquisition cost in 2010 and today’s price. The impact is more narrative than a sign of substantial capital movement.
How might the market react? Taken on its own, this event is likely to have a limited direct impact on BTC’s price or capital flows. Historical experience shows that dormant wallet awakenings can occasionally trigger short-term sentiment swings, but in most cases the market absorbs them quickly. What bears watching is whether events like this recur in the near term and whether they coincide with larger-scale on-chain activity by long-term holders.
The counterarguments are also clear: $6.9 million is negligible compared with BTC’s average daily trading volume, and a single event is unlikely to change the supply picture. Meanwhile, if an extreme figure like 1.15 million-fold is amplified, the story can become headline-driven and requires more on-chain data to support it.
What should you watch next? If you’re following BTC, it’s more useful from a trading perspective to watch for whether these awakenings form a cluster and whether long-term holders’ positions undergo systematic changes, rather than focusing on the amount involved in a single event. Whether price and trading volume confirm supply pressure will be key to assessing what happens next.
$BTC #Bitcoin #OnChainData
The above is a summary of information and personal analysis, and does not constitute investment advice.
Follow me for ongoing coverage of key market changes and data.
44
·
--
A dormant BTC wallet from 16 years ago awakens, with $6.9 million in coins now worth 1.15 million times their original value
A rare on-chain movement has occurred: two Bitcoin mining rewards from September 2010 were moved within minutes of each other, awakening for the first time in 16 years. The funds are now worth approximately $6.9 million, or about 1.15 million times their original value.
According to Decrypt, the two transactions can be traced back to Bitcoin’s early days and involve coins earned from mining in the network’s earliest period. Sixteen years ago, these coins were worth almost nothing; at today’s prices, they are now worth several million dollars. For a long-term holder, this represents a substantial historical gain. But in terms of the market’s overall funds, the actual impact may be limited.
Why is this event worth examining from a market-funds perspective? The key point is that “moving” coins does not necessarily mean “selling” them. Early-mined coins can remain dormant for a long time, and holders often move them again for custody, transfer, or portfolio-management reasons. This movement is therefore more likely to reflect a long-term holder reorganizing their assets than adding selling pressure to the market. What matters is whether there are verifiable signs of a sell-off later, such as funds flowing to exchanges or a surge in trading volume.
From a liquidity perspective, $6.9 million represents a tiny share of the current market and is unlikely to materially affect the price. What is really worth watching is the signal sent when a “dormant whale” becomes active: when long-held coins start moving, it can suggest that some early holders believe current valuations present an opportunity to act. This shift in sentiment may be more significant than the size of any single transaction.
How might the market react? In the short term, this kind of story is more likely to attract attention and affect sentiment than to prompt a fundamental repricing driven by capital flows. Sentiment-driven rallies often lack staying power; without subsequent real buying or inflows, gains can easily be reversed.
The counterarguments are also clear: a transfer from a single wallet is not necessarily a sell signal, and the story’s impact is greater than its actual effect on market flows, so it should not be overinterpreted. Historically, prices have often remained stable or even fallen after “whale movements,” showing that on-chain activity does not map neatly onto market performance.
What should we watch next? The key things to monitor are whether these coins flow to an exchange, whether trading volume or funding rates show unusual activity, and whether the price finds confirmation at key levels. If you’re following BTC, these signals are more worth watching in the short term than letting the story itself drive sentiment.
#Bitcoin #OnChainData
The above is a summary of information and personal analysis, and does not constitute investment advice.
A dormant BTC wallet from 16 years ago awakens, with $6.9 million in coins now worth 1.15 million times their original value
A rare on-chain movement has occurred: two Bitcoin mining rewards from September 2010 were moved within minutes of each other, awakening for the first time in 16 years. The funds are now worth approximately $6.9 million, or about 1.15 million times their original value.
According to Decrypt, the two transactions can be traced back to Bitcoin’s early days and involve coins earned from mining in the network’s earliest period. Sixteen years ago, these coins were worth almost nothing; at today’s prices, they are now worth several million dollars. For a long-term holder, this represents a substantial historical gain. But in terms of the market’s overall funds, the actual impact may be limited.
Why is this event worth examining from a market-funds perspective? The key point is that “moving” coins does not necessarily mean “selling” them. Early-mined coins can remain dormant for a long time, and holders often move them again for custody, transfer, or portfolio-management reasons. This movement is therefore more likely to reflect a long-term holder reorganizing their assets than adding selling pressure to the market. What matters is whether there are verifiable signs of a sell-off later, such as funds flowing to exchanges or a surge in trading volume.
From a liquidity perspective, $6.9 million represents a tiny share of the current market and is unlikely to materially affect the price. What is really worth watching is the signal sent when a “dormant whale” becomes active: when long-held coins start moving, it can suggest that some early holders believe current valuations present an opportunity to act. This shift in sentiment may be more significant than the size of any single transaction.
How might the market react? In the short term, this kind of story is more likely to attract attention and affect sentiment than to prompt a fundamental repricing driven by capital flows. Sentiment-driven rallies often lack staying power; without subsequent real buying or inflows, gains can easily be reversed.
The counterarguments are also clear: a transfer from a single wallet is not necessarily a sell signal, and the story’s impact is greater than its actual effect on market flows, so it should not be overinterpreted. Historically, prices have often remained stable or even fallen after “whale movements,” showing that on-chain activity does not map neatly onto market performance.
What should we watch next? The key things to monitor are whether these coins flow to an exchange, whether trading volume or funding rates show unusual activity, and whether the price finds confirmation at key levels. If you’re following BTC, these signals are more worth watching in the short term than letting the story itself drive sentiment.
#Bitcoin #OnChainData
The above is a summary of information and personal analysis, and does not constitute investment advice.
A rare on-chain movement has occurred: two Bitcoin mining rewards from September 2010 were moved within minutes of each other, awakening for the first time in 16 years. The funds are now worth approximately $6.9 million, or about 1.15 million times their original value.
According to Decrypt, the two transactions can be traced back to Bitcoin’s early days and involve coins earned from mining in the network’s earliest period. Sixteen years ago, these coins were worth almost nothing; at today’s prices, they are now worth several million dollars. For a long-term holder, this represents a substantial historical gain. But in terms of the market’s overall funds, the actual impact may be limited.
Why is this event worth examining from a market-funds perspective? The key point is that “moving” coins does not necessarily mean “selling” them. Early-mined coins can remain dormant for a long time, and holders often move them again for custody, transfer, or portfolio-management reasons. This movement is therefore more likely to reflect a long-term holder reorganizing their assets than adding selling pressure to the market. What matters is whether there are verifiable signs of a sell-off later, such as funds flowing to exchanges or a surge in trading volume.
From a liquidity perspective, $6.9 million represents a tiny share of the current market and is unlikely to materially affect the price. What is really worth watching is the signal sent when a “dormant whale” becomes active: when long-held coins start moving, it can suggest that some early holders believe current valuations present an opportunity to act. This shift in sentiment may be more significant than the size of any single transaction.
How might the market react? In the short term, this kind of story is more likely to attract attention and affect sentiment than to prompt a fundamental repricing driven by capital flows. Sentiment-driven rallies often lack staying power; without subsequent real buying or inflows, gains can easily be reversed.
The counterarguments are also clear: a transfer from a single wallet is not necessarily a sell signal, and the story’s impact is greater than its actual effect on market flows, so it should not be overinterpreted. Historically, prices have often remained stable or even fallen after “whale movements,” showing that on-chain activity does not map neatly onto market performance.
What should we watch next? The key things to monitor are whether these coins flow to an exchange, whether trading volume or funding rates show unusual activity, and whether the price finds confirmation at key levels. If you’re following BTC, these signals are more worth watching in the short term than letting the story itself drive sentiment.
#Bitcoin #OnChainData
The above is a summary of information and personal analysis, and does not constitute investment advice.
257
🚨 THE SILENT $SHIB DEPLOYER WALLET AND THE 137 IMPOSTER TOKENS LURKING IN THE SHADOWS 🦈
Since the original $SHIB deployer address went completely dark back in October 2021, the ecosystem has faced a relentless wave of copycats. On-chain forensics reveal at least 137 different imitation assets attempting to weaponize historical nostalgia to capture retail liquidity. 🔍
In high-stakes markets, structural pedigree matters just as much as momentum. When noise floods the order books, tracking verified genesis wallets separates seasoned participants from casual speculators falling for phantom narratives. 📊
💡 Are you keeping your focus strictly on established asset integrity, or getting distracted by derivative noise? 👇
⚠️ Not financial advice. Always manage your risk. 🛡️
🏷️ #SHIB #CryptoInsights #OnChainData #MarketSecurity
🔥 💎
🚨 THE SILENT $SHIB DEPLOYER WALLET AND THE 137 IMPOSTER TOKENS LURKING IN THE SHADOWS 🦈
Since the original $SHIB deployer address went completely dark back in October 2021, the ecosystem has faced a relentless wave of copycats. On-chain forensics reveal at least 137 different imitation assets attempting to weaponize historical nostalgia to capture retail liquidity. 🔍
In high-stakes markets, structural pedigree matters just as much as momentum. When noise floods the order books, tracking verified genesis wallets separates seasoned participants from casual speculators falling for phantom narratives. 📊
💡 Are you keeping your focus strictly on established asset integrity, or getting distracted by derivative noise? 👇
⚠️ Not financial advice. Always manage your risk. 🛡️
🏷️ #SHIB #CryptoInsights #OnChainData #MarketSecurity
🔥 💎
Since the original $SHIB deployer address went completely dark back in October 2021, the ecosystem has faced a relentless wave of copycats. On-chain forensics reveal at least 137 different imitation assets attempting to weaponize historical nostalgia to capture retail liquidity. 🔍
In high-stakes markets, structural pedigree matters just as much as momentum. When noise floods the order books, tracking verified genesis wallets separates seasoned participants from casual speculators falling for phantom narratives. 📊
💡 Are you keeping your focus strictly on established asset integrity, or getting distracted by derivative noise? 👇
⚠️ Not financial advice. Always manage your risk. 🛡️
🏷️ #SHIB #CryptoInsights #OnChainData #MarketSecurity
🔥 💎
22

📉 🦈 $BTC WALLETS FLUSHING OUT SINCE THE OCTOBER 16 PEAK AT 59.9M! ⚡
On-chain metrics are telling a fascinating story of weak hands capitulating while the broader market hesitates. Since the 59.99 million non-empty wallet peak on October 16, network participation has cooled significantly. 📊
This kind of network purge usually signals the classic shakeout phase where impatient retail participants hand over their bags to patient capital. 💡 When wallet counts contract during a consolidation phase, smart money is quietly accumulating off the radar. 🌊
💬 Are you treating this wallet cleanse as a red flag or a stealth accumulation window before the next expansion? 👇
⚠️ Not financial advice. Always manage your risk. 🛡️
🏷️ #BTC #OnChainData #MarketShakeout #Crypto
🦈 💎
📉 🦈 $BTC WALLETS FLUSHING OUT SINCE THE OCTOBER 16 PEAK AT 59.9M! ⚡
On-chain metrics are telling a fascinating story of weak hands capitulating while the broader market hesitates. Since the 59.99 million non-empty wallet peak on October 16, network participation has cooled significantly. 📊
This kind of network purge usually signals the classic shakeout phase where impatient retail participants hand over their bags to patient capital. 💡 When wallet counts contract during a consolidation phase, smart money is quietly accumulating off the radar. 🌊
💬 Are you treating this wallet cleanse as a red flag or a stealth accumulation window before the next expansion? 👇
⚠️ Not financial advice. Always manage your risk. 🛡️
🏷️ #BTC #OnChainData #MarketShakeout #Crypto
🦈 💎
On-chain metrics are telling a fascinating story of weak hands capitulating while the broader market hesitates. Since the 59.99 million non-empty wallet peak on October 16, network participation has cooled significantly. 📊
This kind of network purge usually signals the classic shakeout phase where impatient retail participants hand over their bags to patient capital. 💡 When wallet counts contract during a consolidation phase, smart money is quietly accumulating off the radar. 🌊
💬 Are you treating this wallet cleanse as a red flag or a stealth accumulation window before the next expansion? 👇
⚠️ Not financial advice. Always manage your risk. 🛡️
🏷️ #BTC #OnChainData #MarketShakeout #Crypto
🦈 💎
7

·
--
The Great Migration: Why Tokenized Gold Flows Suggest Institutional Survival Mode
The real story right now isn't the daily candle on the DXY; it is the silent exodus of $PAXG from centralized platforms into multi-sig custody. While retail traders are busy chasing high-beta rotations, the smart money is moving toward preservation. I have been digging into the on-chain registry over the last seventy-two hours, and the trend is undeniable. We are seeing a consistent drain of exchange reserves on Binance, suggesting that institutional players are locking away their gold exposure for the long haul rather than looking for a speculative exit.
With Spot Gold hovering near 4116.8 and Spot Silver at 60.27, the Gold/Silver Ratio is grinding at 68.5. This macro backdrop is driving a massive appetite for physical backing within the digital ecosystem. Unlike speculative paper gold, PAXG offers that 1:1 London Good Delivery bridge, and the transparency of the blockchain shows exactly where the supply is sitting. Currently, the circulating float is becoming increasingly illiquid as these tokens vanish into deep-cold wallets. When you combine this with the fact that central bank reserve hoarding is reaching new peaks, the tightening of on-chain supply becomes a critical factor for the quarters ahead.
The lack of aggressive sell-side depth on the order books tells me that the current holders are not looking to flip this position. They are using PAXG as a foundational hedge against the inevitable volatility that comes with shifting Fed sentiment and labor data revisions. We are essentially watching the creation of a digital war chest. If a sudden macro shock hits the market, the thin liquidity on the sell side could lead to a sharp premium as demand outstrips the available exchange float.
Are you treating your tokenized commodities as a permanent anchor for your portfolio, or just a place to hide until the risk-on floodgates open again?
_
#OnChainData #WhaleAlert
The Great Migration: Why Tokenized Gold Flows Suggest Institutional Survival Mode
The real story right now isn't the daily candle on the DXY; it is the silent exodus of $PAXG from centralized platforms into multi-sig custody. While retail traders are busy chasing high-beta rotations, the smart money is moving toward preservation. I have been digging into the on-chain registry over the last seventy-two hours, and the trend is undeniable. We are seeing a consistent drain of exchange reserves on Binance, suggesting that institutional players are locking away their gold exposure for the long haul rather than looking for a speculative exit.
With Spot Gold hovering near 4116.8 and Spot Silver at 60.27, the Gold/Silver Ratio is grinding at 68.5. This macro backdrop is driving a massive appetite for physical backing within the digital ecosystem. Unlike speculative paper gold, PAXG offers that 1:1 London Good Delivery bridge, and the transparency of the blockchain shows exactly where the supply is sitting. Currently, the circulating float is becoming increasingly illiquid as these tokens vanish into deep-cold wallets. When you combine this with the fact that central bank reserve hoarding is reaching new peaks, the tightening of on-chain supply becomes a critical factor for the quarters ahead.
The lack of aggressive sell-side depth on the order books tells me that the current holders are not looking to flip this position. They are using PAXG as a foundational hedge against the inevitable volatility that comes with shifting Fed sentiment and labor data revisions. We are essentially watching the creation of a digital war chest. If a sudden macro shock hits the market, the thin liquidity on the sell side could lead to a sharp premium as demand outstrips the available exchange float.
Are you treating your tokenized commodities as a permanent anchor for your portfolio, or just a place to hide until the risk-on floodgates open again?
_
#OnChainData #WhaleAlert
The real story right now isn't the daily candle on the DXY; it is the silent exodus of $PAXG from centralized platforms into multi-sig custody. While retail traders are busy chasing high-beta rotations, the smart money is moving toward preservation. I have been digging into the on-chain registry over the last seventy-two hours, and the trend is undeniable. We are seeing a consistent drain of exchange reserves on Binance, suggesting that institutional players are locking away their gold exposure for the long haul rather than looking for a speculative exit.
With Spot Gold hovering near 4116.8 and Spot Silver at 60.27, the Gold/Silver Ratio is grinding at 68.5. This macro backdrop is driving a massive appetite for physical backing within the digital ecosystem. Unlike speculative paper gold, PAXG offers that 1:1 London Good Delivery bridge, and the transparency of the blockchain shows exactly where the supply is sitting. Currently, the circulating float is becoming increasingly illiquid as these tokens vanish into deep-cold wallets. When you combine this with the fact that central bank reserve hoarding is reaching new peaks, the tightening of on-chain supply becomes a critical factor for the quarters ahead.
The lack of aggressive sell-side depth on the order books tells me that the current holders are not looking to flip this position. They are using PAXG as a foundational hedge against the inevitable volatility that comes with shifting Fed sentiment and labor data revisions. We are essentially watching the creation of a digital war chest. If a sudden macro shock hits the market, the thin liquidity on the sell side could lead to a sharp premium as demand outstrips the available exchange float.
Are you treating your tokenized commodities as a permanent anchor for your portfolio, or just a place to hide until the risk-on floodgates open again?
_
#OnChainData #WhaleAlert

1
38

·
--
【Hacker’s heist goes wrong? 28 mysterious Bitcoin transactions each deducting precisely 17% in fees】
A bizarre case of an “automated theft gone wrong” has just unfolded on the Bitcoin blockchain.
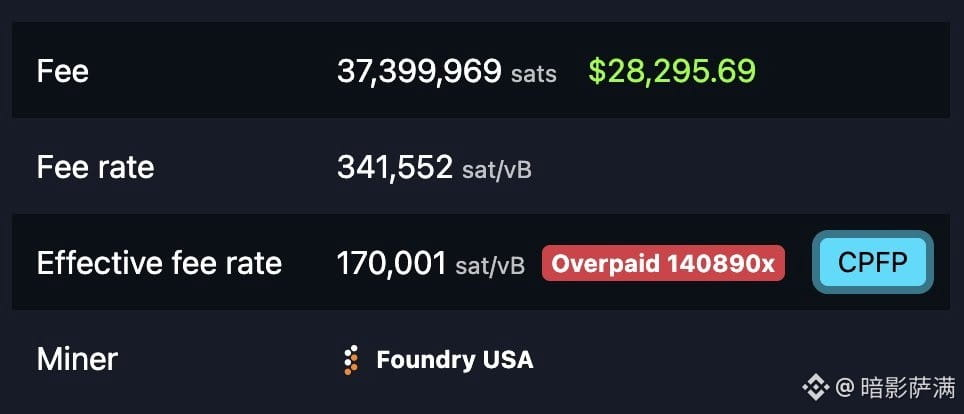
According to on-chain monitoring by Mempool.space developer mononaut (@mononautical), 28 highly suspicious transactions were suddenly included in the same Bitcoin block:
🔹 Same source address: All 28 transactions spent funds from the same wallet address.
🔹 Uncannily precise: The miner fee for every transaction was exactly 17%!
🔹 Where the funds went: A total of 4.337 BTC was transferred out of the address, with as much as 0.7373 BTC (a full 17%) handed directly to miners as fees.
💡 A closer look:
1. A shoddily made sweeping bot: mononaut speculates that this was most likely an automated theft targeting a compromised wallet. A hacker or on-chain “sweeper” script detected a wallet with a leaked private key and triggered a batch withdrawal.
2. An absurd hard-coded fee rate: Normal on-chain transactions are charged by virtual bytes (sat/vB), but this hacker’s script clearly had a logic flaw: it crudely hard-coded 17% of the transfer amount as the fee, frantically pushing the transactions through in the same block.
3. Miners come out on top: The victim lost 4.337 BTC, while the thief’s sloppy code needlessly “paid tribute” to miners in the form of a massive 0.73 BTC (worth tens of thousands of dollars) in fees.
In the highly sophisticated world of blockchain networks, even hackers can get a costly lesson from on-chain rules and miners when their scripts are badly written.
#Bitcoin #区块链 #加密安全 #OnChainData
【Hacker’s heist goes wrong? 28 mysterious Bitcoin transactions each deducting precisely 17% in fees】
A bizarre case of an “automated theft gone wrong” has just unfolded on the Bitcoin blockchain.
According to on-chain monitoring by Mempool.space developer mononaut (@mononautical), 28 highly suspicious transactions were suddenly included in the same Bitcoin block:
🔹 Same source address: All 28 transactions spent funds from the same wallet address.
🔹 Uncannily precise: The miner fee for every transaction was exactly 17%!
🔹 Where the funds went: A total of 4.337 BTC was transferred out of the address, with as much as 0.7373 BTC (a full 17%) handed directly to miners as fees.
💡 A closer look:
1. A shoddily made sweeping bot: mononaut speculates that this was most likely an automated theft targeting a compromised wallet. A hacker or on-chain “sweeper” script detected a wallet with a leaked private key and triggered a batch withdrawal.
2. An absurd hard-coded fee rate: Normal on-chain transactions are charged by virtual bytes (sat/vB), but this hacker’s script clearly had a logic flaw: it crudely hard-coded 17% of the transfer amount as the fee, frantically pushing the transactions through in the same block.
3. Miners come out on top: The victim lost 4.337 BTC, while the thief’s sloppy code needlessly “paid tribute” to miners in the form of a massive 0.73 BTC (worth tens of thousands of dollars) in fees.
In the highly sophisticated world of blockchain networks, even hackers can get a costly lesson from on-chain rules and miners when their scripts are badly written.
#Bitcoin #区块链 #加密安全 #OnChainData
A bizarre case of an “automated theft gone wrong” has just unfolded on the Bitcoin blockchain.
According to on-chain monitoring by Mempool.space developer mononaut (@mononautical), 28 highly suspicious transactions were suddenly included in the same Bitcoin block:
🔹 Same source address: All 28 transactions spent funds from the same wallet address.
🔹 Uncannily precise: The miner fee for every transaction was exactly 17%!
🔹 Where the funds went: A total of 4.337 BTC was transferred out of the address, with as much as 0.7373 BTC (a full 17%) handed directly to miners as fees.
💡 A closer look:
1. A shoddily made sweeping bot: mononaut speculates that this was most likely an automated theft targeting a compromised wallet. A hacker or on-chain “sweeper” script detected a wallet with a leaked private key and triggered a batch withdrawal.
2. An absurd hard-coded fee rate: Normal on-chain transactions are charged by virtual bytes (sat/vB), but this hacker’s script clearly had a logic flaw: it crudely hard-coded 17% of the transfer amount as the fee, frantically pushing the transactions through in the same block.
3. Miners come out on top: The victim lost 4.337 BTC, while the thief’s sloppy code needlessly “paid tribute” to miners in the form of a massive 0.73 BTC (worth tens of thousands of dollars) in fees.
In the highly sophisticated world of blockchain networks, even hackers can get a costly lesson from on-chain rules and miners when their scripts are badly written.
#Bitcoin #区块链 #加密安全 #OnChainData
127

·
--
🦈 $PEPE ANCHORS 600,000 UNIQUE HOLDERS AS WALLET ACCUMULATION ACCELERATES QUIETLY! 📈
On-chain metrics reveal a steady distribution footprint on $PEPE as the holder base officially clears the 600,000 milestone. 📊 This consistent addition of nearly 5,000 new addresses over the past fortnight points to methodical retail accumulation rather than explosive speculative FOMO. 🔍
When holder growth outpaces price volatility, it typically indicates strong structural absorption by patient capital building positions ahead of the next liquidity expansion. 💡 Are you viewing this steady wallet growth as a precursor to a major range breakout, or just baseline noise? 👇
⚠️ Not financial advice. Always manage your risk. 🛡️
🏷️ #PEPE #OnChainData #SmartMoney #Crypto
📊 🦈
🦈 $PEPE ANCHORS 600,000 UNIQUE HOLDERS AS WALLET ACCUMULATION ACCELERATES QUIETLY! 📈
On-chain metrics reveal a steady distribution footprint on $PEPE as the holder base officially clears the 600,000 milestone. 📊 This consistent addition of nearly 5,000 new addresses over the past fortnight points to methodical retail accumulation rather than explosive speculative FOMO. 🔍
When holder growth outpaces price volatility, it typically indicates strong structural absorption by patient capital building positions ahead of the next liquidity expansion. 💡 Are you viewing this steady wallet growth as a precursor to a major range breakout, or just baseline noise? 👇
⚠️ Not financial advice. Always manage your risk. 🛡️
🏷️ #PEPE #OnChainData #SmartMoney #Crypto
📊 🦈
On-chain metrics reveal a steady distribution footprint on $PEPE as the holder base officially clears the 600,000 milestone. 📊 This consistent addition of nearly 5,000 new addresses over the past fortnight points to methodical retail accumulation rather than explosive speculative FOMO. 🔍
When holder growth outpaces price volatility, it typically indicates strong structural absorption by patient capital building positions ahead of the next liquidity expansion. 💡 Are you viewing this steady wallet growth as a precursor to a major range breakout, or just baseline noise? 👇
⚠️ Not financial advice. Always manage your risk. 🛡️
🏷️ #PEPE #OnChainData #SmartMoney #Crypto
📊 🦈

4

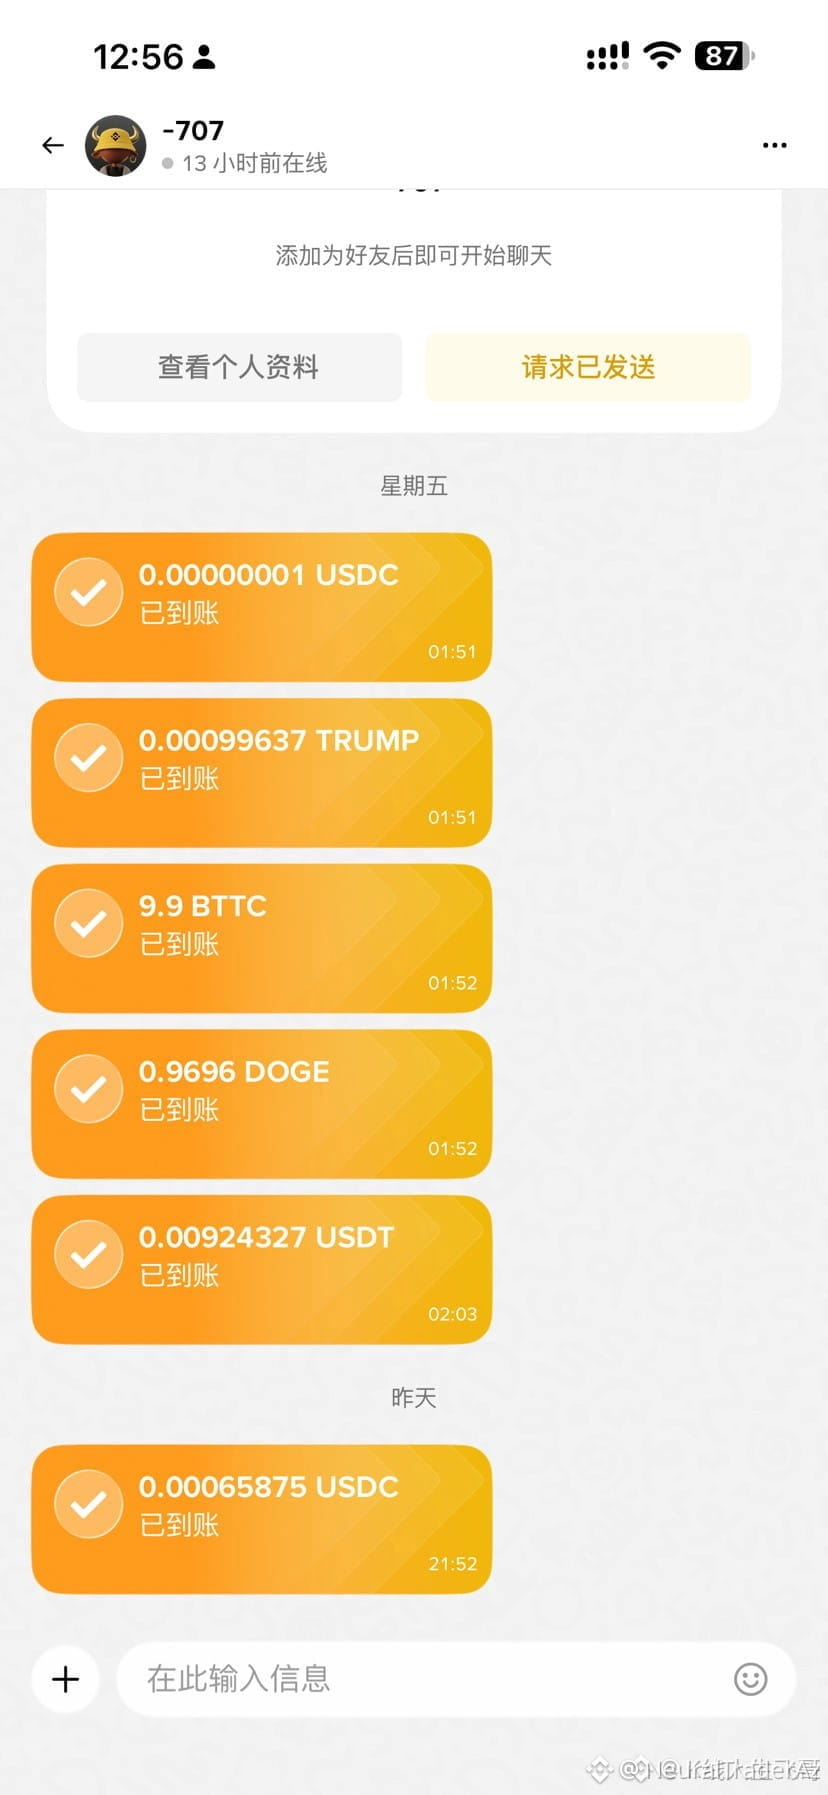
🦈 $USDT DUST TRANSFERS: WHAT DO REPEATED MICRO-BALANCES REVEAL ABOUT RETAIL CAPITULATION? 📉
Observing recurring fractional token transfers often signals a market participant systematically clearing residual balances before permanently exiting the ecosystem. These tiny transaction footprints reflect the final stages of retail capitulation after prolonged drawdown stress. 📊
When accounts are drained down to microscopic fractions, residual dust is sometimes scattered across ledger networks as a psychological closure ritual or an automated liquidation residue. 🔍
💬 Have you ever encountered strange micro-dust transfers from depleted accounts before? 👇
⚠️ Not financial advice. Always manage your risk. 🛡️
🏷️ #USDT #OnChainData #MarketStructure #Crypto
🦈 📉
🦈 $USDT DUST TRANSFERS: WHAT DO REPEATED MICRO-BALANCES REVEAL ABOUT RETAIL CAPITULATION? 📉
Observing recurring fractional token transfers often signals a market participant systematically clearing residual balances before permanently exiting the ecosystem. These tiny transaction footprints reflect the final stages of retail capitulation after prolonged drawdown stress. 📊
When accounts are drained down to microscopic fractions, residual dust is sometimes scattered across ledger networks as a psychological closure ritual or an automated liquidation residue. 🔍
💬 Have you ever encountered strange micro-dust transfers from depleted accounts before? 👇
⚠️ Not financial advice. Always manage your risk. 🛡️
🏷️ #USDT #OnChainData #MarketStructure #Crypto
🦈 📉
Observing recurring fractional token transfers often signals a market participant systematically clearing residual balances before permanently exiting the ecosystem. These tiny transaction footprints reflect the final stages of retail capitulation after prolonged drawdown stress. 📊
When accounts are drained down to microscopic fractions, residual dust is sometimes scattered across ledger networks as a psychological closure ritual or an automated liquidation residue. 🔍
💬 Have you ever encountered strange micro-dust transfers from depleted accounts before? 👇
⚠️ Not financial advice. Always manage your risk. 🛡️
🏷️ #USDT #OnChainData #MarketStructure #Crypto
🦈 📉
4
·
--
🦈 $BTC LONG-TERM HOLDER SUPPLY IS QUIETLY MIGRATING TO CENTRALIZED LIQUIDITY POOLS 📈
Data across the 30-day moving average highlights a structural acceleration in older coin movement toward major venues starting around June and compounding through October. 📊 While standard retail heuristic assumes immediate sell pressure, order flow suggests a deeper psychology shift as participants rethink self-custody security risks. 🔍
Smart money infrastructure dynamics are evolving as capital consolidates where execution liquidity is deepest. 🌊 Are market participants abandoning local hardware storage for institutional custody solutions, or is this distribution in disguise? 💬
⚠️ Not financial advice. Always manage your risk. 🛡️
🏷️ #BTC #OnChainData #SmartMoney #CryptoAnalysis
🔥 💎
🦈 $BTC LONG-TERM HOLDER SUPPLY IS QUIETLY MIGRATING TO CENTRALIZED LIQUIDITY POOLS 📈
Data across the 30-day moving average highlights a structural acceleration in older coin movement toward major venues starting around June and compounding through October. 📊 While standard retail heuristic assumes immediate sell pressure, order flow suggests a deeper psychology shift as participants rethink self-custody security risks. 🔍
Smart money infrastructure dynamics are evolving as capital consolidates where execution liquidity is deepest. 🌊 Are market participants abandoning local hardware storage for institutional custody solutions, or is this distribution in disguise? 💬
⚠️ Not financial advice. Always manage your risk. 🛡️
🏷️ #BTC #OnChainData #SmartMoney #CryptoAnalysis
🔥 💎
Data across the 30-day moving average highlights a structural acceleration in older coin movement toward major venues starting around June and compounding through October. 📊 While standard retail heuristic assumes immediate sell pressure, order flow suggests a deeper psychology shift as participants rethink self-custody security risks. 🔍
Smart money infrastructure dynamics are evolving as capital consolidates where execution liquidity is deepest. 🌊 Are market participants abandoning local hardware storage for institutional custody solutions, or is this distribution in disguise? 💬
⚠️ Not financial advice. Always manage your risk. 🛡️
🏷️ #BTC #OnChainData #SmartMoney #CryptoAnalysis
🔥 💎
3
Log in to explore more content
Join global crypto users on Binance Square
⚡️ Get latest and useful information about crypto.
💬 Trusted by the world’s largest crypto exchange.
👍 Discover real insights from verified creators.
Email / Phone number
Trending Topics
1
#WhoWillSucceedJensenHuangatNvidia?
87,627 views
1,149 Discussing
2
#WhatWillDriveCryptoandStocks’NextRebound?
439,239 views
3,050 Discussing
3
#BitcoinActiveSupplyInProfitDropsBelow45%
26,051 views
365 Discussing
4
#KavaSaysAbnormalActivityLimitedToKavaLend
10,638 views
182 Discussing
5
#USSpotXRPETFsSeeLargestWeeklyOutflowIn8Months
9,738 views
175 Discussing
6
#USPPIMissMayEaseBTCPressure
213,404 views
2,065 Discussing
7
#WORPTLetsTouristsConvertCryptoToThaiBaht
2,831 views
51 Discussing
8
#TONStrategyReports$23.97MQ3NetLoss
3,714 views
41 Discussing
9
#PolkadotCommunityApprovesNewStrategyWith97%Vote
19,491 views
249 Discussing
10
#dYdXPlansV9.9UpgradeToShiftUSDCToInjective
12,350 views
200 Discussing