
#btc
btc
9.4G views
61.8M Discussing
Hot
Latest


🟡 Bitcoin price wobbles ahead of Fed’s rate decision
Bitcoin (BTC) dipped as low as $59,500 on Binance ahead of tomorrow’s Federal Open Market Committee (FOMC) meeting. Market participants are bracing for a hawkish stance from the Federal Reserve (Fed), with expectations set for unchanged interest rates.
The CME FedWatch Tool indicates a mere 4.4% of economists predict a rate cut—the first in over a decade—while a dominant 95.6% anticipate rates to hold steady between 525-550 basis points.
According to The Kobeissi Letter, current market data indicates a 36% probability that there will be no interest rate cuts this year. Four months ago, the likelihood of maintaining current rates was only about 3%.
Expectations have also shifted to just one reduction this year. Previously, the market anticipated six rate cuts. Additionally, the probability of experiencing two or more rate cuts has diminished to 31%.
🔺 Stagflation risk
Amidst this financial climate, the US grapples with stagflation risks as inflation persists and economic growth slows.
The first quarter of 2024 saw GDP growth decelerate to 1.6%, falling short of the 2.2% forecast and down from the previous quarter’s 3.4%. Concurrently, the US Core PCE inflation index climbed from 2.0% to 3.7%.
Fed Chair Jerome Powell stated that recent data does not make the Fed more confident, suggesting a longer timeline to regain economic stability. He expressed belief in the adequacy of current policies to navigate the risks at hand, hinting at sustained high-interest rates without increases.
Bitcoin’s trajectory mirrored these economic uncertainties, dropping below $62,000 earlier in the week due to renewed stagflation worries.
A brief rally above $64,000 occurred with the launch of spot Bitcoin and Ethereum ETFs in Hong Kong yesterday, but the momentum was short-lived as investor caution set in ahead of the Fed’s key decision.
$BTC #BTC #Bitcoin
🟡 Bitcoin price wobbles ahead of Fed’s rate decision
Bitcoin (BTC) dipped as low as $59,500 on Binance ahead of tomorrow’s Federal Open Market Committee (FOMC) meeting. Market participants are bracing for a hawkish stance from the Federal Reserve (Fed), with expectations set for unchanged interest rates.
The CME FedWatch Tool indicates a mere 4.4% of economists predict a rate cut—the first in over a decade—while a dominant 95.6% anticipate rates to hold steady between 525-550 basis points.
According to The Kobeissi Letter, current market data indicates a 36% probability that there will be no interest rate cuts this year. Four months ago, the likelihood of maintaining current rates was only about 3%.
Expectations have also shifted to just one reduction this year. Previously, the market anticipated six rate cuts. Additionally, the probability of experiencing two or more rate cuts has diminished to 31%.
🔺 Stagflation risk
Amidst this financial climate, the US grapples with stagflation risks as inflation persists and economic growth slows.
The first quarter of 2024 saw GDP growth decelerate to 1.6%, falling short of the 2.2% forecast and down from the previous quarter’s 3.4%. Concurrently, the US Core PCE inflation index climbed from 2.0% to 3.7%.
Fed Chair Jerome Powell stated that recent data does not make the Fed more confident, suggesting a longer timeline to regain economic stability. He expressed belief in the adequacy of current policies to navigate the risks at hand, hinting at sustained high-interest rates without increases.
Bitcoin’s trajectory mirrored these economic uncertainties, dropping below $62,000 earlier in the week due to renewed stagflation worries.
A brief rally above $64,000 occurred with the launch of spot Bitcoin and Ethereum ETFs in Hong Kong yesterday, but the momentum was short-lived as investor caution set in ahead of the Fed’s key decision.
$BTC #BTC #Bitcoin
Bitcoin (BTC) dipped as low as $59,500 on Binance ahead of tomorrow’s Federal Open Market Committee (FOMC) meeting. Market participants are bracing for a hawkish stance from the Federal Reserve (Fed), with expectations set for unchanged interest rates.
The CME FedWatch Tool indicates a mere 4.4% of economists predict a rate cut—the first in over a decade—while a dominant 95.6% anticipate rates to hold steady between 525-550 basis points.
According to The Kobeissi Letter, current market data indicates a 36% probability that there will be no interest rate cuts this year. Four months ago, the likelihood of maintaining current rates was only about 3%.
Expectations have also shifted to just one reduction this year. Previously, the market anticipated six rate cuts. Additionally, the probability of experiencing two or more rate cuts has diminished to 31%.
🔺 Stagflation risk
Amidst this financial climate, the US grapples with stagflation risks as inflation persists and economic growth slows.
The first quarter of 2024 saw GDP growth decelerate to 1.6%, falling short of the 2.2% forecast and down from the previous quarter’s 3.4%. Concurrently, the US Core PCE inflation index climbed from 2.0% to 3.7%.
Fed Chair Jerome Powell stated that recent data does not make the Fed more confident, suggesting a longer timeline to regain economic stability. He expressed belief in the adequacy of current policies to navigate the risks at hand, hinting at sustained high-interest rates without increases.
Bitcoin’s trajectory mirrored these economic uncertainties, dropping below $62,000 earlier in the week due to renewed stagflation worries.
A brief rally above $64,000 occurred with the launch of spot Bitcoin and Ethereum ETFs in Hong Kong yesterday, but the momentum was short-lived as investor caution set in ahead of the Fed’s key decision.
$BTC #BTC #Bitcoin

138
58
400
297.7k

·
--
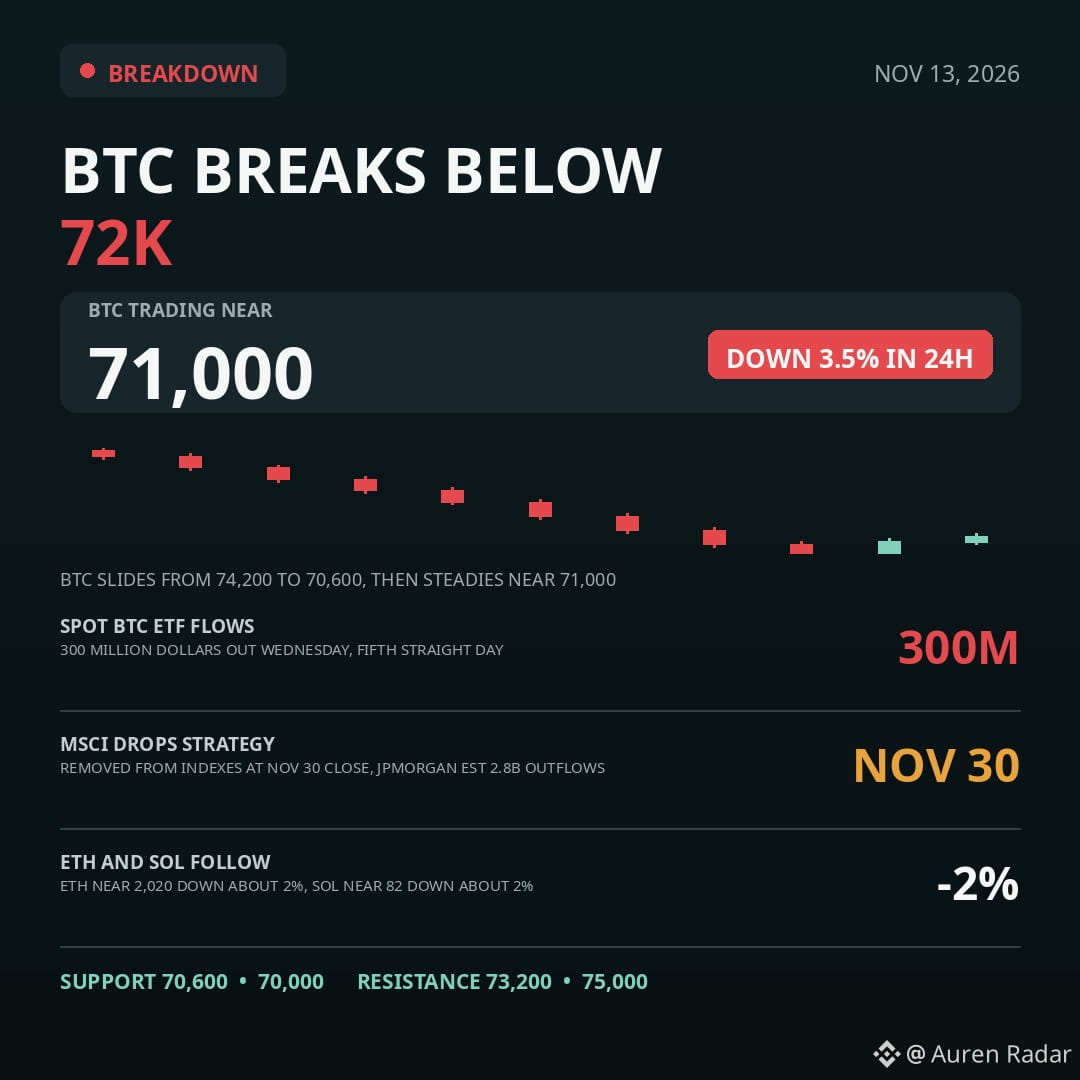
📡 BTC Breaks Below 72K As Selling Deepens
Bitcoin trades near 71,000, down about 3.5% in 24 hours after breaking below 72,000 overnight. The slide took price to a low near 70,600, the weakest level since August. Ethereum sits near 2,020, down about 2%, while Solana trades near 82, down about 2%.
Spot BTC ETFs lost about 300 million dollars on Wednesday, a fifth straight day of outflows that now totals about 1.44 billion since November 5. BlackRock's IBIT accounted for about 270 million of that day, its ninth straight session of redemptions. Spot ETH ETFs shed about 145 million the same day, also a fifth straight outflow.
MSCI confirmed it will remove Strategy from its global indexes at the close on November 30, with Metaplanet and Upexi also set for deletion. JPMorgan estimates the move could trigger about 2.8 billion dollars in passive outflows from MSTR, though it does not force Strategy to sell any of its 850,364 Bitcoin. MSTR fell about 2.6% after hours on the news.
Jobless claims rose to 200,000 against 195,000 expected, still low by historic standards. October PPI lands tonight, with consensus near 0.4% month on month after a hot CPI print, and December hike odds still priced near 90%.
👀 Support 70,600 and 70,000. Resistance 73,200 and 75,000.
Whether the 70,000 level holds into the PPI print may set the tone for the rest of the week, so the next session is worth watching closely.
📌 Personal opinion, not financial advice. DYOR.
#BTC #Crypto #CryptoMarket #ETF
$BTCUSDT $ETHUSDT $SOLUSDT
📡 BTC Breaks Below 72K As Selling Deepens
Bitcoin trades near 71,000, down about 3.5% in 24 hours after breaking below 72,000 overnight. The slide took price to a low near 70,600, the weakest level since August. Ethereum sits near 2,020, down about 2%, while Solana trades near 82, down about 2%.
Spot BTC ETFs lost about 300 million dollars on Wednesday, a fifth straight day of outflows that now totals about 1.44 billion since November 5. BlackRock's IBIT accounted for about 270 million of that day, its ninth straight session of redemptions. Spot ETH ETFs shed about 145 million the same day, also a fifth straight outflow.
MSCI confirmed it will remove Strategy from its global indexes at the close on November 30, with Metaplanet and Upexi also set for deletion. JPMorgan estimates the move could trigger about 2.8 billion dollars in passive outflows from MSTR, though it does not force Strategy to sell any of its 850,364 Bitcoin. MSTR fell about 2.6% after hours on the news.
Jobless claims rose to 200,000 against 195,000 expected, still low by historic standards. October PPI lands tonight, with consensus near 0.4% month on month after a hot CPI print, and December hike odds still priced near 90%.
👀 Support 70,600 and 70,000. Resistance 73,200 and 75,000.
Whether the 70,000 level holds into the PPI print may set the tone for the rest of the week, so the next session is worth watching closely.
📌 Personal opinion, not financial advice. DYOR.
#BTC #Crypto #CryptoMarket #ETF
$BTCUSDT $ETHUSDT $SOLUSDT
Bitcoin trades near 71,000, down about 3.5% in 24 hours after breaking below 72,000 overnight. The slide took price to a low near 70,600, the weakest level since August. Ethereum sits near 2,020, down about 2%, while Solana trades near 82, down about 2%.
Spot BTC ETFs lost about 300 million dollars on Wednesday, a fifth straight day of outflows that now totals about 1.44 billion since November 5. BlackRock's IBIT accounted for about 270 million of that day, its ninth straight session of redemptions. Spot ETH ETFs shed about 145 million the same day, also a fifth straight outflow.
MSCI confirmed it will remove Strategy from its global indexes at the close on November 30, with Metaplanet and Upexi also set for deletion. JPMorgan estimates the move could trigger about 2.8 billion dollars in passive outflows from MSTR, though it does not force Strategy to sell any of its 850,364 Bitcoin. MSTR fell about 2.6% after hours on the news.
Jobless claims rose to 200,000 against 195,000 expected, still low by historic standards. October PPI lands tonight, with consensus near 0.4% month on month after a hot CPI print, and December hike odds still priced near 90%.
👀 Support 70,600 and 70,000. Resistance 73,200 and 75,000.
Whether the 70,000 level holds into the PPI print may set the tone for the rest of the week, so the next session is worth watching closely.
📌 Personal opinion, not financial advice. DYOR.
#BTC #Crypto #CryptoMarket #ETF
$BTCUSDT $ETHUSDT $SOLUSDT
810

·
--
【Bitcoin Options Analysis | Nov. 13】
Based primarily on gamma exposure (GEX) data
BTC has fallen below $72,000 ahead of today’s weekly options expiry.
The main hedging zone has shifted lower since yesterday and now sits between $70,000 and $72,000. Max pain is at $75,000, but given how far it is from spot, I see $72,000 as the more likely pinning level into expiry.
A sizable amount of gamma exposure is expected to roll off at expiry. That could change how dealer hedging affects price, so watch for larger swings around settlement.
The major options wall remains at $80,000, with a shorter-term wall appearing around $75,000. Below spot, $70,000 stands out as the key downside level. After the break below $72,000, that level is now worth watching on any rebound.
The key dealer gamma flip is around $74,700, and BTC is currently trading below it. While BTC stays below that level, price swings can extend and technical support and resistance may be less reliable. The first level to reclaim and hold is $74,700.
Bitcoin implied volatility, as measured by BVIV, has fluctuated in the 40% range over the past few days. Rising implied volatility signals that the options market is pricing in larger swings. Falling implied volatility means smaller swings are being priced in, though realized volatility can still pick up.
Realized volatility (HV) is currently slightly above implied volatility as measured by DVOL. Recent price swings have been slightly larger than the volatility currently priced into options.
In the IBIT options market, open interest remains concentrated around strikes equivalent to $70,000 in BTC, particularly for the Nov. 20 expiry. That concentration keeps $70,000 in focus as the most important downside level.
#BTC
#bitcoin
{spot}(BTCUSDT)
【Bitcoin Options Analysis | Nov. 13】
Based primarily on gamma exposure (GEX) data
BTC has fallen below $72,000 ahead of today’s weekly options expiry.
The main hedging zone has shifted lower since yesterday and now sits between $70,000 and $72,000. Max pain is at $75,000, but given how far it is from spot, I see $72,000 as the more likely pinning level into expiry.
A sizable amount of gamma exposure is expected to roll off at expiry. That could change how dealer hedging affects price, so watch for larger swings around settlement.
The major options wall remains at $80,000, with a shorter-term wall appearing around $75,000. Below spot, $70,000 stands out as the key downside level. After the break below $72,000, that level is now worth watching on any rebound.
The key dealer gamma flip is around $74,700, and BTC is currently trading below it. While BTC stays below that level, price swings can extend and technical support and resistance may be less reliable. The first level to reclaim and hold is $74,700.
Bitcoin implied volatility, as measured by BVIV, has fluctuated in the 40% range over the past few days. Rising implied volatility signals that the options market is pricing in larger swings. Falling implied volatility means smaller swings are being priced in, though realized volatility can still pick up.
Realized volatility (HV) is currently slightly above implied volatility as measured by DVOL. Recent price swings have been slightly larger than the volatility currently priced into options.
In the IBIT options market, open interest remains concentrated around strikes equivalent to $70,000 in BTC, particularly for the Nov. 20 expiry. That concentration keeps $70,000 in focus as the most important downside level.
#BTC
#bitcoin
Based primarily on gamma exposure (GEX) data
BTC has fallen below $72,000 ahead of today’s weekly options expiry.
The main hedging zone has shifted lower since yesterday and now sits between $70,000 and $72,000. Max pain is at $75,000, but given how far it is from spot, I see $72,000 as the more likely pinning level into expiry.
A sizable amount of gamma exposure is expected to roll off at expiry. That could change how dealer hedging affects price, so watch for larger swings around settlement.
The major options wall remains at $80,000, with a shorter-term wall appearing around $75,000. Below spot, $70,000 stands out as the key downside level. After the break below $72,000, that level is now worth watching on any rebound.
The key dealer gamma flip is around $74,700, and BTC is currently trading below it. While BTC stays below that level, price swings can extend and technical support and resistance may be less reliable. The first level to reclaim and hold is $74,700.
Bitcoin implied volatility, as measured by BVIV, has fluctuated in the 40% range over the past few days. Rising implied volatility signals that the options market is pricing in larger swings. Falling implied volatility means smaller swings are being priced in, though realized volatility can still pick up.
Realized volatility (HV) is currently slightly above implied volatility as measured by DVOL. Recent price swings have been slightly larger than the volatility currently priced into options.
In the IBIT options market, open interest remains concentrated around strikes equivalent to $70,000 in BTC, particularly for the Nov. 20 expiry. That concentration keeps $70,000 in focus as the most important downside level.
#BTC
#bitcoin
473

·
--
Bearish
🔴 $BTC is showing strong bearish momentum, trading at $70,263 after a sharp 4.64% decline and approaching the recent low of $70,123. Price is below EMA(7) at $71,847, EMA(25) at $73,467, EMA(99) at $76,354, and bearish Supertrend at $73,671, confirming strong selling pressure. RSI(6) at 8.4 and StochRSI near zero indicate extreme oversold conditions, while negative MACD confirms bearish momentum; a short-term relief bounce is possible, but a breakdown below $70,123 could trigger further downside.
Trade Setup
Entry: $70,500 – $71,200
Stop-Loss: $72,100
Targets: $69,500 - $68,500 - $67,000
Trade smart, protect your capital, and always manage your own risk. Personal analysis only not financial advice.
#BTC #BTCUSDC #CryptoSignals #BinanceSquare
{future}(BTCUSDT)
🔴 $BTC is showing strong bearish momentum, trading at $70,263 after a sharp 4.64% decline and approaching the recent low of $70,123. Price is below EMA(7) at $71,847, EMA(25) at $73,467, EMA(99) at $76,354, and bearish Supertrend at $73,671, confirming strong selling pressure. RSI(6) at 8.4 and StochRSI near zero indicate extreme oversold conditions, while negative MACD confirms bearish momentum; a short-term relief bounce is possible, but a breakdown below $70,123 could trigger further downside.
Trade Setup
Entry: $70,500 – $71,200
Stop-Loss: $72,100
Targets: $69,500 - $68,500 - $67,000
Trade smart, protect your capital, and always manage your own risk. Personal analysis only not financial advice.
#BTC #BTCUSDC #CryptoSignals #BinanceSquare
Trade Setup
Entry: $70,500 – $71,200
Stop-Loss: $72,100
Targets: $69,500 - $68,500 - $67,000
Trade smart, protect your capital, and always manage your own risk. Personal analysis only not financial advice.
#BTC #BTCUSDC #CryptoSignals #BinanceSquare
2
177

·
--
Bearish
$BTC
🚨 **$BTCUSDT - DOWNTREND CONTINUES | SHORT BIAS** 📉
**Price: $70,907.6 | -3.81% in 24h**
Breakdown confirmed overnight. BTC broke the key support $71,218 and fell straight to $70,907, making a new 24h low of $70,635.
**Why I'm BEARISH, not Bullish:**
Price is below all EMAs — EMA 7: $71,178, EMA 25: $71,694, EMA 99: $72,953
Below Bollinger Mid $71,520 and sitting on Lower Band $70,933
RSI (6): 16.1 — Extremely oversold
**My Plan — SHORT on Bounce, NOT at the bottom:**
Don't chase a short here at $70,907. RSI 16 is oversold, a bounce can come anytime.
**Short Zone:** $71,520 - $71,690
**Stop Loss:** $72,110
**Target 1:** $70,635
**Target 2:** $70,000
**Target 3:** $69,300
**Invalidation:** 1H close above $72,100 = Short idea cancelled.
**Long?** Only a scalp bounce from $70,635 support, target $71,178. No long against this trend.
Leverage: 3x - 5x Isolated only. No 20x+ here.
Bears are in control until BTC reclaims $71,520.
Do you agree — Short or Long from here? Comment below 👇
#BTC #bitcoin #BTCUSDT #CryptoTrading #Binance
$BTC
🚨 **$BTCUSDT - DOWNTREND CONTINUES | SHORT BIAS** 📉
**Price: $70,907.6 | -3.81% in 24h**
Breakdown confirmed overnight. BTC broke the key support $71,218 and fell straight to $70,907, making a new 24h low of $70,635.
**Why I'm BEARISH, not Bullish:**
Price is below all EMAs — EMA 7: $71,178, EMA 25: $71,694, EMA 99: $72,953
Below Bollinger Mid $71,520 and sitting on Lower Band $70,933
RSI (6): 16.1 — Extremely oversold
**My Plan — SHORT on Bounce, NOT at the bottom:**
Don't chase a short here at $70,907. RSI 16 is oversold, a bounce can come anytime.
**Short Zone:** $71,520 - $71,690
**Stop Loss:** $72,110
**Target 1:** $70,635
**Target 2:** $70,000
**Target 3:** $69,300
**Invalidation:** 1H close above $72,100 = Short idea cancelled.
**Long?** Only a scalp bounce from $70,635 support, target $71,178. No long against this trend.
Leverage: 3x - 5x Isolated only. No 20x+ here.
Bears are in control until BTC reclaims $71,520.
Do you agree — Short or Long from here? Comment below 👇
#BTC #bitcoin #BTCUSDT #CryptoTrading #Binance
🚨 **$BTCUSDT - DOWNTREND CONTINUES | SHORT BIAS** 📉
**Price: $70,907.6 | -3.81% in 24h**
Breakdown confirmed overnight. BTC broke the key support $71,218 and fell straight to $70,907, making a new 24h low of $70,635.
**Why I'm BEARISH, not Bullish:**
Price is below all EMAs — EMA 7: $71,178, EMA 25: $71,694, EMA 99: $72,953
Below Bollinger Mid $71,520 and sitting on Lower Band $70,933
RSI (6): 16.1 — Extremely oversold
**My Plan — SHORT on Bounce, NOT at the bottom:**
Don't chase a short here at $70,907. RSI 16 is oversold, a bounce can come anytime.
**Short Zone:** $71,520 - $71,690
**Stop Loss:** $72,110
**Target 1:** $70,635
**Target 2:** $70,000
**Target 3:** $69,300
**Invalidation:** 1H close above $72,100 = Short idea cancelled.
**Long?** Only a scalp bounce from $70,635 support, target $71,178. No long against this trend.
Leverage: 3x - 5x Isolated only. No 20x+ here.
Bears are in control until BTC reclaims $71,520.
Do you agree — Short or Long from here? Comment below 👇
#BTC #bitcoin #BTCUSDT #CryptoTrading #Binance
127

·
--
Article
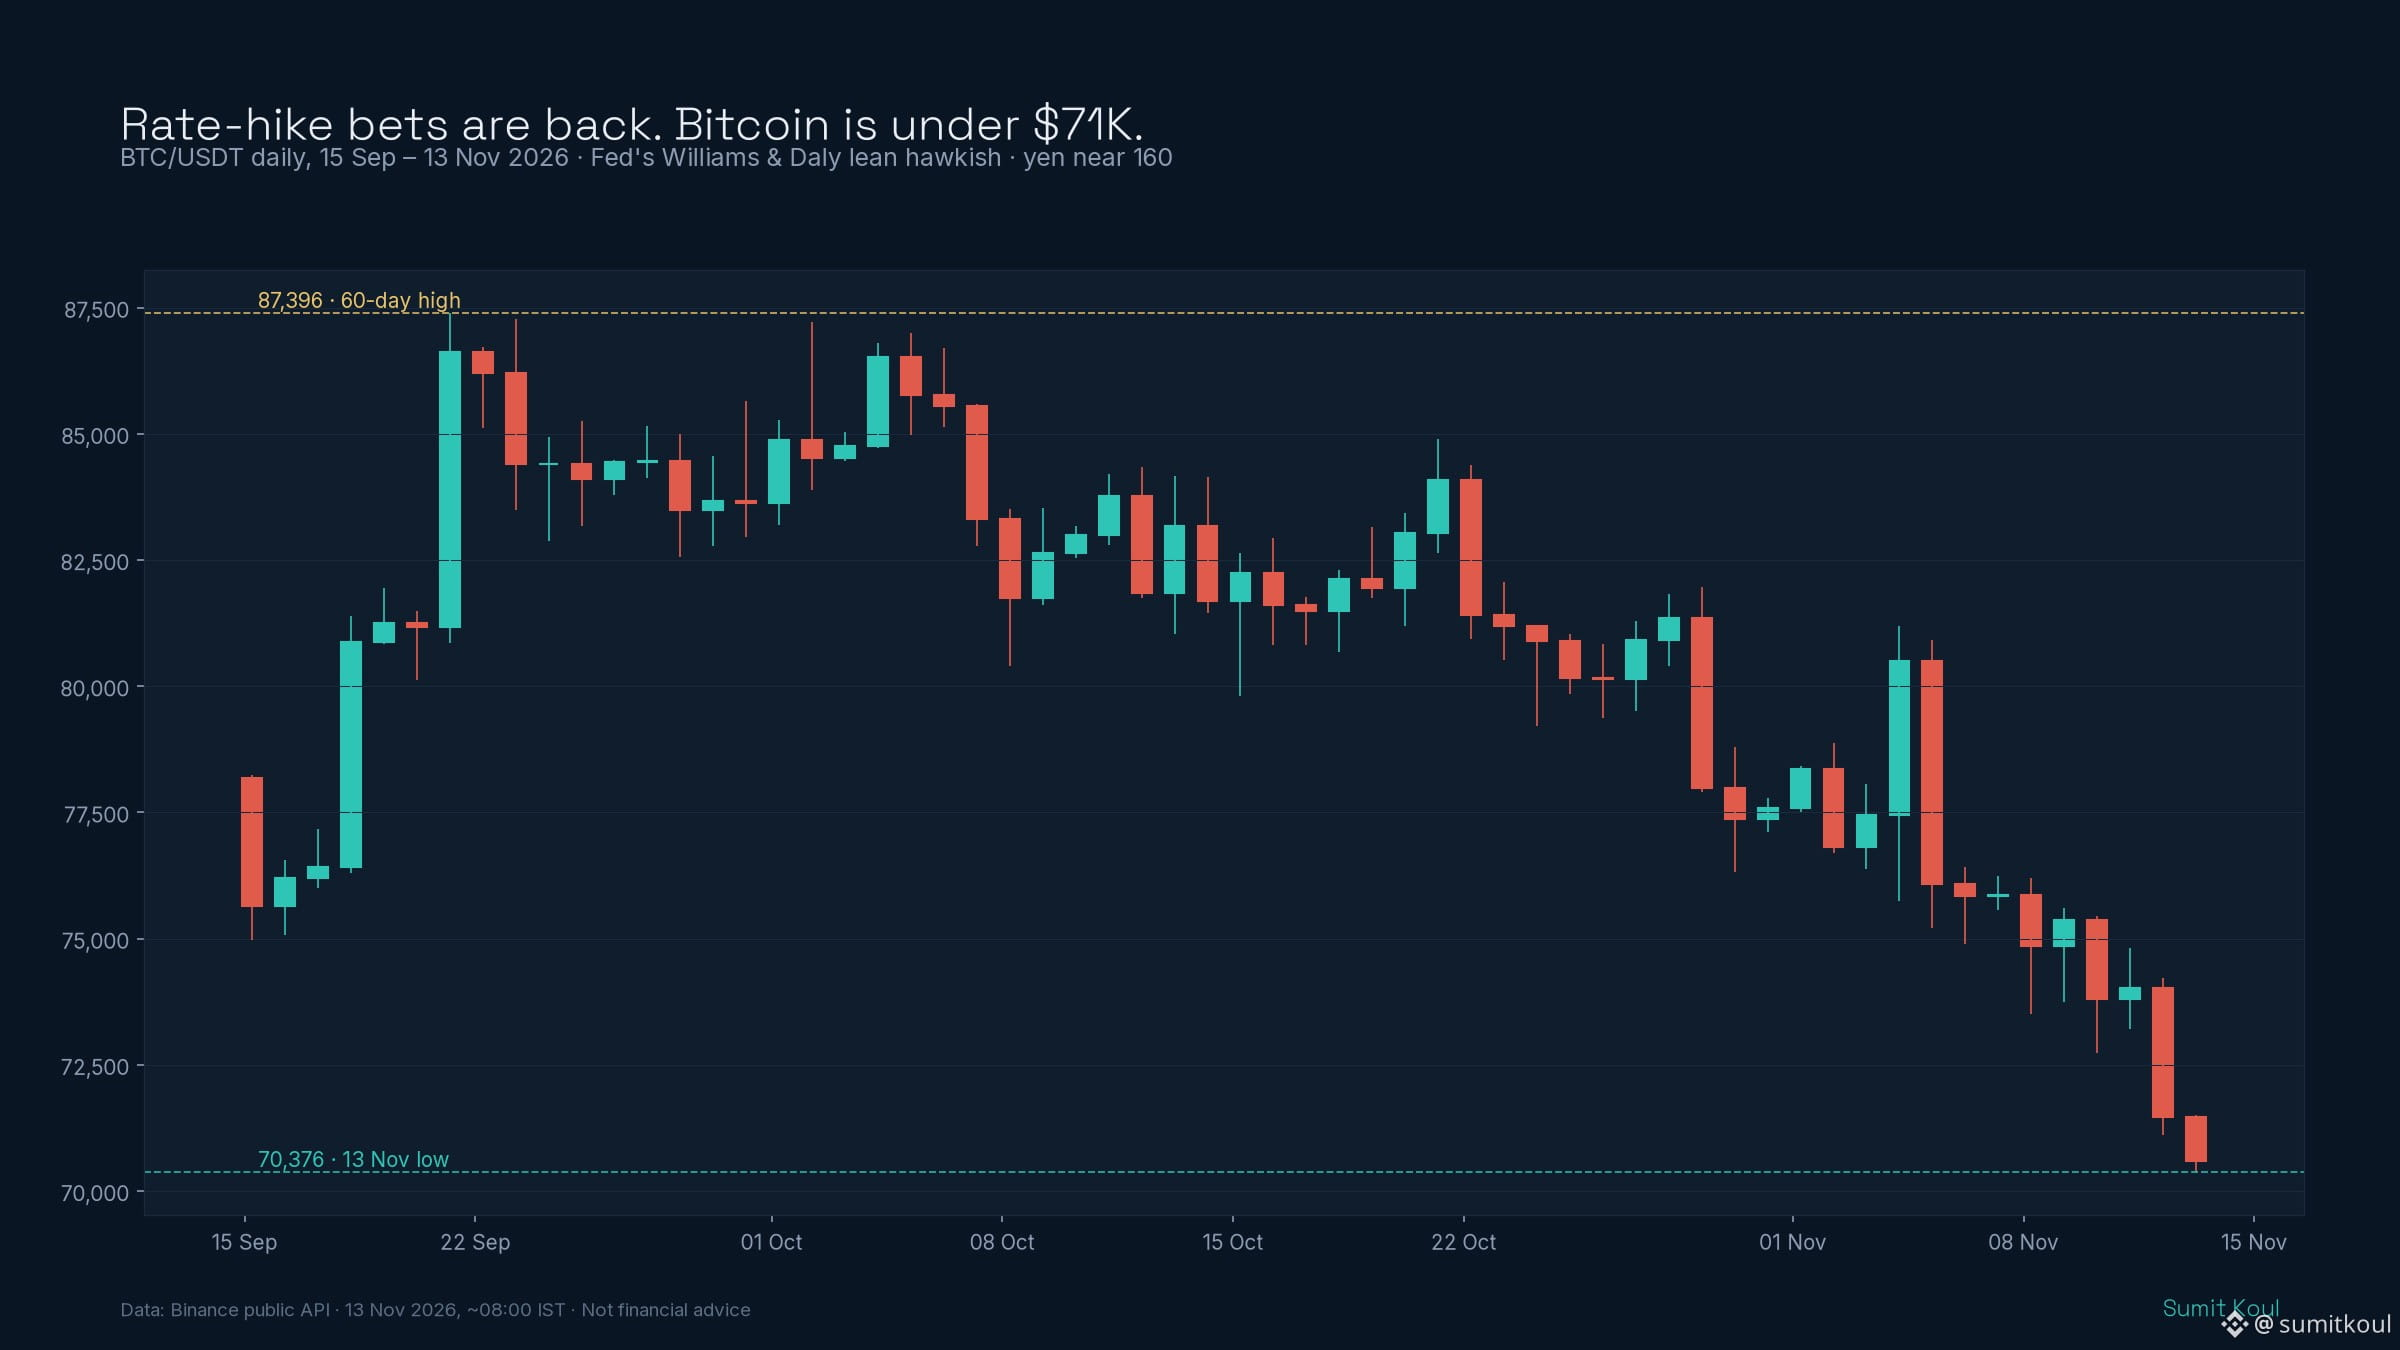
Rate-Hike Bets Are Back and Bitcoin Lost $71K: Fed Speakers, a 160 Yen and What the Chart SaysBitcoin printed 70,376 USDT on Binance early on 13 November IST. That is its lowest level since 20 August, and roughly 19% below the 60-day high of 87,396. Nothing in crypto broke overnight. The pressure came from the rates market, where traders are no longer only asking whether the Fed hikes in December. They are asking how far it goes after that.
Here is what moved, what the derivatives data says, and what I am watching next. This is market analysis, not financial advice.
## The rates tape got louder
Three things landed within a few hours of each other.
First, Fed speakers leaned hawkish. New York Fed President John Williams, a permanent FOMC voter, said US inflation is "far too high" and that more action is needed (Bloomberg). San Francisco Fed President Mary Daly said further rate increases will likely be needed and that businesses are increasingly considering price hikes.
Second, the pricing moved past December. CME FedWatch, as reported by Jin10, puts the chance of a 25 bp hike in December at 84.7% and a 50 bp hike at 15.3%. Out to January, the market gives a 64.7% chance of 50 bp of cumulative hikes and 10.9% for 75 bp. JPMorgan Asset Management's Kelsey Berro said a December hike is already priced. The open question is 2027.
Third, yields. CNBC reported the US 2-year yield at 4.87% and the 10-year above 5.11% after bond markets reopened on Thursday. 3Fourteen Research's Warren Pies warned that markets are not pricing two or more additional hikes.
When real yields push higher, non-yielding assets usually feel it first. Gold is sitting near a one-year low on the same hike bets. PAXG on Binance is down about 2% over 24 hours. Bitcoin is behaving like a rate-sensitive asset, not a hedge, at least this week.
## The yen is the second fuse
The yen briefly slipped below 160 per dollar overnight and was quoted at 159.84 in early Tokyo trade. Japan's Finance Minister Satsuki Katayama warned about "one-sided, rapid" moves and said Japan would consult the US Treasury and act if needed. Japan's policy rate is 1.25%, more than 2.5 percentage points below the Fed's. Separately, reports say the US Treasury used about $500 million in euros to support the yen, and the New York Fed said the Fed itself did not intervene in Q3.
Why should a crypto trader care? A weak yen near a level that has triggered intervention before is a volatility risk across global risk assets. Intervention or a sudden policy shift can force carry trades to unwind fast. Nobody can time that. But it is a reason not to treat this week's ranges as stable.
## What the BTC chart says
On the daily chart, Bitcoin has made a series of lower highs since the 29 October high near 81,971. The 12 November candle opened at 74,015 and closed at 71,460. The selling continued into the Asian morning, with the low at 70,376.
On the 1-hour chart, the levels I am using are simple:
- 72,000: the line BTC lost during the 12 November evening flush (IST). A reclaim and hold above it would say the move was a liquidity sweep, not a new leg down.
- 74,811: the 12 November high. That is where the move would need to go to repair the week.
- 70,376: today's low. A clean daily close under 70,000 would put the August lows back in focus.
## Derivatives: no panic yet
The perpetual futures data does not look like a capitulation.
BTCUSDT open interest on Binance Futures fell from about $7.38 billion to about $7.17 billion over the last 48 hours. That is around 3%, while price fell more than that. Some leverage has been closed, but this is not a wipe-out. Funding has stayed positive, with the latest BTC print around 0.0087% and recent prints ranging from about 0.0035% to 0.01% per 8 hours. Longs are still paying shorts, which tells me dip buyers have not given up.
ETH open interest has barely moved, at about $4.7 billion. ETH/BTC is up about 1.65% over 24 hours. On-chain analyst Ember flagged three addresses, which he suspects are linked to Erik Voorhees, buying 23,091 ETH for 47.36 million USDT at an average of $2,051. That is a single wallet cluster, not a trend, but it helps explain why ETH is holding around 2,000 better than BTC is holding 71,000.
## How I am framing the next 24 hours
- Base case: a choppy range between 70,000 and 72,000 while the rates market digests Fed speakers. Positive funding without a flush means the market is still leaning long, which can cap bounces.
- Bullish case: BTC reclaims and holds 72,000, funding stays calm and OI rebuilds slowly. That would point to a sweep below 71,000, not a breakdown.
- Bearish case: a daily close below 70,000, especially alongside a yen shock or another jump in yields, opens room toward the August area.
Risk management matters more than direction here. Size down when macro is driving, keep stops outside obvious liquidity pools, and avoid adding leverage just because funding looks "normal."
Not financial advice. Do your own research.
#Bitcoin #FedRateHike #BTC #Macro
$BTC $ETH $PAXG
Rate-Hike Bets Are Back and Bitcoin Lost $71K: Fed Speakers, a 160 Yen and What the Chart Says
Bitcoin printed 70,376 USDT on Binance early on 13 November IST. That is its lowest level since 20 August, and roughly 19% below the 60-day high of 87,396. Nothing in crypto broke overnight. The pressure came from the rates market, where traders are no longer only asking whether the Fed hikes in December. They are asking how far it goes after that.
Here is what moved, what the derivatives data says, and what I am watching next. This is market analysis, not financial advice.
## The rates tape got louder
Three things landed within a few hours of each other.
First, Fed speakers leaned hawkish. New York Fed President John Williams, a permanent FOMC voter, said US inflation is "far too high" and that more action is needed (Bloomberg). San Francisco Fed President Mary Daly said further rate increases will likely be needed and that businesses are increasingly considering price hikes.
Second, the pricing moved past December. CME FedWatch, as reported by Jin10, puts the chance of a 25 bp hike in December at 84.7% and a 50 bp hike at 15.3%. Out to January, the market gives a 64.7% chance of 50 bp of cumulative hikes and 10.9% for 75 bp. JPMorgan Asset Management's Kelsey Berro said a December hike is already priced. The open question is 2027.
Third, yields. CNBC reported the US 2-year yield at 4.87% and the 10-year above 5.11% after bond markets reopened on Thursday. 3Fourteen Research's Warren Pies warned that markets are not pricing two or more additional hikes.
When real yields push higher, non-yielding assets usually feel it first. Gold is sitting near a one-year low on the same hike bets. PAXG on Binance is down about 2% over 24 hours. Bitcoin is behaving like a rate-sensitive asset, not a hedge, at least this week.
## The yen is the second fuse
The yen briefly slipped below 160 per dollar overnight and was quoted at 159.84 in early Tokyo trade. Japan's Finance Minister Satsuki Katayama warned about "one-sided, rapid" moves and said Japan would consult the US Treasury and act if needed. Japan's policy rate is 1.25%, more than 2.5 percentage points below the Fed's. Separately, reports say the US Treasury used about $500 million in euros to support the yen, and the New York Fed said the Fed itself did not intervene in Q3.
Why should a crypto trader care? A weak yen near a level that has triggered intervention before is a volatility risk across global risk assets. Intervention or a sudden policy shift can force carry trades to unwind fast. Nobody can time that. But it is a reason not to treat this week's ranges as stable.
## What the BTC chart says
On the daily chart, Bitcoin has made a series of lower highs since the 29 October high near 81,971. The 12 November candle opened at 74,015 and closed at 71,460. The selling continued into the Asian morning, with the low at 70,376.
On the 1-hour chart, the levels I am using are simple:
- 72,000: the line BTC lost during the 12 November evening flush (IST). A reclaim and hold above it would say the move was a liquidity sweep, not a new leg down.
- 74,811: the 12 November high. That is where the move would need to go to repair the week.
- 70,376: today's low. A clean daily close under 70,000 would put the August lows back in focus.
## Derivatives: no panic yet
The perpetual futures data does not look like a capitulation.
BTCUSDT open interest on Binance Futures fell from about $7.38 billion to about $7.17 billion over the last 48 hours. That is around 3%, while price fell more than that. Some leverage has been closed, but this is not a wipe-out. Funding has stayed positive, with the latest BTC print around 0.0087% and recent prints ranging from about 0.0035% to 0.01% per 8 hours. Longs are still paying shorts, which tells me dip buyers have not given up.
ETH open interest has barely moved, at about $4.7 billion. ETH/BTC is up about 1.65% over 24 hours. On-chain analyst Ember flagged three addresses, which he suspects are linked to Erik Voorhees, buying 23,091 ETH for 47.36 million USDT at an average of $2,051. That is a single wallet cluster, not a trend, but it helps explain why ETH is holding around 2,000 better than BTC is holding 71,000.
## How I am framing the next 24 hours
- Base case: a choppy range between 70,000 and 72,000 while the rates market digests Fed speakers. Positive funding without a flush means the market is still leaning long, which can cap bounces.
- Bullish case: BTC reclaims and holds 72,000, funding stays calm and OI rebuilds slowly. That would point to a sweep below 71,000, not a breakdown.
- Bearish case: a daily close below 70,000, especially alongside a yen shock or another jump in yields, opens room toward the August area.
Risk management matters more than direction here. Size down when macro is driving, keep stops outside obvious liquidity pools, and avoid adding leverage just because funding looks "normal."
Not financial advice. Do your own research.
#Bitcoin #FedRateHike #BTC #Macro
$BTC $ETH $PAXG
Here is what moved, what the derivatives data says, and what I am watching next. This is market analysis, not financial advice.
## The rates tape got louder
Three things landed within a few hours of each other.
First, Fed speakers leaned hawkish. New York Fed President John Williams, a permanent FOMC voter, said US inflation is "far too high" and that more action is needed (Bloomberg). San Francisco Fed President Mary Daly said further rate increases will likely be needed and that businesses are increasingly considering price hikes.
Second, the pricing moved past December. CME FedWatch, as reported by Jin10, puts the chance of a 25 bp hike in December at 84.7% and a 50 bp hike at 15.3%. Out to January, the market gives a 64.7% chance of 50 bp of cumulative hikes and 10.9% for 75 bp. JPMorgan Asset Management's Kelsey Berro said a December hike is already priced. The open question is 2027.
Third, yields. CNBC reported the US 2-year yield at 4.87% and the 10-year above 5.11% after bond markets reopened on Thursday. 3Fourteen Research's Warren Pies warned that markets are not pricing two or more additional hikes.
When real yields push higher, non-yielding assets usually feel it first. Gold is sitting near a one-year low on the same hike bets. PAXG on Binance is down about 2% over 24 hours. Bitcoin is behaving like a rate-sensitive asset, not a hedge, at least this week.
## The yen is the second fuse
The yen briefly slipped below 160 per dollar overnight and was quoted at 159.84 in early Tokyo trade. Japan's Finance Minister Satsuki Katayama warned about "one-sided, rapid" moves and said Japan would consult the US Treasury and act if needed. Japan's policy rate is 1.25%, more than 2.5 percentage points below the Fed's. Separately, reports say the US Treasury used about $500 million in euros to support the yen, and the New York Fed said the Fed itself did not intervene in Q3.
Why should a crypto trader care? A weak yen near a level that has triggered intervention before is a volatility risk across global risk assets. Intervention or a sudden policy shift can force carry trades to unwind fast. Nobody can time that. But it is a reason not to treat this week's ranges as stable.
## What the BTC chart says
On the daily chart, Bitcoin has made a series of lower highs since the 29 October high near 81,971. The 12 November candle opened at 74,015 and closed at 71,460. The selling continued into the Asian morning, with the low at 70,376.
On the 1-hour chart, the levels I am using are simple:
- 72,000: the line BTC lost during the 12 November evening flush (IST). A reclaim and hold above it would say the move was a liquidity sweep, not a new leg down.
- 74,811: the 12 November high. That is where the move would need to go to repair the week.
- 70,376: today's low. A clean daily close under 70,000 would put the August lows back in focus.
## Derivatives: no panic yet
The perpetual futures data does not look like a capitulation.
BTCUSDT open interest on Binance Futures fell from about $7.38 billion to about $7.17 billion over the last 48 hours. That is around 3%, while price fell more than that. Some leverage has been closed, but this is not a wipe-out. Funding has stayed positive, with the latest BTC print around 0.0087% and recent prints ranging from about 0.0035% to 0.01% per 8 hours. Longs are still paying shorts, which tells me dip buyers have not given up.
ETH open interest has barely moved, at about $4.7 billion. ETH/BTC is up about 1.65% over 24 hours. On-chain analyst Ember flagged three addresses, which he suspects are linked to Erik Voorhees, buying 23,091 ETH for 47.36 million USDT at an average of $2,051. That is a single wallet cluster, not a trend, but it helps explain why ETH is holding around 2,000 better than BTC is holding 71,000.
## How I am framing the next 24 hours
- Base case: a choppy range between 70,000 and 72,000 while the rates market digests Fed speakers. Positive funding without a flush means the market is still leaning long, which can cap bounces.
- Bullish case: BTC reclaims and holds 72,000, funding stays calm and OI rebuilds slowly. That would point to a sweep below 71,000, not a breakdown.
- Bearish case: a daily close below 70,000, especially alongside a yen shock or another jump in yields, opens room toward the August area.
Risk management matters more than direction here. Size down when macro is driving, keep stops outside obvious liquidity pools, and avoid adding leverage just because funding looks "normal."
Not financial advice. Do your own research.
#Bitcoin #FedRateHike #BTC #Macro
$BTC $ETH $PAXG
138

·
--
Bearish
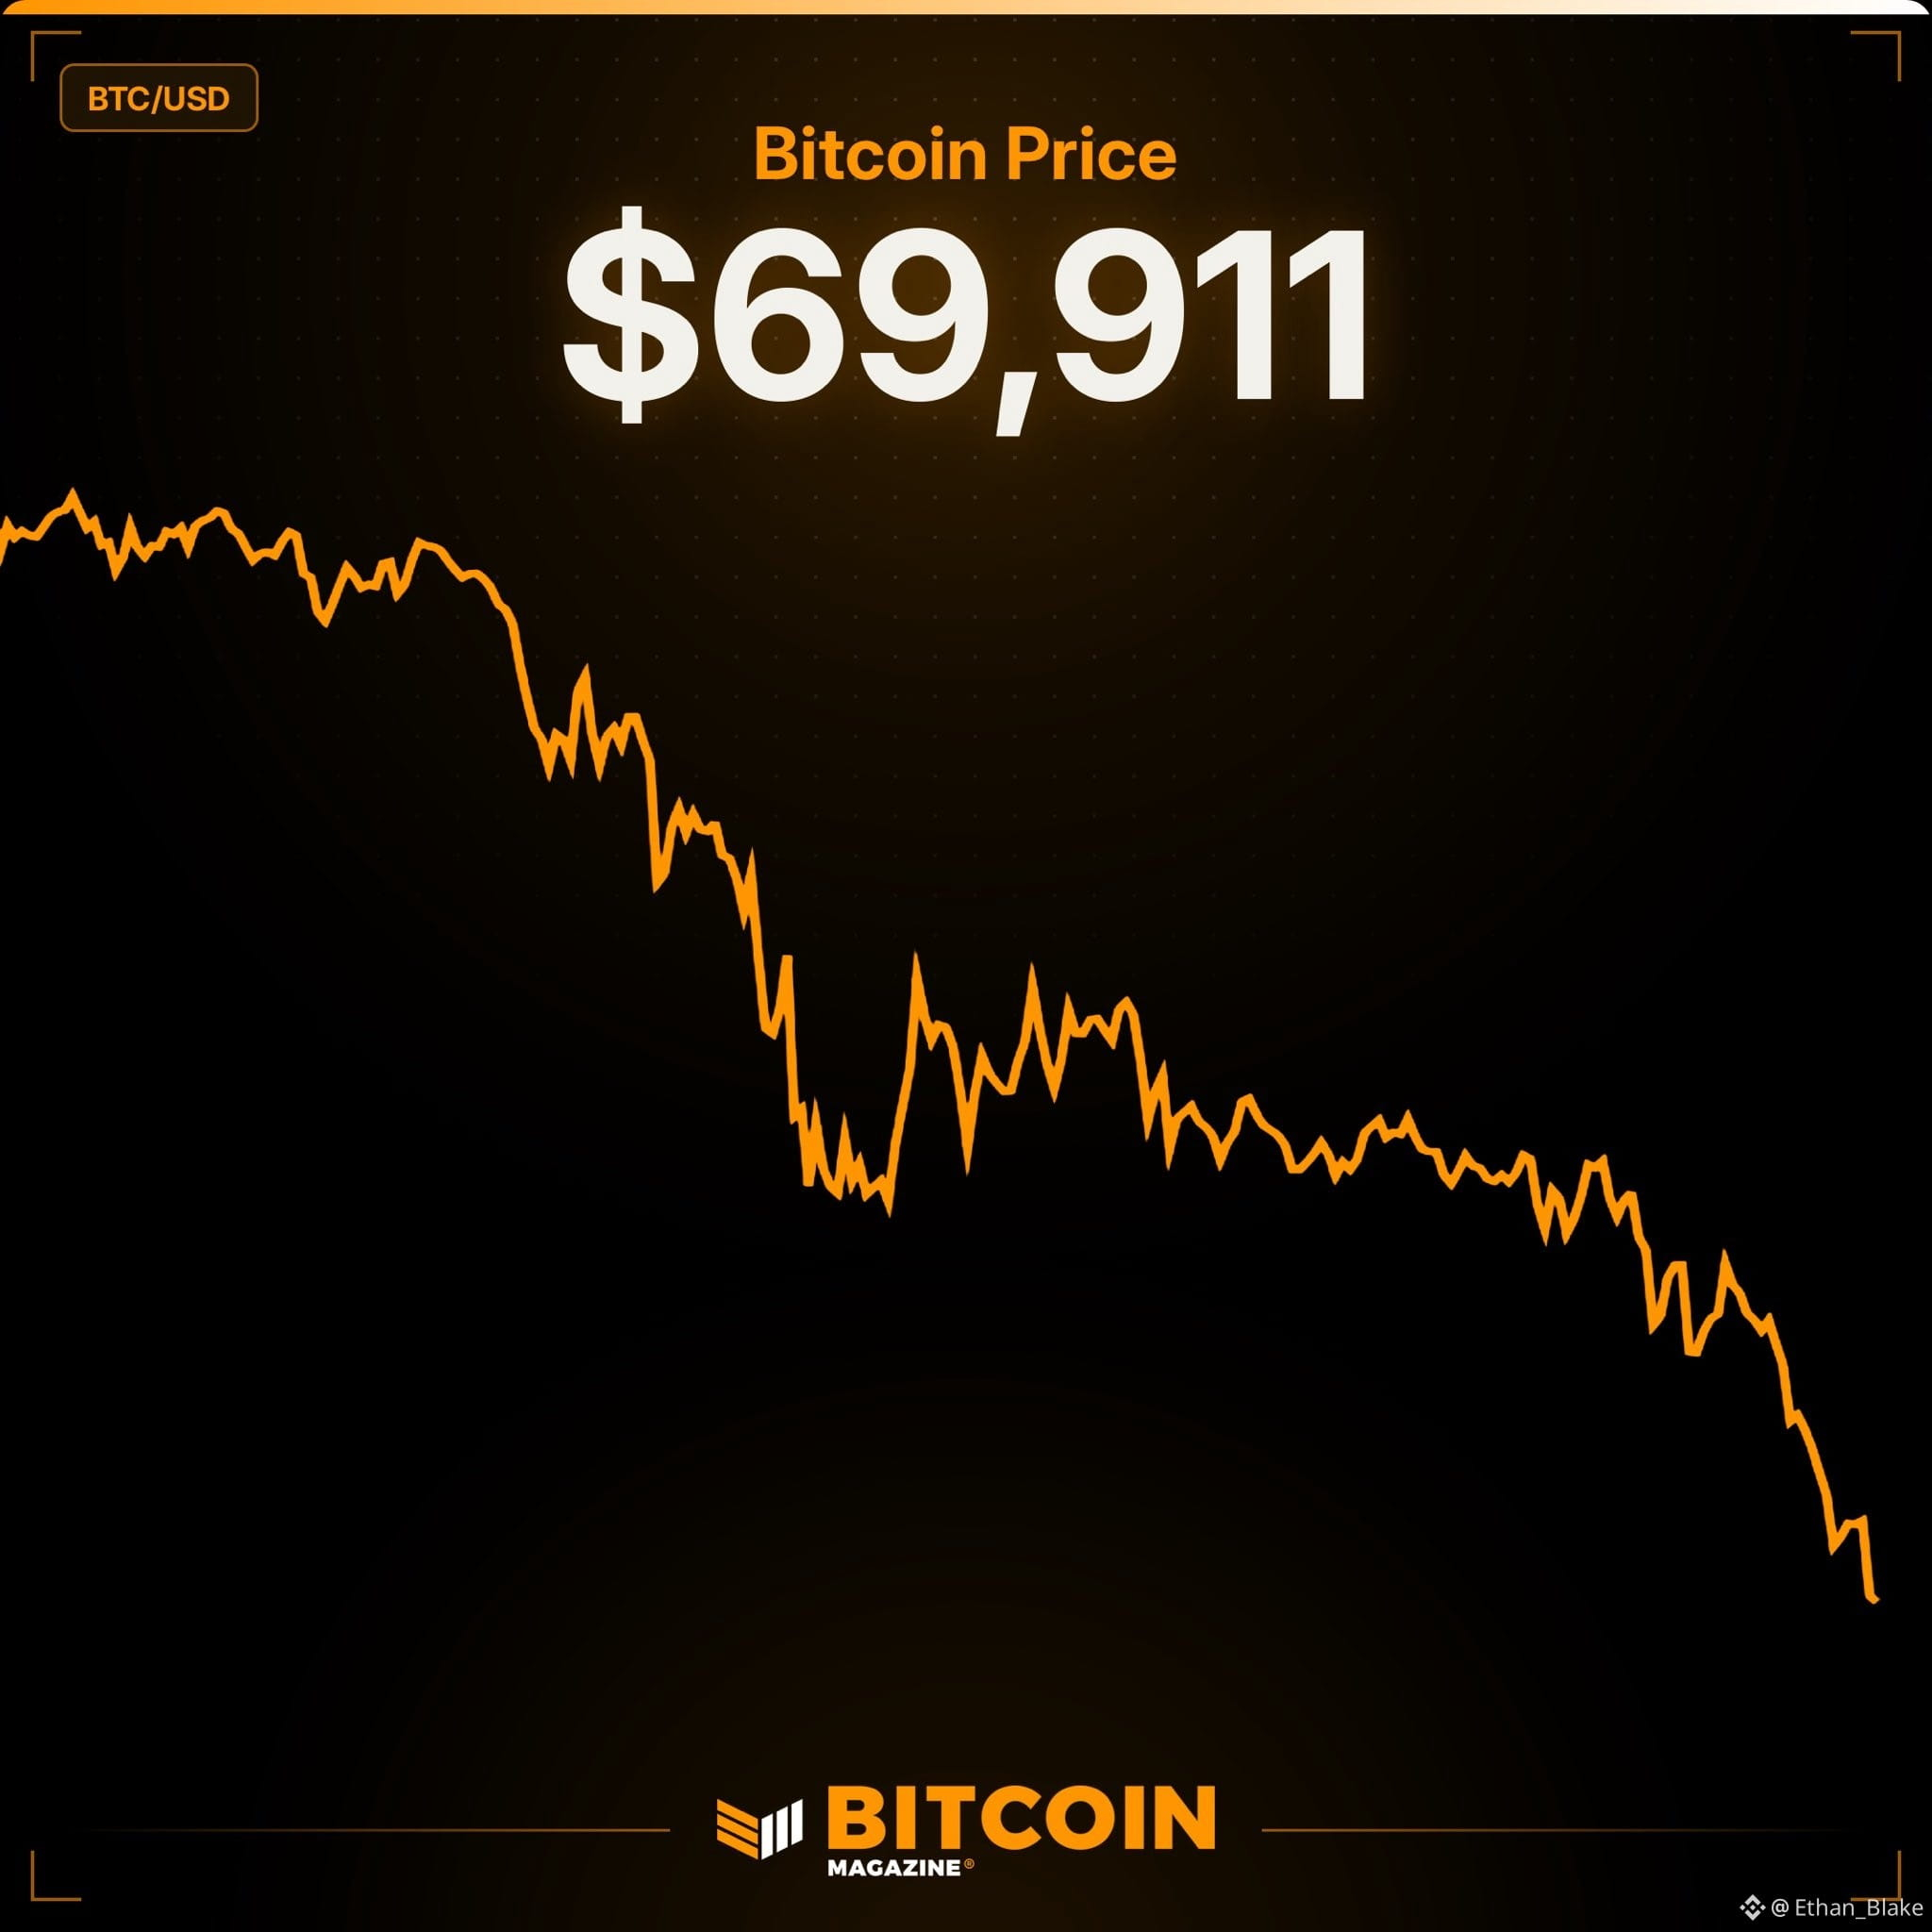
JUST IN: Bitcoin just lost the $70K level. 👀
Not gonna lie, seeing $BTC below 70K again is not a comfortable sight, especially after all those attempts to stay above it.
Price is now around $69,911 and the chart is looking pretty rough. Sellers are clearly putting pressure on the market.
But here's the thing...
I'm not rushing to panic sell, and I'm definitely not blindly buying this dip either.
I want to see whether $BTC can reclaim $70K or if that level turns into resistance. A weak bounce could easily become another liquidity grab.
For now, patience. No need to catch every falling candle.
HODL if your conviction is still there, but don't ignore risk.
Real question: Are you buying BTC below $70K, holding your bags, or expecting another leg down? 👀
#Bitcoin #BTC #CryptoMarket #BinanceSquare
{future}(BTCUSDT)
JUST IN: Bitcoin just lost the $70K level. 👀
Not gonna lie, seeing $BTC below 70K again is not a comfortable sight, especially after all those attempts to stay above it.
Price is now around $69,911 and the chart is looking pretty rough. Sellers are clearly putting pressure on the market.
But here's the thing...
I'm not rushing to panic sell, and I'm definitely not blindly buying this dip either.
I want to see whether $BTC can reclaim $70K or if that level turns into resistance. A weak bounce could easily become another liquidity grab.
For now, patience. No need to catch every falling candle.
HODL if your conviction is still there, but don't ignore risk.
Real question: Are you buying BTC below $70K, holding your bags, or expecting another leg down? 👀
#Bitcoin #BTC #CryptoMarket #BinanceSquare
Not gonna lie, seeing $BTC below 70K again is not a comfortable sight, especially after all those attempts to stay above it.
Price is now around $69,911 and the chart is looking pretty rough. Sellers are clearly putting pressure on the market.
But here's the thing...
I'm not rushing to panic sell, and I'm definitely not blindly buying this dip either.
I want to see whether $BTC can reclaim $70K or if that level turns into resistance. A weak bounce could easily become another liquidity grab.
For now, patience. No need to catch every falling candle.
HODL if your conviction is still there, but don't ignore risk.
Real question: Are you buying BTC below $70K, holding your bags, or expecting another leg down? 👀
#Bitcoin #BTC #CryptoMarket #BinanceSquare
13
·
--
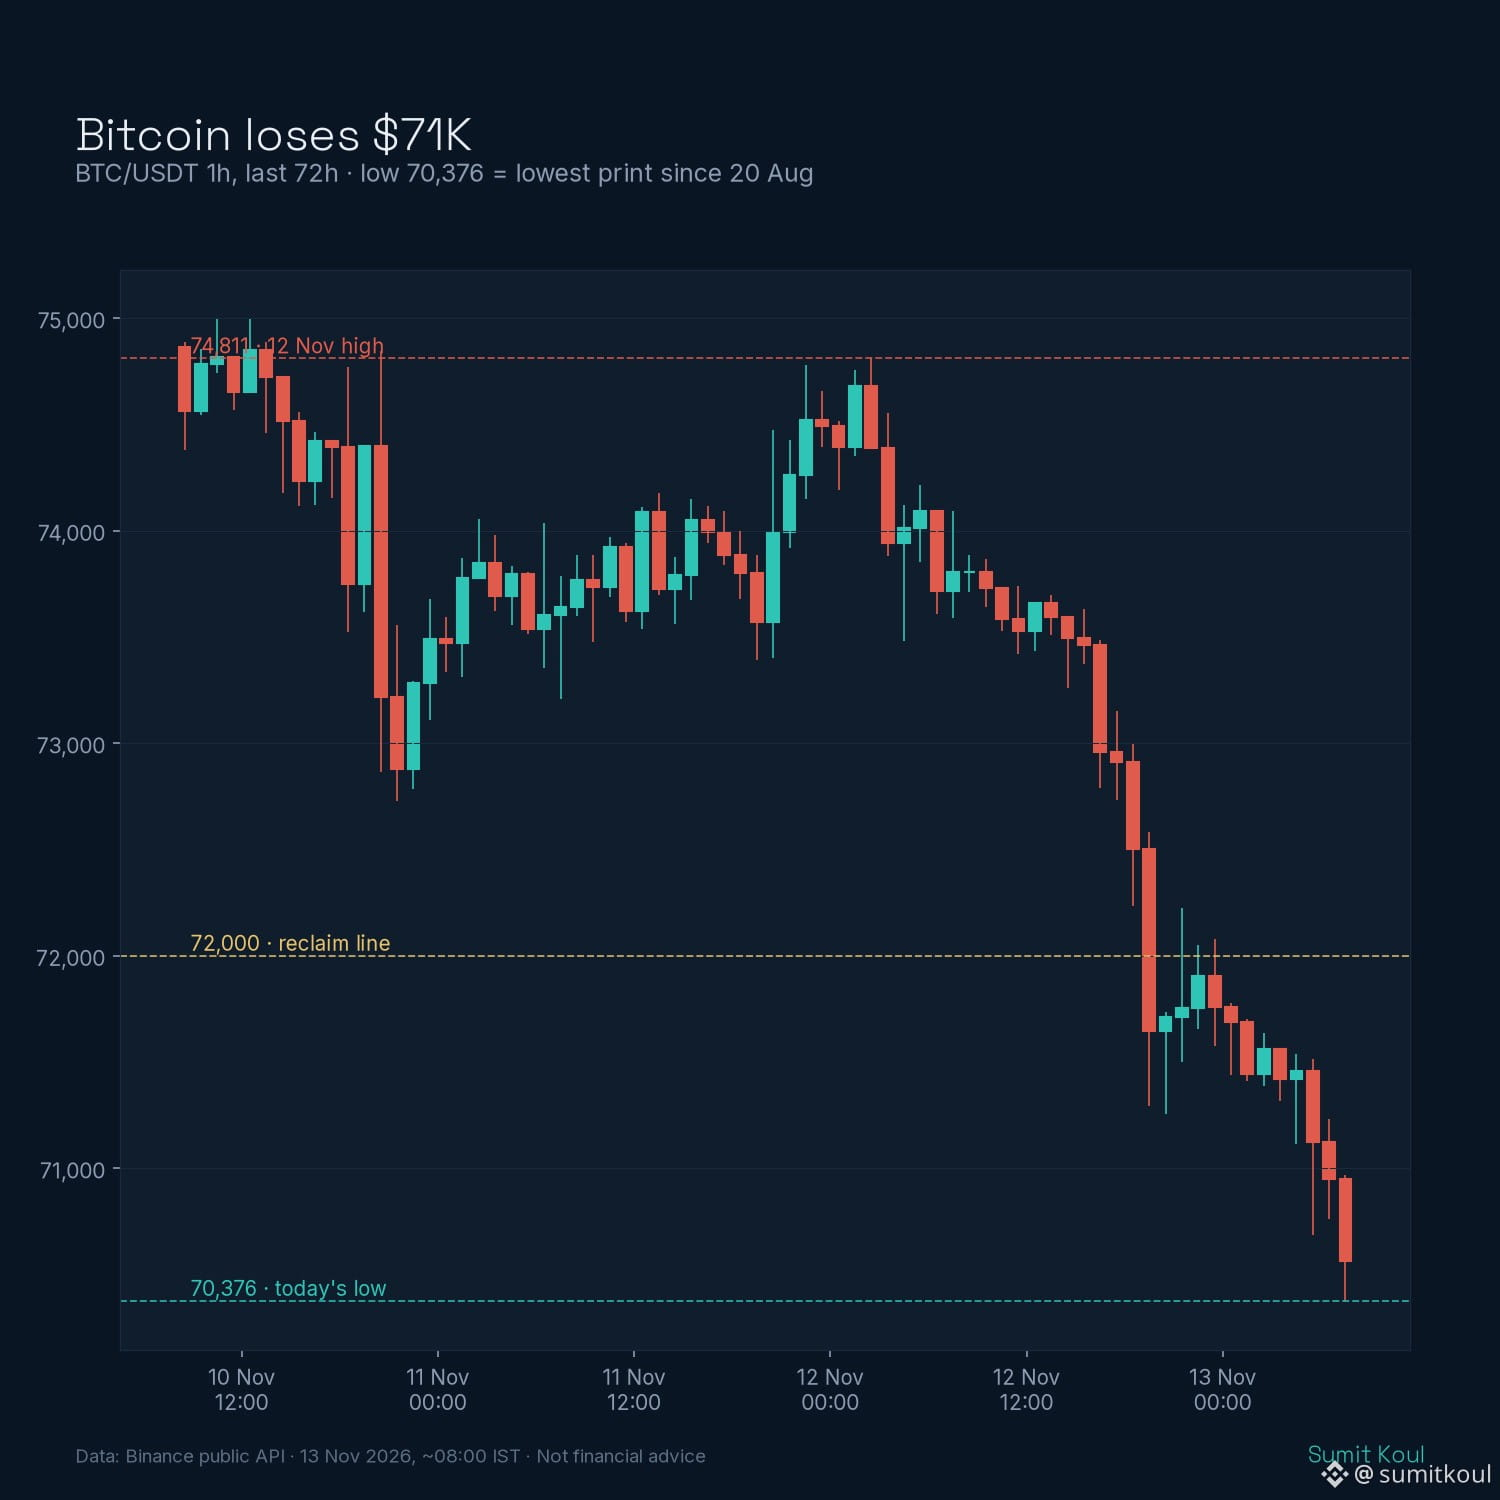
$BTC just printed 70,376 on Binance, its lowest level since 20 August.
Nothing broke in crypto overnight. The pressure is coming from rates: Fed's Williams says inflation is "far too high" and Daly sees more hikes ahead.
Levels I'm watching on the 1h:
• 72,000 = reclaim line
• 74,811 = 12 Nov high
• Daily close under 70,000 = August lows back in play
Full breakdown (Fed pricing, yen at 160, funding & OI):
https://binance.bnstatic.com/en/square/post/387669186530211
Not financial advice.
#Bitcoin #BTC #FedRateHike
$BTC just printed 70,376 on Binance, its lowest level since 20 August.
Nothing broke in crypto overnight. The pressure is coming from rates: Fed's Williams says inflation is "far too high" and Daly sees more hikes ahead.
Levels I'm watching on the 1h:
• 72,000 = reclaim line
• 74,811 = 12 Nov high
• Daily close under 70,000 = August lows back in play
Full breakdown (Fed pricing, yen at 160, funding & OI):
https://binance.bnstatic.com/en/square/post/387669186530211
Not financial advice.
#Bitcoin #BTC #FedRateHike
Nothing broke in crypto overnight. The pressure is coming from rates: Fed's Williams says inflation is "far too high" and Daly sees more hikes ahead.
Levels I'm watching on the 1h:
• 72,000 = reclaim line
• 74,811 = 12 Nov high
• Daily close under 70,000 = August lows back in play
Full breakdown (Fed pricing, yen at 160, funding & OI):
https://binance.bnstatic.com/en/square/post/387669186530211
Not financial advice.
#Bitcoin #BTC #FedRateHike
55

·
--
Here's a reworded version with a distinct structure and voice:
BTC Exit Strategy (Long Position):
· $72,100 → close 30%
· $72,600 → close another 30%
· $73,500 → close the final 40%
· Below $70,000 → exit everything
No second-guessing. Execute as written.
Reality check: even with Black Friday here, a push to $72,588 is anything but assured. If that level holds firm as Friday's ceiling, the deep bear has already begun. Load up on essentials — and brace for a downturn that could run a full 12 months. #BTC $BTC
Here's a reworded version with a distinct structure and voice:
BTC Exit Strategy (Long Position):
· $72,100 → close 30%
· $72,600 → close another 30%
· $73,500 → close the final 40%
· Below $70,000 → exit everything
No second-guessing. Execute as written.
Reality check: even with Black Friday here, a push to $72,588 is anything but assured. If that level holds firm as Friday's ceiling, the deep bear has already begun. Load up on essentials — and brace for a downturn that could run a full 12 months. #BTC $BTC
BTC Exit Strategy (Long Position):
· $72,100 → close 30%
· $72,600 → close another 30%
· $73,500 → close the final 40%
· Below $70,000 → exit everything
No second-guessing. Execute as written.
Reality check: even with Black Friday here, a push to $72,588 is anything but assured. If that level holds firm as Friday's ceiling, the deep bear has already begun. Load up on essentials — and brace for a downturn that could run a full 12 months. #BTC $BTC
118

·
--
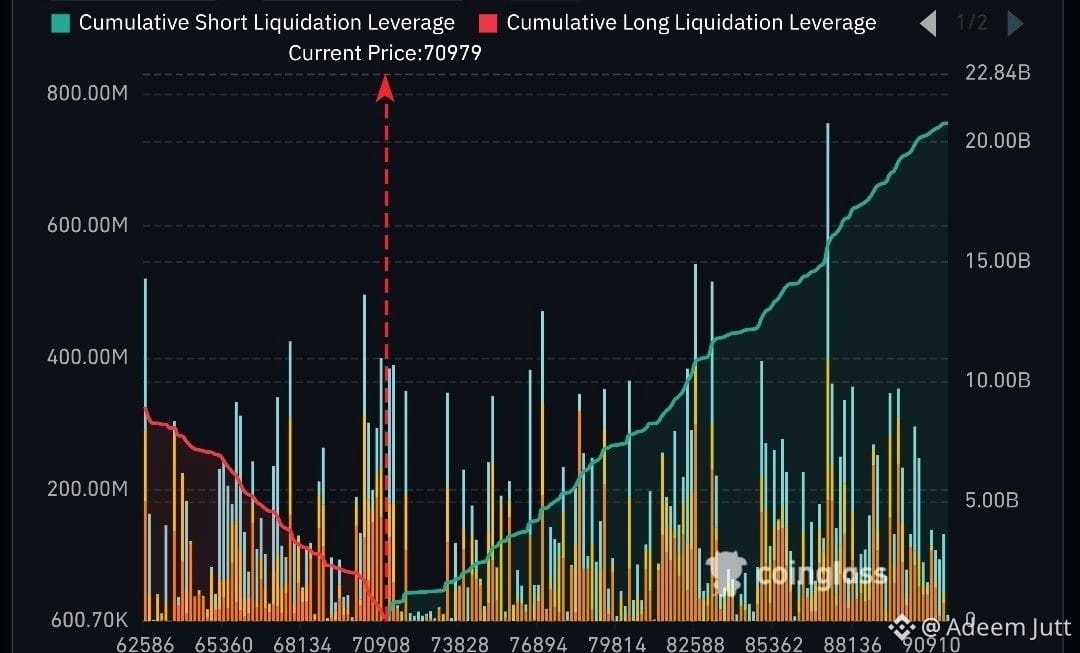
At $64K, $8.2 billion in bets that Bitcoin would go up were wiped out. At $91K, $20.2 billion in bets that it would go down were lost.
No one knows exactly when Bitcoin will bounce back. It could be at $71K or $64K.
But one thing is certain: the richest man in crypto will get richer.
CZ of Binance is still the unbeatable champion of crypto.
$BTC $BARD
{spot}(BTCUSDT)
#CZ #BTC #HuangExitNvidiaStrategyInFocus #AnthropicRejectsIPODelayValuationinQuestion #HedgeFundsCMEBitcoinNetShortsFall89%
At $64K, $8.2 billion in bets that Bitcoin would go up were wiped out. At $91K, $20.2 billion in bets that it would go down were lost.
No one knows exactly when Bitcoin will bounce back. It could be at $71K or $64K.
But one thing is certain: the richest man in crypto will get richer.
CZ of Binance is still the unbeatable champion of crypto.
$BTC $BARD
#CZ #BTC #HuangExitNvidiaStrategyInFocus #AnthropicRejectsIPODelayValuationinQuestion #HedgeFundsCMEBitcoinNetShortsFall89%
No one knows exactly when Bitcoin will bounce back. It could be at $71K or $64K.
But one thing is certain: the richest man in crypto will get richer.
CZ of Binance is still the unbeatable champion of crypto.
$BTC $BARD
#CZ #BTC #HuangExitNvidiaStrategyInFocus #AnthropicRejectsIPODelayValuationinQuestion #HedgeFundsCMEBitcoinNetShortsFall89%
1
1
334

·
--
⚠️ BTC 30-Day Technical Breakdown — Bears in Control
Bitcoin has shed ~$13,400 (-15.8%) over the past 30 days, dropping from a cycle high of $84,898 down to $71,460. The structure is clean and bearish — lower highs, lower lows, and price now trading well below both moving averages.
📊 Key Levels
• Current Price: $71,460
• 30D High: $84,898 | 30D Low: $71,113
• MA7: $73,829 (resistance)
• MA25: $77,919 (major resistance)
🔴 Resistance Zones
• $73,800–$74,000 — MA7 zone, first ceiling
• $77,900–$78,400 — MA25 + prior consolidation
• $80,500–$81,000 — heavy supply zone, multiple rejections
🟢 Support Zones
• $71,100–$71,500 — current floor, 30D low cluster
• $73,200–$73,500 — minor demand, previous lows
📉 Volume Tells the Story
The two biggest volume days of the past month were red — Day 22 saw 26,060 BTC sold (the highest in 30 days) as price collapsed from $80,504 to $76,088. That’s distribution, not accumulation.
Recent 7-day volume has dropped to 11,172 BTC/day (below the 30D avg of 13,972), suggesting weak bounce attempts rather than genuine demand recovery.
👀 What Traders Should Watch
1. Can BTC hold $71,100? A clean break below prints new 30D lows and opens the door to $68K–$69K.
2. Any bounce into $73,800–$74,000 (MA7) needs high volume to flip that level — otherwise it’s a shorting opportunity.
3. MA25 at $77,919 is the bulls’ key hurdle. Reclaiming it on strong volume would signal a real trend reversal.
4. Watch for a volume divergence — if price tests $71,100 again on declining volume, a relief bounce is likely.
Until price reclaims $77,900+ with conviction, every bounce is a lower high until proven otherwise.
#BTC #Bitcoin #Crypto #TechnicalAnalysis
⚠️ BTC 30-Day Technical Breakdown — Bears in Control
Bitcoin has shed ~$13,400 (-15.8%) over the past 30 days, dropping from a cycle high of $84,898 down to $71,460. The structure is clean and bearish — lower highs, lower lows, and price now trading well below both moving averages.
📊 Key Levels
• Current Price: $71,460
• 30D High: $84,898 | 30D Low: $71,113
• MA7: $73,829 (resistance)
• MA25: $77,919 (major resistance)
🔴 Resistance Zones
• $73,800–$74,000 — MA7 zone, first ceiling
• $77,900–$78,400 — MA25 + prior consolidation
• $80,500–$81,000 — heavy supply zone, multiple rejections
🟢 Support Zones
• $71,100–$71,500 — current floor, 30D low cluster
• $73,200–$73,500 — minor demand, previous lows
📉 Volume Tells the Story
The two biggest volume days of the past month were red — Day 22 saw 26,060 BTC sold (the highest in 30 days) as price collapsed from $80,504 to $76,088. That’s distribution, not accumulation.
Recent 7-day volume has dropped to 11,172 BTC/day (below the 30D avg of 13,972), suggesting weak bounce attempts rather than genuine demand recovery.
👀 What Traders Should Watch
1. Can BTC hold $71,100? A clean break below prints new 30D lows and opens the door to $68K–$69K.
2. Any bounce into $73,800–$74,000 (MA7) needs high volume to flip that level — otherwise it’s a shorting opportunity.
3. MA25 at $77,919 is the bulls’ key hurdle. Reclaiming it on strong volume would signal a real trend reversal.
4. Watch for a volume divergence — if price tests $71,100 again on declining volume, a relief bounce is likely.
Until price reclaims $77,900+ with conviction, every bounce is a lower high until proven otherwise.
#BTC #Bitcoin #Crypto #TechnicalAnalysis
Bitcoin has shed ~$13,400 (-15.8%) over the past 30 days, dropping from a cycle high of $84,898 down to $71,460. The structure is clean and bearish — lower highs, lower lows, and price now trading well below both moving averages.
📊 Key Levels
• Current Price: $71,460
• 30D High: $84,898 | 30D Low: $71,113
• MA7: $73,829 (resistance)
• MA25: $77,919 (major resistance)
🔴 Resistance Zones
• $73,800–$74,000 — MA7 zone, first ceiling
• $77,900–$78,400 — MA25 + prior consolidation
• $80,500–$81,000 — heavy supply zone, multiple rejections
🟢 Support Zones
• $71,100–$71,500 — current floor, 30D low cluster
• $73,200–$73,500 — minor demand, previous lows
📉 Volume Tells the Story
The two biggest volume days of the past month were red — Day 22 saw 26,060 BTC sold (the highest in 30 days) as price collapsed from $80,504 to $76,088. That’s distribution, not accumulation.
Recent 7-day volume has dropped to 11,172 BTC/day (below the 30D avg of 13,972), suggesting weak bounce attempts rather than genuine demand recovery.
👀 What Traders Should Watch
1. Can BTC hold $71,100? A clean break below prints new 30D lows and opens the door to $68K–$69K.
2. Any bounce into $73,800–$74,000 (MA7) needs high volume to flip that level — otherwise it’s a shorting opportunity.
3. MA25 at $77,919 is the bulls’ key hurdle. Reclaiming it on strong volume would signal a real trend reversal.
4. Watch for a volume divergence — if price tests $71,100 again on declining volume, a relief bounce is likely.
Until price reclaims $77,900+ with conviction, every bounce is a lower high until proven otherwise.
#BTC #Bitcoin #Crypto #TechnicalAnalysis
149

·
--
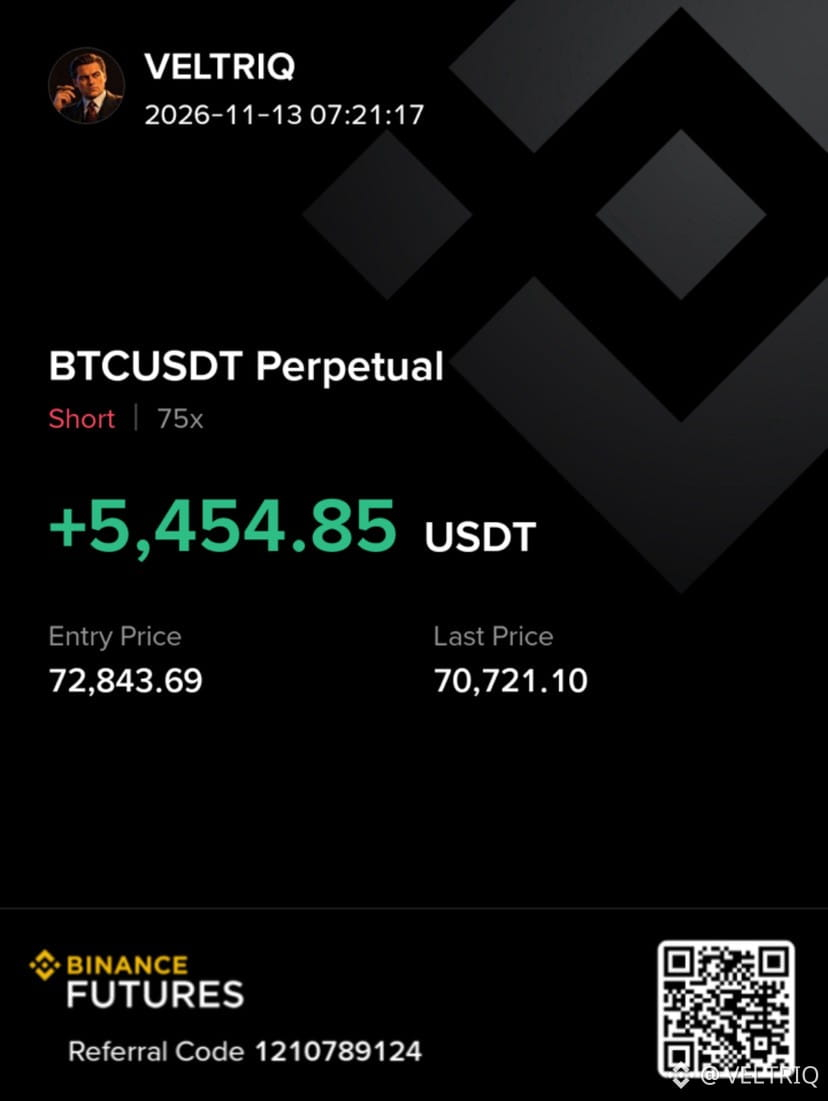
Remember I told y’all $70K was my target? 👀
$BTC is almost there.
$BTC SHORT UPDATE
Entry: $72,843.69
Current Price: $70,721.10
Leverage: 75x
Unrealized PnL: +$5,454.85 USDT
The bearish thesis is playing out exactly as planned.
One level left to watch: $70,000.
Let’s see how price reacts. 🎯
#btc #btcupdate #AnthropicRejectsIPODelayValuationinQuestion
{future}(BTCUSDT)
Remember I told y’all $70K was my target? 👀
$BTC is almost there.
$BTC SHORT UPDATE
Entry: $72,843.69
Current Price: $70,721.10
Leverage: 75x
Unrealized PnL: +$5,454.85 USDT
The bearish thesis is playing out exactly as planned.
One level left to watch: $70,000.
Let’s see how price reacts. 🎯
#btc #btcupdate #AnthropicRejectsIPODelayValuationinQuestion
$BTC is almost there.
$BTC SHORT UPDATE
Entry: $72,843.69
Current Price: $70,721.10
Leverage: 75x
Unrealized PnL: +$5,454.85 USDT
The bearish thesis is playing out exactly as planned.
One level left to watch: $70,000.
Let’s see how price reacts. 🎯
#btc #btcupdate #AnthropicRejectsIPODelayValuationinQuestion
30

🚨 BITCOIN (BTC) LATEST ANALYSIS – NOVEMBER 13, 2026 #BTC
Bitcoin is facing significant selling pressure as institutional demand weakens and market sentiment remains cautious.
📊 KEY LEVELS:
🔴 Support: $73,000 – $72,000
🔴 Next Support: $70,000 – $68,000
🟢 Resistance: $75,565 – $77,633
🟢 Major Bullish Level: $80,000
📈 BULLISH SCENARIO:
A strong breakout above $77,633 could open the door towards $80,000.
📉 BEARISH SCENARIO:
A breakdown below $72,000 could expose Bitcoin to further losses towards $70,000.
⚠️ MARKET OUTLOOK:
Bitcoin remains bearish in the short term. Traders should wait for confirmation before entering new positions.
What do you think?
Will BTC recover towards $80K or drop towards $70K?
👇 Share your analysis in the comments!
#Bitcoin #BTC #CryptoAnalysis #BitcoinPrediction #CryptoMarket #TechnicalAnalysis #FXArifRaee
⚠️ Educational content only. Not financial advice.
🚨 BITCOIN (BTC) LATEST ANALYSIS – NOVEMBER 13, 2026 #BTC
Bitcoin is facing significant selling pressure as institutional demand weakens and market sentiment remains cautious.
📊 KEY LEVELS:
🔴 Support: $73,000 – $72,000
🔴 Next Support: $70,000 – $68,000
🟢 Resistance: $75,565 – $77,633
🟢 Major Bullish Level: $80,000
📈 BULLISH SCENARIO:
A strong breakout above $77,633 could open the door towards $80,000.
📉 BEARISH SCENARIO:
A breakdown below $72,000 could expose Bitcoin to further losses towards $70,000.
⚠️ MARKET OUTLOOK:
Bitcoin remains bearish in the short term. Traders should wait for confirmation before entering new positions.
What do you think?
Will BTC recover towards $80K or drop towards $70K?
👇 Share your analysis in the comments!
#Bitcoin #BTC #CryptoAnalysis #BitcoinPrediction #CryptoMarket #TechnicalAnalysis #FXArifRaee
⚠️ Educational content only. Not financial advice.
Bitcoin is facing significant selling pressure as institutional demand weakens and market sentiment remains cautious.
📊 KEY LEVELS:
🔴 Support: $73,000 – $72,000
🔴 Next Support: $70,000 – $68,000
🟢 Resistance: $75,565 – $77,633
🟢 Major Bullish Level: $80,000
📈 BULLISH SCENARIO:
A strong breakout above $77,633 could open the door towards $80,000.
📉 BEARISH SCENARIO:
A breakdown below $72,000 could expose Bitcoin to further losses towards $70,000.
⚠️ MARKET OUTLOOK:
Bitcoin remains bearish in the short term. Traders should wait for confirmation before entering new positions.
What do you think?
Will BTC recover towards $80K or drop towards $70K?
👇 Share your analysis in the comments!
#Bitcoin #BTC #CryptoAnalysis #BitcoinPrediction #CryptoMarket #TechnicalAnalysis #FXArifRaee
⚠️ Educational content only. Not financial advice.

39

·
--
Bearish
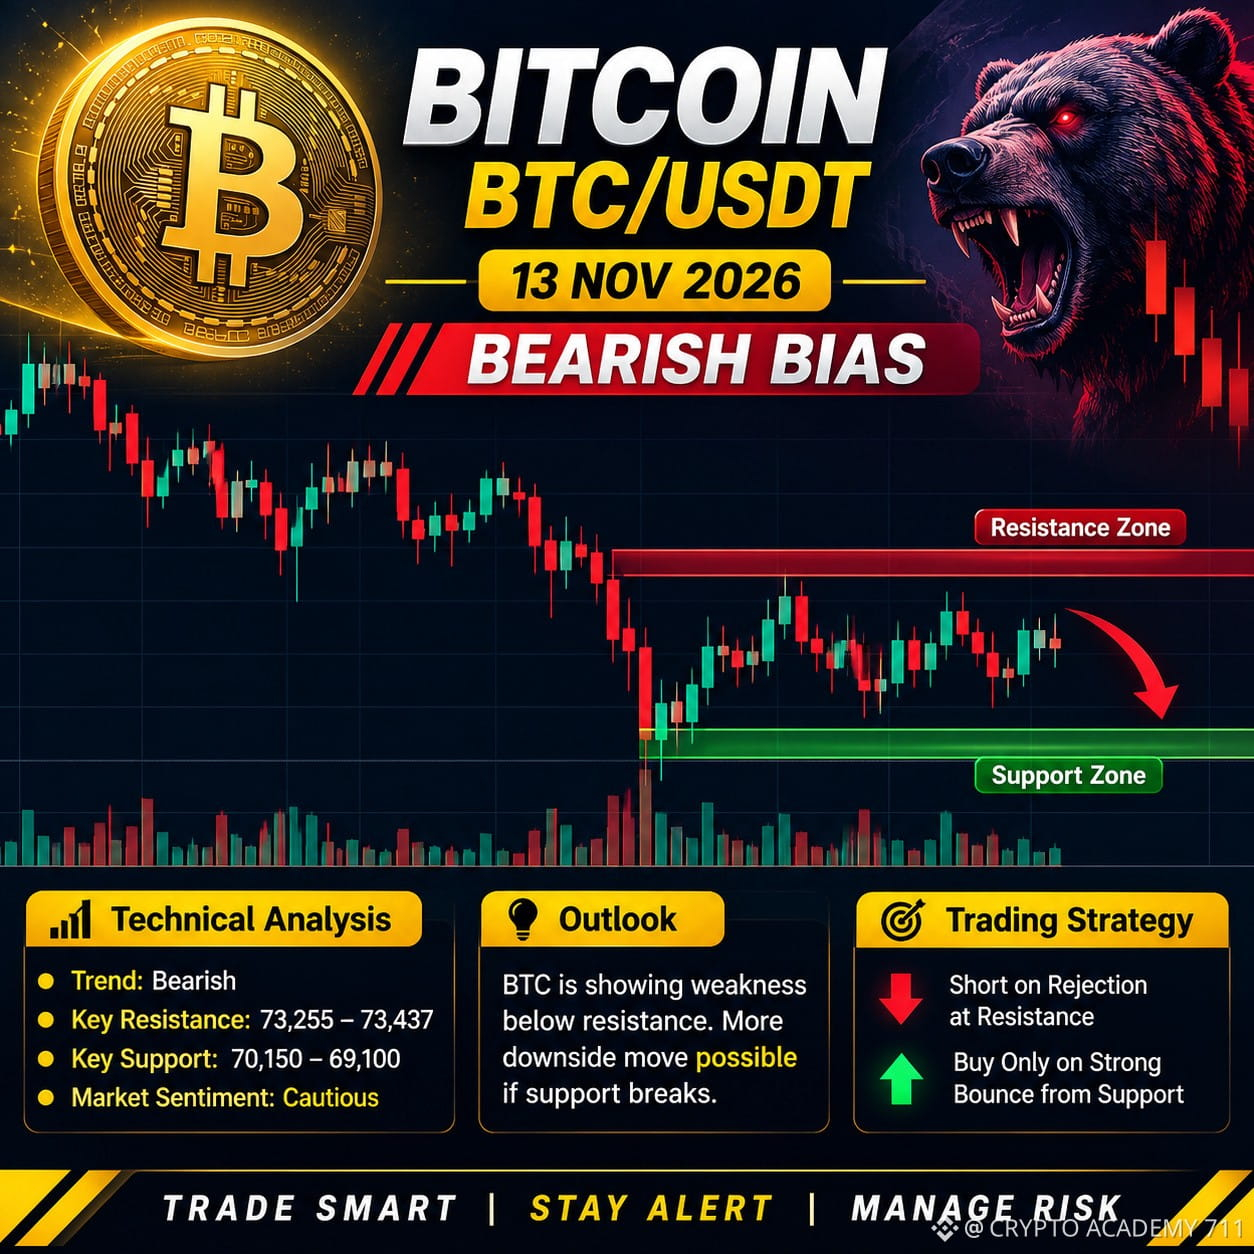
$BTC BITCOIN (BTC) MARKET ANALYSIS – NOVEMBER 13, 2026
₿ BTC/USDT – Bearish Market Structure
Bitcoin is facing strong selling pressure, with the price trading around the $71,000 area.
📊 Technical Analysis
• Current Price: Around $71,000
• Market Trend: Bearish
• Resistance 1: $73,255 – $73,437
• Resistance 2: $73,906 – $74,089
• Support 1: $70,150
• Support 2: $69,100
🔴 Bearish Scenario:
If BTC breaks below $70,150, further downside toward $69,100 could become possible.
🟢 Bullish Scenario:
If BTC reclaims $73,437 with strong volume, a recovery toward $73,900–$74,100 could follow.
🎯 Trading Strategy
• Watch resistance rejection for bearish opportunities.
• Wait for confirmation before entering trades.
• Avoid excessive leverage.
• Always use stop-loss protection.
📌 Market Outlook: Sellers currently have the advantage. A strong recovery above resistance is needed to improve the short-term outlook.
⚠️ Trade carefully. This is market analysis, not financial advice.
{spot}(BTCUSDT)
#Bitcoin #BTC #CryptoAnalysis #BTCUSDT #Binance #CryptoTrading
$BTC BITCOIN (BTC) MARKET ANALYSIS – NOVEMBER 13, 2026
₿ BTC/USDT – Bearish Market Structure
Bitcoin is facing strong selling pressure, with the price trading around the $71,000 area.
📊 Technical Analysis
• Current Price: Around $71,000
• Market Trend: Bearish
• Resistance 1: $73,255 – $73,437
• Resistance 2: $73,906 – $74,089
• Support 1: $70,150
• Support 2: $69,100
🔴 Bearish Scenario:
If BTC breaks below $70,150, further downside toward $69,100 could become possible.
🟢 Bullish Scenario:
If BTC reclaims $73,437 with strong volume, a recovery toward $73,900–$74,100 could follow.
🎯 Trading Strategy
• Watch resistance rejection for bearish opportunities.
• Wait for confirmation before entering trades.
• Avoid excessive leverage.
• Always use stop-loss protection.
📌 Market Outlook: Sellers currently have the advantage. A strong recovery above resistance is needed to improve the short-term outlook.
⚠️ Trade carefully. This is market analysis, not financial advice.
#Bitcoin #BTC #CryptoAnalysis #BTCUSDT #Binance #CryptoTrading
₿ BTC/USDT – Bearish Market Structure
Bitcoin is facing strong selling pressure, with the price trading around the $71,000 area.
📊 Technical Analysis
• Current Price: Around $71,000
• Market Trend: Bearish
• Resistance 1: $73,255 – $73,437
• Resistance 2: $73,906 – $74,089
• Support 1: $70,150
• Support 2: $69,100
🔴 Bearish Scenario:
If BTC breaks below $70,150, further downside toward $69,100 could become possible.
🟢 Bullish Scenario:
If BTC reclaims $73,437 with strong volume, a recovery toward $73,900–$74,100 could follow.
🎯 Trading Strategy
• Watch resistance rejection for bearish opportunities.
• Wait for confirmation before entering trades.
• Avoid excessive leverage.
• Always use stop-loss protection.
📌 Market Outlook: Sellers currently have the advantage. A strong recovery above resistance is needed to improve the short-term outlook.
⚠️ Trade carefully. This is market analysis, not financial advice.
#Bitcoin #BTC #CryptoAnalysis #BTCUSDT #Binance #CryptoTrading
48

·
--
Bearish
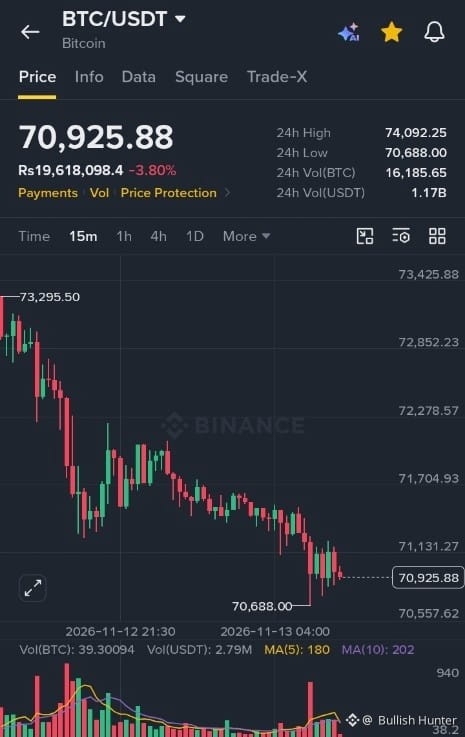
$BTC /USDT
is showing strong volatility! Bitcoin
is trading around $70,925, down 3.80%. Price is testing the $70,688 support zone. If buyers step in, $BTC could attempt a recovery toward $72,000 and beyond. I'm watching this level closely for a potential bounce. Exciting levels ahead! 🚀
📍 Entry Level: $70,900–$71,200
🎯 EP: $71,000
💰 TP: $72,000 / $73,000
🛑 SL: $70,400
Stay alert, manage risk, and DYOR! 📈
#BTC
#Bitcoin #CryptoTrading #USDT
{future}(BTCUSDT)
$BTC /USDT
is showing strong volatility! Bitcoin
is trading around $70,925, down 3.80%. Price is testing the $70,688 support zone. If buyers step in, $BTC could attempt a recovery toward $72,000 and beyond. I'm watching this level closely for a potential bounce. Exciting levels ahead! 🚀
📍 Entry Level: $70,900–$71,200
🎯 EP: $71,000
💰 TP: $72,000 / $73,000
🛑 SL: $70,400
Stay alert, manage risk, and DYOR! 📈
#BTC
#Bitcoin #CryptoTrading #USDT
is showing strong volatility! Bitcoin
is trading around $70,925, down 3.80%. Price is testing the $70,688 support zone. If buyers step in, $BTC could attempt a recovery toward $72,000 and beyond. I'm watching this level closely for a potential bounce. Exciting levels ahead! 🚀
📍 Entry Level: $70,900–$71,200
🎯 EP: $71,000
💰 TP: $72,000 / $73,000
🛑 SL: $70,400
Stay alert, manage risk, and DYOR! 📈
#BTC
#Bitcoin #CryptoTrading #USDT
82

·
--
📊 MARKET UPDATE — DIP BUY ZONE
BTC is trading around $71,097.18, down roughly 4 % on the day, while ETH sits near $2,011.59, off about 2.5 %.
Among altcoins, TIA, XMR, BAT, JUP and BEAM posted modest gains, whereas HIGH, STX, BOME, AST and NEAR led the dip list.
In the next 12‑24 hours, watch for:
- BTC and ETH price action around recent swing lows and any bounce off short‑term moving averages.
- Volume spikes that could signal a shift in momentum.
- Macro headlines such as Fed statements, inflation data or major exchange announcements that often move the broader market.
- On‑chain metrics like hash rate stability for BTC and staking participation for ETH.
All analysis is opinion‑based and not financial advice.
⚠️ NFA | DYOR
#Crypto #BTC #Binance #CryptoSignals #CryptoFlix
📊 MARKET UPDATE — DIP BUY ZONE
BTC is trading around $71,097.18, down roughly 4 % on the day, while ETH sits near $2,011.59, off about 2.5 %.
Among altcoins, TIA, XMR, BAT, JUP and BEAM posted modest gains, whereas HIGH, STX, BOME, AST and NEAR led the dip list.
In the next 12‑24 hours, watch for:
- BTC and ETH price action around recent swing lows and any bounce off short‑term moving averages.
- Volume spikes that could signal a shift in momentum.
- Macro headlines such as Fed statements, inflation data or major exchange announcements that often move the broader market.
- On‑chain metrics like hash rate stability for BTC and staking participation for ETH.
All analysis is opinion‑based and not financial advice.
⚠️ NFA | DYOR
#Crypto #BTC #Binance #CryptoSignals #CryptoFlix
BTC is trading around $71,097.18, down roughly 4 % on the day, while ETH sits near $2,011.59, off about 2.5 %.
Among altcoins, TIA, XMR, BAT, JUP and BEAM posted modest gains, whereas HIGH, STX, BOME, AST and NEAR led the dip list.
In the next 12‑24 hours, watch for:
- BTC and ETH price action around recent swing lows and any bounce off short‑term moving averages.
- Volume spikes that could signal a shift in momentum.
- Macro headlines such as Fed statements, inflation data or major exchange announcements that often move the broader market.
- On‑chain metrics like hash rate stability for BTC and staking participation for ETH.
All analysis is opinion‑based and not financial advice.
⚠️ NFA | DYOR
#Crypto #BTC #Binance #CryptoSignals #CryptoFlix
102

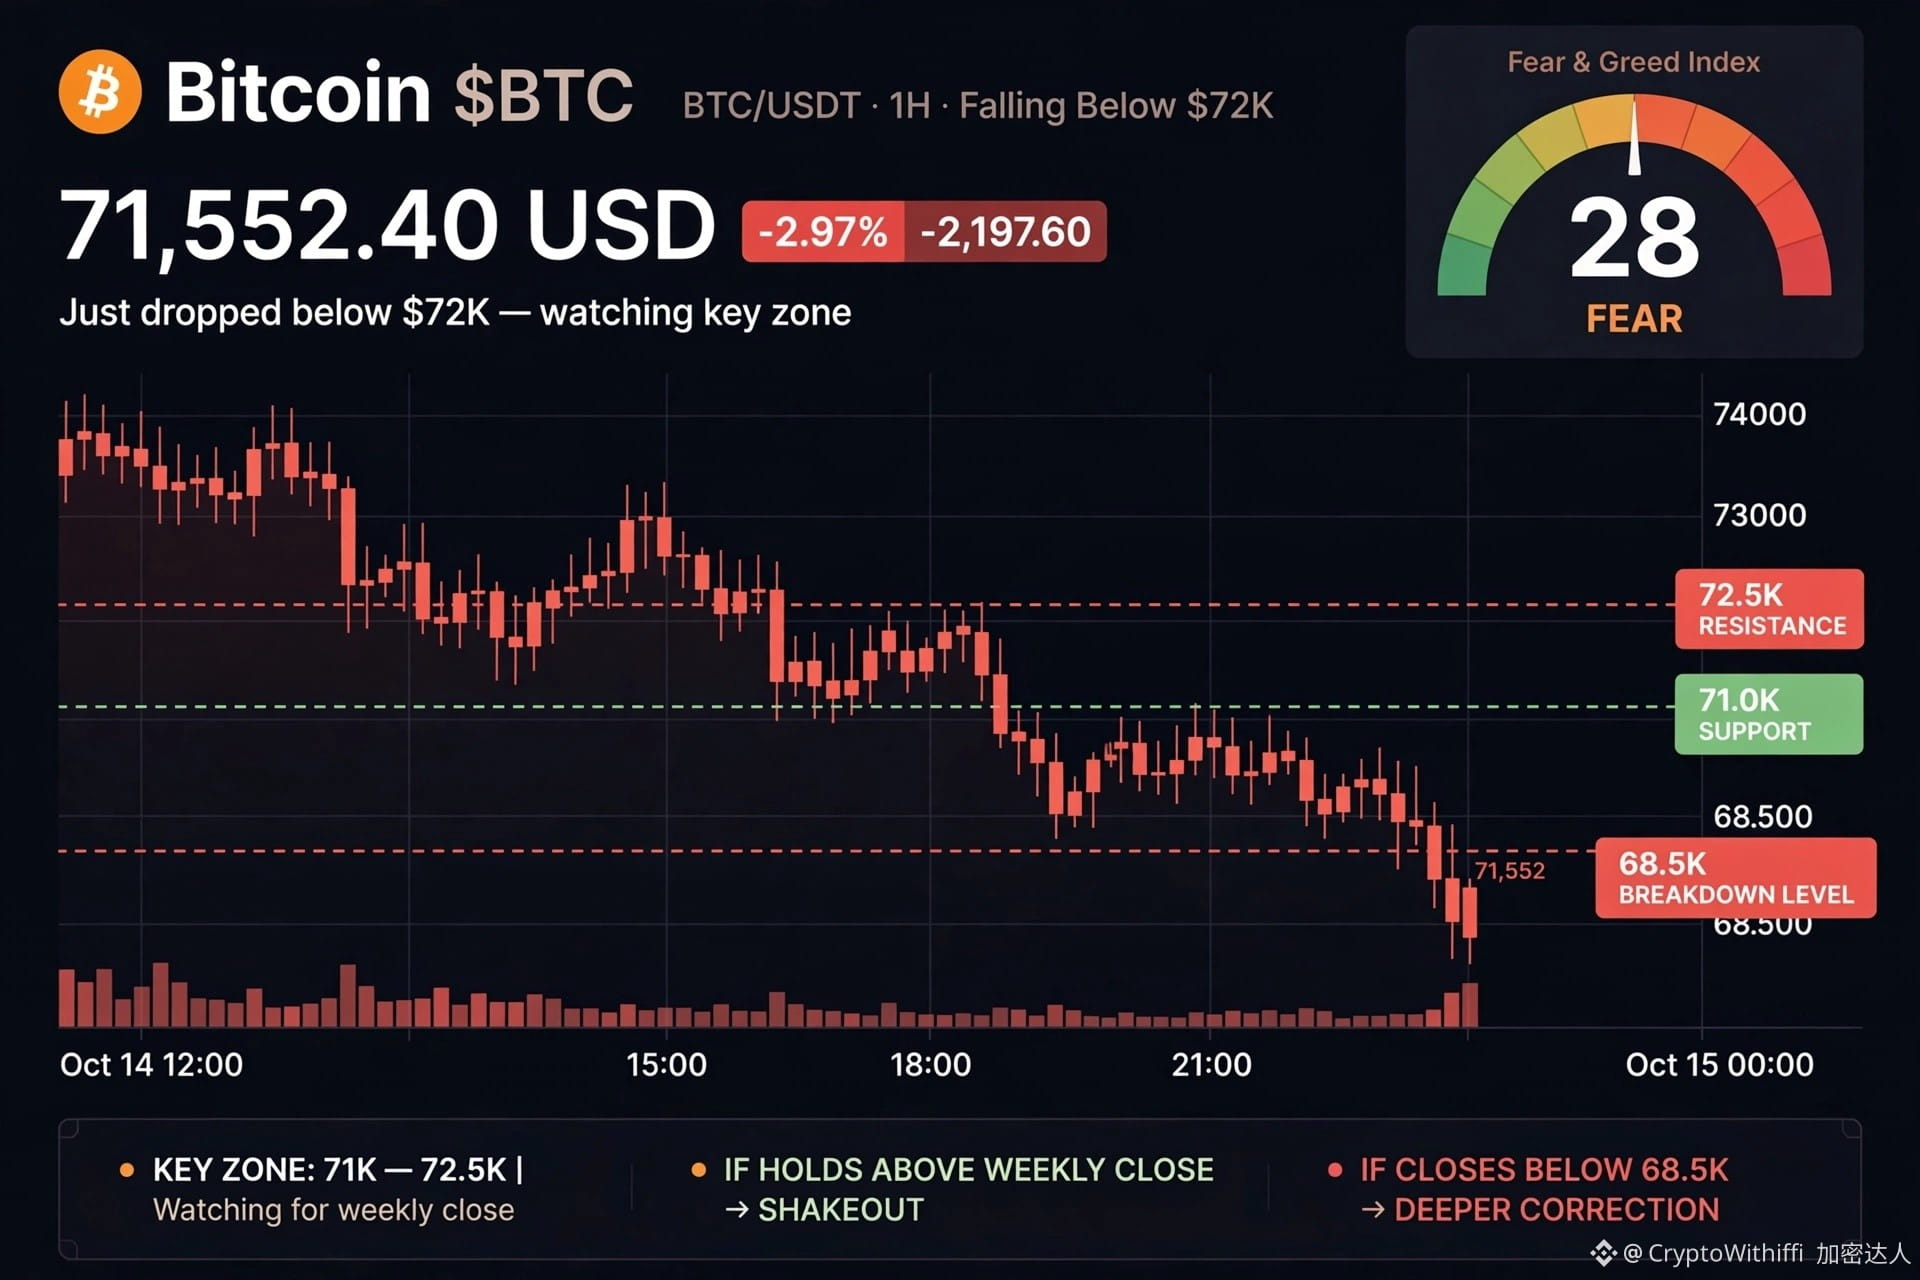
Everyone is panicking, and honestly, I get it.
$BTC just dropped below $72K. Fear & Greed Index is sitting at 28 - straight in Fear zone. ETFs have seen $1.44B in outflows in 5 days.
My timeline is full of "$BTC is dead" posts again. Same posts we saw at $30K, $50K, $60K...
Here's what I'm actually doing:
I'm not panic selling. I'm not buying with leverage either.
I'm just watching the $71K - $72.5K zone. If $BTC holds above it on the weekly close, this whole drop is just another shakeout. If it closes below $68.5K, then yeah, we need to talk about a deeper correction.
Most people lose money not because they pick the wrong coin, but because they panic at the wrong time.
Are you buying this fear, selling, or just sitting on the sidelines like me?
#Bitcoin #BTC #crycpto #BinancePick
Everyone is panicking, and honestly, I get it.
$BTC just dropped below $72K. Fear & Greed Index is sitting at 28 - straight in Fear zone. ETFs have seen $1.44B in outflows in 5 days.
My timeline is full of "$BTC is dead" posts again. Same posts we saw at $30K, $50K, $60K...
Here's what I'm actually doing:
I'm not panic selling. I'm not buying with leverage either.
I'm just watching the $71K - $72.5K zone. If $BTC holds above it on the weekly close, this whole drop is just another shakeout. If it closes below $68.5K, then yeah, we need to talk about a deeper correction.
Most people lose money not because they pick the wrong coin, but because they panic at the wrong time.
Are you buying this fear, selling, or just sitting on the sidelines like me?
#Bitcoin #BTC #crycpto #BinancePick
$BTC just dropped below $72K. Fear & Greed Index is sitting at 28 - straight in Fear zone. ETFs have seen $1.44B in outflows in 5 days.
My timeline is full of "$BTC is dead" posts again. Same posts we saw at $30K, $50K, $60K...
Here's what I'm actually doing:
I'm not panic selling. I'm not buying with leverage either.
I'm just watching the $71K - $72.5K zone. If $BTC holds above it on the weekly close, this whole drop is just another shakeout. If it closes below $68.5K, then yeah, we need to talk about a deeper correction.
Most people lose money not because they pick the wrong coin, but because they panic at the wrong time.
Are you buying this fear, selling, or just sitting on the sidelines like me?
#Bitcoin #BTC #crycpto #BinancePick
85

·
--
Bullish
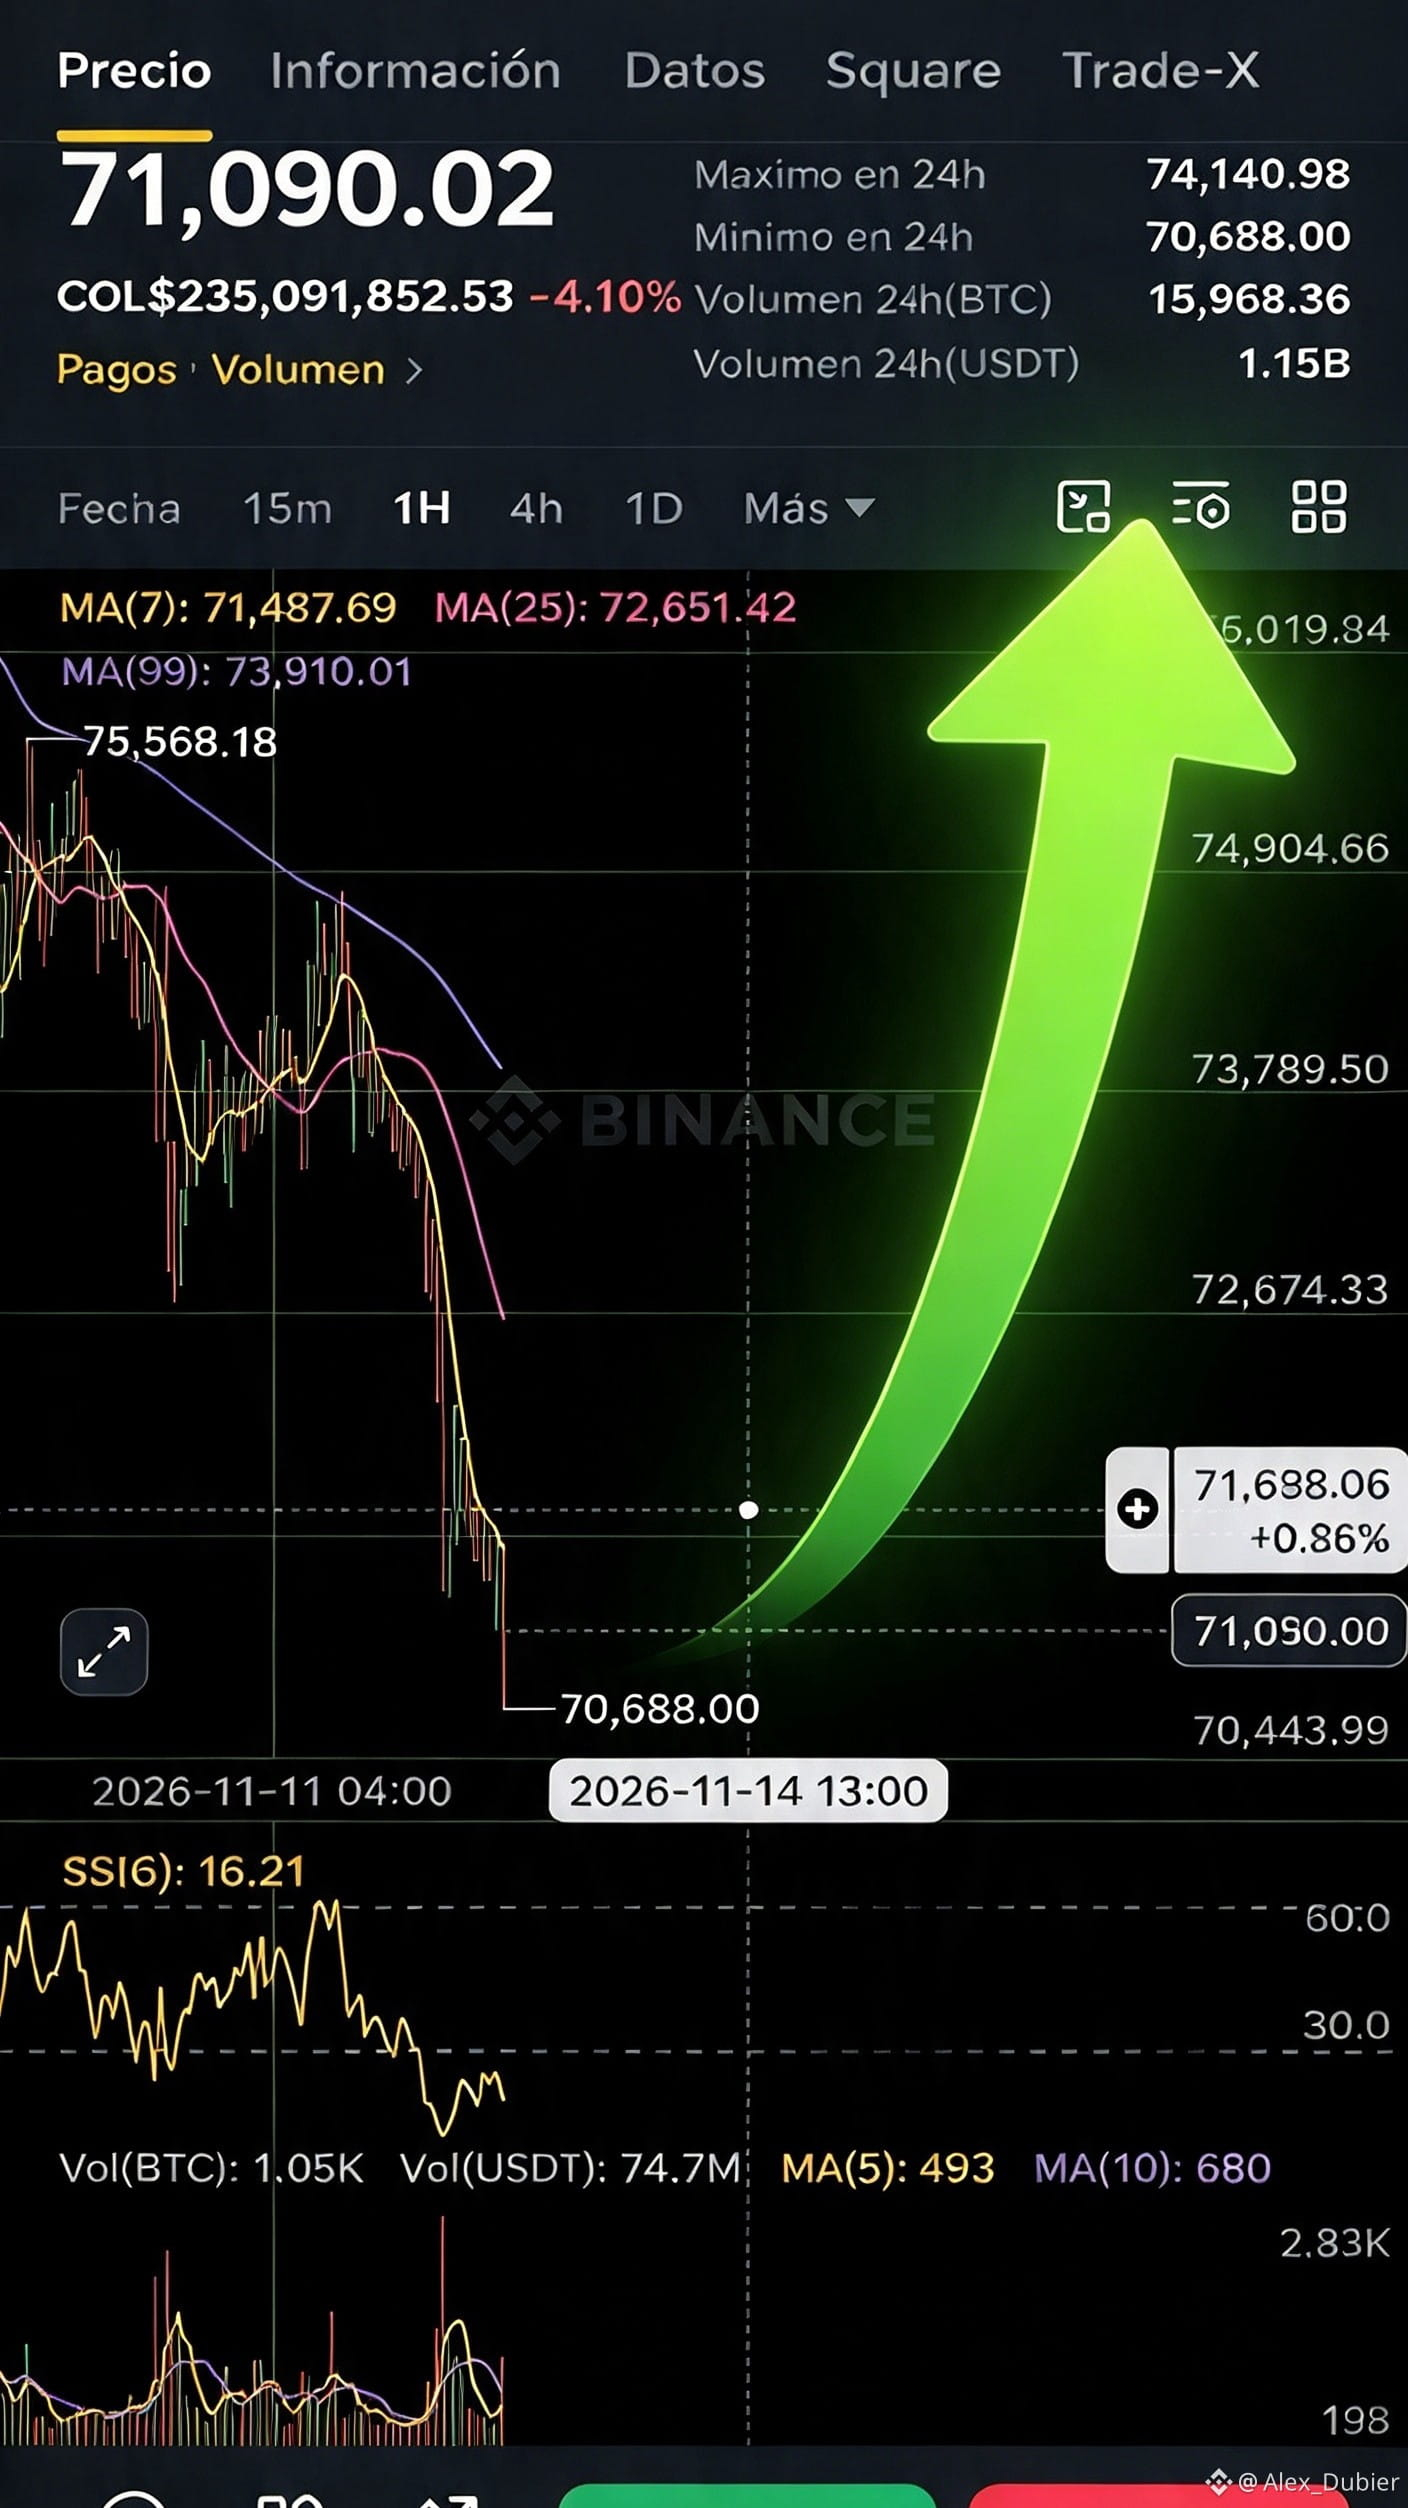
📊 $BTC — Oversold RSI: Bounce Opportunity with Caution 🟢🚀
🔍 Analysis:
An oversold RSI signals that selling pressure may be drying up, opening the door to a mean-reversion bounce. But as you rightly say: catching a falling knife carries risk. If support at 71,000 gives way, further capitulation could follow — that's why clear risk boundaries are essential.
📍 Entry Zone: 70,823.4 – 71,337.2
🎯 TP1: 72,594.0 → +1.8% to +2.5%
🎯 TP2: 73,805.0 → +3.5% to +4.2%
🛑 Stop Loss: 70,115.2 → -1.0% to -1.7% defined risk
💡 Strategy:
Enter with a small position size as you suggest. Watch 71,000 as the decisive level — holding above it keeps the bounce scenario alive. If broken to the downside, don't chase — protect your capital. Your final advice is golden: never bet it all. Controlled risk = peace of mind above all else. Good trade, colleague! 💪🔥
#BTC☀️ #BTC #BTC突破7万大关
{spot}(BTCUSDT)
📊 $BTC — Oversold RSI: Bounce Opportunity with Caution 🟢🚀
🔍 Analysis:
An oversold RSI signals that selling pressure may be drying up, opening the door to a mean-reversion bounce. But as you rightly say: catching a falling knife carries risk. If support at 71,000 gives way, further capitulation could follow — that's why clear risk boundaries are essential.
📍 Entry Zone: 70,823.4 – 71,337.2
🎯 TP1: 72,594.0 → +1.8% to +2.5%
🎯 TP2: 73,805.0 → +3.5% to +4.2%
🛑 Stop Loss: 70,115.2 → -1.0% to -1.7% defined risk
💡 Strategy:
Enter with a small position size as you suggest. Watch 71,000 as the decisive level — holding above it keeps the bounce scenario alive. If broken to the downside, don't chase — protect your capital. Your final advice is golden: never bet it all. Controlled risk = peace of mind above all else. Good trade, colleague! 💪🔥
#BTC☀️ #BTC #BTC突破7万大关
🔍 Analysis:
An oversold RSI signals that selling pressure may be drying up, opening the door to a mean-reversion bounce. But as you rightly say: catching a falling knife carries risk. If support at 71,000 gives way, further capitulation could follow — that's why clear risk boundaries are essential.
📍 Entry Zone: 70,823.4 – 71,337.2
🎯 TP1: 72,594.0 → +1.8% to +2.5%
🎯 TP2: 73,805.0 → +3.5% to +4.2%
🛑 Stop Loss: 70,115.2 → -1.0% to -1.7% defined risk
💡 Strategy:
Enter with a small position size as you suggest. Watch 71,000 as the decisive level — holding above it keeps the bounce scenario alive. If broken to the downside, don't chase — protect your capital. Your final advice is golden: never bet it all. Controlled risk = peace of mind above all else. Good trade, colleague! 💪🔥
#BTC☀️ #BTC #BTC突破7万大关
2
319

·
--
Fear just hit Extreme for the first time since July — and history says it is not a buy signal
Bitcoin is at $70,677, down 4.4% in 24h (range $70,376-$74,032, Binance volume $1.21B, 07:25 PKT). The 12 Nov close was $71,460 — below the 200-day average ($73,137). RSI14 is 31.2 (closed).
The Fear & Greed Index just fell to 20 — Extreme Fear — from 28 yesterday. It is the first reading at 20 or below since 8 July 2026, over 4 months ago. The index tracks volatility, momentum, social media, dominance and trends: 0 is maximum fear, 100 is maximum greed.
What happened after the last 11 times fear hit this level? I checked every first day the index printed 20 or below (Nov 2025-Jul 2026, episodes at least 7 days apart, Binance daily closes, symmetric plus/minus 5% barriers over 7 days, N=11):
- Price fell 5% first: 6 of 11 (55%)
- Price stayed flat: 5 of 11 (45%)
- Price rose 5% first: 0 of 11 (0%)
- 7 days later, price was lower in 7 of 11 (64%)
Expectations — from the study above, not a guarantee: downside first is the base case (55%), chop second (45%), a fast bounce first never happened in this sample. N=11 is small, so treat this as a warning, not a forecast. The options market agrees on direction: Deribit 20 Nov expiry prices a 42% chance BTC ends below $70,000 and only 28% above $73,000.
Why the fear: hot October CPI, the Nvidia CEO resignation, 5 straight days of ETF outflows (~$1.44B, Wed data), and PPI lands tonight at 18:30 PKT. No new BTC-specific news.
Plan: stand aside. 'Buy the fear' has not worked in this sample. Long only on a daily close above $73,137, stop below $70,376. Targets $73,137 then $74,888. A daily close below $70,000 opens $68,000. Tiny size, spot only. Confidence: Low.
$BTC
#BTC #Bitcoin #Crypto
Fear just hit Extreme for the first time since July — and history says it is not a buy signal
Bitcoin is at $70,677, down 4.4% in 24h (range $70,376-$74,032, Binance volume $1.21B, 07:25 PKT). The 12 Nov close was $71,460 — below the 200-day average ($73,137). RSI14 is 31.2 (closed).
The Fear & Greed Index just fell to 20 — Extreme Fear — from 28 yesterday. It is the first reading at 20 or below since 8 July 2026, over 4 months ago. The index tracks volatility, momentum, social media, dominance and trends: 0 is maximum fear, 100 is maximum greed.
What happened after the last 11 times fear hit this level? I checked every first day the index printed 20 or below (Nov 2025-Jul 2026, episodes at least 7 days apart, Binance daily closes, symmetric plus/minus 5% barriers over 7 days, N=11):
- Price fell 5% first: 6 of 11 (55%)
- Price stayed flat: 5 of 11 (45%)
- Price rose 5% first: 0 of 11 (0%)
- 7 days later, price was lower in 7 of 11 (64%)
Expectations — from the study above, not a guarantee: downside first is the base case (55%), chop second (45%), a fast bounce first never happened in this sample. N=11 is small, so treat this as a warning, not a forecast. The options market agrees on direction: Deribit 20 Nov expiry prices a 42% chance BTC ends below $70,000 and only 28% above $73,000.
Why the fear: hot October CPI, the Nvidia CEO resignation, 5 straight days of ETF outflows (~$1.44B, Wed data), and PPI lands tonight at 18:30 PKT. No new BTC-specific news.
Plan: stand aside. 'Buy the fear' has not worked in this sample. Long only on a daily close above $73,137, stop below $70,376. Targets $73,137 then $74,888. A daily close below $70,000 opens $68,000. Tiny size, spot only. Confidence: Low.
$BTC
#BTC #Bitcoin #Crypto
Bitcoin is at $70,677, down 4.4% in 24h (range $70,376-$74,032, Binance volume $1.21B, 07:25 PKT). The 12 Nov close was $71,460 — below the 200-day average ($73,137). RSI14 is 31.2 (closed).
The Fear & Greed Index just fell to 20 — Extreme Fear — from 28 yesterday. It is the first reading at 20 or below since 8 July 2026, over 4 months ago. The index tracks volatility, momentum, social media, dominance and trends: 0 is maximum fear, 100 is maximum greed.
What happened after the last 11 times fear hit this level? I checked every first day the index printed 20 or below (Nov 2025-Jul 2026, episodes at least 7 days apart, Binance daily closes, symmetric plus/minus 5% barriers over 7 days, N=11):
- Price fell 5% first: 6 of 11 (55%)
- Price stayed flat: 5 of 11 (45%)
- Price rose 5% first: 0 of 11 (0%)
- 7 days later, price was lower in 7 of 11 (64%)
Expectations — from the study above, not a guarantee: downside first is the base case (55%), chop second (45%), a fast bounce first never happened in this sample. N=11 is small, so treat this as a warning, not a forecast. The options market agrees on direction: Deribit 20 Nov expiry prices a 42% chance BTC ends below $70,000 and only 28% above $73,000.
Why the fear: hot October CPI, the Nvidia CEO resignation, 5 straight days of ETF outflows (~$1.44B, Wed data), and PPI lands tonight at 18:30 PKT. No new BTC-specific news.
Plan: stand aside. 'Buy the fear' has not worked in this sample. Long only on a daily close above $73,137, stop below $70,376. Targets $73,137 then $74,888. A daily close below $70,000 opens $68,000. Tiny size, spot only. Confidence: Low.
$BTC
#BTC #Bitcoin #Crypto
44

·
--
Bitcoin Price Trades Near $71,200 After a Fresh Session Low as the 10-Year Yield Holds Above 5%
🔍 Executive Brief:
Bitcoin slid to a fresh session low near $71,000 before rebounding to $71,200, marking its weakest level since August 20, while the 10‑year Treasury yield stubbornly stayed above 5%, signaling persistent risk‑off sentiment. The dip was largely driven by a pullback in institutional demand as large‑cap holders paused buying amid a broader macro‑economic tightening.
📊 Trader Lens & Market Flow:
Liquidity in spot and futures markets tightened, with open interest in BTC perpetual contracts falling modestly as traders liquidated positions to avoid margin calls, reflecting a cautious stance. The sustained high yield environment has compressed risk‑premium spreads, forcing a re‑evaluation of hedging strategies and pushing institutional players toward more conservative, yield‑aware allocation frameworks.
⚡ 24H Futures Momentum Leaders:
• $PLAY (+51.0%) — Price: 0.009650
• $BARD (+50.2%) — Price: 0.1223
• $DODOX (+22.9%) — Price: 0.0284
#TrendingTopic #Write2Earn #BTC
Bitcoin Price Trades Near $71,200 After a Fresh Session Low as the 10-Year Yield Holds Above 5%
🔍 Executive Brief:
Bitcoin slid to a fresh session low near $71,000 before rebounding to $71,200, marking its weakest level since August 20, while the 10‑year Treasury yield stubbornly stayed above 5%, signaling persistent risk‑off sentiment. The dip was largely driven by a pullback in institutional demand as large‑cap holders paused buying amid a broader macro‑economic tightening.
📊 Trader Lens & Market Flow:
Liquidity in spot and futures markets tightened, with open interest in BTC perpetual contracts falling modestly as traders liquidated positions to avoid margin calls, reflecting a cautious stance. The sustained high yield environment has compressed risk‑premium spreads, forcing a re‑evaluation of hedging strategies and pushing institutional players toward more conservative, yield‑aware allocation frameworks.
⚡ 24H Futures Momentum Leaders:
• $PLAY (+51.0%) — Price: 0.009650
• $BARD (+50.2%) — Price: 0.1223
• $DODOX (+22.9%) — Price: 0.0284
#TrendingTopic #Write2Earn #BTC
🔍 Executive Brief:
Bitcoin slid to a fresh session low near $71,000 before rebounding to $71,200, marking its weakest level since August 20, while the 10‑year Treasury yield stubbornly stayed above 5%, signaling persistent risk‑off sentiment. The dip was largely driven by a pullback in institutional demand as large‑cap holders paused buying amid a broader macro‑economic tightening.
📊 Trader Lens & Market Flow:
Liquidity in spot and futures markets tightened, with open interest in BTC perpetual contracts falling modestly as traders liquidated positions to avoid margin calls, reflecting a cautious stance. The sustained high yield environment has compressed risk‑premium spreads, forcing a re‑evaluation of hedging strategies and pushing institutional players toward more conservative, yield‑aware allocation frameworks.
⚡ 24H Futures Momentum Leaders:
• $PLAY (+51.0%) — Price: 0.009650
• $BARD (+50.2%) — Price: 0.1223
• $DODOX (+22.9%) — Price: 0.0284
#TrendingTopic #Write2Earn #BTC
106

·
--
WALL STREET BLEEDS TECH AS $BTC TESTS CRITICAL LIQUIDITY DEFENSE LINES 🚨 📉
Entry: 75,200 ⚡
Target: 80,000 🚀
Stop Loss: 75,208 ⚠️
When TradFi giants purge risk and wipe trillions off tech indexes, the shockwave inevitably rattles crypto order books. Margin cascades accelerate the flush, dragging $BTC from the eighty thousand handle down to an intraday low of 75,208 as leveraged longs get flushed out. 📊
Long-term structure remains resilient, but immediate price action hinges entirely on whether bulls can successfully defend that 75,200 floor and reclaim the psychological 80,000 barrier. ⚡ If sellers pierce Thursday's low, the entire local bottom thesis needs a complete re-evaluation. 📌
If Wall Street keeps bleeding tech, what would convince you Bitcoin can decouple and hold its ground independently? 🤔
⚠️ Not financial advice. Always manage your risk. 🛡️
🏷️ #BTC #Nasdaq #TradFi #Crypto #MarketUpdate
🔥 💎
WALL STREET BLEEDS TECH AS $BTC TESTS CRITICAL LIQUIDITY DEFENSE LINES 🚨 📉
Entry: 75,200 ⚡
Target: 80,000 🚀
Stop Loss: 75,208 ⚠️
When TradFi giants purge risk and wipe trillions off tech indexes, the shockwave inevitably rattles crypto order books. Margin cascades accelerate the flush, dragging $BTC from the eighty thousand handle down to an intraday low of 75,208 as leveraged longs get flushed out. 📊
Long-term structure remains resilient, but immediate price action hinges entirely on whether bulls can successfully defend that 75,200 floor and reclaim the psychological 80,000 barrier. ⚡ If sellers pierce Thursday's low, the entire local bottom thesis needs a complete re-evaluation. 📌
If Wall Street keeps bleeding tech, what would convince you Bitcoin can decouple and hold its ground independently? 🤔
⚠️ Not financial advice. Always manage your risk. 🛡️
🏷️ #BTC #Nasdaq #TradFi #Crypto #MarketUpdate
🔥 💎
Entry: 75,200 ⚡
Target: 80,000 🚀
Stop Loss: 75,208 ⚠️
When TradFi giants purge risk and wipe trillions off tech indexes, the shockwave inevitably rattles crypto order books. Margin cascades accelerate the flush, dragging $BTC from the eighty thousand handle down to an intraday low of 75,208 as leveraged longs get flushed out. 📊
Long-term structure remains resilient, but immediate price action hinges entirely on whether bulls can successfully defend that 75,200 floor and reclaim the psychological 80,000 barrier. ⚡ If sellers pierce Thursday's low, the entire local bottom thesis needs a complete re-evaluation. 📌
If Wall Street keeps bleeding tech, what would convince you Bitcoin can decouple and hold its ground independently? 🤔
⚠️ Not financial advice. Always manage your risk. 🛡️
🏷️ #BTC #Nasdaq #TradFi #Crypto #MarketUpdate
🔥 💎

16
Log in to explore more content
Join global crypto users on Binance Square
⚡️ Get latest and useful information about crypto.
💬 Trusted by the world’s largest crypto exchange.
👍 Discover real insights from verified creators.
Email / Phone number
Trending Topics
1
#HuangExitNvidiaStrategyInFocus
110,479 views
1,192 Discussing
2
#AnthropicRejectsIPODelayValuationinQuestion
719,466 views
5,406 Discussing
3
#HedgeFundsCMEBitcoinNetShortsFall89%
1,617 views
50 Discussing
4
#BitMineReports$6.3BNetLossForFiscal2026
14,082 views
136 Discussing
5
#AnthropicIPOAboutSixTimesOversubscribed
600 views
36 Discussing
6
#SoFiExpandsSoFiUSDStablecoinToPolygon
2,836 views
66 Discussing
7
#TetherGoldXAUTCompletesKPMGAudit
3,097 views
70 Discussing
8
#ChipStocksExtendLossesAfterNvidiaCEOChange
43,579 views
494 Discussing
9
#TrezorConfirmsMaliciousImplantsIn3Safe5Devices
1,145 views
31 Discussing
10
#TradFiForBeginners
540,145 views
3,760 Discussing