
#bitcoin
bitcoin
347.1M views
841,327 Discussing
Hot
Latest

·
--
Verified
🚨 BITCOIN AROUND $69K: IS MORE DOWNSIDE COMING? 📈
Bitcoin has faced a major correction, moving from the $80K area towards $69K. Now traders are watching whether the market can find a bottom or continue falling.
📊 US PPI — October Data:
• Monthly PPI: (+0.3%) vs (+0.4%) expected
• Annual PPI: (+6.5%), up from (6.3%) in September
🔍 BTC Levels to Watch:
🔴 Bearish Scenario: A drop towards $67K could be possible if selling pressure continues.
🟢 Recovery Scenario: If BTC holds support and reclaims $70K, it could attempt a move towards $72K–$73K.
🚀 Long-Term Speculation: Some market predictions are looking as high as $130K, but that remains highly uncertain and depends on a broader market recovery.
⚠️ Cooler monthly PPI does not guarantee a Bitcoin rally. The market still needs confirmation from price action.
$BTC - $AKE - $SHELL
{future}(BTCUSDT)
{future}(AKEUSDT)
{future}(SHELLUSDT)
#Bitcoin #CryptoMarket
#USPPIMissMayEaseBTCPressure
"Do you think $67K will be Bitcoin's bottom, or could we see even lower prices before recovery"!?👀
🚨 BITCOIN AROUND $69K: IS MORE DOWNSIDE COMING? 📈
Bitcoin has faced a major correction, moving from the $80K area towards $69K. Now traders are watching whether the market can find a bottom or continue falling.
📊 US PPI — October Data:
• Monthly PPI: (+0.3%) vs (+0.4%) expected
• Annual PPI: (+6.5%), up from (6.3%) in September
🔍 BTC Levels to Watch:
🔴 Bearish Scenario: A drop towards $67K could be possible if selling pressure continues.
🟢 Recovery Scenario: If BTC holds support and reclaims $70K, it could attempt a move towards $72K–$73K.
🚀 Long-Term Speculation: Some market predictions are looking as high as $130K, but that remains highly uncertain and depends on a broader market recovery.
⚠️ Cooler monthly PPI does not guarantee a Bitcoin rally. The market still needs confirmation from price action.
$BTC - $AKE - $SHELL
#Bitcoin #CryptoMarket
#USPPIMissMayEaseBTCPressure
"Do you think $67K will be Bitcoin's bottom, or could we see even lower prices before recovery"!?👀
Bitcoin has faced a major correction, moving from the $80K area towards $69K. Now traders are watching whether the market can find a bottom or continue falling.
📊 US PPI — October Data:
• Monthly PPI: (+0.3%) vs (+0.4%) expected
• Annual PPI: (+6.5%), up from (6.3%) in September
🔍 BTC Levels to Watch:
🔴 Bearish Scenario: A drop towards $67K could be possible if selling pressure continues.
🟢 Recovery Scenario: If BTC holds support and reclaims $70K, it could attempt a move towards $72K–$73K.
🚀 Long-Term Speculation: Some market predictions are looking as high as $130K, but that remains highly uncertain and depends on a broader market recovery.
⚠️ Cooler monthly PPI does not guarantee a Bitcoin rally. The market still needs confirmation from price action.
$BTC - $AKE - $SHELL
#Bitcoin #CryptoMarket
#USPPIMissMayEaseBTCPressure
"Do you think $67K will be Bitcoin's bottom, or could we see even lower prices before recovery"!?👀
🟢 Yes, BTC — $67K Bottom 🚀
🔴 No, BTC — More Downside 📉
12 hr(s) left
2
2
1.1k

·
--
Bearish
🚨 BTC'S NEXT MOVE COULD TRAP BOTH SIDES! IS $65K STILL COMING? 👀
Bitcoin's latest sell-off has created an interesting market structure. But here's something many traders might be overlooking:
A relief bounce doesn't necessarily mean the bears have lost control.
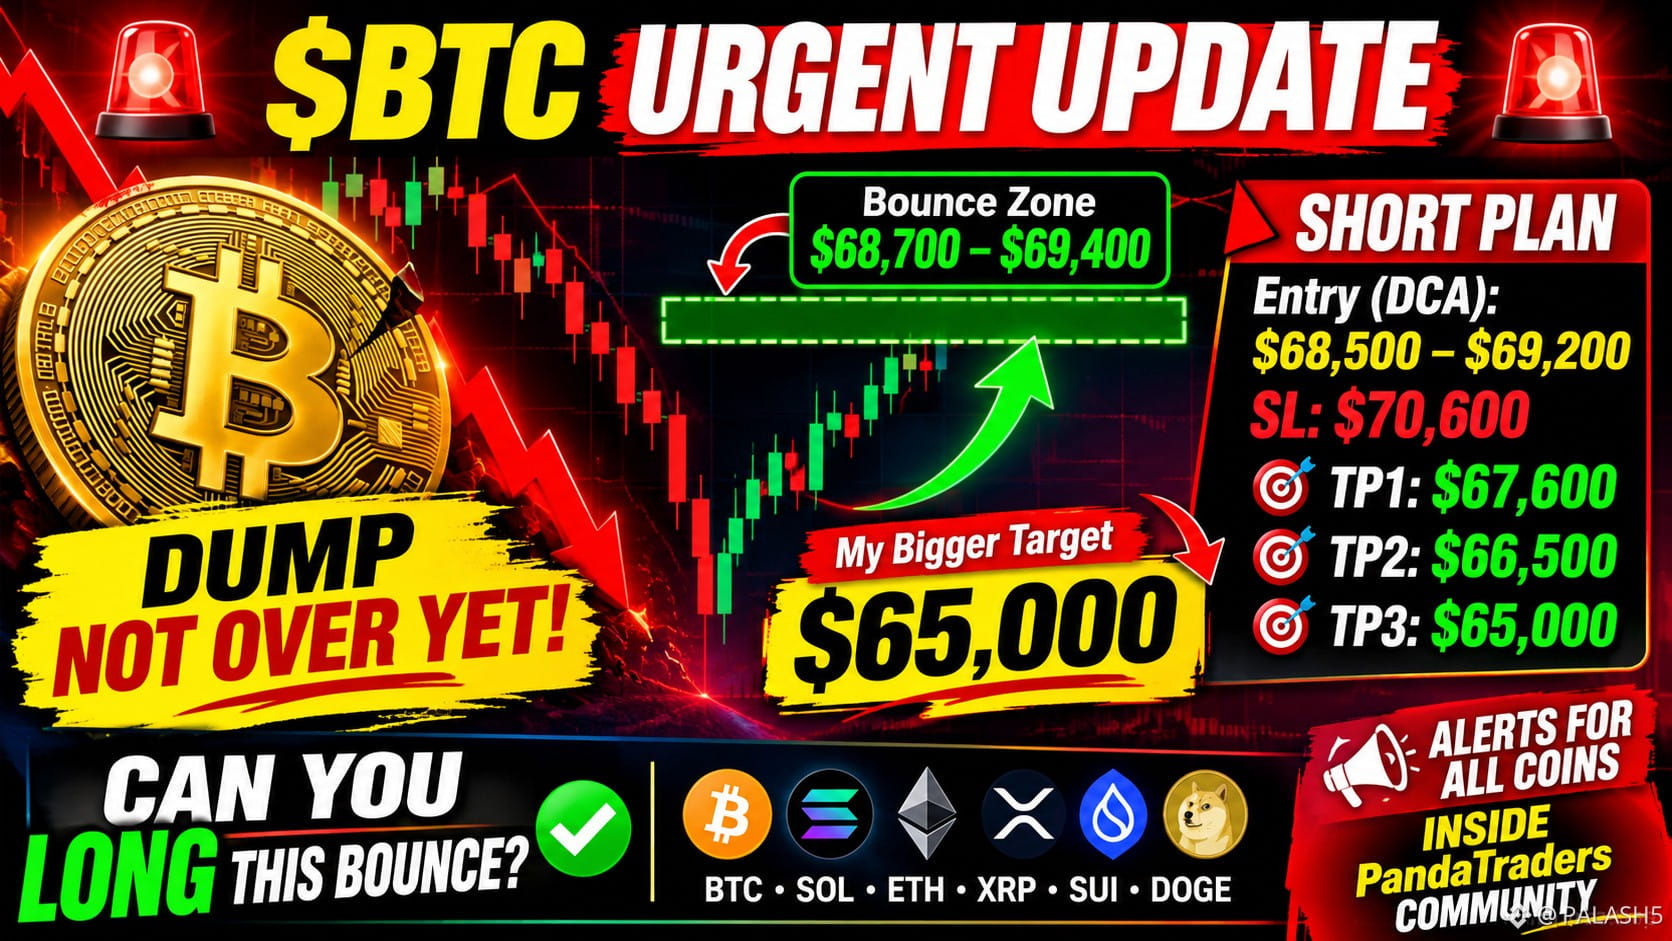
After such aggressive downside movement, short-term buyers may step in and push BTC toward $68,700–$69,400. However, that zone could become a critical decision point.
🔥 MY MARKET PERSPECTIVE:
The biggest opportunity might not be chasing the current dump. It could be waiting for BTC to recover, attract late buyers, and then show signs of bearish rejection.
📊 BTC SHORT WATCHLIST
Entry zone: $68,500–$69,200
Stop Loss: $70,600
TP1: $67,600
TP2: $66,500
TP3: $65,000
My main focus remains $65K, provided bearish momentum continues and the market confirms the setup.
THE BIGGER DISCUSSION:
Could this bounce be the market's way of creating liquidity before another leg down?
Or are we approaching a genuine trend reversal that could catch aggressive short sellers off guard?
I'm also watching SOL, ETH, XRP, SUI and DOGE for similar opportunities.
🐼 More market updates and coin alerts will be shared inside the PandaTraders community.
👇 LET'S DISCUSS:
If BTC reaches $69K, would you:
Look for a short after bearish rejection?
Take a quick long during the relief bounce?
Stay on the sidelines until confirmation?
Share your reasoning below. Let's discuss the market structure, not just guess the direction!
#Bitcoin #BTC #CryptoTrading
$BTC
{future}(BTCUSDT)
🚨 BTC'S NEXT MOVE COULD TRAP BOTH SIDES! IS $65K STILL COMING? 👀
Bitcoin's latest sell-off has created an interesting market structure. But here's something many traders might be overlooking:
A relief bounce doesn't necessarily mean the bears have lost control.
After such aggressive downside movement, short-term buyers may step in and push BTC toward $68,700–$69,400. However, that zone could become a critical decision point.
🔥 MY MARKET PERSPECTIVE:
The biggest opportunity might not be chasing the current dump. It could be waiting for BTC to recover, attract late buyers, and then show signs of bearish rejection.
📊 BTC SHORT WATCHLIST
Entry zone: $68,500–$69,200
Stop Loss: $70,600
TP1: $67,600
TP2: $66,500
TP3: $65,000
My main focus remains $65K, provided bearish momentum continues and the market confirms the setup.
THE BIGGER DISCUSSION:
Could this bounce be the market's way of creating liquidity before another leg down?
Or are we approaching a genuine trend reversal that could catch aggressive short sellers off guard?
I'm also watching SOL, ETH, XRP, SUI and DOGE for similar opportunities.
🐼 More market updates and coin alerts will be shared inside the PandaTraders community.
👇 LET'S DISCUSS:
If BTC reaches $69K, would you:
Look for a short after bearish rejection?
Take a quick long during the relief bounce?
Stay on the sidelines until confirmation?
Share your reasoning below. Let's discuss the market structure, not just guess the direction!
#Bitcoin #BTC #CryptoTrading
$BTC
Bitcoin's latest sell-off has created an interesting market structure. But here's something many traders might be overlooking:
A relief bounce doesn't necessarily mean the bears have lost control.
After such aggressive downside movement, short-term buyers may step in and push BTC toward $68,700–$69,400. However, that zone could become a critical decision point.
🔥 MY MARKET PERSPECTIVE:
The biggest opportunity might not be chasing the current dump. It could be waiting for BTC to recover, attract late buyers, and then show signs of bearish rejection.
📊 BTC SHORT WATCHLIST
Entry zone: $68,500–$69,200
Stop Loss: $70,600
TP1: $67,600
TP2: $66,500
TP3: $65,000
My main focus remains $65K, provided bearish momentum continues and the market confirms the setup.
THE BIGGER DISCUSSION:
Could this bounce be the market's way of creating liquidity before another leg down?
Or are we approaching a genuine trend reversal that could catch aggressive short sellers off guard?
I'm also watching SOL, ETH, XRP, SUI and DOGE for similar opportunities.
🐼 More market updates and coin alerts will be shared inside the PandaTraders community.
👇 LET'S DISCUSS:
If BTC reaches $69K, would you:
Look for a short after bearish rejection?
Take a quick long during the relief bounce?
Stay on the sidelines until confirmation?
Share your reasoning below. Let's discuss the market structure, not just guess the direction!
#Bitcoin #BTC #CryptoTrading
$BTC
1
469

·
--
🤔 Is $BTC finally washing out under $67K?
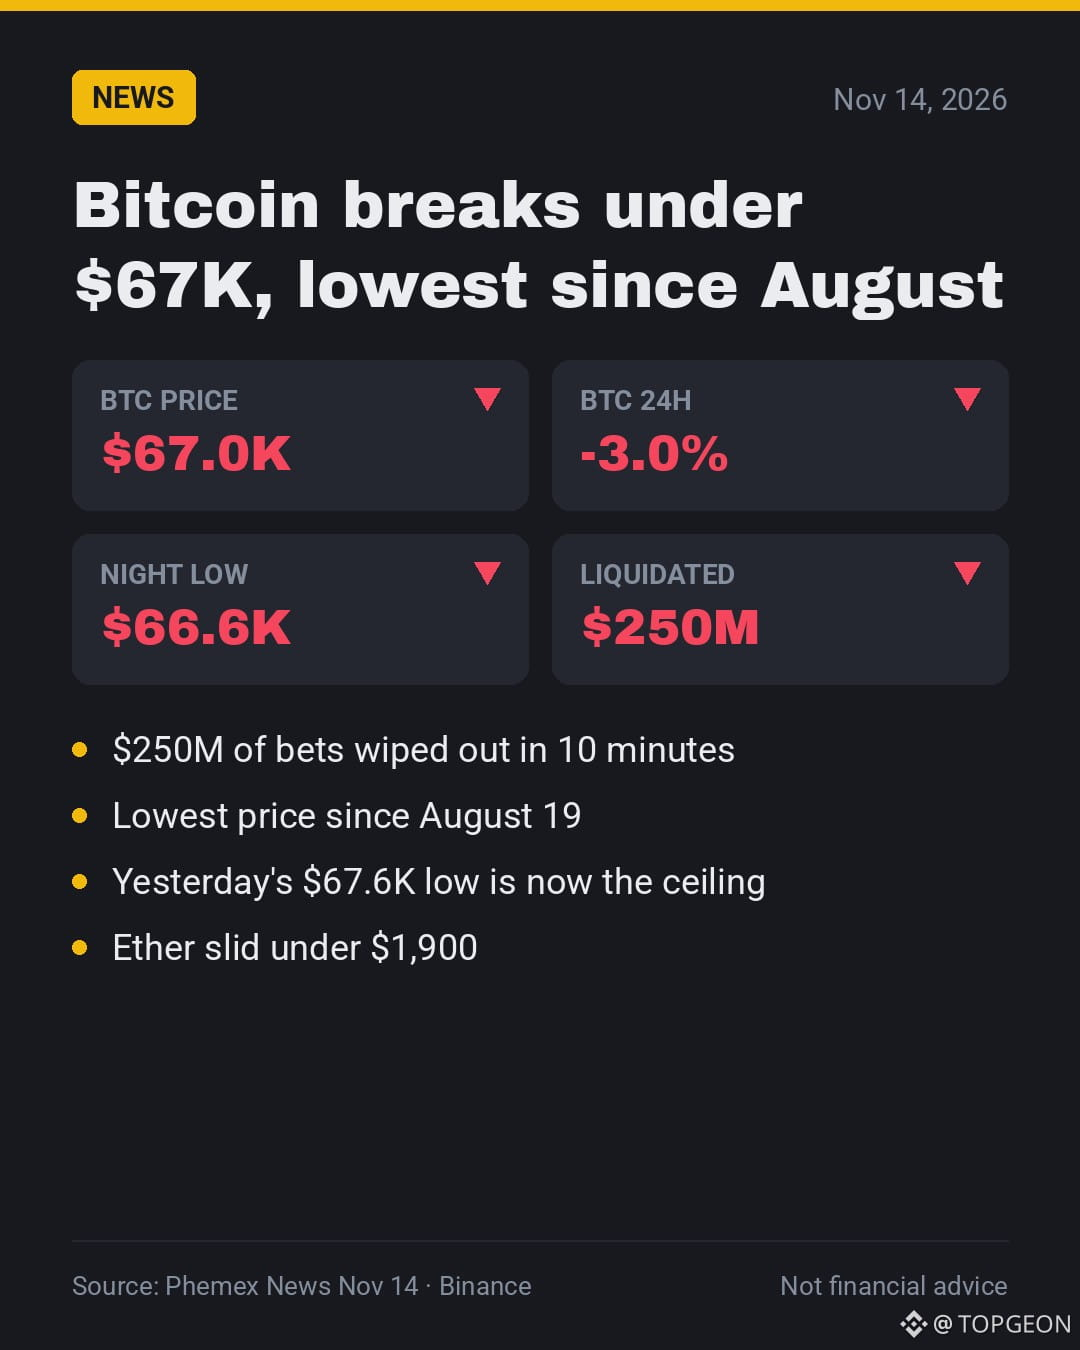
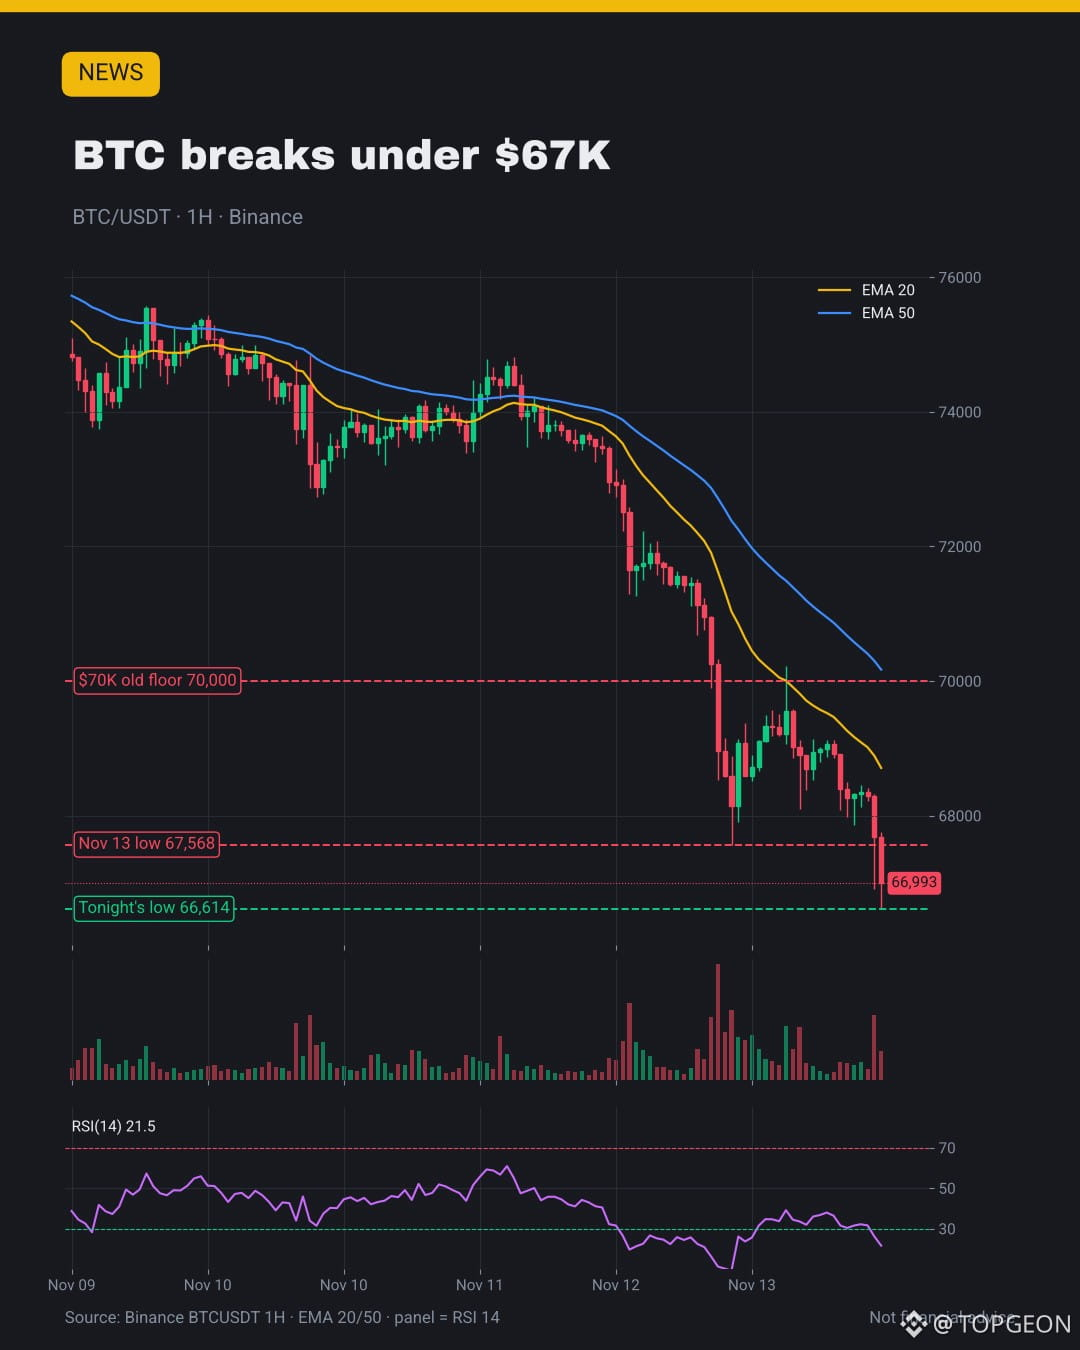
💥 About $250M of bets got wiped in 10 minutes overnight.
📉 That's the lowest price since mid-August.
👀 Yesterday's $67.6K low is now the first ceiling.
🎯 My take: forced selling like this often marks a short-term low, not the final one.
💬 Buying this flush or waiting lower? 👇
#Bitcoin #CryptoMarket
🤔 Is $BTC finally washing out under $67K?
💥 About $250M of bets got wiped in 10 minutes overnight.
📉 That's the lowest price since mid-August.
👀 Yesterday's $67.6K low is now the first ceiling.
🎯 My take: forced selling like this often marks a short-term low, not the final one.
💬 Buying this flush or waiting lower? 👇
#Bitcoin #CryptoMarket
💥 About $250M of bets got wiped in 10 minutes overnight.
📉 That's the lowest price since mid-August.
👀 Yesterday's $67.6K low is now the first ceiling.
🎯 My take: forced selling like this often marks a short-term low, not the final one.
💬 Buying this flush or waiting lower? 👇
#Bitcoin #CryptoMarket
220

·
--
{future}(BTCUSDT)
Crypto as $BTC Breaks $70K Alongside AI Stock Volatility
Over the past 7 days (Nov 7–14), global crypto market capitalization contracted by roughly $150B–$250B (sliding from ~$2.55T to the $2.35T–$2.40T zone) as BTC lost its $70,000 support level during a broader risk-off shift across AI equities.
Chart Structure & Key Levels (BTC 4H / Daily):
• Failed Support Flip ($70,000): After multiple tests, $70,000 shifted from multi-week structural support into immediate overhead resistance, triggering stop-loss cascades toward the sub-$68,000 liquidity pocket.
• Invalidation Level: Bulls need a high-volume daily close back above $70,500 to neutralize the breakdown; otherwise, lower demand zones remain in play.
Why This Pullback Happened (Cross-Market Data):
• Derivatives Deleveraging: Futures traders absorbed over $2.4B in forced liquidations across two major waves ($1.15B on Nov 9 and $1.3B on Nov 12–13), flushing out over-leveraged long positioning built above $70K.
• Spot ETF Outflows: Early-November U.S. spot Bitcoin ETF net outflows reached roughly $1.88B, removing a key source of institutional spot demand during the dip.
• Equity Correlation & Macro Drag: Crypto's slide mirrored heavy AI market volatility in U.S. equities—where Nvidia saw up to $601B in intraday market value erased on Nov 12 following a leadership change and board investigation—compounded by sticky inflation data and a firmer U.S. dollar.
What to Watch Next:
Until U.S. spot ETF flows stabilize and BTC reclaims $70,000 on daily closes, price action remains sensitive to macro liquidity and U.S. tech sentiment.
Which metric are you prioritizing to confirm a bottom for $BTC—spot ETF inflow reversals or a reset in futures funding rates?👇
follow me for crypto news😉👍
$BTC #Bitcoin #MarketPullback #USPPIMissMayEaseBTCPressure
$AKE
Crypto as $BTC Breaks $70K Alongside AI Stock Volatility
Over the past 7 days (Nov 7–14), global crypto market capitalization contracted by roughly $150B–$250B (sliding from ~$2.55T to the $2.35T–$2.40T zone) as BTC lost its $70,000 support level during a broader risk-off shift across AI equities.
Chart Structure & Key Levels (BTC 4H / Daily):
• Failed Support Flip ($70,000): After multiple tests, $70,000 shifted from multi-week structural support into immediate overhead resistance, triggering stop-loss cascades toward the sub-$68,000 liquidity pocket.
• Invalidation Level: Bulls need a high-volume daily close back above $70,500 to neutralize the breakdown; otherwise, lower demand zones remain in play.
Why This Pullback Happened (Cross-Market Data):
• Derivatives Deleveraging: Futures traders absorbed over $2.4B in forced liquidations across two major waves ($1.15B on Nov 9 and $1.3B on Nov 12–13), flushing out over-leveraged long positioning built above $70K.
• Spot ETF Outflows: Early-November U.S. spot Bitcoin ETF net outflows reached roughly $1.88B, removing a key source of institutional spot demand during the dip.
• Equity Correlation & Macro Drag: Crypto's slide mirrored heavy AI market volatility in U.S. equities—where Nvidia saw up to $601B in intraday market value erased on Nov 12 following a leadership change and board investigation—compounded by sticky inflation data and a firmer U.S. dollar.
What to Watch Next:
Until U.S. spot ETF flows stabilize and BTC reclaims $70,000 on daily closes, price action remains sensitive to macro liquidity and U.S. tech sentiment.
Which metric are you prioritizing to confirm a bottom for $BTC —spot ETF inflow reversals or a reset in futures funding rates?👇
follow me for crypto news😉👍
$BTC #Bitcoin #MarketPullback #USPPIMissMayEaseBTCPressure
$AKE
Over the past 7 days (Nov 7–14), global crypto market capitalization contracted by roughly $150B–$250B (sliding from ~$2.55T to the $2.35T–$2.40T zone) as BTC lost its $70,000 support level during a broader risk-off shift across AI equities.
Chart Structure & Key Levels (BTC 4H / Daily):
• Failed Support Flip ($70,000): After multiple tests, $70,000 shifted from multi-week structural support into immediate overhead resistance, triggering stop-loss cascades toward the sub-$68,000 liquidity pocket.
• Invalidation Level: Bulls need a high-volume daily close back above $70,500 to neutralize the breakdown; otherwise, lower demand zones remain in play.
Why This Pullback Happened (Cross-Market Data):
• Derivatives Deleveraging: Futures traders absorbed over $2.4B in forced liquidations across two major waves ($1.15B on Nov 9 and $1.3B on Nov 12–13), flushing out over-leveraged long positioning built above $70K.
• Spot ETF Outflows: Early-November U.S. spot Bitcoin ETF net outflows reached roughly $1.88B, removing a key source of institutional spot demand during the dip.
• Equity Correlation & Macro Drag: Crypto's slide mirrored heavy AI market volatility in U.S. equities—where Nvidia saw up to $601B in intraday market value erased on Nov 12 following a leadership change and board investigation—compounded by sticky inflation data and a firmer U.S. dollar.
What to Watch Next:
Until U.S. spot ETF flows stabilize and BTC reclaims $70,000 on daily closes, price action remains sensitive to macro liquidity and U.S. tech sentiment.
Which metric are you prioritizing to confirm a bottom for $BTC —spot ETF inflow reversals or a reset in futures funding rates?👇
follow me for crypto news😉👍
$BTC #Bitcoin #MarketPullback #USPPIMissMayEaseBTCPressure
$AKE

dariogambino123456789g:
btc
3
1
28

·
--
🚨 $1.29 BILLION LIQUIDATED IN 24 HOURS — THE LONG SQUEEZE IS BRUTAL
Bitcoin just slipped under $68,000 again, briefly touching $67,865 — and 164,145 traders got wiped out in a single day. 👀
Longs took $1.08 BILLION of the $1.29B in liquidations, with the biggest single hit a $20.15M BTC position on Hyperliquid. BTC is fighting near ~$68,300, down ~4% in 24 hours, while ETH sits near $1,932.
Is this the final long flush before the bounce — or is more pain coming? 👇
#Bitcoin #BTC #Crypto
🚨 $1.29 BILLION LIQUIDATED IN 24 HOURS — THE LONG SQUEEZE IS BRUTAL
Bitcoin just slipped under $68,000 again, briefly touching $67,865 — and 164,145 traders got wiped out in a single day. 👀
Longs took $1.08 BILLION of the $1.29B in liquidations, with the biggest single hit a $20.15M BTC position on Hyperliquid. BTC is fighting near ~$68,300, down ~4% in 24 hours, while ETH sits near $1,932.
Is this the final long flush before the bounce — or is more pain coming? 👇
#Bitcoin #BTC #Crypto
Bitcoin just slipped under $68,000 again, briefly touching $67,865 — and 164,145 traders got wiped out in a single day. 👀
Longs took $1.08 BILLION of the $1.29B in liquidations, with the biggest single hit a $20.15M BTC position on Hyperliquid. BTC is fighting near ~$68,300, down ~4% in 24 hours, while ETH sits near $1,932.
Is this the final long flush before the bounce — or is more pain coming? 👇
#Bitcoin #BTC #Crypto
134

·
--
Bearish
🚨 BITCOIN STRUGGLES BELOW $70K AS SELLING PRESSURE CONTINUES!
Bitcoin is still facing strong downside pressure despite US PPI data coming in slightly below expectations.
The US Producer Price Index (PPI) recorded 6.5% year-over-year, compared with the 6.6% forecast. Although the reading was marginally lower, it remains the highest annual level since 2022.
BTC briefly recovered toward $70,000 following the report, but buyers failed to maintain momentum. The price quickly pulled back, showing that market confidence remains weak.
🔍 What's Driving the Decline?
Fed concerns: Markets are still pricing in a high probability of a December rate hike.
Strong US Dollar: Continued dollar strength is putting pressure on risk assets.
ETF Outflows: Institutional investment flows remain a concern for Bitcoin.
Heavy Liquidations: More than $1.4 billion in liquidations have added to the selling pressure.
📉 BTC Price Outlook
Bitcoin is trading around $67,350 after losing the important $70K level. The short-term structure still looks bearish unless buyers manage to reclaim key resistance.
🎯 Trading Setup – Bearish Scenario
Entry Zone: $67,800–$68,400
Target 1: $66,900
Target 2: $65,500
Target 3: $64,000
Stop Loss: Above $69,200
Confirmation: This short setup only becomes interesting if BTC fails to reclaim $68,500 convincingly. Position sizing should remain small because volatility is still elevated.
💡 My Take
Bitcoin needs stronger buying pressure to reverse its current weakness. Until it recovers important resistance levels, sellers may continue to control the short-term trend.
These levels represent a trading scenario, not guaranteed price targets.
Not financial advice. Always DYOR and manage risk carefully.
$BTC #Bitcoin #CryptoMarket #USPPIMissMayEaseBTCPressure
🚨 BITCOIN STRUGGLES BELOW $70K AS SELLING PRESSURE CONTINUES!
Bitcoin is still facing strong downside pressure despite US PPI data coming in slightly below expectations.
The US Producer Price Index (PPI) recorded 6.5% year-over-year, compared with the 6.6% forecast. Although the reading was marginally lower, it remains the highest annual level since 2022.
BTC briefly recovered toward $70,000 following the report, but buyers failed to maintain momentum. The price quickly pulled back, showing that market confidence remains weak.
🔍 What's Driving the Decline?
Fed concerns: Markets are still pricing in a high probability of a December rate hike.
Strong US Dollar: Continued dollar strength is putting pressure on risk assets.
ETF Outflows: Institutional investment flows remain a concern for Bitcoin.
Heavy Liquidations: More than $1.4 billion in liquidations have added to the selling pressure.
📉 BTC Price Outlook
Bitcoin is trading around $67,350 after losing the important $70K level. The short-term structure still looks bearish unless buyers manage to reclaim key resistance.
🎯 Trading Setup – Bearish Scenario
Entry Zone: $67,800–$68,400
Target 1: $66,900
Target 2: $65,500
Target 3: $64,000
Stop Loss: Above $69,200
Confirmation: This short setup only becomes interesting if BTC fails to reclaim $68,500 convincingly. Position sizing should remain small because volatility is still elevated.
💡 My Take
Bitcoin needs stronger buying pressure to reverse its current weakness. Until it recovers important resistance levels, sellers may continue to control the short-term trend.
These levels represent a trading scenario, not guaranteed price targets.
Not financial advice. Always DYOR and manage risk carefully.
$BTC #Bitcoin #CryptoMarket #USPPIMissMayEaseBTCPressure
Bitcoin is still facing strong downside pressure despite US PPI data coming in slightly below expectations.
The US Producer Price Index (PPI) recorded 6.5% year-over-year, compared with the 6.6% forecast. Although the reading was marginally lower, it remains the highest annual level since 2022.
BTC briefly recovered toward $70,000 following the report, but buyers failed to maintain momentum. The price quickly pulled back, showing that market confidence remains weak.
🔍 What's Driving the Decline?
Fed concerns: Markets are still pricing in a high probability of a December rate hike.
Strong US Dollar: Continued dollar strength is putting pressure on risk assets.
ETF Outflows: Institutional investment flows remain a concern for Bitcoin.
Heavy Liquidations: More than $1.4 billion in liquidations have added to the selling pressure.
📉 BTC Price Outlook
Bitcoin is trading around $67,350 after losing the important $70K level. The short-term structure still looks bearish unless buyers manage to reclaim key resistance.
🎯 Trading Setup – Bearish Scenario
Entry Zone: $67,800–$68,400
Target 1: $66,900
Target 2: $65,500
Target 3: $64,000
Stop Loss: Above $69,200
Confirmation: This short setup only becomes interesting if BTC fails to reclaim $68,500 convincingly. Position sizing should remain small because volatility is still elevated.
💡 My Take
Bitcoin needs stronger buying pressure to reverse its current weakness. Until it recovers important resistance levels, sellers may continue to control the short-term trend.
These levels represent a trading scenario, not guaranteed price targets.
Not financial advice. Always DYOR and manage risk carefully.
$BTC #Bitcoin #CryptoMarket #USPPIMissMayEaseBTCPressure
2
180

·
--
$BTC broke $67,568 — 3-month low, lowest since 19 August
Sequel to this morning's close-verdict post (05:43 PKT): the level that post flagged as must-hold just broke. Bitcoin closed Friday at $68,314, held $68,000 into the close — then kept falling through the night.
Snapshot — live 09:00 PKT, Binance: $66,966, -2.8% in 24h. Range $66,614-$70,214. 24h volume 26,273 BTC ($1.80B). RSI 14 at 27.3 (oversold). Fear & Greed 13, Extreme Fear.
What happened: no single new headline — the same three drivers from Friday kept working. Hot October CPI (+0.4% vs +0.3% expected) repriced Fed expectations; US spot BTC ETFs have now lost over $2.5B since 30 Oct (BigGo Finance); Nvidia's resignation shock kept tech in risk-off. CoinGlass: about $1.3B in liquidations in 24h, mostly longs. BTC is now -9.9% in 7 days, -16.4% in 30 days, and about 47% below its ~$126,000 October 2025 high.
Why $67,568 mattered: it was Friday's low and the line the morning post said must hold. The break is intraday so far — a daily close below it confirms the breakdown. Next clear level is $65,000. Mining difficulty retarget lands today (estimate about -9% this morning; landed figure not yet confirmed).
Expectations — Deribit options, 20 Nov expiry (6 days), spot $66,855, not a guarantee: above $70,000 by expiry 20%, below $65,000 28%, between the two 52%. A 4% move either way: up 29%, down 20%. Above the SMA200 ($73,092) only about 5%. ATM straddle $3,074 (4.6% of spot) — the market prices a move of about that size by expiry. Base-rate cross-check (from the morning post, closes down 4% or more, N=3): 0 up first, 2 down first, 1 flat — weak evidence, same direction.
Plan: do not chase, do not catch the knife blind. Long only on a daily close back above $70,000, stop below $67,568; targets $71,460 then $73,092. A daily close below $65,000 opens $64,181 (-4% level) then $60,000. Tiny size, spot only, no leverage. Confidence: Low.
$BTC #Bitcoin #BTC #Crypto
$BTC broke $67,568 — 3-month low, lowest since 19 August
Sequel to this morning's close-verdict post (05:43 PKT): the level that post flagged as must-hold just broke. Bitcoin closed Friday at $68,314, held $68,000 into the close — then kept falling through the night.
Snapshot — live 09:00 PKT, Binance: $66,966, -2.8% in 24h. Range $66,614-$70,214. 24h volume 26,273 BTC ($1.80B). RSI 14 at 27.3 (oversold). Fear & Greed 13, Extreme Fear.
What happened: no single new headline — the same three drivers from Friday kept working. Hot October CPI (+0.4% vs +0.3% expected) repriced Fed expectations; US spot BTC ETFs have now lost over $2.5B since 30 Oct (BigGo Finance); Nvidia's resignation shock kept tech in risk-off. CoinGlass: about $1.3B in liquidations in 24h, mostly longs. BTC is now -9.9% in 7 days, -16.4% in 30 days, and about 47% below its ~$126,000 October 2025 high.
Why $67,568 mattered: it was Friday's low and the line the morning post said must hold. The break is intraday so far — a daily close below it confirms the breakdown. Next clear level is $65,000. Mining difficulty retarget lands today (estimate about -9% this morning; landed figure not yet confirmed).
Expectations — Deribit options, 20 Nov expiry (6 days), spot $66,855, not a guarantee: above $70,000 by expiry 20%, below $65,000 28%, between the two 52%. A 4% move either way: up 29%, down 20%. Above the SMA200 ($73,092) only about 5%. ATM straddle $3,074 (4.6% of spot) — the market prices a move of about that size by expiry. Base-rate cross-check (from the morning post, closes down 4% or more, N=3): 0 up first, 2 down first, 1 flat — weak evidence, same direction.
Plan: do not chase, do not catch the knife blind. Long only on a daily close back above $70,000, stop below $67,568; targets $71,460 then $73,092. A daily close below $65,000 opens $64,181 (-4% level) then $60,000. Tiny size, spot only, no leverage. Confidence: Low.
$BTC #Bitcoin #BTC #Crypto
Sequel to this morning's close-verdict post (05:43 PKT): the level that post flagged as must-hold just broke. Bitcoin closed Friday at $68,314, held $68,000 into the close — then kept falling through the night.
Snapshot — live 09:00 PKT, Binance: $66,966, -2.8% in 24h. Range $66,614-$70,214. 24h volume 26,273 BTC ($1.80B). RSI 14 at 27.3 (oversold). Fear & Greed 13, Extreme Fear.
What happened: no single new headline — the same three drivers from Friday kept working. Hot October CPI (+0.4% vs +0.3% expected) repriced Fed expectations; US spot BTC ETFs have now lost over $2.5B since 30 Oct (BigGo Finance); Nvidia's resignation shock kept tech in risk-off. CoinGlass: about $1.3B in liquidations in 24h, mostly longs. BTC is now -9.9% in 7 days, -16.4% in 30 days, and about 47% below its ~$126,000 October 2025 high.
Why $67,568 mattered: it was Friday's low and the line the morning post said must hold. The break is intraday so far — a daily close below it confirms the breakdown. Next clear level is $65,000. Mining difficulty retarget lands today (estimate about -9% this morning; landed figure not yet confirmed).
Expectations — Deribit options, 20 Nov expiry (6 days), spot $66,855, not a guarantee: above $70,000 by expiry 20%, below $65,000 28%, between the two 52%. A 4% move either way: up 29%, down 20%. Above the SMA200 ($73,092) only about 5%. ATM straddle $3,074 (4.6% of spot) — the market prices a move of about that size by expiry. Base-rate cross-check (from the morning post, closes down 4% or more, N=3): 0 up first, 2 down first, 1 flat — weak evidence, same direction.
Plan: do not chase, do not catch the knife blind. Long only on a daily close back above $70,000, stop below $67,568; targets $71,460 then $73,092. A daily close below $65,000 opens $64,181 (-4% level) then $60,000. Tiny size, spot only, no leverage. Confidence: Low.
$BTC #Bitcoin #BTC #Crypto
64

US PPI Miss May Ease BTC Pressure - Is The Dump Finally Over?
PPI came in lower than expected, inflation is cooling.
Does this mean BTC will pump from here?
I am still holding in Spot, even in minus. I believe patience will win.
What is your prediction? Pump or More Dump?
#USPPIMissMayEaseBTCPressure USPPIMissMayEaseBTCPressure #BTC #bitcoin #SpotTrading #Crypto #BinanceSquare #Hold#USPPIMissMayEaseBTCPressure
US PPI Miss May Ease BTC Pressure - Is The Dump Finally Over?
PPI came in lower than expected, inflation is cooling.
Does this mean BTC will pump from here?
I am still holding in Spot, even in minus. I believe patience will win.
What is your prediction? Pump or More Dump?
#USPPIMissMayEaseBTCPressure USPPIMissMayEaseBTCPressure #BTC #bitcoin #SpotTrading #Crypto #BinanceSquare #Hold#USPPIMissMayEaseBTCPressure
PPI came in lower than expected, inflation is cooling.
Does this mean BTC will pump from here?
I am still holding in Spot, even in minus. I believe patience will win.
What is your prediction? Pump or More Dump?
#USPPIMissMayEaseBTCPressure USPPIMissMayEaseBTCPressure #BTC #bitcoin #SpotTrading #Crypto #BinanceSquare #Hold#USPPIMissMayEaseBTCPressure

Crypto with Article King:
nice 🙂
3
2
426

·
--
Bearish
Crypto Market Update – November 14
🔴 Crypto market is facing selling pressure.
₿ $BTC : $68,542
⟠ $ETH : $1,929
◎ $SOL : $79.66
Market sentiment remains weak. Stay patient, manage risk, and avoid emotional trading.
#Bitcoin # #Ethereum✅ #CryptoMarket #BinanceSquare
{spot}(BTCUSDT)
{spot}(ETHUSDT)
{spot}(SOLUSDT)
Crypto Market Update – November 14
🔴 Crypto market is facing selling pressure.
₿ $BTC : $68,542
⟠ $ETH : $1,929
◎ $SOL : $79.66
Market sentiment remains weak. Stay patient, manage risk, and avoid emotional trading.
#Bitcoin # #Ethereum✅ #CryptoMarket #BinanceSquare
🔴 Crypto market is facing selling pressure.
₿ $BTC : $68,542
⟠ $ETH : $1,929
◎ $SOL : $79.66
Market sentiment remains weak. Stay patient, manage risk, and avoid emotional trading.
#Bitcoin # #Ethereum✅ #CryptoMarket #BinanceSquare

68

Article
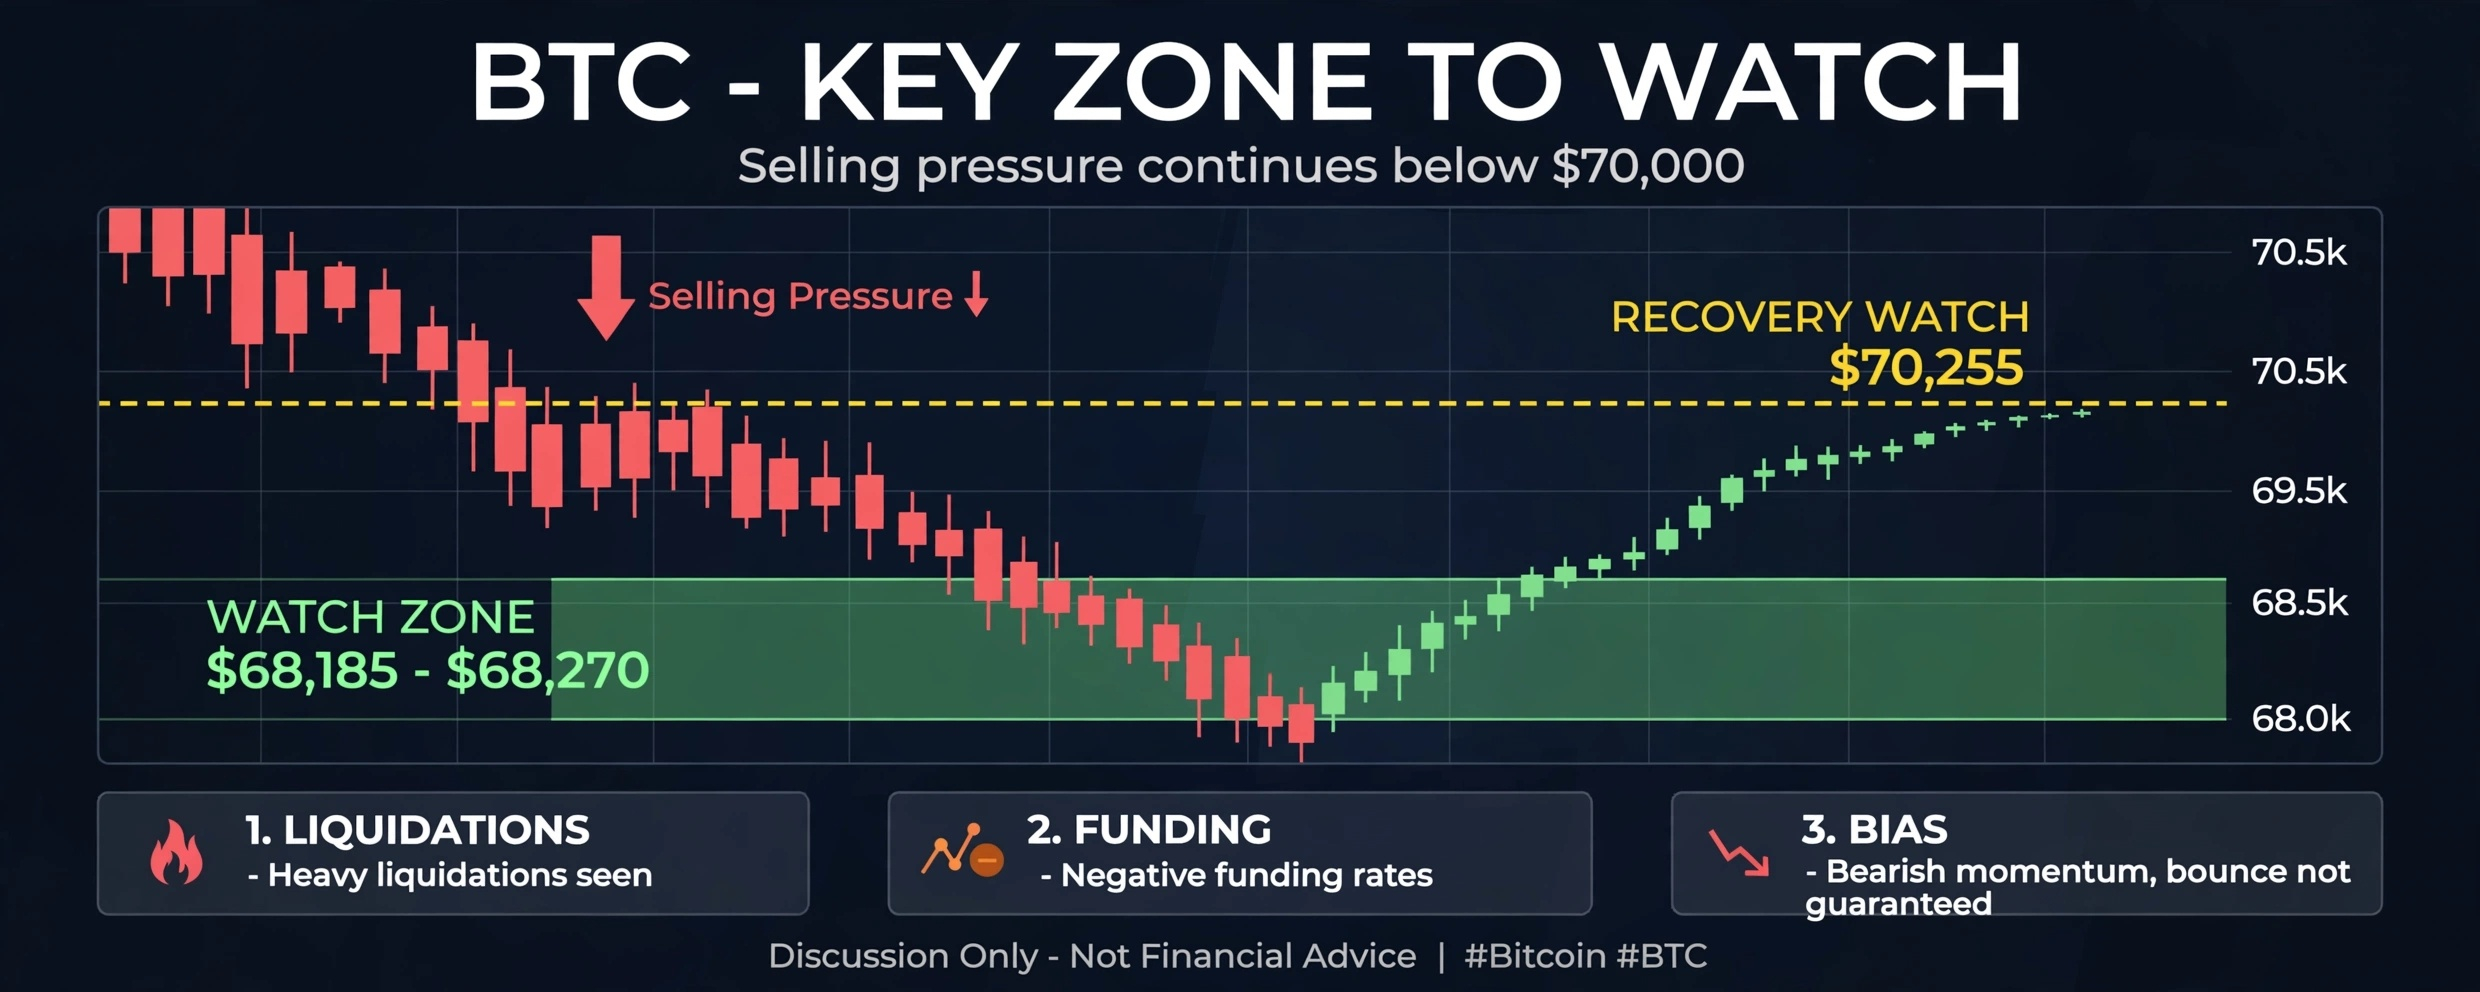
🚀 Bitcoin ($BTC): Is a Recovery Bounce Coming?Bitcoin $BTC is facing strong selling pressure, but the $68,185–$68,270 zone is now worth watching closely.
If buying interest returns, Bitcoin $BTC could attempt a recovery toward the $70,255 level.
However, bearish momentum remains a risk, and a bounce is not guaranteed.
The market's next move will depend on whether buyers can regain control. 📊
The latest market coverage also highlights heavy liquidations, negative funding rates and continued selling pressure as Bitcoin $BTC trades below $70,000.
{spot}(BTCUSDT)
#Bitcoin #BTC #CryptoMarket #BinanceSquare
🚀 Bitcoin ($BTC): Is a Recovery Bounce Coming?
Bitcoin $BTC is facing strong selling pressure, but the $68,185–$68,270 zone is now worth watching closely.
If buying interest returns, Bitcoin $BTC could attempt a recovery toward the $70,255 level.
However, bearish momentum remains a risk, and a bounce is not guaranteed.
The market's next move will depend on whether buyers can regain control. 📊
The latest market coverage also highlights heavy liquidations, negative funding rates and continued selling pressure as Bitcoin $BTC trades below $70,000.
#Bitcoin #BTC #CryptoMarket #BinanceSquare
If buying interest returns, Bitcoin $BTC could attempt a recovery toward the $70,255 level.
However, bearish momentum remains a risk, and a bounce is not guaranteed.
The market's next move will depend on whether buyers can regain control. 📊
The latest market coverage also highlights heavy liquidations, negative funding rates and continued selling pressure as Bitcoin $BTC trades below $70,000.
#Bitcoin #BTC #CryptoMarket #BinanceSquare
1
201

🚨 US–IRAN TENSIONS RAISE GLOBAL MARKET CONCERNS
New military developments involving the US and Iran are increasing uncertainty in the Middle East.
Investors are watching oil prices, global markets, and Bitcoin closely.
Geopolitical tensions can increase market volatility, especially when investors become uncertain about the future.
#Iran #USA #Bitcoin #CryptoNews
🚨 US–IRAN TENSIONS RAISE GLOBAL MARKET CONCERNS
New military developments involving the US and Iran are increasing uncertainty in the Middle East.
Investors are watching oil prices, global markets, and Bitcoin closely.
Geopolitical tensions can increase market volatility, especially when investors become uncertain about the future.
#Iran #USA #Bitcoin #CryptoNews
New military developments involving the US and Iran are increasing uncertainty in the Middle East.
Investors are watching oil prices, global markets, and Bitcoin closely.
Geopolitical tensions can increase market volatility, especially when investors become uncertain about the future.
#Iran #USA #Bitcoin #CryptoNews

198


·
--
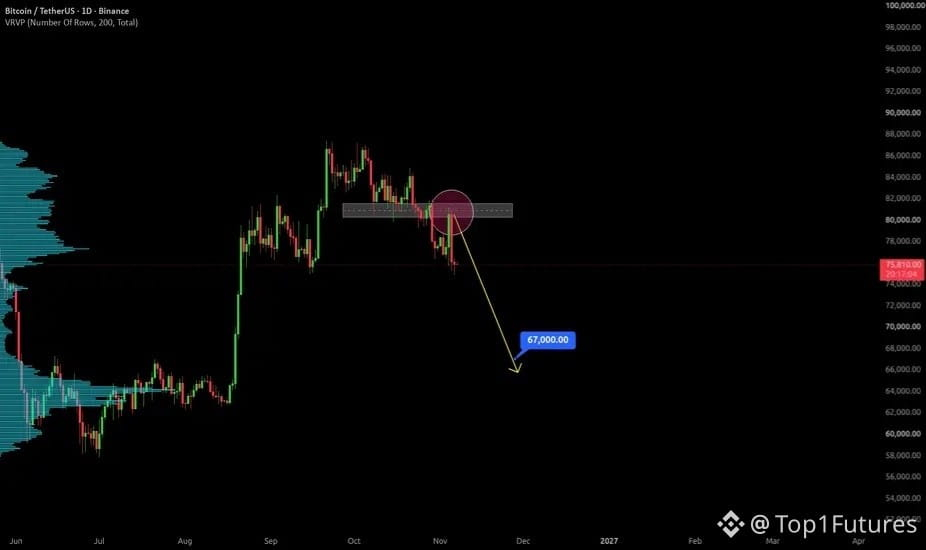
Here’s the thing, $BTC 🔻is still not showing any convincing signs of a proper recovery. 👀📉
Looking at the daily chart, I'm still leaning towards the bearish side. #Bitcoin already lost an important support area around $80K–$82K, and the recent bounce was looking like a recovery attempt. But guess what? Price got rejected almost immediately after reaching that same zone.
This is something worth watching. A level which was previously supporting the price is now turning into a resistance area. And sellers seems to be taking advantage of every small bounce
If #BTC continues trading below this region, I wouldn't be surprised to see another downside move in the coming days. Buyers are struggling to push price higher, while the lower-high structure is still clearly visible.
My next major downside area is around $67,000. 🎯
Of course, BTC can still surprise us with a sudden recovery. If buyers manage to reclaim $82K and hold above it, this bearish idea could start losing strength.
But until that happens, I'm not rushing to call a bottom. Another leg down is still very much possible.
Let's see how this plays out. Bitcoin still has something to prove! ⚠️
Here’s the thing, $BTC 🔻is still not showing any convincing signs of a proper recovery. 👀📉
Looking at the daily chart, I'm still leaning towards the bearish side. #Bitcoin already lost an important support area around $80K–$82K, and the recent bounce was looking like a recovery attempt. But guess what? Price got rejected almost immediately after reaching that same zone.
This is something worth watching. A level which was previously supporting the price is now turning into a resistance area. And sellers seems to be taking advantage of every small bounce
If #BTC continues trading below this region, I wouldn't be surprised to see another downside move in the coming days. Buyers are struggling to push price higher, while the lower-high structure is still clearly visible.
My next major downside area is around $67,000. 🎯
Of course, BTC can still surprise us with a sudden recovery. If buyers manage to reclaim $82K and hold above it, this bearish idea could start losing strength.
But until that happens, I'm not rushing to call a bottom. Another leg down is still very much possible.
Let's see how this plays out. Bitcoin still has something to prove! ⚠️
Looking at the daily chart, I'm still leaning towards the bearish side. #Bitcoin already lost an important support area around $80K–$82K, and the recent bounce was looking like a recovery attempt. But guess what? Price got rejected almost immediately after reaching that same zone.
This is something worth watching. A level which was previously supporting the price is now turning into a resistance area. And sellers seems to be taking advantage of every small bounce
If #BTC continues trading below this region, I wouldn't be surprised to see another downside move in the coming days. Buyers are struggling to push price higher, while the lower-high structure is still clearly visible.
My next major downside area is around $67,000. 🎯
Of course, BTC can still surprise us with a sudden recovery. If buyers manage to reclaim $82K and hold above it, this bearish idea could start losing strength.
But until that happens, I'm not rushing to call a bottom. Another leg down is still very much possible.
Let's see how this plays out. Bitcoin still has something to prove! ⚠️
1
250

·
--
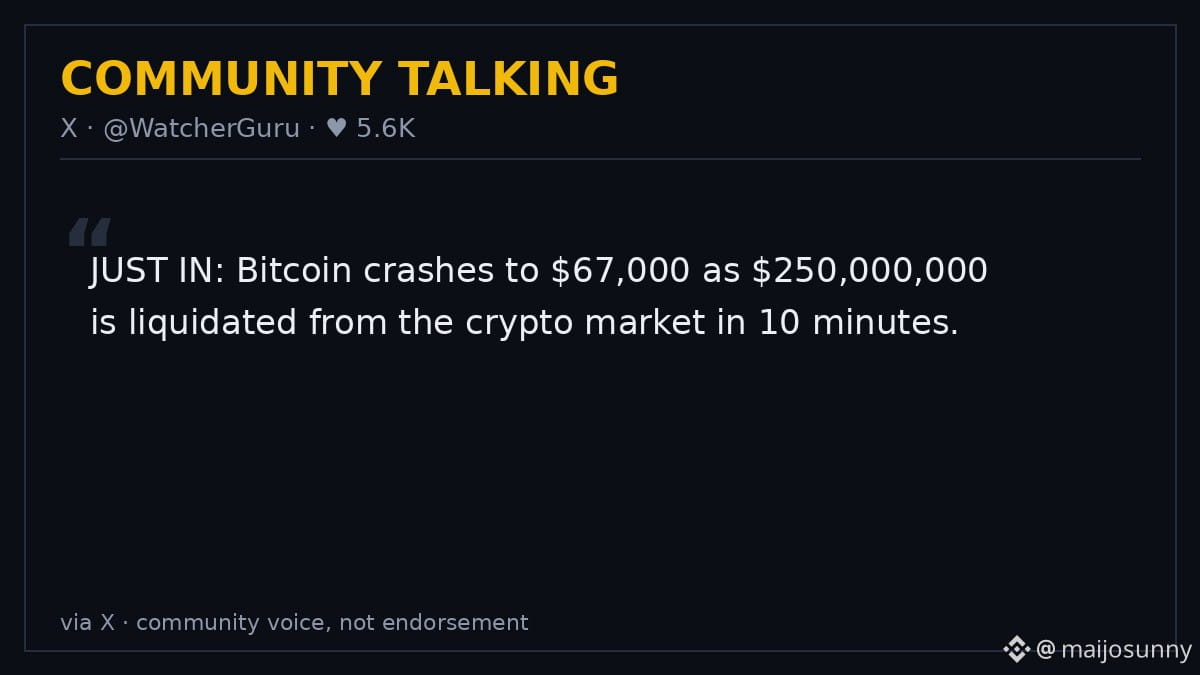
🚨 BTC JUST LOST $67K — $250M LIQUIDATED IN 10 MINUTES 👀
Bitcoin fell to about $66,500 overnight, its lowest since mid-August, after breaking the $70,000 level on Friday. $BTC now trades near $67,180, down 2.4% in 24 hours and roughly 12% on the week, 46.6% below its $126,080 all-time high from October 6 (CoinGecko via Crypto Times).
📊 The damage:
• $1.26B liquidated in 24h (CoinGlass), 86% of it longs; Bitcoin positions alone took $635.8M
• $250M wiped out in a single 10-minute window during the overnight flush (WatcherGuru)
• $ETH slipped under $1,900 and $SOL under $75, while XRP lost the $1 handle
• Spot BTC ETFs: $284M outflows on Nov 12, the 6th straight session of withdrawals (SoSoValue)
• Fear & Greed: 13, Extreme Fear, down from 20 yesterday
🔥 Why it matters: the 200-week moving average near $67,900 is now overhead, and the next floor sits at $66,000–$67,000. But one day of forced selling does not erase the whole trend. Liquidations are deleveraging, not the same as durable spot selling, and ETF outflows of about $1.5B across six sessions (Coinotag) say the bid stepped aside before the weekend flush even started.
My take: this is bigger than one red weekend. The market had no buyer underneath it, and a thin weekend book turned a break of $70K into a cascade. The first candle is noise, what decides the next leg is whether $66K holds into the Sunday weekly close.
What to watch:
• $66,000–$67,000 floor into the weekly close, a 6th straight weekly loss on the line
• Spot ETF flows when markets reopen Monday
• Whether BTC reclaims the 200-week MA near $67,900
Bottom line: a $250M 10-minute flush is a leverage event, not a verdict. If $66K holds, this is a washout. If it breaks, $63,000–$66,000 is next.
Is this a leverage washout setting up a bounce, or the start of another leg down? 🐂🐻
Not financial advice. DYOR.
#crypto #Bitcoin #BTCcrash
🚨 BTC JUST LOST $67K — $250M LIQUIDATED IN 10 MINUTES 👀
Bitcoin fell to about $66,500 overnight, its lowest since mid-August, after breaking the $70,000 level on Friday. $BTC now trades near $67,180, down 2.4% in 24 hours and roughly 12% on the week, 46.6% below its $126,080 all-time high from October 6 (CoinGecko via Crypto Times).
📊 The damage:
• $1.26B liquidated in 24h (CoinGlass), 86% of it longs; Bitcoin positions alone took $635.8M
• $250M wiped out in a single 10-minute window during the overnight flush (WatcherGuru)
• $ETH slipped under $1,900 and $SOL under $75, while XRP lost the $1 handle
• Spot BTC ETFs: $284M outflows on Nov 12, the 6th straight session of withdrawals (SoSoValue)
• Fear & Greed: 13, Extreme Fear, down from 20 yesterday
🔥 Why it matters: the 200-week moving average near $67,900 is now overhead, and the next floor sits at $66,000–$67,000. But one day of forced selling does not erase the whole trend. Liquidations are deleveraging, not the same as durable spot selling, and ETF outflows of about $1.5B across six sessions (Coinotag) say the bid stepped aside before the weekend flush even started.
My take: this is bigger than one red weekend. The market had no buyer underneath it, and a thin weekend book turned a break of $70K into a cascade. The first candle is noise, what decides the next leg is whether $66K holds into the Sunday weekly close.
What to watch:
• $66,000–$67,000 floor into the weekly close, a 6th straight weekly loss on the line
• Spot ETF flows when markets reopen Monday
• Whether BTC reclaims the 200-week MA near $67,900
Bottom line: a $250M 10-minute flush is a leverage event, not a verdict. If $66K holds, this is a washout. If it breaks, $63,000–$66,000 is next.
Is this a leverage washout setting up a bounce, or the start of another leg down? 🐂🐻
Not financial advice. DYOR.
#crypto #Bitcoin #BTCcrash
Bitcoin fell to about $66,500 overnight, its lowest since mid-August, after breaking the $70,000 level on Friday. $BTC now trades near $67,180, down 2.4% in 24 hours and roughly 12% on the week, 46.6% below its $126,080 all-time high from October 6 (CoinGecko via Crypto Times).
📊 The damage:
• $1.26B liquidated in 24h (CoinGlass), 86% of it longs; Bitcoin positions alone took $635.8M
• $250M wiped out in a single 10-minute window during the overnight flush (WatcherGuru)
• $ETH slipped under $1,900 and $SOL under $75, while XRP lost the $1 handle
• Spot BTC ETFs: $284M outflows on Nov 12, the 6th straight session of withdrawals (SoSoValue)
• Fear & Greed: 13, Extreme Fear, down from 20 yesterday
🔥 Why it matters: the 200-week moving average near $67,900 is now overhead, and the next floor sits at $66,000–$67,000. But one day of forced selling does not erase the whole trend. Liquidations are deleveraging, not the same as durable spot selling, and ETF outflows of about $1.5B across six sessions (Coinotag) say the bid stepped aside before the weekend flush even started.
My take: this is bigger than one red weekend. The market had no buyer underneath it, and a thin weekend book turned a break of $70K into a cascade. The first candle is noise, what decides the next leg is whether $66K holds into the Sunday weekly close.
What to watch:
• $66,000–$67,000 floor into the weekly close, a 6th straight weekly loss on the line
• Spot ETF flows when markets reopen Monday
• Whether BTC reclaims the 200-week MA near $67,900
Bottom line: a $250M 10-minute flush is a leverage event, not a verdict. If $66K holds, this is a washout. If it breaks, $63,000–$66,000 is next.
Is this a leverage washout setting up a bounce, or the start of another leg down? 🐂🐻
Not financial advice. DYOR.
#crypto #Bitcoin #BTCcrash
30

·
--
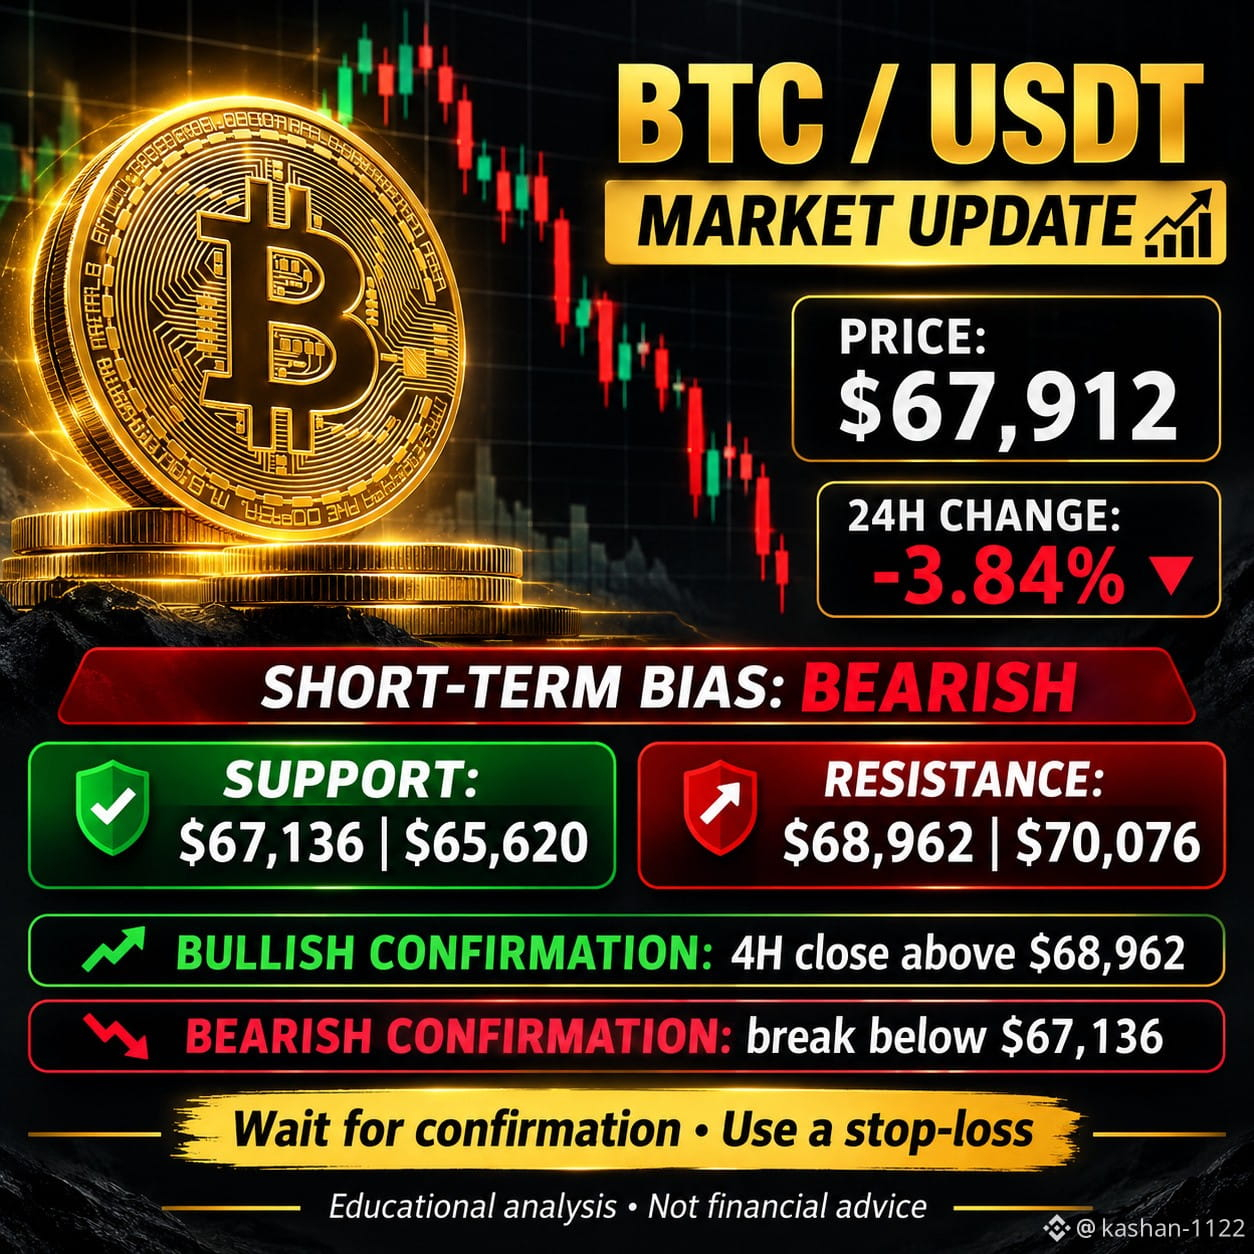
🚨 $BTC BTC/USDT MARKET UPDATE
Bitcoin is facing strong selling pressure. The short-term trend remains bearish.
📊 Current Price: $67,912
🔴 24H Change: -3.84%
🟢 SUPPORT ZONES
- $67,136
- $65,620
🔴 RESISTANCE ZONES
- $68,962
- $70,076
📈 TRADE SETUP
🟢 LONG: Only after a confirmed 4H candle close above $68,962.
🔴 SHORT: If BTC breaks below $67,136 with confirmation.
⚠️ Avoid emotional entries. Always use Stop Loss and manage your risk.
What is your prediction? BTC recovery or further downside? 👇
Follow for more BTC market updates and technical analysis.
$BTC
{future}(BTCUSDT)
#Bitcoin #BinanceSquare #CryptoAnalysis #TradingSignals
🚨 $BTC BTC/USDT MARKET UPDATE
Bitcoin is facing strong selling pressure. The short-term trend remains bearish.
📊 Current Price: $67,912
🔴 24H Change: -3.84%
🟢 SUPPORT ZONES
- $67,136
- $65,620
🔴 RESISTANCE ZONES
- $68,962
- $70,076
📈 TRADE SETUP
🟢 LONG: Only after a confirmed 4H candle close above $68,962.
🔴 SHORT: If BTC breaks below $67,136 with confirmation.
⚠️ Avoid emotional entries. Always use Stop Loss and manage your risk.
What is your prediction? BTC recovery or further downside? 👇
Follow for more BTC market updates and technical analysis.
$BTC
#Bitcoin #BinanceSquare #CryptoAnalysis #TradingSignals
Bitcoin is facing strong selling pressure. The short-term trend remains bearish.
📊 Current Price: $67,912
🔴 24H Change: -3.84%
🟢 SUPPORT ZONES
- $67,136
- $65,620
🔴 RESISTANCE ZONES
- $68,962
- $70,076
📈 TRADE SETUP
🟢 LONG: Only after a confirmed 4H candle close above $68,962.
🔴 SHORT: If BTC breaks below $67,136 with confirmation.
⚠️ Avoid emotional entries. Always use Stop Loss and manage your risk.
What is your prediction? BTC recovery or further downside? 👇
Follow for more BTC market updates and technical analysis.
$BTC
#Bitcoin #BinanceSquare #CryptoAnalysis #TradingSignals
66

$BTC Alert! Is this local bottom a massive buying opportunity or a bear trap? 🚨
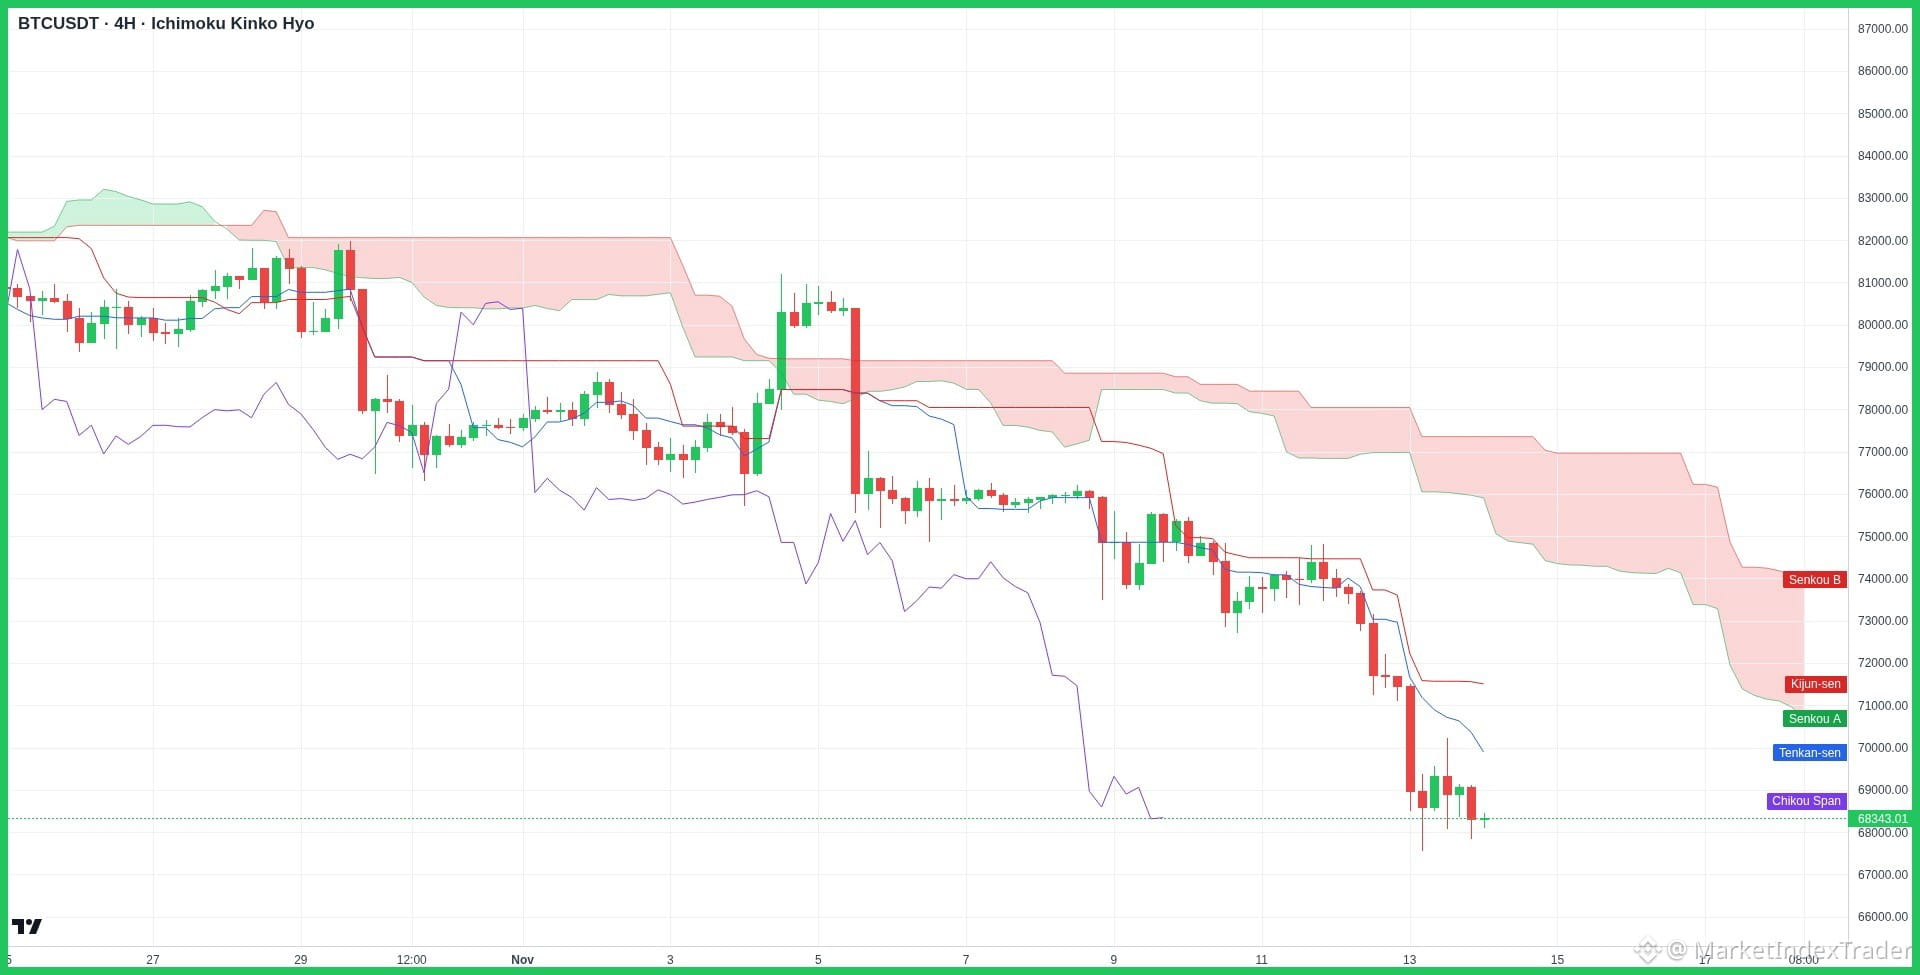
$BTC's 4H Ichimoku chart shows price testing critical support near $68,000 after a sharp pullback below the Kumo cloud.
Alright team, let's break down this spicy $BTC chart and see what's cooking after the recent dip!
Looking at the 4-hour Ichimoku Kinko Hyo chart, Bitcoin is currently hovering around $68,343. Price has dropped below the red Kumo cloud, establishing immediate overhead resistance at $70,000 (Tenkan-sen) and $71,500 (Kijun-sen). However, buyers are actively defending the key support zone between $67,000 and $68,000, hinting at a potential base building for a relief rally.
On the fundamental side, institutional demand remains robust with strong net inflows into Bitcoin spot ETFs and sustained long-term holder accumulation. Furthermore, expanding global macroeconomic liquidity continues to set up a powerful long-term tailwind for BTC.
My strategy is to look for DCA opportunities in this oversold zone while watching for a clean 4H reclaim of $70,000 for confirmation.
Highly recommend HOLD and Stacking $BTC at Binance
Feel free to comment the altcoin you are holding and we will check it for you!
BTC #TechnicalAnalysis #Crypto #BinanceSquare #Bitcoin
$BTC Alert! Is this local bottom a massive buying opportunity or a bear trap? 🚨
$BTC 's 4H Ichimoku chart shows price testing critical support near $68,000 after a sharp pullback below the Kumo cloud.
Alright team, let's break down this spicy $BTC chart and see what's cooking after the recent dip!
Looking at the 4-hour Ichimoku Kinko Hyo chart, Bitcoin is currently hovering around $68,343. Price has dropped below the red Kumo cloud, establishing immediate overhead resistance at $70,000 (Tenkan-sen) and $71,500 (Kijun-sen). However, buyers are actively defending the key support zone between $67,000 and $68,000, hinting at a potential base building for a relief rally.
On the fundamental side, institutional demand remains robust with strong net inflows into Bitcoin spot ETFs and sustained long-term holder accumulation. Furthermore, expanding global macroeconomic liquidity continues to set up a powerful long-term tailwind for BTC.
My strategy is to look for DCA opportunities in this oversold zone while watching for a clean 4H reclaim of $70,000 for confirmation.
Highly recommend HOLD and Stacking $BTC at Binance
Feel free to comment the altcoin you are holding and we will check it for you!
BTC #TechnicalAnalysis #Crypto #BinanceSquare #Bitcoin
$BTC 's 4H Ichimoku chart shows price testing critical support near $68,000 after a sharp pullback below the Kumo cloud.
Alright team, let's break down this spicy $BTC chart and see what's cooking after the recent dip!
Looking at the 4-hour Ichimoku Kinko Hyo chart, Bitcoin is currently hovering around $68,343. Price has dropped below the red Kumo cloud, establishing immediate overhead resistance at $70,000 (Tenkan-sen) and $71,500 (Kijun-sen). However, buyers are actively defending the key support zone between $67,000 and $68,000, hinting at a potential base building for a relief rally.
On the fundamental side, institutional demand remains robust with strong net inflows into Bitcoin spot ETFs and sustained long-term holder accumulation. Furthermore, expanding global macroeconomic liquidity continues to set up a powerful long-term tailwind for BTC.
My strategy is to look for DCA opportunities in this oversold zone while watching for a clean 4H reclaim of $70,000 for confirmation.
Highly recommend HOLD and Stacking $BTC at Binance
Feel free to comment the altcoin you are holding and we will check it for you!
BTC #TechnicalAnalysis #Crypto #BinanceSquare #Bitcoin
40

JUST IN: Crypto is crashing. $BTC has fallen under $67,000, Ethereum is under $1,900, XRP is under $1.00 and Solana is under $75. Over $1.29 billion has been liquidated across crypto in the last 24 hours as the sell-off spreads to every major coin. Is this a buy-the-dip moment, or is more downside coming? 📉🔥
#Bitcoin #Crypto #Altcoins
DYOR. This is not financial advice.
JUST IN: Crypto is crashing. $BTC has fallen under $67,000, Ethereum is under $1,900, XRP is under $1.00 and Solana is under $75. Over $1.29 billion has been liquidated across crypto in the last 24 hours as the sell-off spreads to every major coin. Is this a buy-the-dip moment, or is more downside coming? 📉🔥
#Bitcoin #Crypto #Altcoins
DYOR. This is not financial advice.
#Bitcoin #Crypto #Altcoins
DYOR. This is not financial advice.

13

🚨 BITCOIN BELOW $70K — THE MARKET IS AT A CRITICAL MOMENT!
Bitcoin's latest drop has put the entire crypto market under pressure.
📉 BTC recently fell below $70,000, reaching levels not seen since August.
What's driving the weakness?
🔹 Stronger US dollar
🔹 Rising expectations of Fed rate hikes
🔹 Heavy leveraged liquidations
🔹 Continued ETF outflows
More than $1.6 billion in crypto positions were liquidated over 24 hours, with long positions taking most of the damage.
The big question now is whether buyers can restore confidence or selling pressure will continue.
Is this a temporary correction or the beginning of a deeper market decline? 👇
$BTC #Bitcoin #CryptoMarket #BinanceSquare
{spot}(BTCUSDT)
$AKE
{future}(AKEUSDT)
🚨 BITCOIN BELOW $70K — THE MARKET IS AT A CRITICAL MOMENT!
Bitcoin's latest drop has put the entire crypto market under pressure.
📉 BTC recently fell below $70,000, reaching levels not seen since August.
What's driving the weakness?
🔹 Stronger US dollar
🔹 Rising expectations of Fed rate hikes
🔹 Heavy leveraged liquidations
🔹 Continued ETF outflows
More than $1.6 billion in crypto positions were liquidated over 24 hours, with long positions taking most of the damage.
The big question now is whether buyers can restore confidence or selling pressure will continue.
Is this a temporary correction or the beginning of a deeper market decline? 👇
$BTC #Bitcoin #CryptoMarket #BinanceSquare
$AKE
Bitcoin's latest drop has put the entire crypto market under pressure.
📉 BTC recently fell below $70,000, reaching levels not seen since August.
What's driving the weakness?
🔹 Stronger US dollar
🔹 Rising expectations of Fed rate hikes
🔹 Heavy leveraged liquidations
🔹 Continued ETF outflows
More than $1.6 billion in crypto positions were liquidated over 24 hours, with long positions taking most of the damage.
The big question now is whether buyers can restore confidence or selling pressure will continue.
Is this a temporary correction or the beginning of a deeper market decline? 👇
$BTC #Bitcoin #CryptoMarket #BinanceSquare
$AKE

1
542

·
--
Bearish
🚨 $BTC BEARS ARE IN CONTROL! DOWNSIDE PRESSURE CONTINUES! 🔻
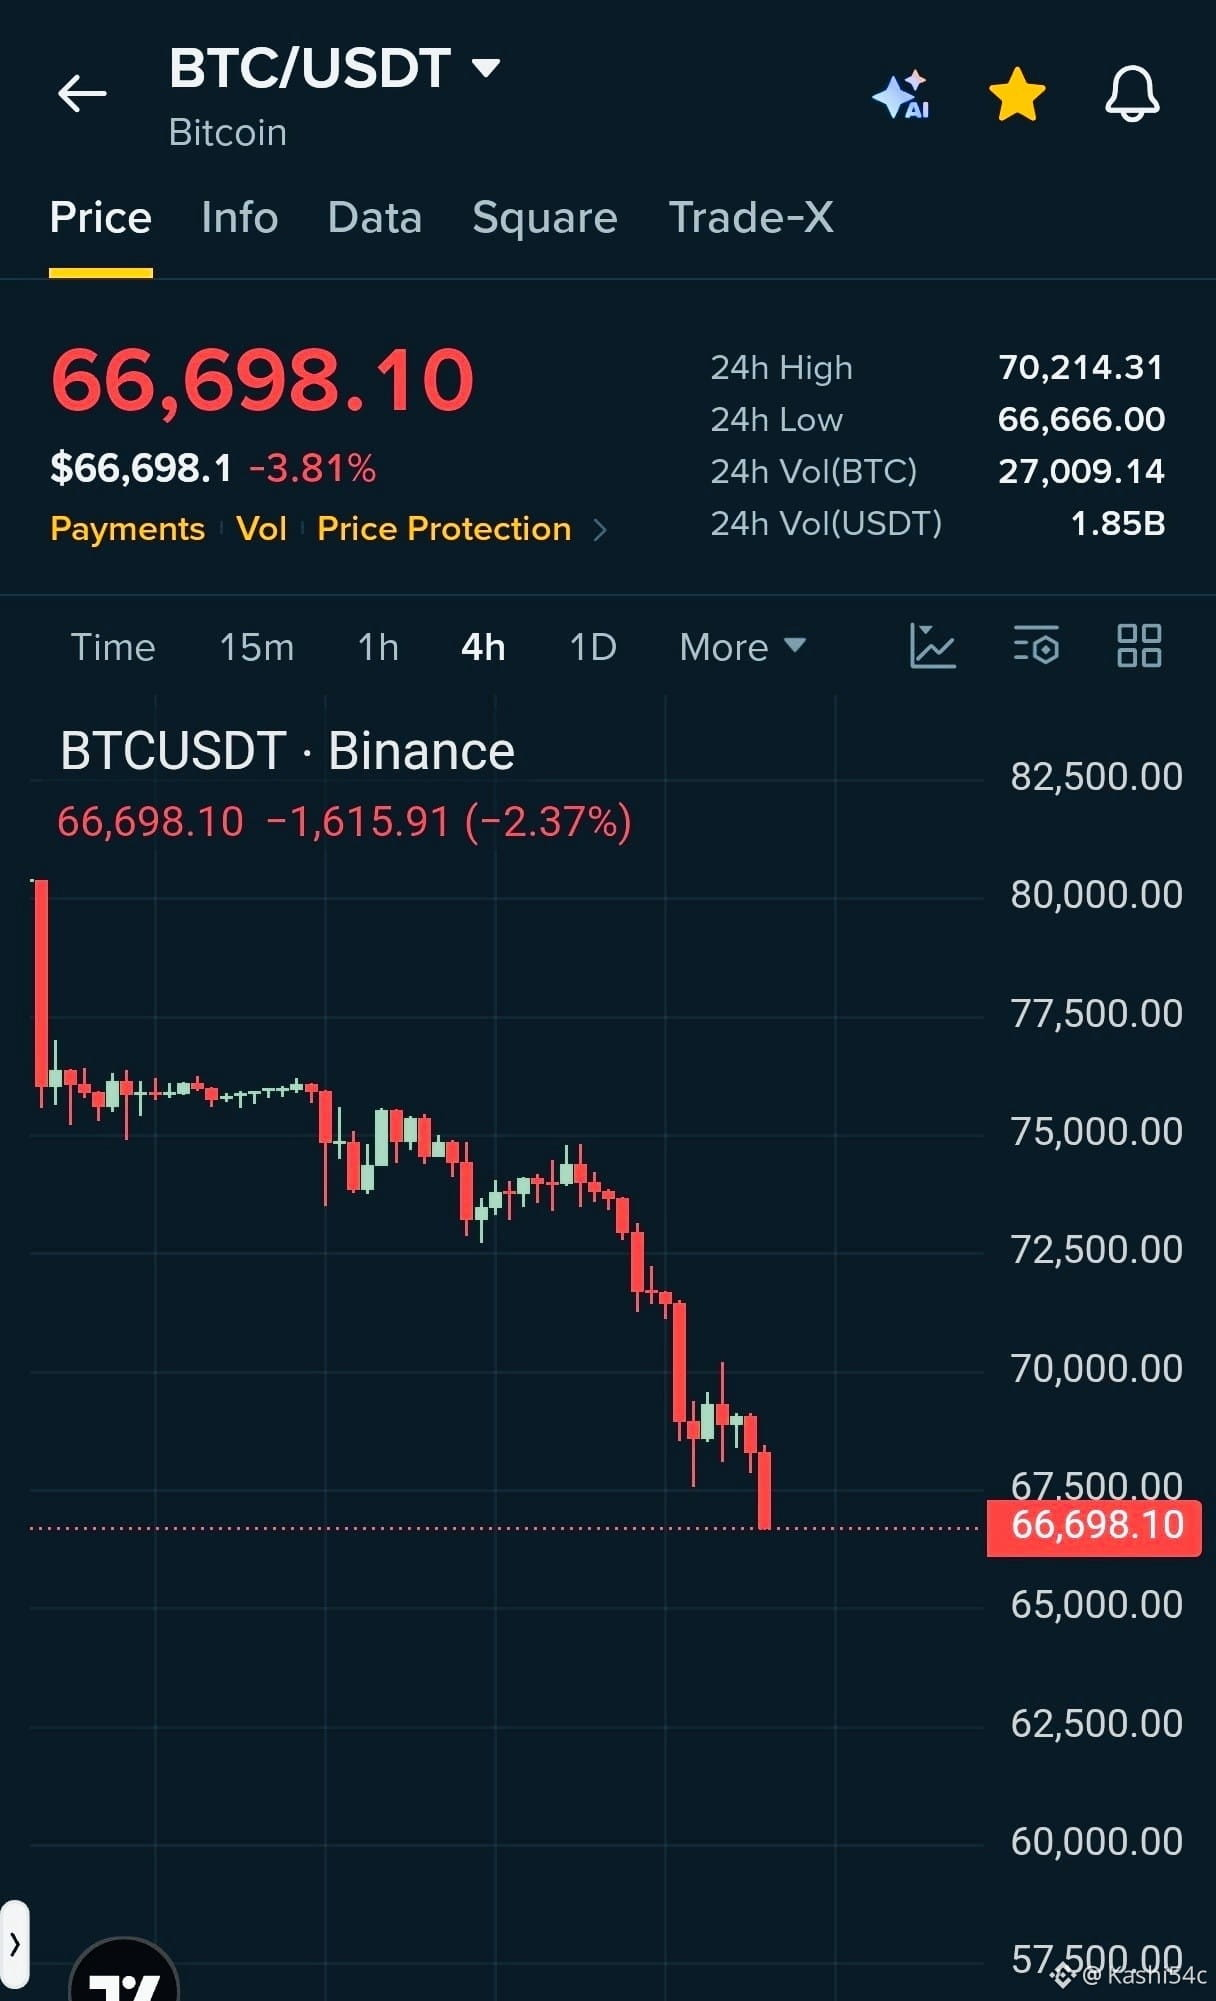
Bitcoin remains under strong selling pressure on the 4H chart. Lower highs and bearish candles suggest sellers are still dominating.
A breakdown below $66,600 could send BTC toward $65,000.
🔴 SHORT TRADE SETUP
📍 Entry: $66,650–$66,900
🎯 TP: $65,000
🛑 SL: $68,000
⚠️ Wait for confirmation before entering. Manage risk and avoid FOMO.$BTC
{spot}(BTCUSDT)
#BTC #Bitcoin #CryptoTrading #Binance
🚨 $BTC BEARS ARE IN CONTROL! DOWNSIDE PRESSURE CONTINUES! 🔻
Bitcoin remains under strong selling pressure on the 4H chart. Lower highs and bearish candles suggest sellers are still dominating.
A breakdown below $66,600 could send BTC toward $65,000.
🔴 SHORT TRADE SETUP
📍 Entry: $66,650–$66,900
🎯 TP: $65,000
🛑 SL: $68,000
⚠️ Wait for confirmation before entering. Manage risk and avoid FOMO.$BTC
#BTC #Bitcoin #CryptoTrading #Binance
Bitcoin remains under strong selling pressure on the 4H chart. Lower highs and bearish candles suggest sellers are still dominating.
A breakdown below $66,600 could send BTC toward $65,000.
🔴 SHORT TRADE SETUP
📍 Entry: $66,650–$66,900
🎯 TP: $65,000
🛑 SL: $68,000
⚠️ Wait for confirmation before entering. Manage risk and avoid FOMO.$BTC
#BTC #Bitcoin #CryptoTrading #Binance
127

·
--
🚨 BITCOIN BELOW $70,000! WHAT JUST HAPPENED?
Bitcoin dropped below the important $70K level on November 13, triggering a massive wave of liquidations across the crypto market.
📉 According to The Block, $1.47 billion in crypto positions were liquidated in 24 hours, with the majority coming from leveraged long positions.
Here's the bigger lesson:
A market can move against heavily leveraged traders much faster than expected.
The next thing worth watching is whether buyers step in and market pressure begins to ease.
No panic. No blind predictions. Just facts and smart decisions.
💬 Do you think Bitcoin can reclaim $70K soon, or will sellers remain in control?
#Bitcoin #BTC #BinanceSquare
🚨 BITCOIN BELOW $70,000! WHAT JUST HAPPENED?
Bitcoin dropped below the important $70K level on November 13, triggering a massive wave of liquidations across the crypto market.
📉 According to The Block, $1.47 billion in crypto positions were liquidated in 24 hours, with the majority coming from leveraged long positions.
Here's the bigger lesson:
A market can move against heavily leveraged traders much faster than expected.
The next thing worth watching is whether buyers step in and market pressure begins to ease.
No panic. No blind predictions. Just facts and smart decisions.
💬 Do you think Bitcoin can reclaim $70K soon, or will sellers remain in control?
#Bitcoin #BTC #BinanceSquare
Bitcoin dropped below the important $70K level on November 13, triggering a massive wave of liquidations across the crypto market.
📉 According to The Block, $1.47 billion in crypto positions were liquidated in 24 hours, with the majority coming from leveraged long positions.
Here's the bigger lesson:
A market can move against heavily leveraged traders much faster than expected.
The next thing worth watching is whether buyers step in and market pressure begins to ease.
No panic. No blind predictions. Just facts and smart decisions.
💬 Do you think Bitcoin can reclaim $70K soon, or will sellers remain in control?
#Bitcoin #BTC #BinanceSquare

85
Log in to explore more content
Join global crypto users on Binance Square
⚡️ Get latest and useful information about crypto.
💬 Trusted by the world’s largest crypto exchange.
👍 Discover real insights from verified creators.
Email / Phone number
Trending Topics
1
#WhoWillSucceedJensenHuangatNvidia?
17,558 views
254 Discussing
2
#WhatWillDriveCryptoandStocks’NextRebound?
296,554 views
2,211 Discussing
3
#USPPIMissMayEaseBTCPressure
132,509 views
1,520 Discussing
4
#TONStrategyReports$23.97MQ3NetLoss
0 views
6 Discussing
5
#PolkadotCommunityApprovesNewStrategyWith97%Vote
0 views
30 Discussing
6
#dYdXPlansV9.9UpgradeToShiftUSDCToInjective
215 views
16 Discussing
7
#TradFiForBeginners
654,681 views
4,243 Discussing
8
#MANTRAPausesUnstakingFor7DaysAfterKeplrSecurityIncident
2,191 views
36 Discussing
9
#BitcoinCoreDisclosesTorTrafficVulnerability
61,928 views
891 Discussing
10
#BitcoinBreaksBelow200WeekMovingAverage
130,990 views
896 Discussing