
#ethereum
ethereum
104.6M views
264,247 Discussing
Hot
Latest

·
--
🚨 ETHEREUM JUST HIT A SECURITY ROADBLOCK — ITS NEXT BIG UPGRADE IS DELAYED!
Ethereum's developers have paused the Glamsterdam upgrade process after security researchers identified compatibility risks.
Here's what happened:
- Four reports identified deployed smart contracts that could be affected.
- The issues involve proposed changes to gas pricing and state costs.
- Developers are reviewing the problems before continuing the hard-fork process.
- The Hoodi testnet activation has been postponed, with no new date announced.
Key takeaway: Ethereum is prioritizing security over speed. Glamsterdam remains in development, not live on mainnet.
#Ethereum #ETH #Crypto
Not financial advice. DYOR.
🚨 ETHEREUM JUST HIT A SECURITY ROADBLOCK — ITS NEXT BIG UPGRADE IS DELAYED!
Ethereum's developers have paused the Glamsterdam upgrade process after security researchers identified compatibility risks.
Here's what happened:
- Four reports identified deployed smart contracts that could be affected.
- The issues involve proposed changes to gas pricing and state costs.
- Developers are reviewing the problems before continuing the hard-fork process.
- The Hoodi testnet activation has been postponed, with no new date announced.
Key takeaway: Ethereum is prioritizing security over speed. Glamsterdam remains in development, not live on mainnet.
#Ethereum #ETH #Crypto
Not financial advice. DYOR.
Ethereum's developers have paused the Glamsterdam upgrade process after security researchers identified compatibility risks.
Here's what happened:
- Four reports identified deployed smart contracts that could be affected.
- The issues involve proposed changes to gas pricing and state costs.
- Developers are reviewing the problems before continuing the hard-fork process.
- The Hoodi testnet activation has been postponed, with no new date announced.
Key takeaway: Ethereum is prioritizing security over speed. Glamsterdam remains in development, not live on mainnet.
#Ethereum #ETH #Crypto
Not financial advice. DYOR.

3
5.5k

·
--
Bearish
🚨 ETH UNDER HEAVY PRESSURE! WILL $1,850 BREAK NEXT?
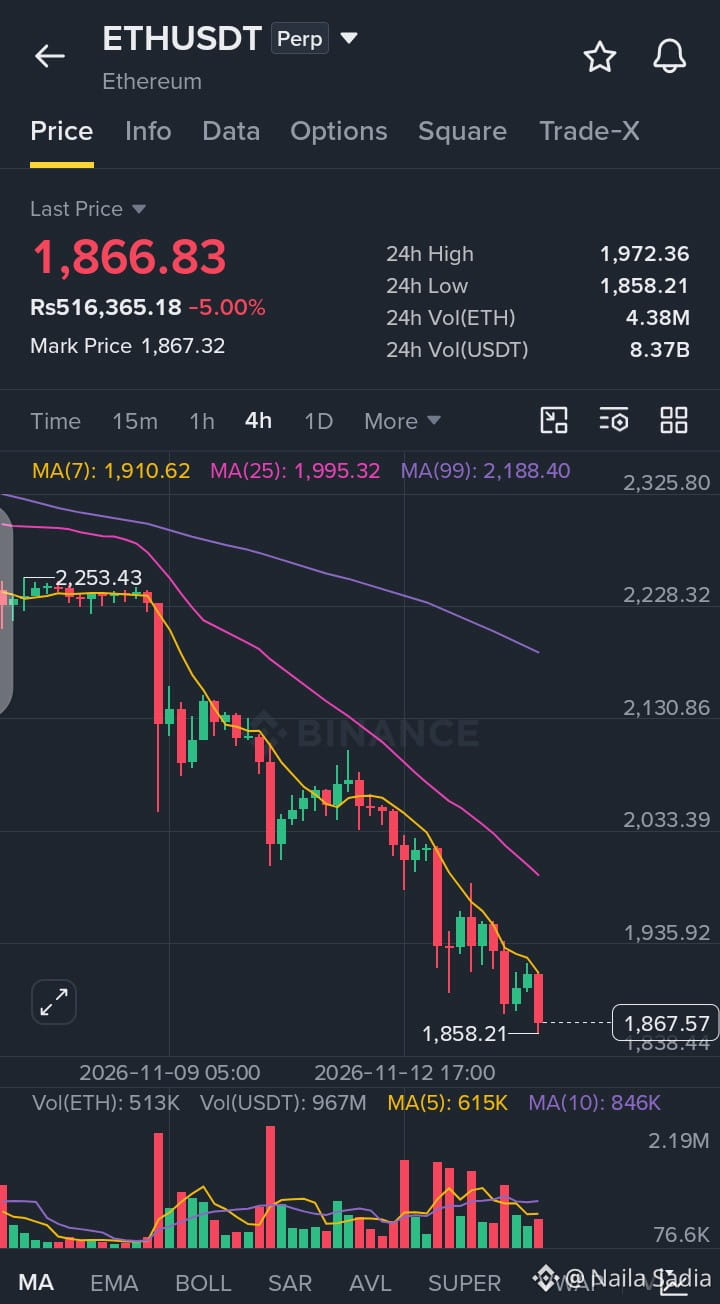
$ETH is trading near $1,866.83, down 5.00%. The 4H chart shows intense selling momentum as the price continues to hold well below all major moving averages (MA 7 at $1,910.62, MA 25 at $1,995.32, and MA 99 at $2,188.40).
📉 Market Outlook: Bearish dominance remains fully active. A break below the $1,858.21 support level could trigger a deeper downside move, while reclaiming $1,972.36 resistance is required for any meaningful trend reversal.
🎯 TRADE PLAN – SHORT
Entry: $1,890.00–$1,920.00
TP1: $1,820.00
TP2: $1,750.00
SL: $1,960.00
💬 Will $ETH break $1,858 or surprise everyone with a bullish recovery?
👇 CLICK HERE FOR TRADE
$ETH
{future}(ETHUSDT)
#ETH #Ethereum #CryptoAnalysis #BinanceSquare
🚨 ETH UNDER HEAVY PRESSURE! WILL $1,850 BREAK NEXT?
$ETH is trading near $1,866.83, down 5.00%. The 4H chart shows intense selling momentum as the price continues to hold well below all major moving averages (MA 7 at $1,910.62, MA 25 at $1,995.32, and MA 99 at $2,188.40).
📉 Market Outlook: Bearish dominance remains fully active. A break below the $1,858.21 support level could trigger a deeper downside move, while reclaiming $1,972.36 resistance is required for any meaningful trend reversal.
🎯 TRADE PLAN – SHORT
Entry: $1,890.00–$1,920.00
TP1: $1,820.00
TP2: $1,750.00
SL: $1,960.00
💬 Will $ETH break $1,858 or surprise everyone with a bullish recovery?
👇 CLICK HERE FOR TRADE
$ETH
#ETH #Ethereum #CryptoAnalysis #BinanceSquare
$ETH is trading near $1,866.83, down 5.00%. The 4H chart shows intense selling momentum as the price continues to hold well below all major moving averages (MA 7 at $1,910.62, MA 25 at $1,995.32, and MA 99 at $2,188.40).
📉 Market Outlook: Bearish dominance remains fully active. A break below the $1,858.21 support level could trigger a deeper downside move, while reclaiming $1,972.36 resistance is required for any meaningful trend reversal.
🎯 TRADE PLAN – SHORT
Entry: $1,890.00–$1,920.00
TP1: $1,820.00
TP2: $1,750.00
SL: $1,960.00
💬 Will $ETH break $1,858 or surprise everyone with a bullish recovery?
👇 CLICK HERE FOR TRADE
$ETH
#ETH #Ethereum #CryptoAnalysis #BinanceSquare
191

🚀 ETHEREUM IS NOT DONE YET!
While some people are waiting for the perfect entry, smart investors are watching the bigger picture. 👀
Ethereum has survived multiple market cycles, and its long-term potential is still worth watching.
🔥 Is ETH preparing for another major move?
📈 Bullish or bearish? What's your prediction?
ETH $5,000 or $2,000 first?
Drop your target below! 👇
#ETH #Ethereum #Crypto @Binance_Square_Official $BTC #Altcoins
🚀 ETHEREUM IS NOT DONE YET!
While some people are waiting for the perfect entry, smart investors are watching the bigger picture. 👀
Ethereum has survived multiple market cycles, and its long-term potential is still worth watching.
🔥 Is ETH preparing for another major move?
📈 Bullish or bearish? What's your prediction?
ETH $5,000 or $2,000 first?
Drop your target below! 👇
#ETH #Ethereum #Crypto @Binance Square Official $BTC #Altcoins
While some people are waiting for the perfect entry, smart investors are watching the bigger picture. 👀
Ethereum has survived multiple market cycles, and its long-term potential is still worth watching.
🔥 Is ETH preparing for another major move?
📈 Bullish or bearish? What's your prediction?
ETH $5,000 or $2,000 first?
Drop your target below! 👇
#ETH #Ethereum #Crypto @Binance Square Official $BTC #Altcoins
126

·
--
Bearish
Honestly, I'm not interested in chasing $ETH at these prices...⚠️👀
#Ethereum is still trading much higher than my preferred buying area, so I'm happy to wait instead of rushing into a position.
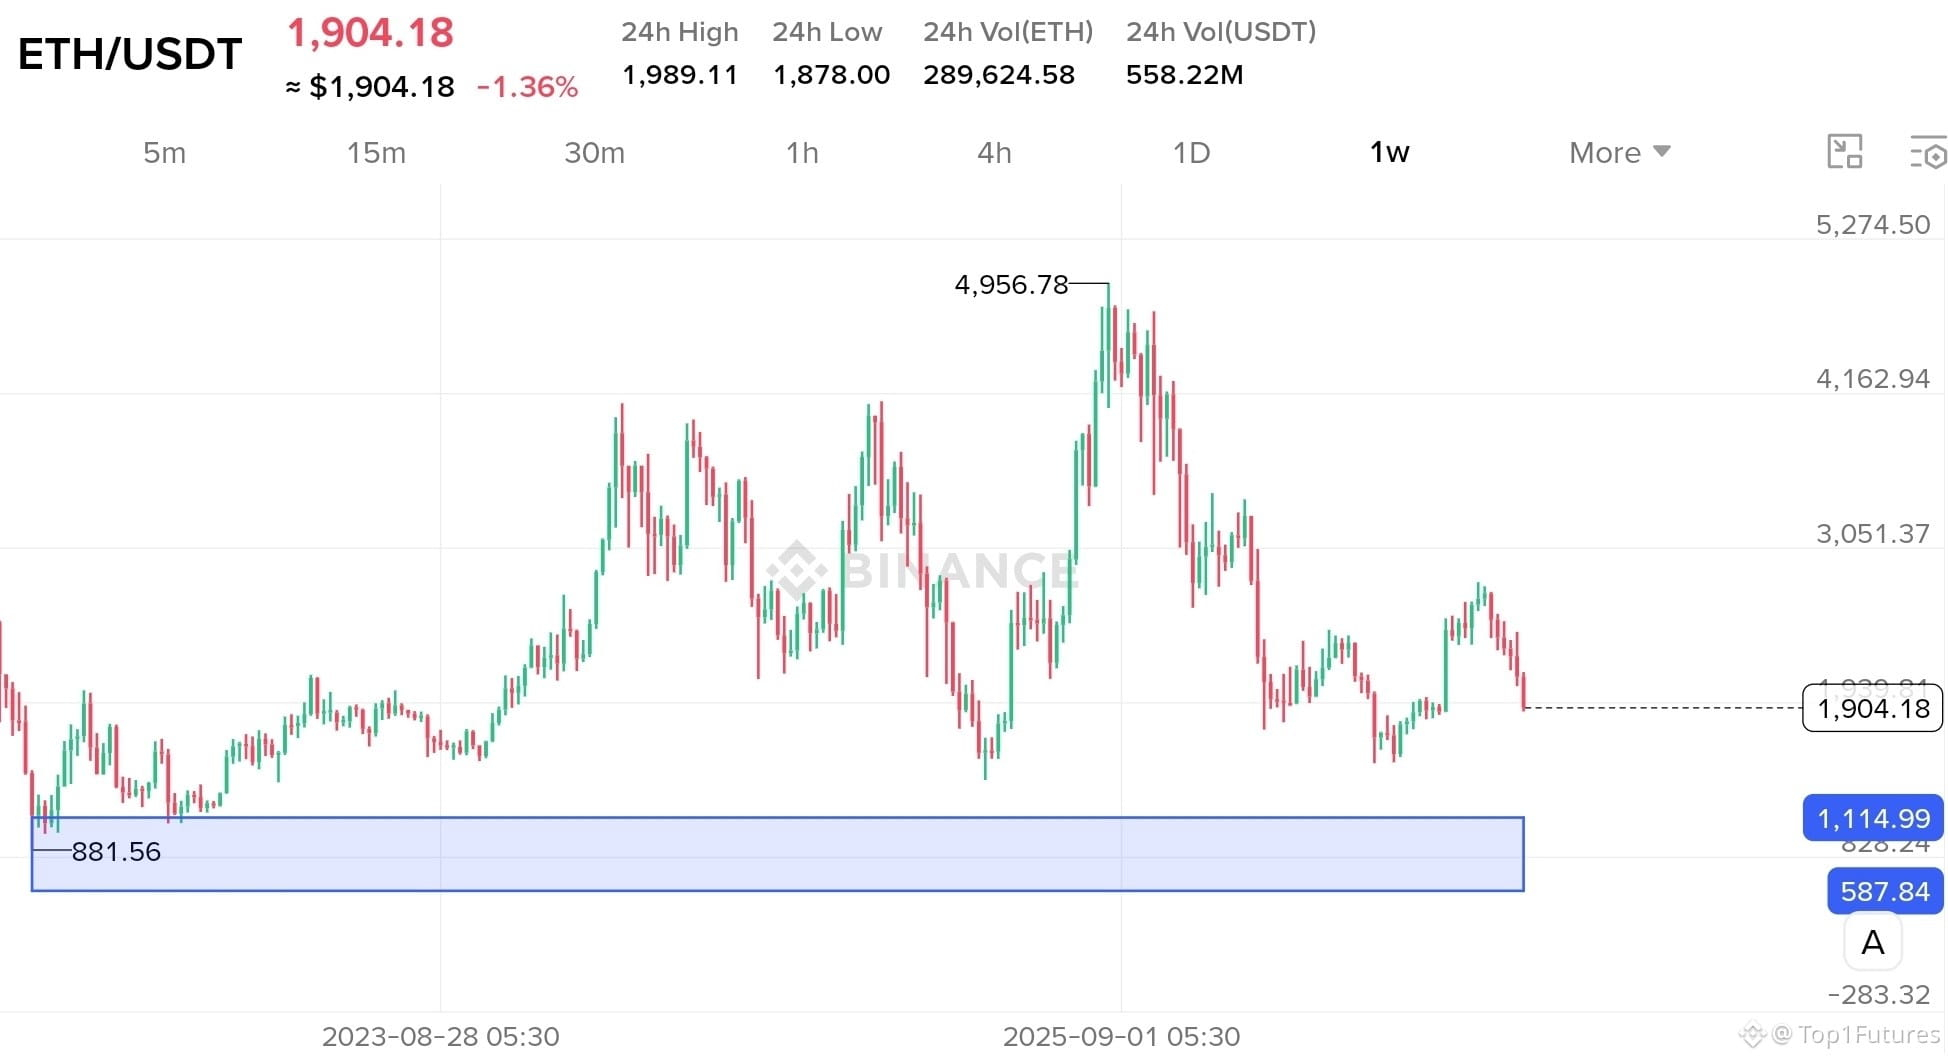
Looking at the weekly chart, I have my eyes on the $1,100–$600 demand zone. If the current weakness continues, ETH could slowly move towards this area in the coming months. 📉
We might see some temporary bounces along the way, but I wouldn't be surprised if another deeper correction happens before a proper recovery.
My plan is simple: patience first, buying later. 🎯
No FOMO, I'll wait for my price!
Honestly, I'm not interested in chasing $ETH at these prices...⚠️👀
#Ethereum is still trading much higher than my preferred buying area, so I'm happy to wait instead of rushing into a position.
Looking at the weekly chart, I have my eyes on the $1,100–$600 demand zone. If the current weakness continues, ETH could slowly move towards this area in the coming months. 📉
We might see some temporary bounces along the way, but I wouldn't be surprised if another deeper correction happens before a proper recovery.
My plan is simple: patience first, buying later. 🎯
No FOMO, I'll wait for my price!
#Ethereum is still trading much higher than my preferred buying area, so I'm happy to wait instead of rushing into a position.
Looking at the weekly chart, I have my eyes on the $1,100–$600 demand zone. If the current weakness continues, ETH could slowly move towards this area in the coming months. 📉
We might see some temporary bounces along the way, but I wouldn't be surprised if another deeper correction happens before a proper recovery.
My plan is simple: patience first, buying later. 🎯
No FOMO, I'll wait for my price!
1
238


·
--
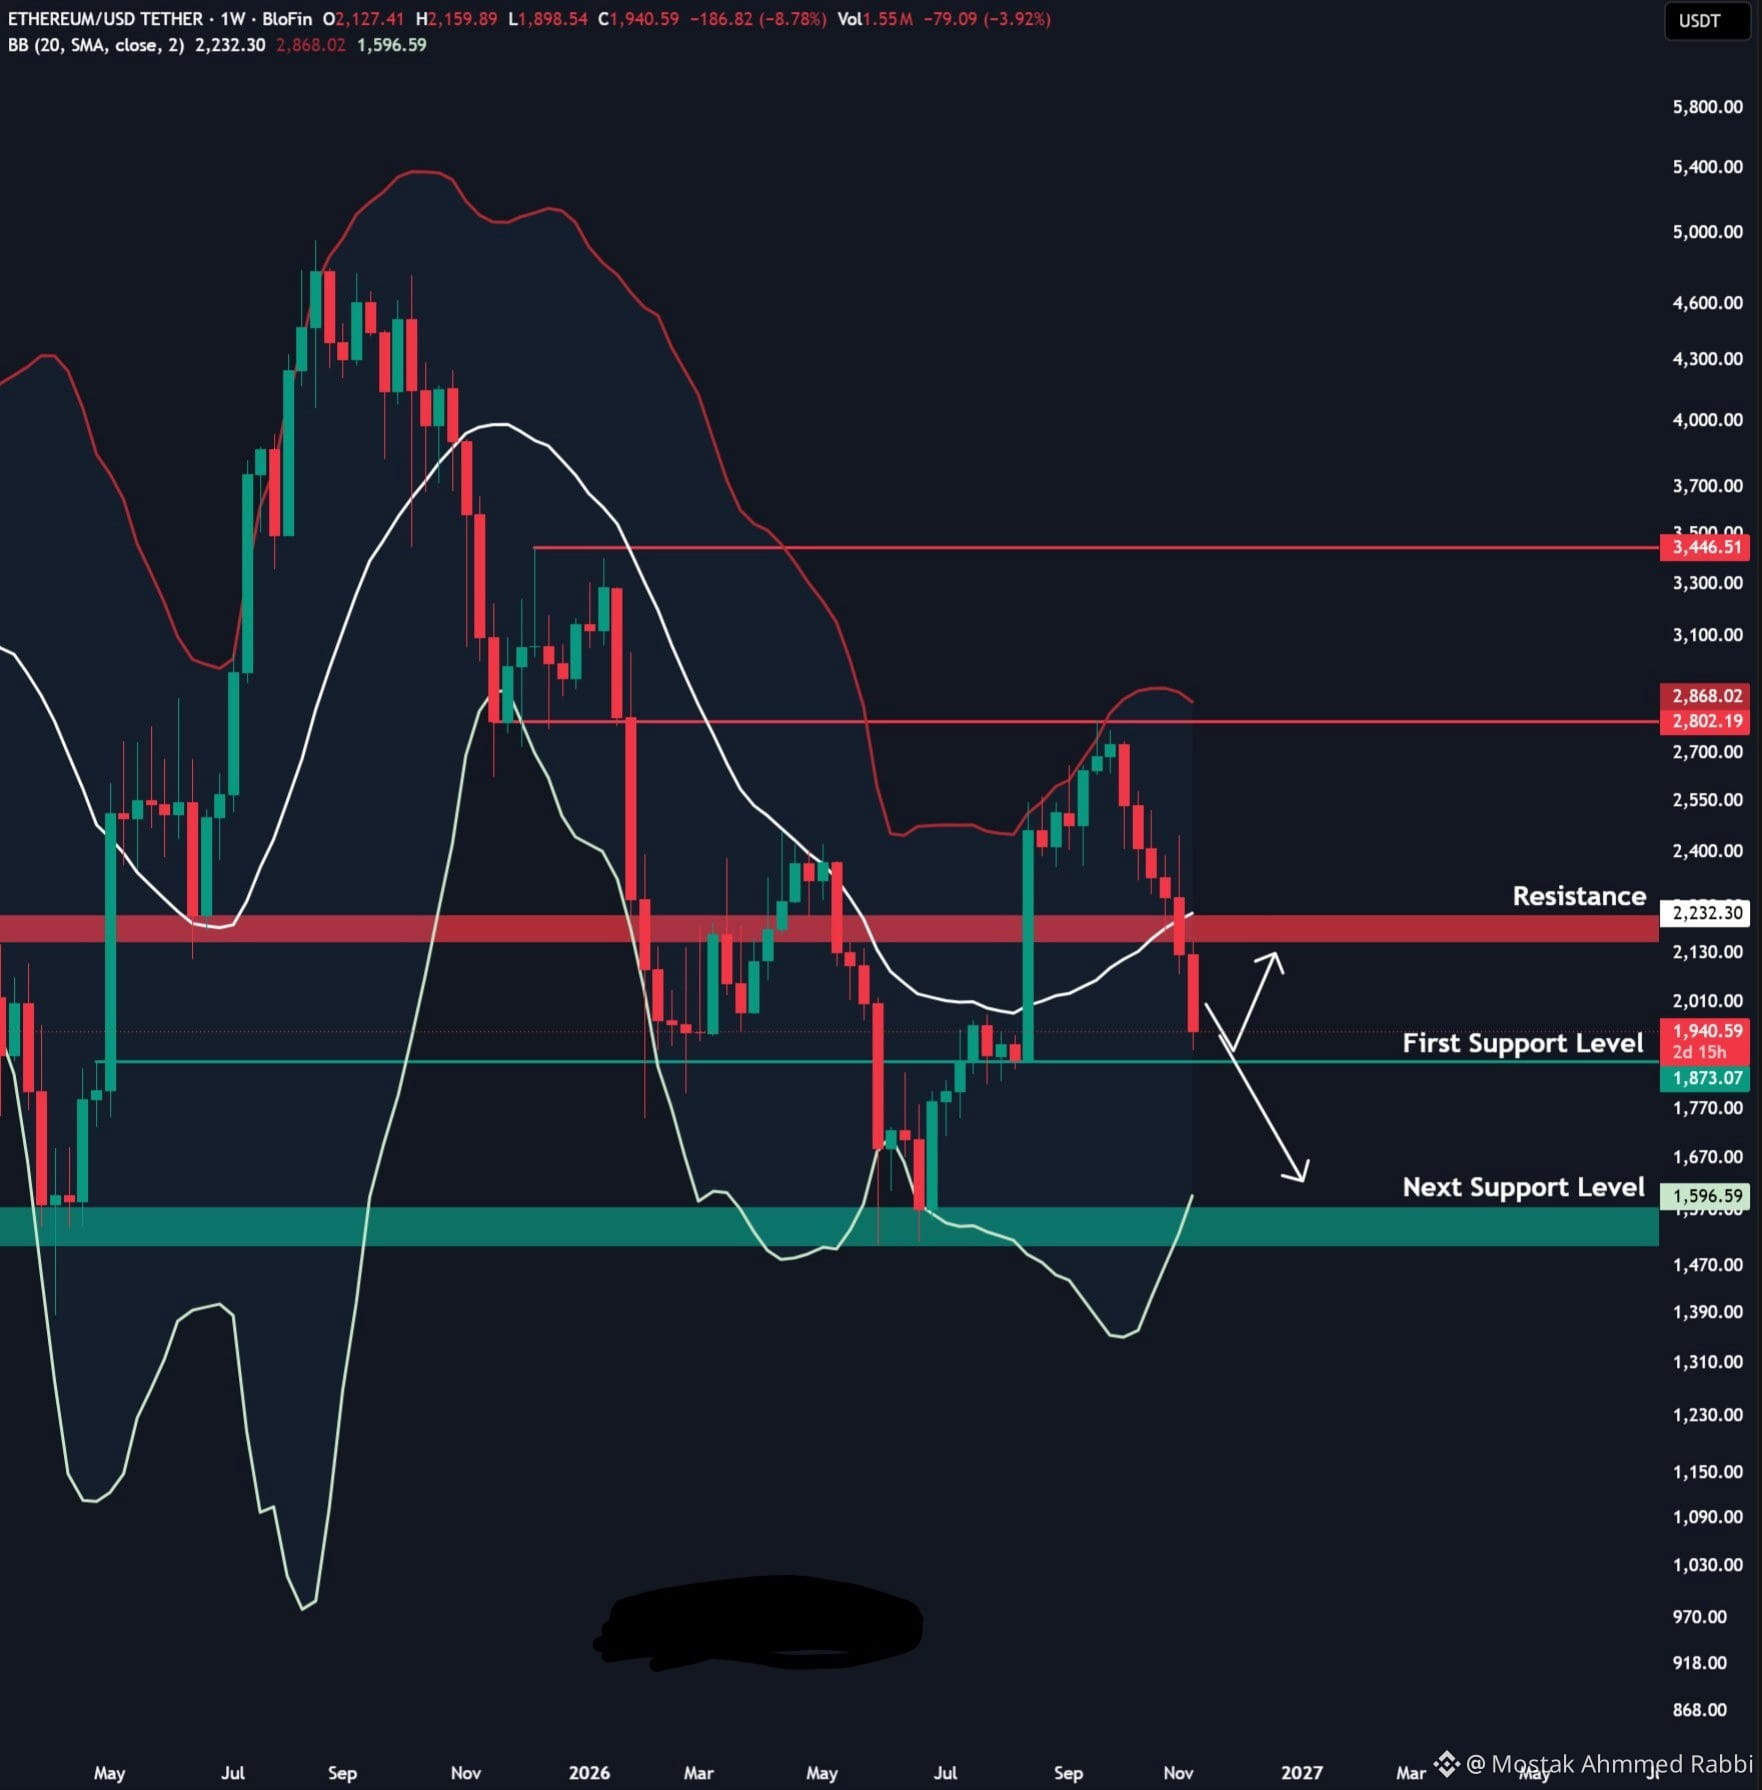
$ETH LEVELS I’M WATCHING! PAY CLOSE ATTENTION
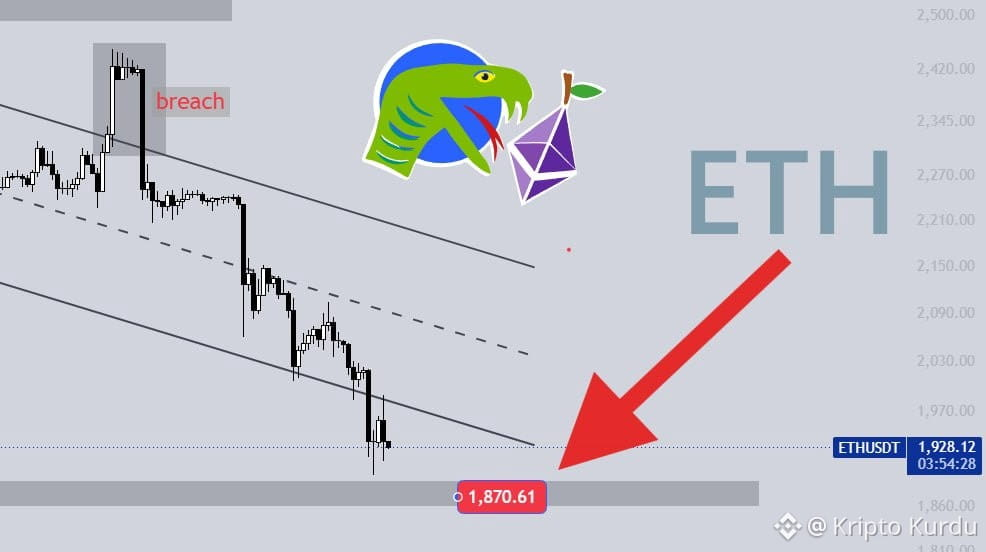
#Ethereum broke out of the channel we identified and pulled back. After rebounding from the lower band, it returned to its downward trend.
Here’s what I expect next: It won’t be able to break out of this channel quickly and will likely trade within a range. Since the channel is downward-sloping, each low could be lower than the previous one.
Additionally, the first support zone is the $1,870 level shown in the chart. I expect a drop to this level initially.
However, if the lower band is broken to the upside, we could see a move above the channel. Therefore, mark these areas on your chart and set separate alerts for each one!
$ETH LEVELS I’M WATCHING! PAY CLOSE ATTENTION
#Ethereum broke out of the channel we identified and pulled back. After rebounding from the lower band, it returned to its downward trend.
Here’s what I expect next: It won’t be able to break out of this channel quickly and will likely trade within a range. Since the channel is downward-sloping, each low could be lower than the previous one.
Additionally, the first support zone is the $1,870 level shown in the chart. I expect a drop to this level initially.
However, if the lower band is broken to the upside, we could see a move above the channel. Therefore, mark these areas on your chart and set separate alerts for each one!
#Ethereum broke out of the channel we identified and pulled back. After rebounding from the lower band, it returned to its downward trend.
Here’s what I expect next: It won’t be able to break out of this channel quickly and will likely trade within a range. Since the channel is downward-sloping, each low could be lower than the previous one.
Additionally, the first support zone is the $1,870 level shown in the chart. I expect a drop to this level initially.
However, if the lower band is broken to the upside, we could see a move above the channel. Therefore, mark these areas on your chart and set separate alerts for each one!
A shaikh-e6e49:
thanx for info
2
13
4.6k

·
--
Bearish
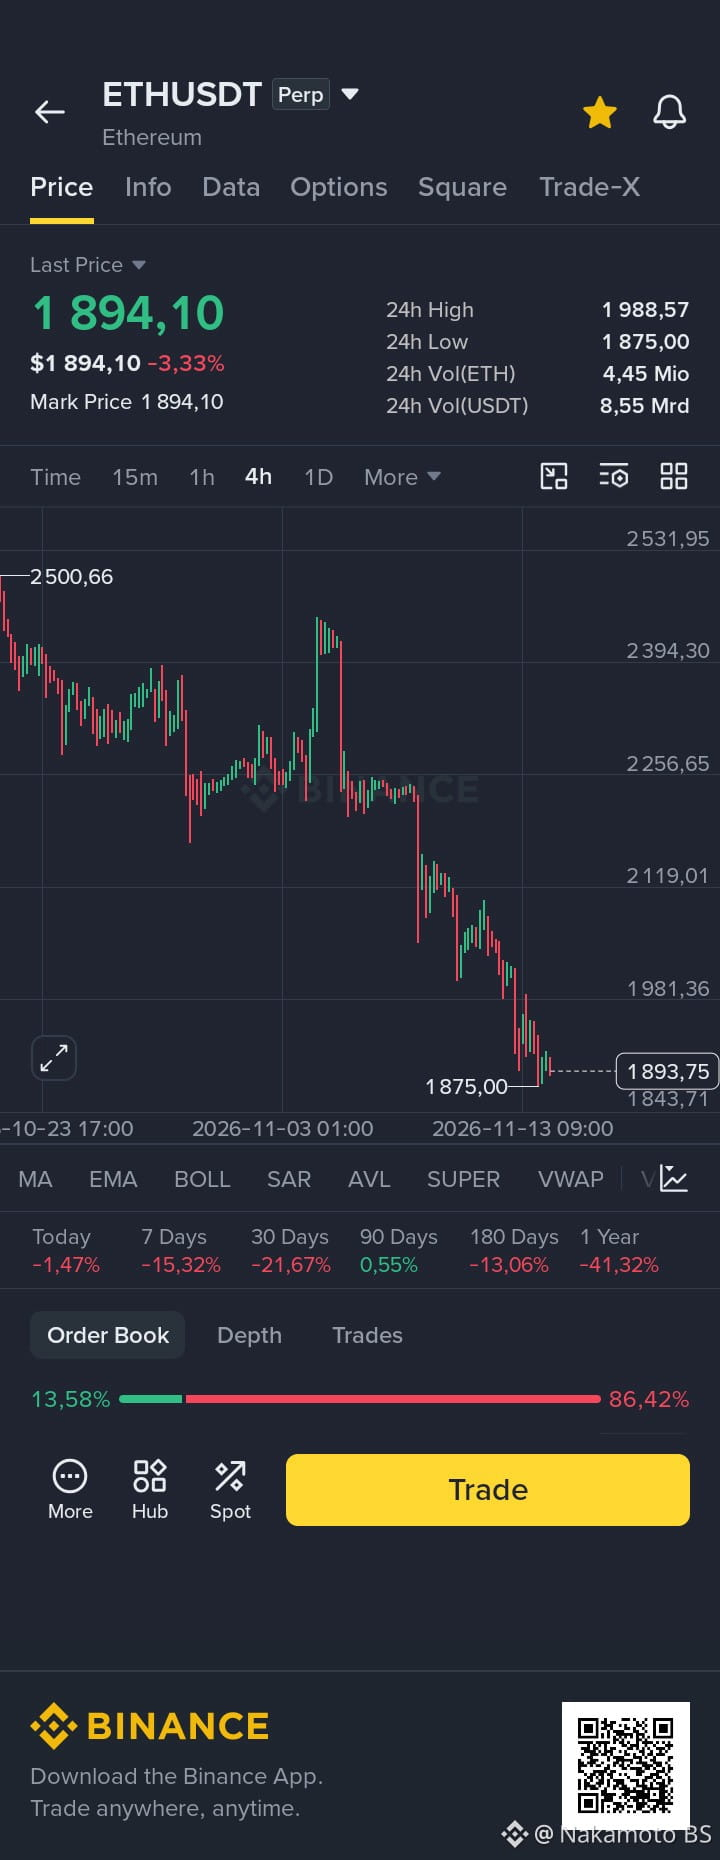
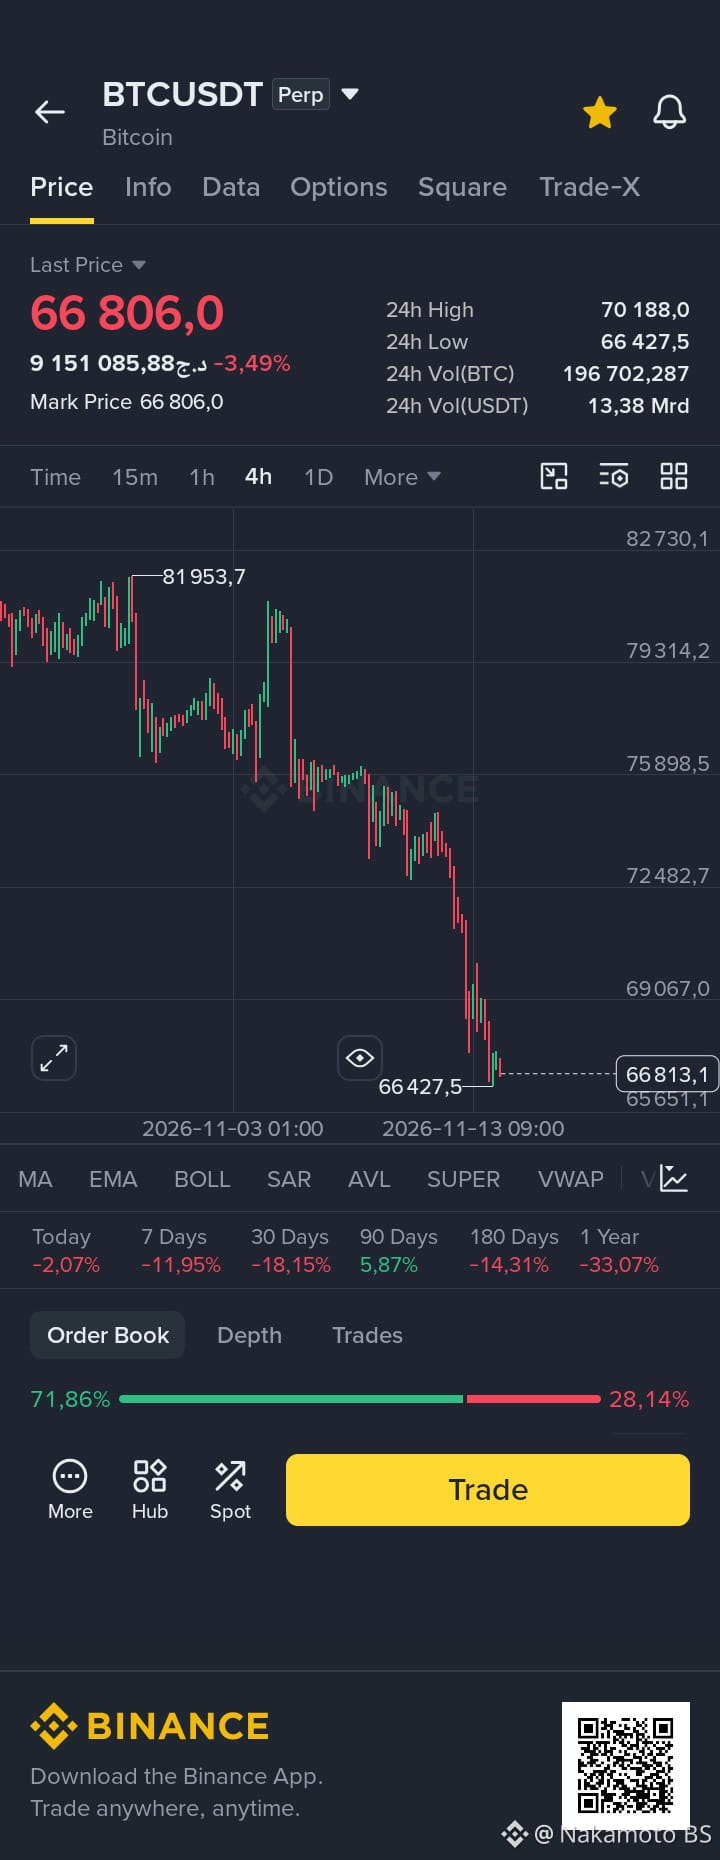
📊 My Analysis of BTC – ETH – SOL | Will the Downtrend Continue or Will We See a Rebound
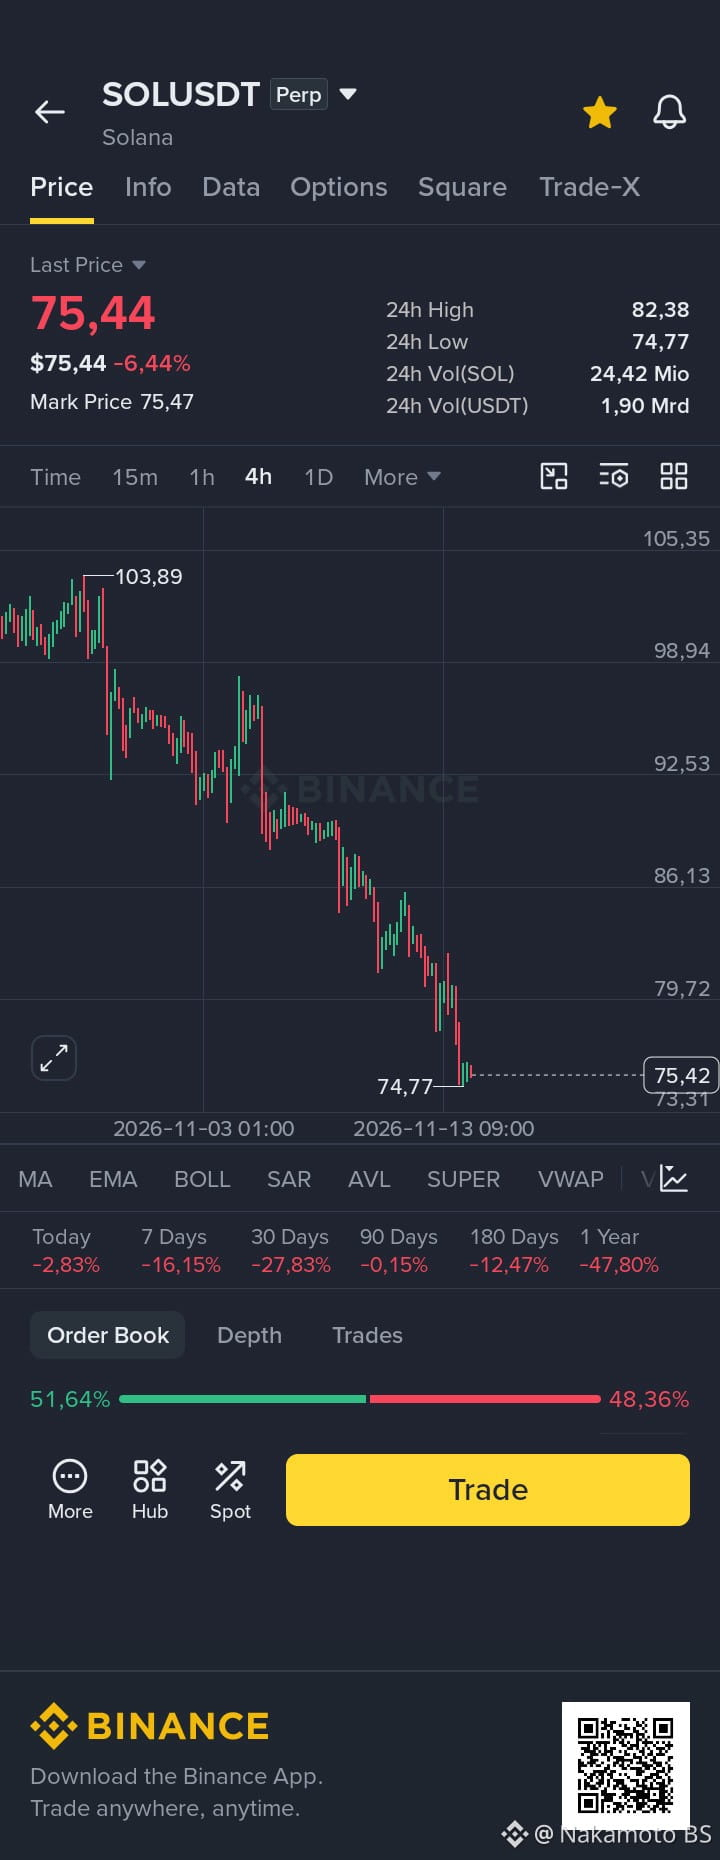
I analyzed the three cryptocurrencies on the 4-hour timeframe and noticed a clear similarity in their trends, with selling pressure dominating as prices continue to form lower highs and lower lows.
🔶 $BTC – Bitcoin
Support: $66,427 – $65,651
Resistance: $69,067 – $72,482
🔷 $ETH – Ethereum
Support: $1,875 – $1,843
Resistance: $1,981 – $2,119
🟣 $SOL – Solana
Support: $74.77 – $73.31
Resistance: $79.72 – $86.13
What Do I See?
I believe all three cryptocurrencies are still in a downtrend.
I notice that Bitcoin is attempting to stabilize near its support zone.
Ethereum is still facing continuous selling pressure.
Solana is showing greater weakness in the current market movement compared to the other two cryptocurrencies.
My Conclusion: In my view, there is still no confirmed signal of a trend reversal. I will monitor the support zones and the ability of prices to reclaim key resistance levels before considering any rebound the beginning of a genuine recovery.
I don't rush into decisions. For me, confirming the trend is far more important than simply predicting it.
#Bitcoin #Ethereum #solana
{future}(BTCUSDT)
{future}(ETHUSDT)
{future}(SOLUSDT)
📊 My Analysis of BTC – ETH – SOL | Will the Downtrend Continue or Will We See a Rebound
I analyzed the three cryptocurrencies on the 4-hour timeframe and noticed a clear similarity in their trends, with selling pressure dominating as prices continue to form lower highs and lower lows.
🔶 $BTC – Bitcoin
Support: $66,427 – $65,651
Resistance: $69,067 – $72,482
🔷 $ETH – Ethereum
Support: $1,875 – $1,843
Resistance: $1,981 – $2,119
🟣 $SOL – Solana
Support: $74.77 – $73.31
Resistance: $79.72 – $86.13
What Do I See?
I believe all three cryptocurrencies are still in a downtrend.
I notice that Bitcoin is attempting to stabilize near its support zone.
Ethereum is still facing continuous selling pressure.
Solana is showing greater weakness in the current market movement compared to the other two cryptocurrencies.
My Conclusion: In my view, there is still no confirmed signal of a trend reversal. I will monitor the support zones and the ability of prices to reclaim key resistance levels before considering any rebound the beginning of a genuine recovery.
I don't rush into decisions. For me, confirming the trend is far more important than simply predicting it.
#Bitcoin #Ethereum #solana
I analyzed the three cryptocurrencies on the 4-hour timeframe and noticed a clear similarity in their trends, with selling pressure dominating as prices continue to form lower highs and lower lows.
🔶 $BTC – Bitcoin
Support: $66,427 – $65,651
Resistance: $69,067 – $72,482
🔷 $ETH – Ethereum
Support: $1,875 – $1,843
Resistance: $1,981 – $2,119
🟣 $SOL – Solana
Support: $74.77 – $73.31
Resistance: $79.72 – $86.13
What Do I See?
I believe all three cryptocurrencies are still in a downtrend.
I notice that Bitcoin is attempting to stabilize near its support zone.
Ethereum is still facing continuous selling pressure.
Solana is showing greater weakness in the current market movement compared to the other two cryptocurrencies.
My Conclusion: In my view, there is still no confirmed signal of a trend reversal. I will monitor the support zones and the ability of prices to reclaim key resistance levels before considering any rebound the beginning of a genuine recovery.
I don't rush into decisions. For me, confirming the trend is far more important than simply predicting it.
#Bitcoin #Ethereum #solana
26

·
--
Bullish
Verified
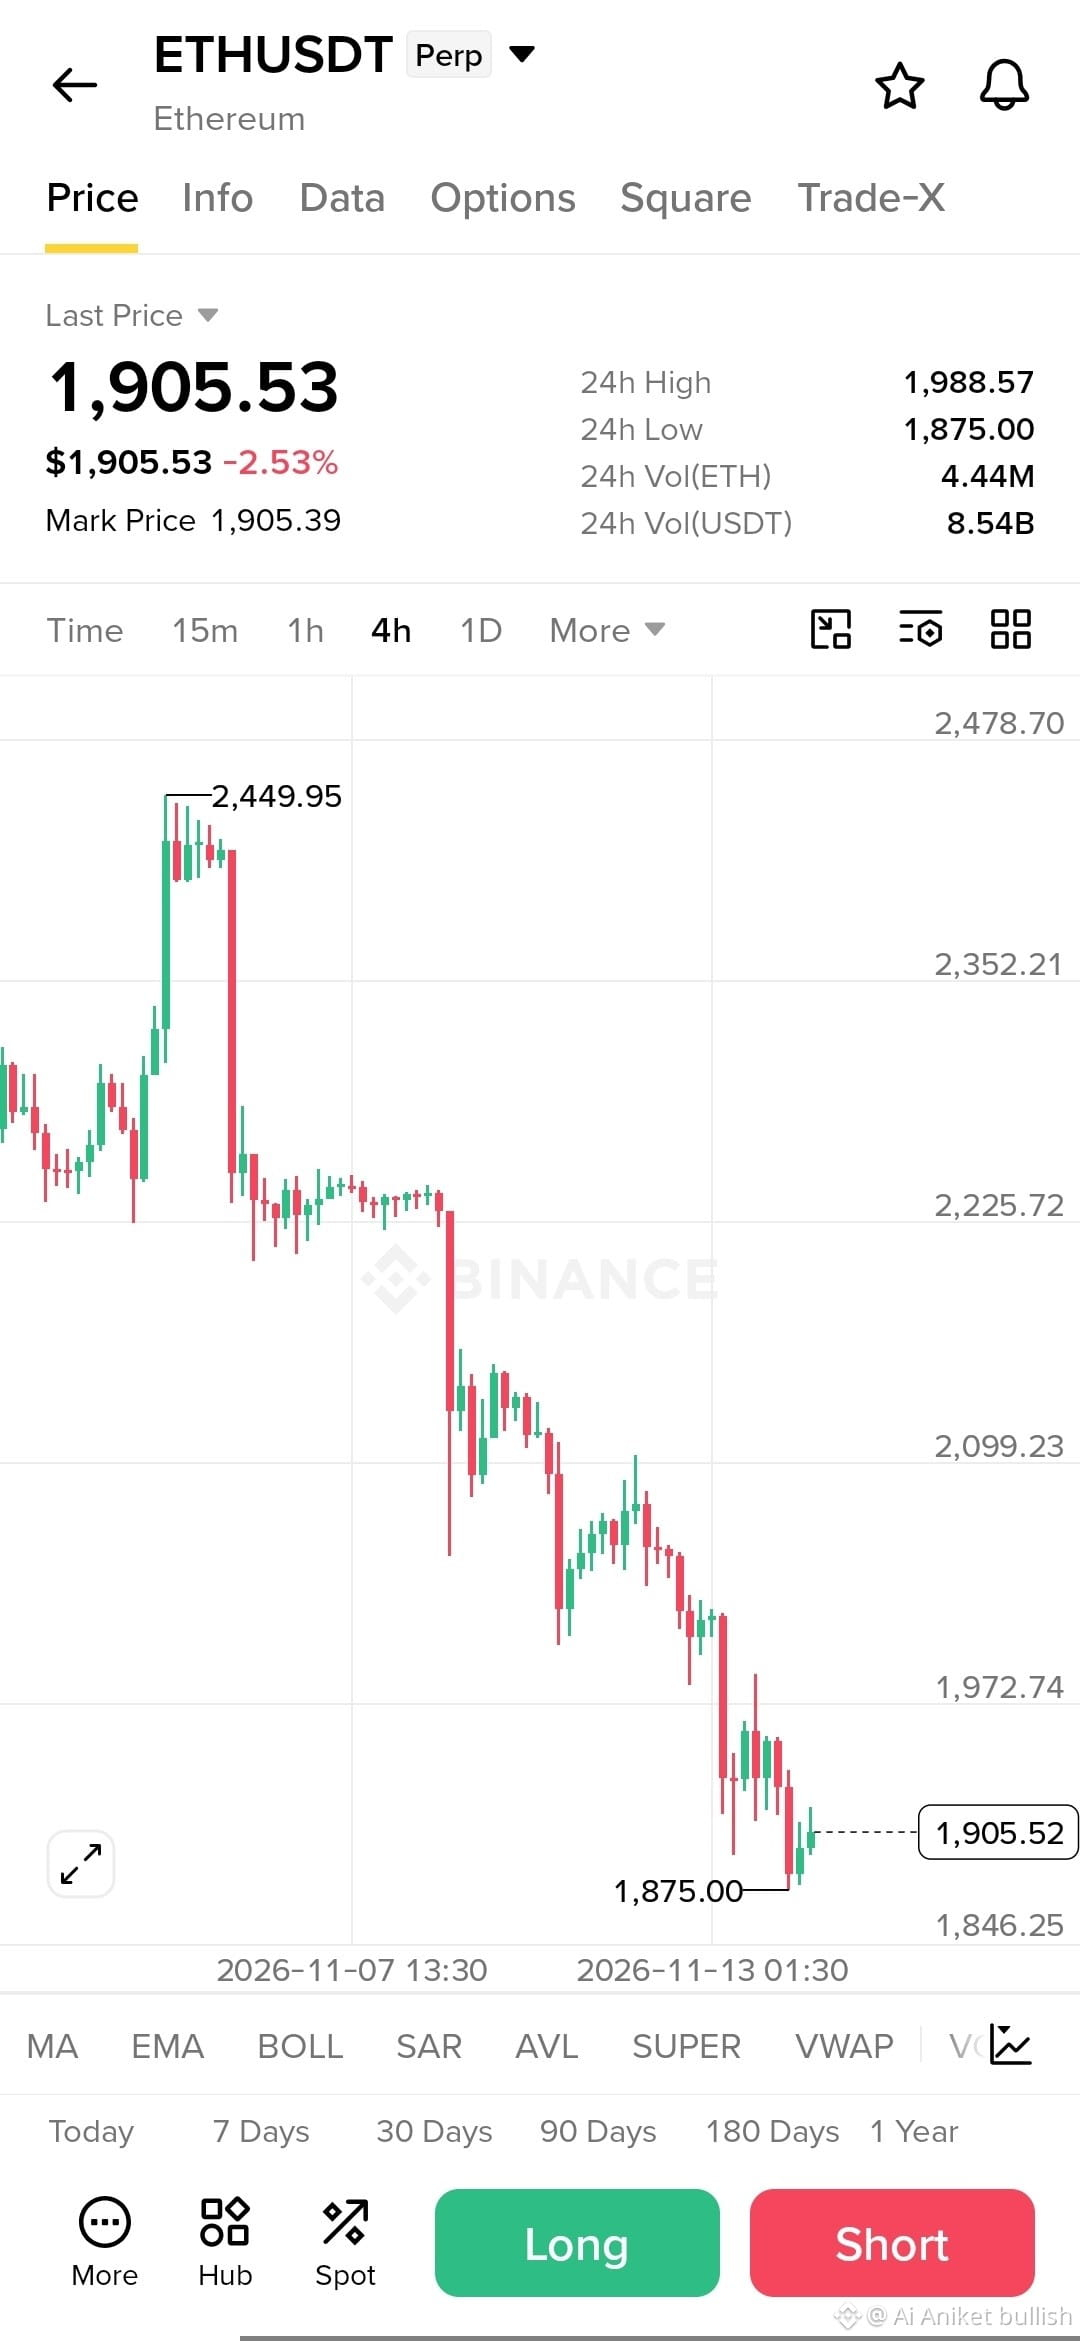
🚀 $ETH LONG: Is Ethereum Preparing for a Relief Bounce After the Sell-Off?
Ethereum is trading near $1,905, after falling sharply from the $2,449 region. The 4H chart still shows a clear bearish structure, but ETH has bounced slightly from the recent low of $1,875.
I'm watching for a potential LONG recovery, not calling a confirmed trend reversal yet.
📊 Key Chart Levels
Immediate support: $1,875
Next support: $1,846
First resistance: $1,972
Major recovery zone: $2,099
Higher resistance: $2,225
A sustained hold above $1,875 followed by a reclaim of $1,972 could strengthen the recovery idea. If ETH loses $1,875, the long thesis weakens and $1,846 becomes important.
📰 What's happening in the market?
Ethereum is facing broader crypto-market pressure:
Bitcoin's decline is also weighing on ETH.
Recent US spot ETH ETF outflows and leveraged long liquidations have added selling pressure.
One large wallet reportedly bought 10,380 ETH on November 13, despite already having substantial unrealized losses. That's an interesting accumulation signal, but one wallet does not confirm a market bottom.
On the development side, the Lighthouse team submitted a fix for a vulnerability ahead of Ethereum's planned Glamsterdam upgrade.
My view: The LONG idea comes from the possibility of a technical relief bounce near support. The news is mixed, and the broader trend remains bearish until ETH reclaims important resistance.
Can $ETH recover above $1,972, or will sellers push it below $1,875?
{spot}(ETHUSDT)
#ETH #Ethereum #CryptoMarket
🚀 $ETH LONG: Is Ethereum Preparing for a Relief Bounce After the Sell-Off?
Ethereum is trading near $1,905, after falling sharply from the $2,449 region. The 4H chart still shows a clear bearish structure, but ETH has bounced slightly from the recent low of $1,875.
I'm watching for a potential LONG recovery, not calling a confirmed trend reversal yet.
📊 Key Chart Levels
Immediate support: $1,875
Next support: $1,846
First resistance: $1,972
Major recovery zone: $2,099
Higher resistance: $2,225
A sustained hold above $1,875 followed by a reclaim of $1,972 could strengthen the recovery idea. If ETH loses $1,875, the long thesis weakens and $1,846 becomes important.
📰 What's happening in the market?
Ethereum is facing broader crypto-market pressure:
Bitcoin's decline is also weighing on ETH.
Recent US spot ETH ETF outflows and leveraged long liquidations have added selling pressure.
One large wallet reportedly bought 10,380 ETH on November 13, despite already having substantial unrealized losses. That's an interesting accumulation signal, but one wallet does not confirm a market bottom.
On the development side, the Lighthouse team submitted a fix for a vulnerability ahead of Ethereum's planned Glamsterdam upgrade.
My view: The LONG idea comes from the possibility of a technical relief bounce near support. The news is mixed, and the broader trend remains bearish until ETH reclaims important resistance.
Can $ETH recover above $1,972, or will sellers push it below $1,875?
#ETH #Ethereum #CryptoMarket
Ethereum is trading near $1,905, after falling sharply from the $2,449 region. The 4H chart still shows a clear bearish structure, but ETH has bounced slightly from the recent low of $1,875.
I'm watching for a potential LONG recovery, not calling a confirmed trend reversal yet.
📊 Key Chart Levels
Immediate support: $1,875
Next support: $1,846
First resistance: $1,972
Major recovery zone: $2,099
Higher resistance: $2,225
A sustained hold above $1,875 followed by a reclaim of $1,972 could strengthen the recovery idea. If ETH loses $1,875, the long thesis weakens and $1,846 becomes important.
📰 What's happening in the market?
Ethereum is facing broader crypto-market pressure:
Bitcoin's decline is also weighing on ETH.
Recent US spot ETH ETF outflows and leveraged long liquidations have added selling pressure.
One large wallet reportedly bought 10,380 ETH on November 13, despite already having substantial unrealized losses. That's an interesting accumulation signal, but one wallet does not confirm a market bottom.
On the development side, the Lighthouse team submitted a fix for a vulnerability ahead of Ethereum's planned Glamsterdam upgrade.
My view: The LONG idea comes from the possibility of a technical relief bounce near support. The news is mixed, and the broader trend remains bearish until ETH reclaims important resistance.
Can $ETH recover above $1,972, or will sellers push it below $1,875?
#ETH #Ethereum #CryptoMarket
1
1
197

·
--
Bullish
$ETH
{future}(ETHUSDT)
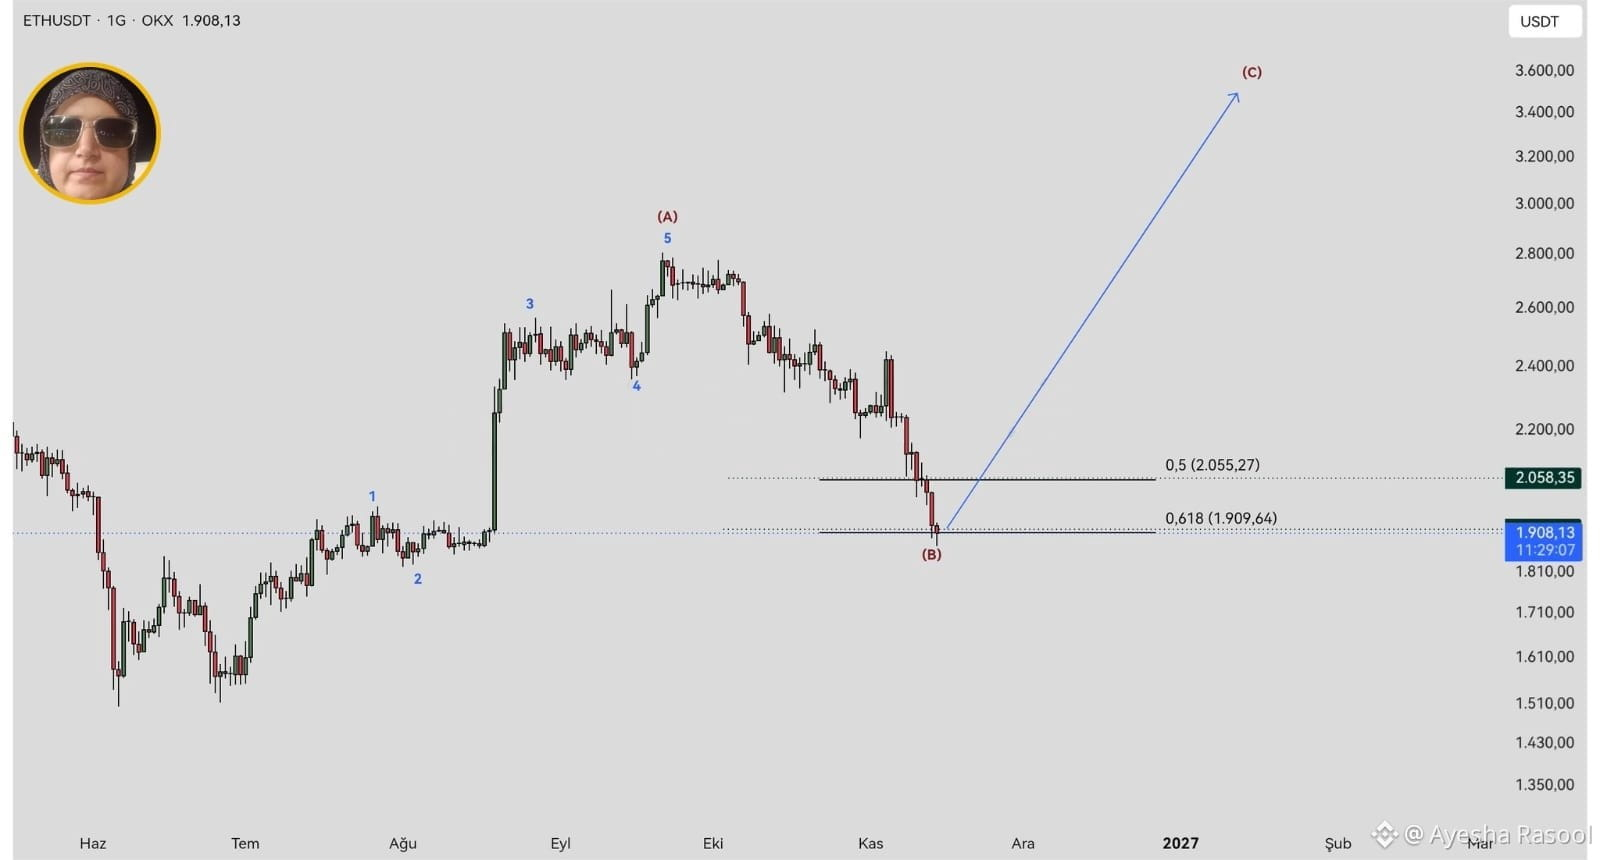
ETH/USDT | Elliott Wave Outlook (1D)
Ethereum's corrective Wave B is now testing the 0.618 Fibonacci retracement at 1,909.64 USDT, a key technical support zone.
A confirmed reaction from this level could mark the start of Wave C, with a medium-term upside target in the 3,400–3,500 USDT range.
Key levels:
Support: 1,909.64 (0.618 Fib)
First resistance: 2,055.27 (0.5 Fib)
Target zone: 3,400–3,500
Price confirmation is essential, so a daily close holding above support would strengthen this scenario. A sustained break below it would invalidate the count.
This is a technical analysis view, not financial advice. Always do your own research and manage your risk.
#ETH #Ethereum #ElliottWave #TechnicalAnalysis #Crypto
$ETH
ETH/USDT | Elliott Wave Outlook (1D)
Ethereum's corrective Wave B is now testing the 0.618 Fibonacci retracement at 1,909.64 USDT, a key technical support zone.
A confirmed reaction from this level could mark the start of Wave C, with a medium-term upside target in the 3,400–3,500 USDT range.
Key levels:
Support: 1,909.64 (0.618 Fib)
First resistance: 2,055.27 (0.5 Fib)
Target zone: 3,400–3,500
Price confirmation is essential, so a daily close holding above support would strengthen this scenario. A sustained break below it would invalidate the count.
This is a technical analysis view, not financial advice. Always do your own research and manage your risk.
#ETH #Ethereum #ElliottWave #TechnicalAnalysis #Crypto
ETH/USDT | Elliott Wave Outlook (1D)
Ethereum's corrective Wave B is now testing the 0.618 Fibonacci retracement at 1,909.64 USDT, a key technical support zone.
A confirmed reaction from this level could mark the start of Wave C, with a medium-term upside target in the 3,400–3,500 USDT range.
Key levels:
Support: 1,909.64 (0.618 Fib)
First resistance: 2,055.27 (0.5 Fib)
Target zone: 3,400–3,500
Price confirmation is essential, so a daily close holding above support would strengthen this scenario. A sustained break below it would invalidate the count.
This is a technical analysis view, not financial advice. Always do your own research and manage your risk.
#ETH #Ethereum #ElliottWave #TechnicalAnalysis #Crypto
46

·
--
Bullish
$ETH Just Proved Why Dip Buyers Win! 🔥
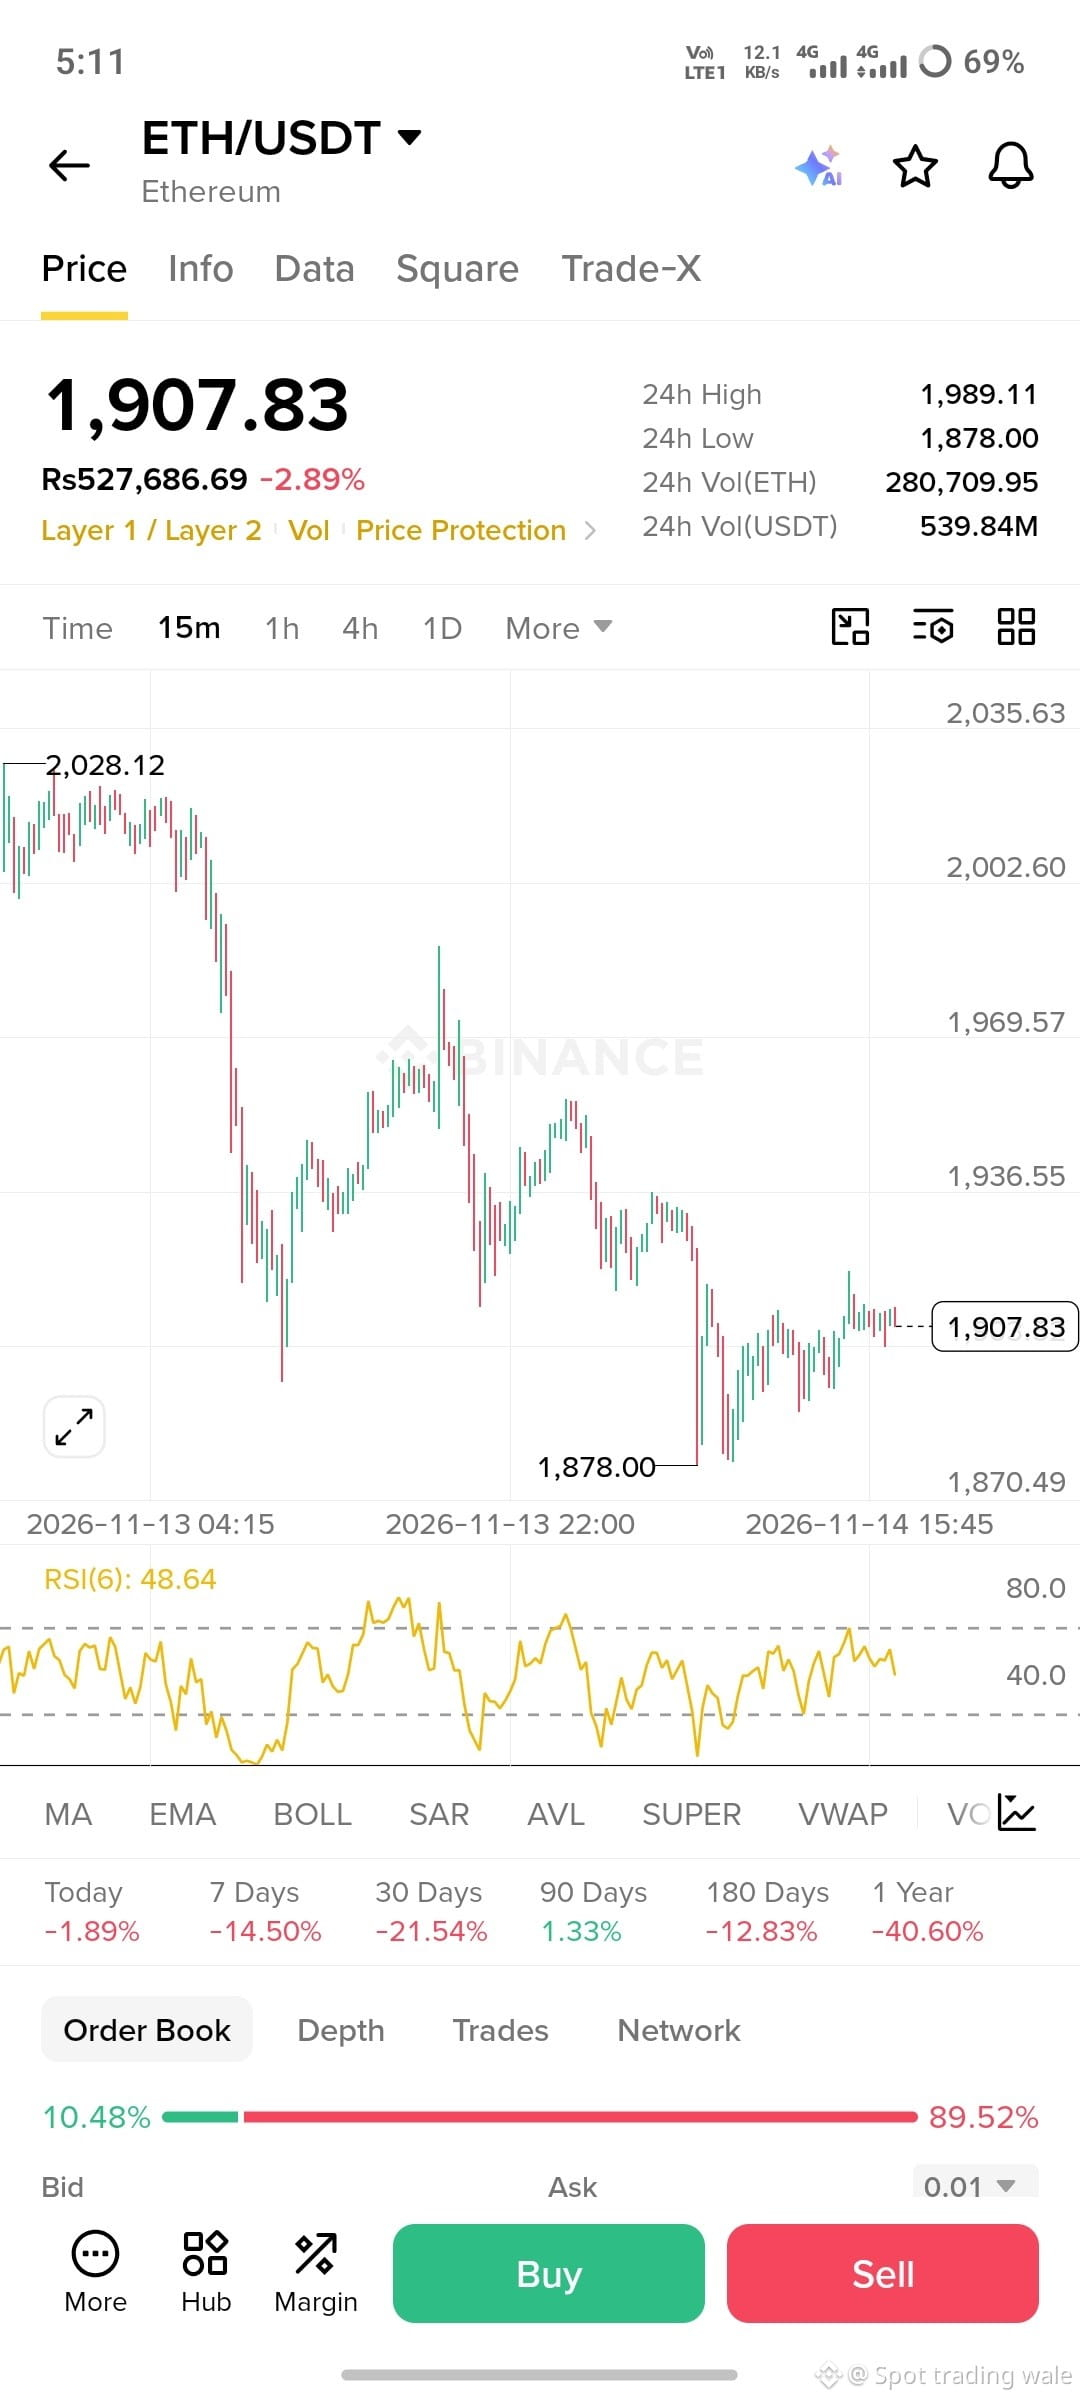
ETH dropped from $2,028 to $1,878, everyone panicked...
But ETH recovered fast to $1,907 and showed its strength again! 📈
Panic sellers lose, patient traders win.
Do you think $ETH will go UP from here?
Comment ETH and I will share my next trade setup with you! 👇
#ETH #Ethereum #CryptoTrading
$ETH
{spot}(ETHUSDT)
$ETH Just Proved Why Dip Buyers Win! 🔥
ETH dropped from $2,028 to $1,878, everyone panicked...
But ETH recovered fast to $1,907 and showed its strength again! 📈
Panic sellers lose, patient traders win.
Do you think $ETH will go UP from here?
Comment ETH and I will share my next trade setup with you! 👇
#ETH #Ethereum #CryptoTrading
$ETH
ETH dropped from $2,028 to $1,878, everyone panicked...
But ETH recovered fast to $1,907 and showed its strength again! 📈
Panic sellers lose, patient traders win.
Do you think $ETH will go UP from here?
Comment ETH and I will share my next trade setup with you! 👇
#ETH #Ethereum #CryptoTrading
$ETH
132

·
--
🚨 Ethereum Foundation continues its ETH dumping spree, offloading another 1,000 ETH on Saturday. The five-day total of 5,000 ETH signals sustained selling pressure, contributing to ETH’s decline toward the $1,900 support zone.
Market Implication: Large-scale accumulation shifts from the Foundation to exchanges could weigh on price action unless buying absorbs the supply.
💭 Is this sustained dumping a temporary shakeout or the start of a longer bearish trend? #Ethereum
$ETH #TradingSignal #CryptoAnalysis
🚨 Ethereum Foundation continues its ETH dumping spree, offloading another 1,000 ETH on Saturday. The five-day total of 5,000 ETH signals sustained selling pressure, contributing to ETH’s decline toward the $1,900 support zone.
Market Implication: Large-scale accumulation shifts from the Foundation to exchanges could weigh on price action unless buying absorbs the supply.
💭 Is this sustained dumping a temporary shakeout or the start of a longer bearish trend? #Ethereum
$ETH #TradingSignal #CryptoAnalysis
Market Implication: Large-scale accumulation shifts from the Foundation to exchanges could weigh on price action unless buying absorbs the supply.
💭 Is this sustained dumping a temporary shakeout or the start of a longer bearish trend? #Ethereum
$ETH #TradingSignal #CryptoAnalysis

123

·
--

Article
$1.23 Billion Wiped Out in 24 Hours: Can Bitcoin Hold the Line at Its 200-Week Average?The crypto market just took a heavy hit. Over the past 24 hours, forced liquidations surged to $1.23 billion—nearly double the previous day’s wipeout—dragging the total crypto market cap down 5.75% to $2.33 trillion.
According to Coinglass data, bullish traders bore the brunt of the sell-off, with long positions accounting for 82.7% ($1.02 billion) of the total flush. In total, 163,631 traders were liquidated (up from 112,947 the day before). While roughly $1 billion of the damage happened in the first 12 hours, liquidation pressure has started to cool down, dropping to $233.07 million over the past 12 hours and $41.01 million in the last four.
(Interestingly, despite longs taking the beating, the largest single liquidation order was actually a $17.81 million $ETH short on Binance, closed at $1,979.21.)
Bitcoin ($BTC) Tests a Critical Weekly Level
Bitcoin accounted for more than half of the market wipeout with $637.24 million in liquidations—and a massive 90.8% of those were long bets.
Currently trading around **\(67,623** (down 3.70\% in 24 hours),\)BTC has slipped just below its 200-week Simple Moving Average (SMA) at $67,922. This is the exact same level that caught Bitcoin’s drop back in July and sparked its August rally. All eyes are now on Sunday’s weekly close.
Key $BTC Levels to Watch:
• Immediate Support ($66,000 – $67,000): A strong historical zone that previously acted as tough resistance between June and August.
• Major Demand Zone ($62,300): Buyers stepped in to defend this level twice earlier this year (late February and pre-August breakout). If this breaks, we could see a sweep toward $58,000.
• Upside Resistance ($75,000): The first major hurdle bulls need to reclaim if $BTC bounces.
Ethereum ($ETH) Loses Key Support
Ethereum saw $256.52 million in liquidations over the last 24 hours, with 76.3% coming from long positions.
Trading down 3.37% at **\(1,903.78**,\)ETH has slipped below a key Fibonacci support level at $1,920.51. If sellers keep control, the next major support zone sits down at $1,832.78.
What’s Next for the Market?
Bullish traders have absorbed the majority of liquidations for two straight days, leaving long positions heavily exposed heading into a crucial stretch of macro and institutional events:
1. Sunday’s Weekly Close: Will $BTC reclaim the $67,922 200-week SMA before the weekly candle closes?
2. November 30 (MSCI Index Drop): MSCI is set to remove Strategy—the largest corporate Bitcoin holder—from its benchmark indexes, which could trigger passive outflows.
3. December 9 (FOMC Meeting): The Federal Reserve’s upcoming interest rate decision will set the tone for risk assets heading into year-end.
What’s your game plan right now? Are you buying this dip at the 200-week moving average, or waiting for Sunday’s close before making a move? Drop your thoughts below! 👇
{spot}(BTCUSDT)
{spot}(ETHUSDT)
#Ethereum #CryptoNews #MarketUpdate #BTC #ETH
$1.23 Billion Wiped Out in 24 Hours: Can Bitcoin Hold the Line at Its 200-Week Average?
The crypto market just took a heavy hit. Over the past 24 hours, forced liquidations surged to $1.23 billion—nearly double the previous day’s wipeout—dragging the total crypto market cap down 5.75% to $2.33 trillion.
According to Coinglass data, bullish traders bore the brunt of the sell-off, with long positions accounting for 82.7% ($1.02 billion) of the total flush. In total, 163,631 traders were liquidated (up from 112,947 the day before). While roughly $1 billion of the damage happened in the first 12 hours, liquidation pressure has started to cool down, dropping to $233.07 million over the past 12 hours and $41.01 million in the last four.
(Interestingly, despite longs taking the beating, the largest single liquidation order was actually a $17.81 million $ETH short on Binance, closed at $1,979.21.)
Bitcoin ($BTC ) Tests a Critical Weekly Level
Bitcoin accounted for more than half of the market wipeout with $637.24 million in liquidations—and a massive 90.8% of those were long bets.
Currently trading around **\(67,623** (down 3.70\% in 24 hours),\)BTC has slipped just below its 200-week Simple Moving Average (SMA) at $67,922. This is the exact same level that caught Bitcoin’s drop back in July and sparked its August rally. All eyes are now on Sunday’s weekly close.
Key $BTC Levels to Watch:
• Immediate Support ($66,000 – $67,000): A strong historical zone that previously acted as tough resistance between June and August.
• Major Demand Zone ($62,300): Buyers stepped in to defend this level twice earlier this year (late February and pre-August breakout). If this breaks, we could see a sweep toward $58,000.
• Upside Resistance ($75,000): The first major hurdle bulls need to reclaim if $BTC bounces.
Ethereum ($ETH ) Loses Key Support
Ethereum saw $256.52 million in liquidations over the last 24 hours, with 76.3% coming from long positions.
Trading down 3.37% at **\(1,903.78**,\)ETH has slipped below a key Fibonacci support level at $1,920.51. If sellers keep control, the next major support zone sits down at $1,832.78.
What’s Next for the Market?
Bullish traders have absorbed the majority of liquidations for two straight days, leaving long positions heavily exposed heading into a crucial stretch of macro and institutional events:
1. Sunday’s Weekly Close: Will $BTC reclaim the $67,922 200-week SMA before the weekly candle closes?
2. November 30 (MSCI Index Drop): MSCI is set to remove Strategy—the largest corporate Bitcoin holder—from its benchmark indexes, which could trigger passive outflows.
3. December 9 (FOMC Meeting): The Federal Reserve’s upcoming interest rate decision will set the tone for risk assets heading into year-end.
What’s your game plan right now? Are you buying this dip at the 200-week moving average, or waiting for Sunday’s close before making a move? Drop your thoughts below! 👇
#Ethereum #CryptoNews #MarketUpdate #BTC #ETH
According to Coinglass data, bullish traders bore the brunt of the sell-off, with long positions accounting for 82.7% ($1.02 billion) of the total flush. In total, 163,631 traders were liquidated (up from 112,947 the day before). While roughly $1 billion of the damage happened in the first 12 hours, liquidation pressure has started to cool down, dropping to $233.07 million over the past 12 hours and $41.01 million in the last four.
(Interestingly, despite longs taking the beating, the largest single liquidation order was actually a $17.81 million $ETH short on Binance, closed at $1,979.21.)
Bitcoin ($BTC ) Tests a Critical Weekly Level
Bitcoin accounted for more than half of the market wipeout with $637.24 million in liquidations—and a massive 90.8% of those were long bets.
Currently trading around **\(67,623** (down 3.70\% in 24 hours),\)BTC has slipped just below its 200-week Simple Moving Average (SMA) at $67,922. This is the exact same level that caught Bitcoin’s drop back in July and sparked its August rally. All eyes are now on Sunday’s weekly close.
Key $BTC Levels to Watch:
• Immediate Support ($66,000 – $67,000): A strong historical zone that previously acted as tough resistance between June and August.
• Major Demand Zone ($62,300): Buyers stepped in to defend this level twice earlier this year (late February and pre-August breakout). If this breaks, we could see a sweep toward $58,000.
• Upside Resistance ($75,000): The first major hurdle bulls need to reclaim if $BTC bounces.
Ethereum ($ETH ) Loses Key Support
Ethereum saw $256.52 million in liquidations over the last 24 hours, with 76.3% coming from long positions.
Trading down 3.37% at **\(1,903.78**,\)ETH has slipped below a key Fibonacci support level at $1,920.51. If sellers keep control, the next major support zone sits down at $1,832.78.
What’s Next for the Market?
Bullish traders have absorbed the majority of liquidations for two straight days, leaving long positions heavily exposed heading into a crucial stretch of macro and institutional events:
1. Sunday’s Weekly Close: Will $BTC reclaim the $67,922 200-week SMA before the weekly candle closes?
2. November 30 (MSCI Index Drop): MSCI is set to remove Strategy—the largest corporate Bitcoin holder—from its benchmark indexes, which could trigger passive outflows.
3. December 9 (FOMC Meeting): The Federal Reserve’s upcoming interest rate decision will set the tone for risk assets heading into year-end.
What’s your game plan right now? Are you buying this dip at the 200-week moving average, or waiting for Sunday’s close before making a move? Drop your thoughts below! 👇
#Ethereum #CryptoNews #MarketUpdate #BTC #ETH
1
219

·
--
Partly True
🚨 ETHEREUM FOUNDATION SELLS ANOTHER 1,000 ETH!
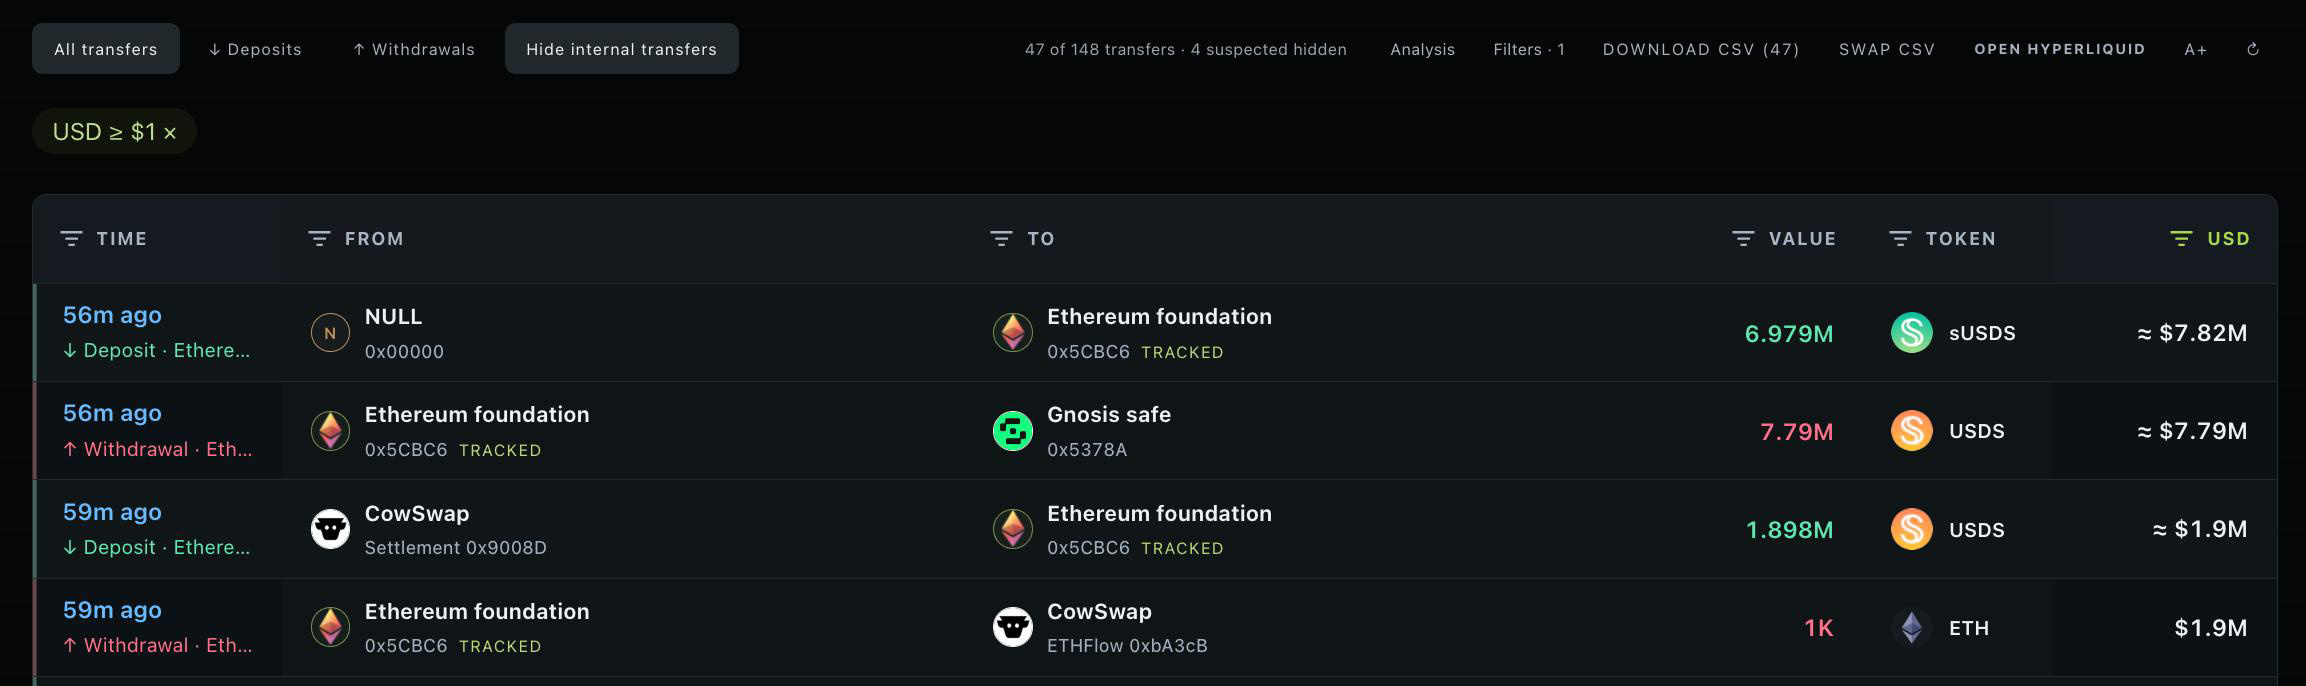
The Ethereum Foundation just swapped 1,000 $ETH (~$1.90M) for USDS through CoWSwap.
Over the past 4 days, the foundation has sold a total of 5,000 ETH for approximately 9.92M USDS.
It also transferred 7.79M USDS to a multisig Safe wallet within the past hour.
Is the foundation preparing for more treasury spending?
Follow me for more latest updates
#Ethereum $ETH
{future}(ETHUSDT)
🚨 ETHEREUM FOUNDATION SELLS ANOTHER 1,000 ETH!
The Ethereum Foundation just swapped 1,000 $ETH (~$1.90M) for USDS through CoWSwap.
Over the past 4 days, the foundation has sold a total of 5,000 ETH for approximately 9.92M USDS.
It also transferred 7.79M USDS to a multisig Safe wallet within the past hour.
Is the foundation preparing for more treasury spending?
Follow me for more latest updates
#Ethereum $ETH
The Ethereum Foundation just swapped 1,000 $ETH (~$1.90M) for USDS through CoWSwap.
Over the past 4 days, the foundation has sold a total of 5,000 ETH for approximately 9.92M USDS.
It also transferred 7.79M USDS to a multisig Safe wallet within the past hour.
Is the foundation preparing for more treasury spending?
Follow me for more latest updates
#Ethereum $ETH
3
1.8k

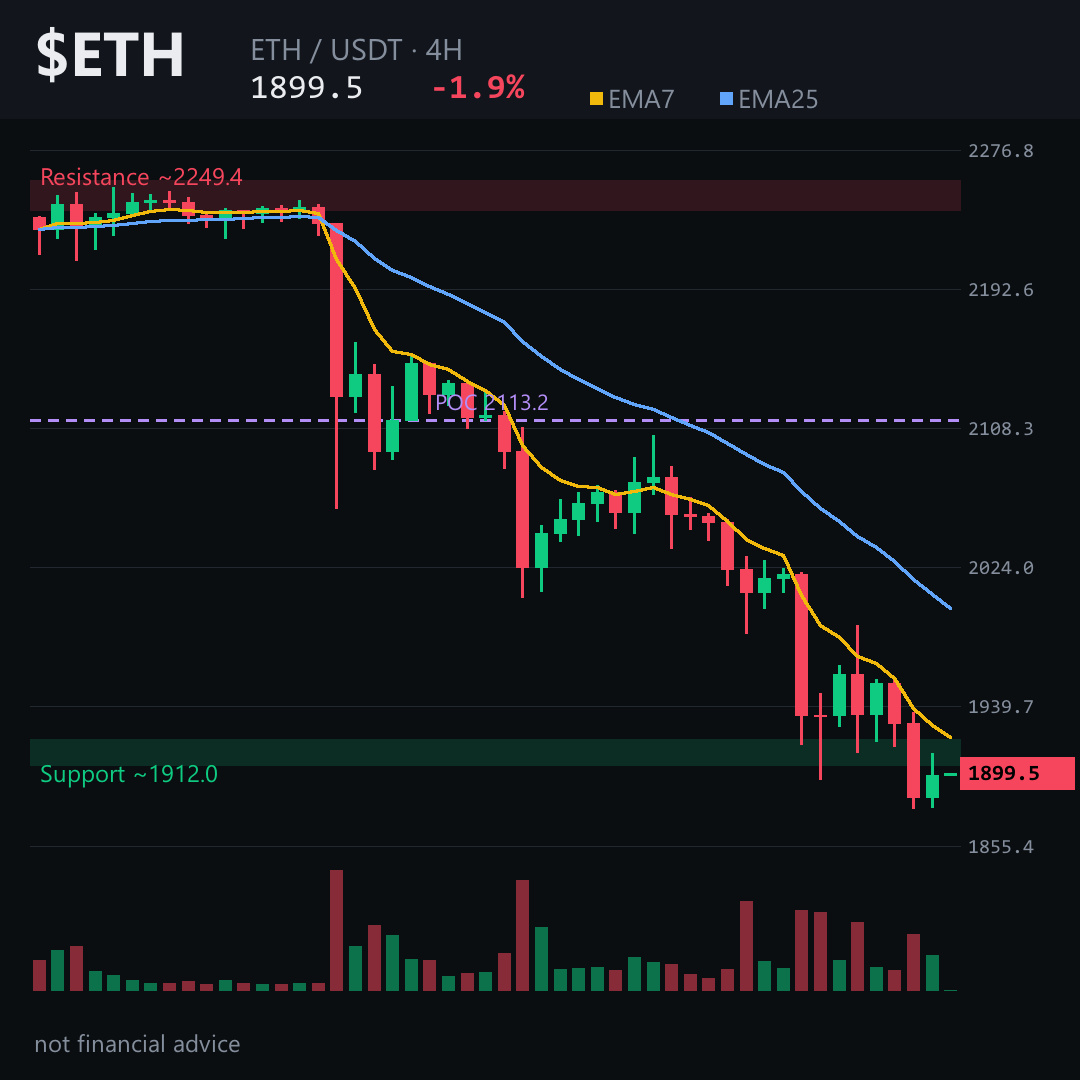
The 4‑hour EMA7 just slipped under EMA25 and $ETH is perched on the 1910‑1915 wall – a fracture point you can’t ignore.
Here’s why it matters 👇
Price is trapped below the 4‑hour EMA7, RSI languishes in the 20s and a tiny positive funding rate means longs are paying to stay – a classic over‑leveraged warning. Add a long‑short ratio of 3.6 : 1 and the market is heavily long‑biased, often a prelude to a downside swing.
If $ETH slides beneath the ~1910‑1915 zone, the next barrier is the 1985‑1990 area; a breach above that would invalidate the bearish case. Should sellers hold, the path opens toward the 1770‑1780 zone, the objective on the 4‑hour chart.
My read: ETH looks set to test the 1910‑1915 support and could drift down toward the low‑1770s if the downside momentum stays intact.
Follow me for the next update on how the 1910‑1915 area behaves and whether the price heads for the 1770‑1780 zone.
What’s your take on the 1910‑1915 level for $ETH? 👇
⚠️ Not financial advice. DYOR.
#ETH #Ethereum #Crypto #BinanceSquare
The 4‑hour EMA7 just slipped under EMA25 and $ETH is perched on the 1910‑1915 wall – a fracture point you can’t ignore.
Here’s why it matters 👇
Price is trapped below the 4‑hour EMA7, RSI languishes in the 20s and a tiny positive funding rate means longs are paying to stay – a classic over‑leveraged warning. Add a long‑short ratio of 3.6 : 1 and the market is heavily long‑biased, often a prelude to a downside swing.
If $ETH slides beneath the ~1910‑1915 zone, the next barrier is the 1985‑1990 area; a breach above that would invalidate the bearish case. Should sellers hold, the path opens toward the 1770‑1780 zone, the objective on the 4‑hour chart.
My read: ETH looks set to test the 1910‑1915 support and could drift down toward the low‑1770s if the downside momentum stays intact.
Follow me for the next update on how the 1910‑1915 area behaves and whether the price heads for the 1770‑1780 zone.
What’s your take on the 1910‑1915 level for $ETH ? 👇
⚠️ Not financial advice. DYOR.
#ETH #Ethereum #Crypto #BinanceSquare
Here’s why it matters 👇
Price is trapped below the 4‑hour EMA7, RSI languishes in the 20s and a tiny positive funding rate means longs are paying to stay – a classic over‑leveraged warning. Add a long‑short ratio of 3.6 : 1 and the market is heavily long‑biased, often a prelude to a downside swing.
If $ETH slides beneath the ~1910‑1915 zone, the next barrier is the 1985‑1990 area; a breach above that would invalidate the bearish case. Should sellers hold, the path opens toward the 1770‑1780 zone, the objective on the 4‑hour chart.
My read: ETH looks set to test the 1910‑1915 support and could drift down toward the low‑1770s if the downside momentum stays intact.
Follow me for the next update on how the 1910‑1915 area behaves and whether the price heads for the 1770‑1780 zone.
What’s your take on the 1910‑1915 level for $ETH ? 👇
⚠️ Not financial advice. DYOR.
#ETH #Ethereum #Crypto #BinanceSquare
76
·
--
🚨 ETH broke below $2K and is testing the $1.9K–$1.98K demand zone. The daily chart shows a persistent bearish structure with liquidation clusters nearby, suggesting further downside risk before any relief bounce. Smart money awaits a clear structural shift.
Will ETH find support or break lower? 📉
#Ethereum
$ETH #TradingSignal #CryptoAnalysis
🚨 ETH broke below $2K and is testing the $1.9K–$1.98K demand zone. The daily chart shows a persistent bearish structure with liquidation clusters nearby, suggesting further downside risk before any relief bounce. Smart money awaits a clear structural shift.
Will ETH find support or break lower? 📉
#Ethereum
$ETH #TradingSignal #CryptoAnalysis
Will ETH find support or break lower? 📉
#Ethereum
$ETH #TradingSignal #CryptoAnalysis

31

$ETH — WHY IS ETH BLEEDING SO HARD? 🤯
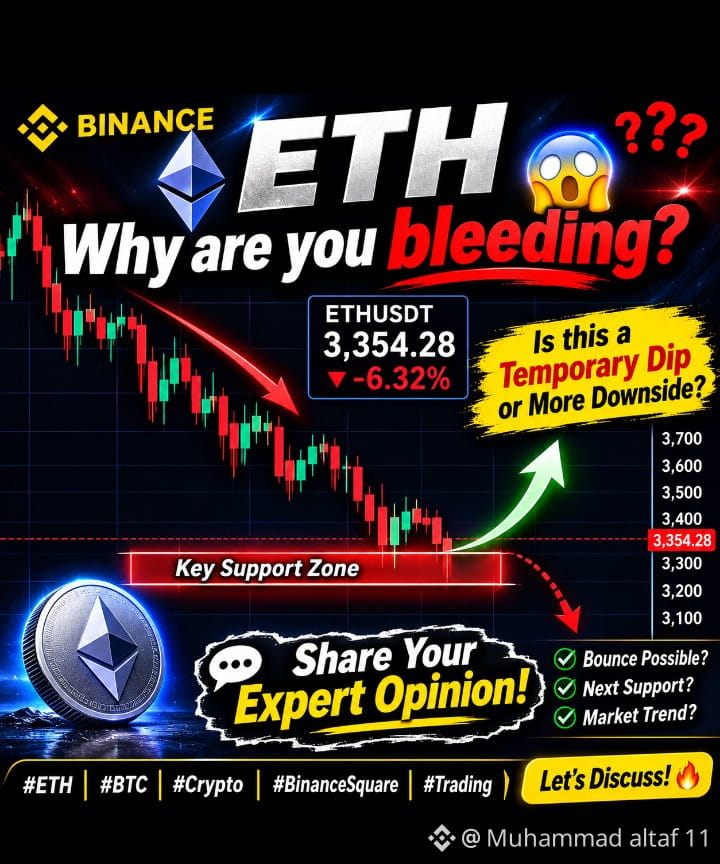
What's happening with Ethereum right now? 😳
$ETH is facing serious selling pressure, and the market is getting nervous.
Is this just a temporary correction, or are we about to see another major move?
I would love to hear from experienced traders. 👇
📊 What's your prediction for ETH?
- Bullish reversal 📈
- More downside 📉
$ETH #Ethereum #BinanceSquareTalks #WhoWillSucceedJensenHuangatNvidia? #USPPIMissMayEaseBTCPressure #TradFiForBeginners
{spot}(ETHUSDT)
$ETH — WHY IS ETH BLEEDING SO HARD? 🤯
What's happening with Ethereum right now? 😳
$ETH is facing serious selling pressure, and the market is getting nervous.
Is this just a temporary correction, or are we about to see another major move?
I would love to hear from experienced traders. 👇
📊 What's your prediction for ETH?
- Bullish reversal 📈
- More downside 📉
$ETH #Ethereum #BinanceSquareTalks #WhoWillSucceedJensenHuangatNvidia? #USPPIMissMayEaseBTCPressure #TradFiForBeginners
What's happening with Ethereum right now? 😳
$ETH is facing serious selling pressure, and the market is getting nervous.
Is this just a temporary correction, or are we about to see another major move?
I would love to hear from experienced traders. 👇
📊 What's your prediction for ETH?
- Bullish reversal 📈
- More downside 📉
$ETH #Ethereum #BinanceSquareTalks #WhoWillSucceedJensenHuangatNvidia? #USPPIMissMayEaseBTCPressure #TradFiForBeginners
70

·
--
$ETH Dips Below $1,900 as Selling Continues
$ETH is trading around $1,890–$1,910 today, down another 2–5% over the last 24 hours. It slipped under the $1,900 level amid ongoing market pressure, ETF outflows, and some large wallet sales, including activity linked to the Ethereum Foundation.
The broader crypto space remains risk-off, with Bitcoin also lower. Volume is still active as the market digests the move.
ETH testing these levels feels heavy after the recent drop, but the network keeps running strong. Some whales are selling while others are quietly buying the dip — classic mixed signals. I’m watching the $1,850–$1,900 zone closely and staying patient. Fear is high, which often creates better long-term spots.
Not financial advice. Always DYOR.
$ETH
How are you playing this? Holding or waiting for more clarity?
#ETH #Ethereum #CryptoMarket #BinanceSquare
{spot}(ETHUSDT)
$ETH Dips Below $1,900 as Selling Continues
$ETH is trading around $1,890–$1,910 today, down another 2–5% over the last 24 hours. It slipped under the $1,900 level amid ongoing market pressure, ETF outflows, and some large wallet sales, including activity linked to the Ethereum Foundation.
The broader crypto space remains risk-off, with Bitcoin also lower. Volume is still active as the market digests the move.
ETH testing these levels feels heavy after the recent drop, but the network keeps running strong. Some whales are selling while others are quietly buying the dip — classic mixed signals. I’m watching the $1,850–$1,900 zone closely and staying patient. Fear is high, which often creates better long-term spots.
Not financial advice. Always DYOR.
$ETH
How are you playing this? Holding or waiting for more clarity?
#ETH #Ethereum #CryptoMarket #BinanceSquare
$ETH is trading around $1,890–$1,910 today, down another 2–5% over the last 24 hours. It slipped under the $1,900 level amid ongoing market pressure, ETF outflows, and some large wallet sales, including activity linked to the Ethereum Foundation.
The broader crypto space remains risk-off, with Bitcoin also lower. Volume is still active as the market digests the move.
ETH testing these levels feels heavy after the recent drop, but the network keeps running strong. Some whales are selling while others are quietly buying the dip — classic mixed signals. I’m watching the $1,850–$1,900 zone closely and staying patient. Fear is high, which often creates better long-term spots.
Not financial advice. Always DYOR.
$ETH
How are you playing this? Holding or waiting for more clarity?
#ETH #Ethereum #CryptoMarket #BinanceSquare

52

·
--
Bearish
$ETH is back to the same level where the August pump started.
Now, ETH is at its last major support zone around $1,850-$1,950, and losing this could drop Ethereum to cycle lows.
#Ethereum
$ETH is back to the same level where the August pump started.
Now, ETH is at its last major support zone around $1,850-$1,950, and losing this could drop Ethereum to cycle lows.
#Ethereum
Now, ETH is at its last major support zone around $1,850-$1,950, and losing this could drop Ethereum to cycle lows.
#Ethereum
Shaokahn Miguel:
Tudo depende do BTC , eu arrisco Eth em 1450 a 1500.
1
1
1.1k

·
--
Bearish
📉 Ethereum (ETH) Is Down — But Is This the End?
$ETH
The crypto market is facing another challenging moment, and Ethereum (ETH) has seen a significant drop.
$ETH
But remember, market corrections are part of every financial market. A price drop doesn't necessarily mean the end of a project.
💡 Stay informed, do your own research, and avoid emotional decisions.
The big question is: Is this a temporary dip or the beginning of a bigger opportunity?
What do you think about ETH's next move? 👇
$ETH
#Ethereum #ETH #CryptoMarket #BinanceSquare #CryptoUpdate
📉 Ethereum (ETH) Is Down — But Is This the End?
$ETH
The crypto market is facing another challenging moment, and Ethereum (ETH) has seen a significant drop.
$ETH
But remember, market corrections are part of every financial market. A price drop doesn't necessarily mean the end of a project.
💡 Stay informed, do your own research, and avoid emotional decisions.
The big question is: Is this a temporary dip or the beginning of a bigger opportunity?
What do you think about ETH's next move? 👇
$ETH
#Ethereum #ETH #CryptoMarket #BinanceSquare #CryptoUpdate
$ETH
The crypto market is facing another challenging moment, and Ethereum (ETH) has seen a significant drop.
$ETH
But remember, market corrections are part of every financial market. A price drop doesn't necessarily mean the end of a project.
💡 Stay informed, do your own research, and avoid emotional decisions.
The big question is: Is this a temporary dip or the beginning of a bigger opportunity?
What do you think about ETH's next move? 👇
$ETH
#Ethereum #ETH #CryptoMarket #BinanceSquare #CryptoUpdate

149

ETH, BNB and XRP Market Pulse: Oversold Conditions Meet a Cautious Market
The latest Binance spot data shows Ethereum trading near $1,908.87, BNB near $617.53, and XRP near $0.9908. All three assets are under visible short term pressure, but the deeper story is not simply that prices are falling. The market is testing conviction, liquidity, and the ability of each ecosystem to attract demand when sentiment is fragile.
Ethereum is down 2.46% over the latest 24 hour spot session, moving below its 7 day, 25 day, and 99 day moving averages. ETH has also declined 14.73% over seven days and 21.17% over 30 days. The daily RSI reading is 13.27, which signals an oversold condition. That does not guarantee an immediate recovery, but it does show how aggressive the recent selling has been. ETH remains the central settlement layer for a large part of decentralized finance, stablecoin activity, tokenization, and onchain development. For traders, the key question is whether fresh demand can return as selling pressure cools. The MACD remains bearish and the SuperTrend is still pointing down, so the market needs stronger confirmation before any shift in momentum can be treated as durable.
BNB is trading around $617.53 and is down 3.54% during the latest 24 hour spot session. Its seven day decline stands at 10.98%, while the 30 day move is down 15.47%. BNB’s daily RSI is 12.53, placing it in oversold territory as well. The asset is currently below its major moving averages, while the MACD and SuperTrend continue to reflect bearish momentum. Even so, BNB’s relevance is tied to activity across the BNB Chain ecosystem and Binance product utility. This creates a different type of market profile compared with ETH. Its performance can be influenced by broader crypto sentiment, ecosystem participation, onchain demand, and platform related utility. The short term structure remains weak, but oversold conditions mean volatility can increase quickly if demand returns.
XRP is trading near $0.9908, down 2.74% over the latest 24 hour spot session. It has fallen 15.97% over seven days and 25.59% over 30 days, making it the weakest performer of the three across those measured periods. XRP’s daily RSI sits at 7.93, an extremely oversold reading that reflects a sharp imbalance between sellers and buyers. Yet oversold does not automatically mean a trend reversal. XRP remains below its 7 day, 25 day, and 99 day moving averages, with a bearish MACD structure and a downward SuperTrend. Its market identity remains closely connected to payments focused blockchain infrastructure and liquidity driven use cases. The next phase will depend on whether trading participation strengthens and whether sellers begin to lose control near current levels.
Across ETH, BNB, and XRP, the common theme is clear: the market is under pressure, capital flow is negative, and technical momentum remains bearish. ETH recorded daily capital outflow of 7.55%, BNB showed 5.15% outflow, and XRP showed 10.27% outflow. These figures suggest that caution remains active across major altcoins.
However, the current setup is also a reminder that markets often become most emotionally challenging when indicators are deeply oversold. A strong recovery would require improving volume, reduced selling pressure, and a return above important trend measures. Without those confirmations, volatility and downside risk can remain elevated.
Smart market participants focus on risk control, liquidity, volume behavior, and confirmation rather than emotion. In crypto, patience can be just as important as momentum.
#Ethereum #BNB #XRP #CryptoMarket #Altcoins
$ETH
{spot}(ETHUSDT)
$BNB
{spot}(BNBUSDT)
$XRP
{spot}(XRPUSDT)
ETH, BNB and XRP Market Pulse: Oversold Conditions Meet a Cautious Market
The latest Binance spot data shows Ethereum trading near $1,908.87, BNB near $617.53, and XRP near $0.9908. All three assets are under visible short term pressure, but the deeper story is not simply that prices are falling. The market is testing conviction, liquidity, and the ability of each ecosystem to attract demand when sentiment is fragile.
Ethereum is down 2.46% over the latest 24 hour spot session, moving below its 7 day, 25 day, and 99 day moving averages. ETH has also declined 14.73% over seven days and 21.17% over 30 days. The daily RSI reading is 13.27, which signals an oversold condition. That does not guarantee an immediate recovery, but it does show how aggressive the recent selling has been. ETH remains the central settlement layer for a large part of decentralized finance, stablecoin activity, tokenization, and onchain development. For traders, the key question is whether fresh demand can return as selling pressure cools. The MACD remains bearish and the SuperTrend is still pointing down, so the market needs stronger confirmation before any shift in momentum can be treated as durable.
BNB is trading around $617.53 and is down 3.54% during the latest 24 hour spot session. Its seven day decline stands at 10.98%, while the 30 day move is down 15.47%. BNB’s daily RSI is 12.53, placing it in oversold territory as well. The asset is currently below its major moving averages, while the MACD and SuperTrend continue to reflect bearish momentum. Even so, BNB’s relevance is tied to activity across the BNB Chain ecosystem and Binance product utility. This creates a different type of market profile compared with ETH. Its performance can be influenced by broader crypto sentiment, ecosystem participation, onchain demand, and platform related utility. The short term structure remains weak, but oversold conditions mean volatility can increase quickly if demand returns.
XRP is trading near $0.9908, down 2.74% over the latest 24 hour spot session. It has fallen 15.97% over seven days and 25.59% over 30 days, making it the weakest performer of the three across those measured periods. XRP’s daily RSI sits at 7.93, an extremely oversold reading that reflects a sharp imbalance between sellers and buyers. Yet oversold does not automatically mean a trend reversal. XRP remains below its 7 day, 25 day, and 99 day moving averages, with a bearish MACD structure and a downward SuperTrend. Its market identity remains closely connected to payments focused blockchain infrastructure and liquidity driven use cases. The next phase will depend on whether trading participation strengthens and whether sellers begin to lose control near current levels.
Across ETH, BNB, and XRP, the common theme is clear: the market is under pressure, capital flow is negative, and technical momentum remains bearish. ETH recorded daily capital outflow of 7.55%, BNB showed 5.15% outflow, and XRP showed 10.27% outflow. These figures suggest that caution remains active across major altcoins.
However, the current setup is also a reminder that markets often become most emotionally challenging when indicators are deeply oversold. A strong recovery would require improving volume, reduced selling pressure, and a return above important trend measures. Without those confirmations, volatility and downside risk can remain elevated.
Smart market participants focus on risk control, liquidity, volume behavior, and confirmation rather than emotion. In crypto, patience can be just as important as momentum.
#Ethereum #BNB #XRP #CryptoMarket #Altcoins
$ETH
$BNB
$XRP
Ethereum is down 2.46% over the latest 24 hour spot session, moving below its 7 day, 25 day, and 99 day moving averages. ETH has also declined 14.73% over seven days and 21.17% over 30 days. The daily RSI reading is 13.27, which signals an oversold condition. That does not guarantee an immediate recovery, but it does show how aggressive the recent selling has been. ETH remains the central settlement layer for a large part of decentralized finance, stablecoin activity, tokenization, and onchain development. For traders, the key question is whether fresh demand can return as selling pressure cools. The MACD remains bearish and the SuperTrend is still pointing down, so the market needs stronger confirmation before any shift in momentum can be treated as durable.
BNB is trading around $617.53 and is down 3.54% during the latest 24 hour spot session. Its seven day decline stands at 10.98%, while the 30 day move is down 15.47%. BNB’s daily RSI is 12.53, placing it in oversold territory as well. The asset is currently below its major moving averages, while the MACD and SuperTrend continue to reflect bearish momentum. Even so, BNB’s relevance is tied to activity across the BNB Chain ecosystem and Binance product utility. This creates a different type of market profile compared with ETH. Its performance can be influenced by broader crypto sentiment, ecosystem participation, onchain demand, and platform related utility. The short term structure remains weak, but oversold conditions mean volatility can increase quickly if demand returns.
XRP is trading near $0.9908, down 2.74% over the latest 24 hour spot session. It has fallen 15.97% over seven days and 25.59% over 30 days, making it the weakest performer of the three across those measured periods. XRP’s daily RSI sits at 7.93, an extremely oversold reading that reflects a sharp imbalance between sellers and buyers. Yet oversold does not automatically mean a trend reversal. XRP remains below its 7 day, 25 day, and 99 day moving averages, with a bearish MACD structure and a downward SuperTrend. Its market identity remains closely connected to payments focused blockchain infrastructure and liquidity driven use cases. The next phase will depend on whether trading participation strengthens and whether sellers begin to lose control near current levels.
Across ETH, BNB, and XRP, the common theme is clear: the market is under pressure, capital flow is negative, and technical momentum remains bearish. ETH recorded daily capital outflow of 7.55%, BNB showed 5.15% outflow, and XRP showed 10.27% outflow. These figures suggest that caution remains active across major altcoins.
However, the current setup is also a reminder that markets often become most emotionally challenging when indicators are deeply oversold. A strong recovery would require improving volume, reduced selling pressure, and a return above important trend measures. Without those confirmations, volatility and downside risk can remain elevated.
Smart market participants focus on risk control, liquidity, volume behavior, and confirmation rather than emotion. In crypto, patience can be just as important as momentum.
#Ethereum #BNB #XRP #CryptoMarket #Altcoins
$ETH
$BNB
$XRP
1
22

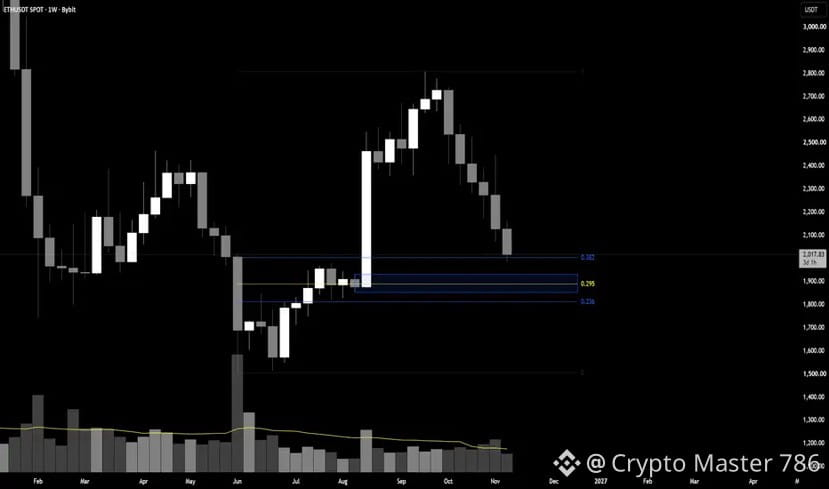
$ETH – The First Pullback Trap! Is This Inducement?
#Ethereum is approaching the $2,000 level after a sharp weekly decline.
In trading, inducement occurs when price attracts traders into premature entries before potentially sweeping liquidity and making its next major move.
The $1,800–$1,950 zone could become a key area to watch. A reaction here may offer recovery clues, but further downside remains possible.
What do you think, Fam? Is $ETH setting a trap before a bullish reversal or preparing for another drop?
$ETH – The First Pullback Trap! Is This Inducement?
#Ethereum is approaching the $2,000 level after a sharp weekly decline.
In trading, inducement occurs when price attracts traders into premature entries before potentially sweeping liquidity and making its next major move.
The $1,800–$1,950 zone could become a key area to watch. A reaction here may offer recovery clues, but further downside remains possible.
What do you think, Fam? Is $ETH setting a trap before a bullish reversal or preparing for another drop?
#Ethereum is approaching the $2,000 level after a sharp weekly decline.
In trading, inducement occurs when price attracts traders into premature entries before potentially sweeping liquidity and making its next major move.
The $1,800–$1,950 zone could become a key area to watch. A reaction here may offer recovery clues, but further downside remains possible.
What do you think, Fam? Is $ETH setting a trap before a bullish reversal or preparing for another drop?
Square-Creator-43048fe31b395a7dea7e:
I have been following you for almost 6 months and your calls are all safe, which are majorly for huge players . if are really a pro, you should be giving calls on stable coins on its definite support , but majorly it's all on its next support /resistance . i suggest you to provide trade insights for spot investors . not to insult you, but think nd share some insights that might not impact traders investments
1
4
1.2k
Log in to explore more content
Join global crypto users on Binance Square
⚡️ Get latest and useful information about crypto.
💬 Trusted by the world’s largest crypto exchange.
👍 Discover real insights from verified creators.
Email / Phone number
Trending Topics
1
#WhoWillSucceedJensenHuangatNvidia?
81,433 views
1,115 Discussing
2
#WhatWillDriveCryptoandStocks’NextRebound?
431,655 views
3,015 Discussing
3
#BitcoinActiveSupplyInProfitDropsBelow45%
21,738 views
336 Discussing
4
#KavaSaysAbnormalActivityLimitedToKavaLend
8,507 views
170 Discussing
5
#USSpotXRPETFsSeeLargestWeeklyOutflowIn8Months
7,720 views
161 Discussing
6
#USPPIMissMayEaseBTCPressure
206,752 views
2,041 Discussing
7
#WORPTLetsTouristsConvertCryptoToThaiBaht
2,550 views
49 Discussing
8
#TONStrategyReports$23.97MQ3NetLoss
3,193 views
41 Discussing
9
#PolkadotCommunityApprovesNewStrategyWith97%Vote
18,626 views
244 Discussing
10
#dYdXPlansV9.9UpgradeToShiftUSDCToInjective
11,380 views
197 Discussing