
#cryptoanalysis
cryptoanalysis
28.9M views
128,702 Discussing
Hot
Latest

·
--
Bearish
📊 In-Depth Bitcoin Analysis $BTC USDT | Key Indicators and Levels to Watch
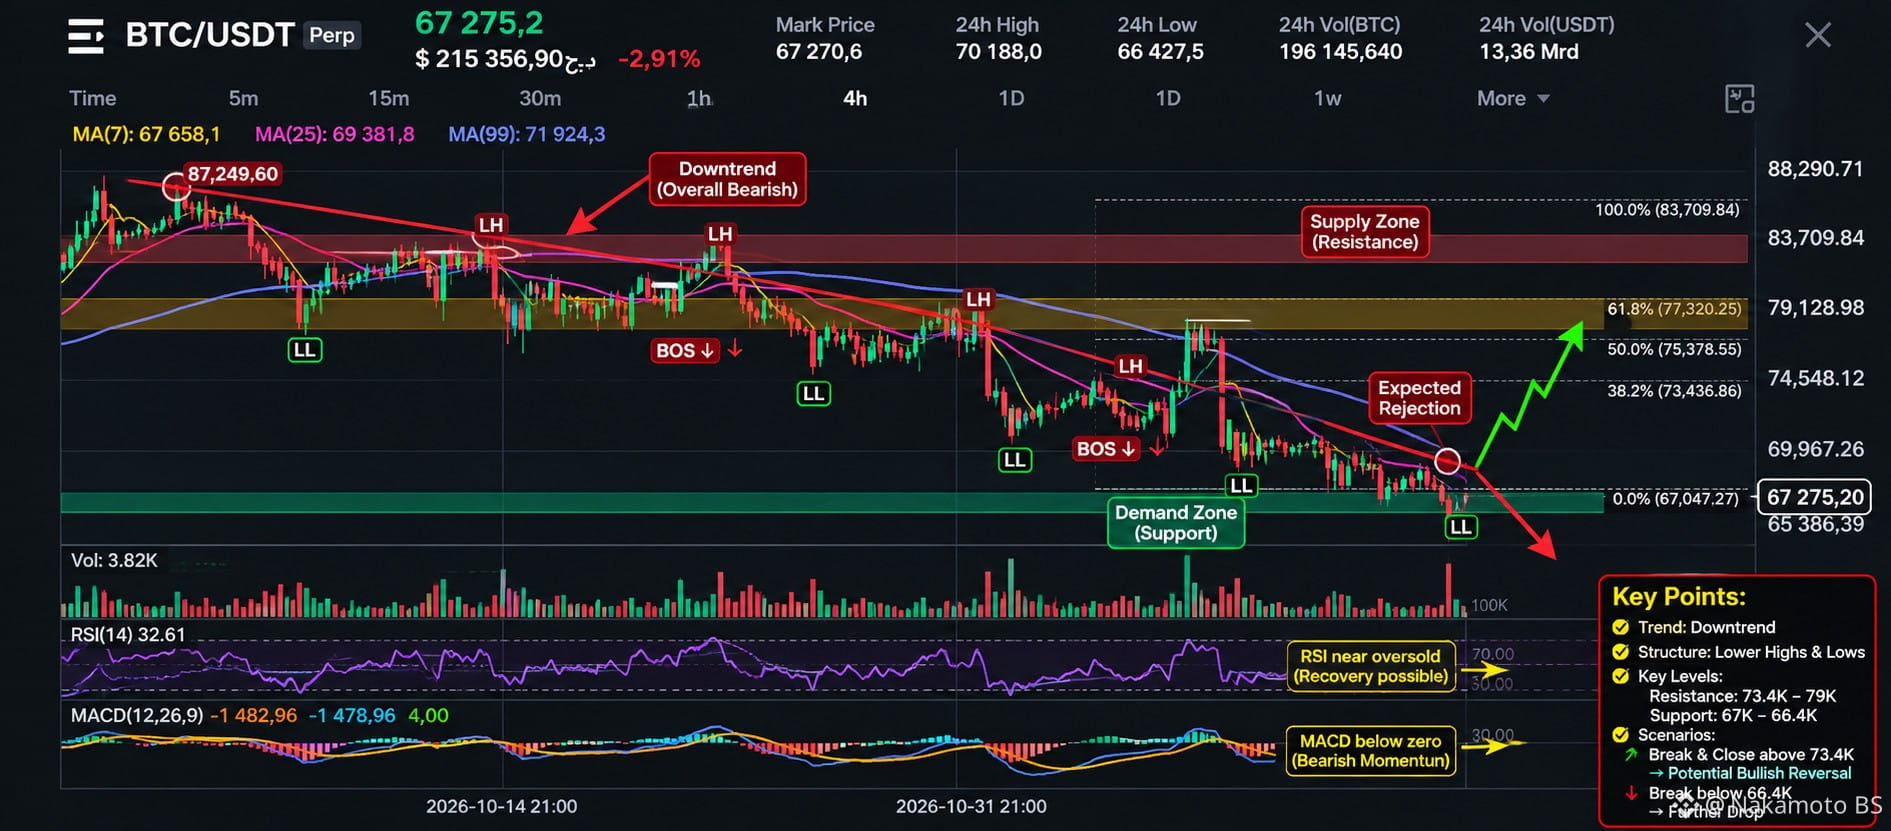
I conducted an in-depth analysis of Bitcoin's price action on the 4-hour timeframe, focusing on market structure, overall trend, liquidity zones, support and resistance levels, as well as momentum indicators. Here are the key findings:
📉 Overall Trend:$BTC
The trend remains bearish, with lower highs and lower lows continuing to form, indicating that sellers are still in control.
🎯 Key Levels:$BTC
- Current support: $66,400 – $67,000.
- Next support: $65,386.
- First resistance: $69,967.
- Major resistance: $74,548.
- Strong supply zone: $79,128.
🔍 What Do I See?
- RSI at 32.61, approaching oversold territory.
- MACD below zero, reflecting continued bearish momentum.
- Moving averages indicate that the overall trend remains weak.
👀 What Am I Watching Now?
🟢 A breakout above $73,400 and holding above this level could open the door to a gradual recovery.
🔴 A break below $66,400 could push the price into another downward move.
Conclusion: I don't think rushing into a trade is the best decision right now. I prefer to wait for trend confirmation before making any move. Protecting capital is more important than chasing every market movement.
#BTC #Bitcoin #CryptoAnalysis
{future}(BTCUSDT)
📊 In-Depth Bitcoin Analysis $BTC USDT | Key Indicators and Levels to Watch
I conducted an in-depth analysis of Bitcoin's price action on the 4-hour timeframe, focusing on market structure, overall trend, liquidity zones, support and resistance levels, as well as momentum indicators. Here are the key findings:
📉 Overall Trend:$BTC
The trend remains bearish, with lower highs and lower lows continuing to form, indicating that sellers are still in control.
🎯 Key Levels:$BTC
- Current support: $66,400 – $67,000.
- Next support: $65,386.
- First resistance: $69,967.
- Major resistance: $74,548.
- Strong supply zone: $79,128.
🔍 What Do I See?
- RSI at 32.61, approaching oversold territory.
- MACD below zero, reflecting continued bearish momentum.
- Moving averages indicate that the overall trend remains weak.
👀 What Am I Watching Now?
🟢 A breakout above $73,400 and holding above this level could open the door to a gradual recovery.
🔴 A break below $66,400 could push the price into another downward move.
Conclusion: I don't think rushing into a trade is the best decision right now. I prefer to wait for trend confirmation before making any move. Protecting capital is more important than chasing every market movement.
#BTC #Bitcoin #CryptoAnalysis
I conducted an in-depth analysis of Bitcoin's price action on the 4-hour timeframe, focusing on market structure, overall trend, liquidity zones, support and resistance levels, as well as momentum indicators. Here are the key findings:
📉 Overall Trend:$BTC
The trend remains bearish, with lower highs and lower lows continuing to form, indicating that sellers are still in control.
🎯 Key Levels:$BTC
- Current support: $66,400 – $67,000.
- Next support: $65,386.
- First resistance: $69,967.
- Major resistance: $74,548.
- Strong supply zone: $79,128.
🔍 What Do I See?
- RSI at 32.61, approaching oversold territory.
- MACD below zero, reflecting continued bearish momentum.
- Moving averages indicate that the overall trend remains weak.
👀 What Am I Watching Now?
🟢 A breakout above $73,400 and holding above this level could open the door to a gradual recovery.
🔴 A break below $66,400 could push the price into another downward move.
Conclusion: I don't think rushing into a trade is the best decision right now. I prefer to wait for trend confirmation before making any move. Protecting capital is more important than chasing every market movement.
#BTC #Bitcoin #CryptoAnalysis
24

·
--
🚨 Pump.fun just offloaded another 64,666 SOL (~$5.19M) into Kraken as SOL dipped below $75. With lifetime sales nearing $888M, this sustained sell pressure signals a potential further downside for SOL price.
Market Implication: Large-scale exchange deposits by a major platform often precede short-term price weakness or consolidation.
#Crypto
$SOL #TradingSignal #CryptoAnalysis
🚨 Pump.fun just offloaded another 64,666 SOL (~$5.19M) into Kraken as SOL dipped below $75. With lifetime sales nearing $888M, this sustained sell pressure signals a potential further downside for SOL price.
Market Implication: Large-scale exchange deposits by a major platform often precede short-term price weakness or consolidation.
#Crypto
$SOL #TradingSignal #CryptoAnalysis
Market Implication: Large-scale exchange deposits by a major platform often precede short-term price weakness or consolidation.
#Crypto
$SOL #TradingSignal #CryptoAnalysis

1
158

·
--
Bearish
🚨 BITCOIN: $65K NEXT OR A RECOVERY?
$BTC is facing selling pressure near the $67K–$68K zone, and the next move could be important.
📊 Key Levels:
* Resistance: $70,000
* Support: $67,500
* Downside Target: $65,000
🔴 Bearish: A break below $67,500 could open the door toward $65K.
🟢 Bullish: Reclaiming $70K could bring buyers back into the market.
My Take: $BTC looks weak in the short term. Waiting for confirmation seems safer than chasing the move.
🔥 What’s your move right now — BUY the dip around $67.5K, WAIT for a $70K breakout, or SELL before BTC drops toward $65K?
Drop your prediction below! 👇
#Bitcoin #BTC #CryptoAnalysis #BinanceSquare
{future}(BTCUSDT)
🚨 BITCOIN: $65K NEXT OR A RECOVERY?
$BTC is facing selling pressure near the $67K–$68K zone, and the next move could be important.
📊 Key Levels:
* Resistance: $70,000
* Support: $67,500
* Downside Target: $65,000
🔴 Bearish: A break below $67,500 could open the door toward $65K.
🟢 Bullish: Reclaiming $70K could bring buyers back into the market.
My Take: $BTC looks weak in the short term. Waiting for confirmation seems safer than chasing the move.
🔥 What’s your move right now — BUY the dip around $67.5K, WAIT for a $70K breakout, or SELL before BTC drops toward $65K?
Drop your prediction below! 👇
#Bitcoin #BTC #CryptoAnalysis #BinanceSquare
$BTC is facing selling pressure near the $67K–$68K zone, and the next move could be important.
📊 Key Levels:
* Resistance: $70,000
* Support: $67,500
* Downside Target: $65,000
🔴 Bearish: A break below $67,500 could open the door toward $65K.
🟢 Bullish: Reclaiming $70K could bring buyers back into the market.
My Take: $BTC looks weak in the short term. Waiting for confirmation seems safer than chasing the move.
🔥 What’s your move right now — BUY the dip around $67.5K, WAIT for a $70K breakout, or SELL before BTC drops toward $65K?
Drop your prediction below! 👇
#Bitcoin #BTC #CryptoAnalysis #BinanceSquare

78
·
--
🚨 XRP dips to $0.998, breaching the critical $1 psychological support. The breach signals short-term bearish momentum as the one-year XRP ETF anniversary passes. Market focus shifts to whether the asset can reclaim the level.
Will XRP recover or slide further?
$XRP #TradingSignal #CryptoAnalysis
🚨 XRP dips to $0.998, breaching the critical $1 psychological support. The breach signals short-term bearish momentum as the one-year XRP ETF anniversary passes. Market focus shifts to whether the asset can reclaim the level.
Will XRP recover or slide further?
$XRP #TradingSignal #CryptoAnalysis
Will XRP recover or slide further?
$XRP #TradingSignal #CryptoAnalysis

162

BTC Liquidity Sweeps 🎣 BTC LIQUIDITY SWEEPS: WHY OBVIOUS LEVELS MATTER
Markets often react sharply around previous highs, previous lows, and heavily watched support or resistance zones.
Why? These areas may contain clusters of stop orders and breakout entries.
A fast move beyond a level is not automatically a trend continuation. Watch how price closes and whether it can hold the zone afterward.
#BTC #Liquidity #SmartMoneyConcepts #CryptoAnalysis $BTC
{future}(BTCUSDT)
BTC Liquidity Sweeps 🎣 BTC LIQUIDITY SWEEPS: WHY OBVIOUS LEVELS MATTER
Markets often react sharply around previous highs, previous lows, and heavily watched support or resistance zones.
Why? These areas may contain clusters of stop orders and breakout entries.
A fast move beyond a level is not automatically a trend continuation. Watch how price closes and whether it can hold the zone afterward.
#BTC #Liquidity #SmartMoneyConcepts #CryptoAnalysis $BTC
Markets often react sharply around previous highs, previous lows, and heavily watched support or resistance zones.
Why? These areas may contain clusters of stop orders and breakout entries.
A fast move beyond a level is not automatically a trend continuation. Watch how price closes and whether it can hold the zone afterward.
#BTC #Liquidity #SmartMoneyConcepts #CryptoAnalysis $BTC
5

·
--

Article
Trending Altcoins Are Not Always Good Investments: 4 Tokens Every Trader Should WatchA coin can dominate Binance Square, attract thousands of discussions and still have very little real buying demand. That's where many traders get trapped.
I've seen this pattern repeatedly in low-cap altcoins. Social activity suddenly increases, prices start moving, and traders rush in expecting a major breakout.
But the reality is often different.
Sometimes the movement comes from short liquidations. Sometimes leveraged traders are driving the price. And sometimes creator incentives generate attention without bringing meaningful spot buyers into the market.
That's why I wouldn't judge an altcoin by its discussion volume alone.
Four tokens currently offer an interesting case study: Capminal ($CAP ), Concrete ($CT ), PlaysOut (PLAY) and Arcium (ARX).
Their derivatives data reveals four different market situations.
1. Capminal (CAP): Is the Short Squeeze Running Out of Fuel?
Capminal's discussion activity reportedly climbed to around 2.17 times its five-day average in the November 11 observation.
The liquidation data was interesting.
Short liquidations: approximately $358K
Long liquidations: approximately $88K
Open Interest: approximately $52.5M
Short liquidations were roughly four times higher than long liquidations.
That's a sign of short-squeeze activity. When short sellers are forced to close their positions, their buybacks can push prices higher.
But there's another side to the story.
Short liquidations represented only around 0.7% of Open Interest. So, this wasn't enough to suggest that the entire short-position pool had been cleared.
My view: CAP could still see volatility, but I would want to see sustained spot buying before treating this move as genuine accumulation.
A squeeze can create momentum. Spot demand is what can help sustain it.
2. Concrete (CT): Long Traders Are Facing Pressure
Concrete recorded discussion activity around 2.13 times its five-day average in the November 9 observation.
However, its liquidation data showed a worrying imbalance.
Long liquidations: approximately $140.23K
Short liquidations: approximately $1.88K
Long-to-short liquidation ratio: around 75:1
In simple terms, bullish leveraged traders took most of the damage.
The November 14 snapshot also showed that approximately 94% of reported liquidations came from long positions.
This is important because crowded long positions can turn a normal price decline into a much sharper sell-off.
What I would watch:
Whether liquidation pressure begins to ease.
Whether buyers defend important support levels.
Whether Open Interest resets after the sell-off.
Whether spot volume confirms a recovery.
I wouldn't rush to buy CT just because its discussion activity is rising. I'd rather wait for price stabilisation and a clear sign that buyers are returning.
3. PlaysOut (PLAY): Futures Volume Is Dominating the Market
PlaysOut recorded more than five times its usual five-day discussion activity.
That sounds impressive, but the trading data deserves more attention.
The November 14 snapshot showed:
Spot volume: approximately $141K
Futures volume: approximately $16.87M
Open Interest: approximately $4.09M
24-hour price change: around -5.67%
Here's the number that stands out: futures volume was nearly 120 times higher than spot volume.
That suggests derivatives traders are dominating market activity.
It doesn't automatically mean PLAY will fall. However, it raises questions about how much genuine spot demand is supporting the price.
Creator reward campaigns can also increase social activity. Binance Square has used engagement-based creator incentives, although there is no verified evidence that such a campaign explains the entire PlaysOut discussion spike.
My view: $PLAY needs stronger spot participation before I would consider its rising popularity a convincing bullish signal.
A busy futures market is not the same as strong investor demand.
4. Arcium (ARX): Rising Open Interest Doesn't Guarantee a Breakout
ARX, referring to Arcium, also experienced a reported increase in discussion activity.
But its liquidation data tells a more complicated story.
The November 14 snapshot showed:
Open Interest: approximately $21.11M
Total liquidations: approximately $52.69K
Short liquidations: approximately $41.85K
Long liquidations: approximately $10.84K
Liquidations represented roughly 0.25% of Open Interest.
That's relatively small.
So, while short liquidations may have contributed to buying pressure, there isn't enough evidence to call this a major short squeeze.
Arcium's confidential-computing narrative may attract longer-term interest, but traders still need to separate that fundamental story from short-term price speculation.
My view: ARX deserves attention, but I would look for stronger spot demand and a confirmed price breakout before chasing the move.
What Should Traders Check Before Buying?
I pay more attention to market structure than social-media rankings.
Before entering a low-cap altcoin, these five indicators deserve a closer look:
Indicator What I want to see
Spot Volume Consistent buying activity
Open Interest Controlled growth
Funding Rate No excessive long positioning
Liquidations No repeated liquidation cascades
Price Structure Higher highs and higher lows
One combination is particularly useful:
Rising price + Rising Spot Volume + Controlled Open Interest Growth.
It can indicate healthier market participation than a rally driven mainly by forced liquidations.
Still, no indicator guarantees that a breakout will succeed.
My Trading Approach: Let the Market Confirm First
I wouldn't buy these four tokens simply because they are trending.
Each one needs a different setup:
CAP: Watch whether spot buyers continue after the short squeeze.
CT: Wait for long liquidation pressure to ease and price to stabilise.
PLAY: Look for a meaningful improvement in spot volume.
ARX: Monitor funding, Open Interest and actual buying demand.
I would also avoid entering after a sudden price spike.
Low-cap tokens can reverse quickly, especially when liquidity is thin. Smaller position sizes, predefined stop-losses and partial profit-taking are essential.
There is no reason to risk a large portion of your portfolio just to catch a trending coin.
The Real Signal Is Buying Demand, Not Attention
CAP, CT, PLAY and ARX show how different forces can drive altcoin discussions and short-term price movements.
But the lesson is simple:
A trending token doesn't automatically mean a good investment opportunity.
Before taking a position, find out who is actually buying, where the volume is coming from and whether the price structure supports the move.
The best trades aren't always the coins everyone is talking about. Sometimes the better opportunity appears when genuine buying demand starts showing up before the crowd notices.
Which of these four altcoins has the strongest potential for a sustainable rally in your opinion: CAP, CT, PLAY or ARX? And are you watching spot volume or social hype before entering a trade?
Share your analysis in the comments.
{future}(PLAYUSDT)
{future}(CTUSDT)
{future}(CAPUSDT)
#CryptoAnalysis #altcoins #cryptouniverseofficial #TradingSignals #Binance
Trending Altcoins Are Not Always Good Investments: 4 Tokens Every Trader Should Watch
A coin can dominate Binance Square, attract thousands of discussions and still have very little real buying demand. That's where many traders get trapped.
I've seen this pattern repeatedly in low-cap altcoins. Social activity suddenly increases, prices start moving, and traders rush in expecting a major breakout.
But the reality is often different.
Sometimes the movement comes from short liquidations. Sometimes leveraged traders are driving the price. And sometimes creator incentives generate attention without bringing meaningful spot buyers into the market.
That's why I wouldn't judge an altcoin by its discussion volume alone.
Four tokens currently offer an interesting case study: Capminal ($CAP ), Concrete ($CT ), PlaysOut (PLAY) and Arcium (ARX).
Their derivatives data reveals four different market situations.
1. Capminal (CAP): Is the Short Squeeze Running Out of Fuel?
Capminal's discussion activity reportedly climbed to around 2.17 times its five-day average in the November 11 observation.
The liquidation data was interesting.
Short liquidations: approximately $358K
Long liquidations: approximately $88K
Open Interest: approximately $52.5M
Short liquidations were roughly four times higher than long liquidations.
That's a sign of short-squeeze activity. When short sellers are forced to close their positions, their buybacks can push prices higher.
But there's another side to the story.
Short liquidations represented only around 0.7% of Open Interest. So, this wasn't enough to suggest that the entire short-position pool had been cleared.
My view: CAP could still see volatility, but I would want to see sustained spot buying before treating this move as genuine accumulation.
A squeeze can create momentum. Spot demand is what can help sustain it.
2. Concrete (CT): Long Traders Are Facing Pressure
Concrete recorded discussion activity around 2.13 times its five-day average in the November 9 observation.
However, its liquidation data showed a worrying imbalance.
Long liquidations: approximately $140.23K
Short liquidations: approximately $1.88K
Long-to-short liquidation ratio: around 75:1
In simple terms, bullish leveraged traders took most of the damage.
The November 14 snapshot also showed that approximately 94% of reported liquidations came from long positions.
This is important because crowded long positions can turn a normal price decline into a much sharper sell-off.
What I would watch:
Whether liquidation pressure begins to ease.
Whether buyers defend important support levels.
Whether Open Interest resets after the sell-off.
Whether spot volume confirms a recovery.
I wouldn't rush to buy CT just because its discussion activity is rising. I'd rather wait for price stabilisation and a clear sign that buyers are returning.
3. PlaysOut (PLAY): Futures Volume Is Dominating the Market
PlaysOut recorded more than five times its usual five-day discussion activity.
That sounds impressive, but the trading data deserves more attention.
The November 14 snapshot showed:
Spot volume: approximately $141K
Futures volume: approximately $16.87M
Open Interest: approximately $4.09M
24-hour price change: around -5.67%
Here's the number that stands out: futures volume was nearly 120 times higher than spot volume.
That suggests derivatives traders are dominating market activity.
It doesn't automatically mean PLAY will fall. However, it raises questions about how much genuine spot demand is supporting the price.
Creator reward campaigns can also increase social activity. Binance Square has used engagement-based creator incentives, although there is no verified evidence that such a campaign explains the entire PlaysOut discussion spike.
My view: $PLAY needs stronger spot participation before I would consider its rising popularity a convincing bullish signal.
A busy futures market is not the same as strong investor demand.
4. Arcium (ARX): Rising Open Interest Doesn't Guarantee a Breakout
ARX, referring to Arcium, also experienced a reported increase in discussion activity.
But its liquidation data tells a more complicated story.
The November 14 snapshot showed:
Open Interest: approximately $21.11M
Total liquidations: approximately $52.69K
Short liquidations: approximately $41.85K
Long liquidations: approximately $10.84K
Liquidations represented roughly 0.25% of Open Interest.
That's relatively small.
So, while short liquidations may have contributed to buying pressure, there isn't enough evidence to call this a major short squeeze.
Arcium's confidential-computing narrative may attract longer-term interest, but traders still need to separate that fundamental story from short-term price speculation.
My view: ARX deserves attention, but I would look for stronger spot demand and a confirmed price breakout before chasing the move.
What Should Traders Check Before Buying?
I pay more attention to market structure than social-media rankings.
Before entering a low-cap altcoin, these five indicators deserve a closer look:
Indicator What I want to see
Spot Volume Consistent buying activity
Open Interest Controlled growth
Funding Rate No excessive long positioning
Liquidations No repeated liquidation cascades
Price Structure Higher highs and higher lows
One combination is particularly useful:
Rising price + Rising Spot Volume + Controlled Open Interest Growth.
It can indicate healthier market participation than a rally driven mainly by forced liquidations.
Still, no indicator guarantees that a breakout will succeed.
My Trading Approach: Let the Market Confirm First
I wouldn't buy these four tokens simply because they are trending.
Each one needs a different setup:
CAP: Watch whether spot buyers continue after the short squeeze.
CT: Wait for long liquidation pressure to ease and price to stabilise.
PLAY: Look for a meaningful improvement in spot volume.
ARX: Monitor funding, Open Interest and actual buying demand.
I would also avoid entering after a sudden price spike.
Low-cap tokens can reverse quickly, especially when liquidity is thin. Smaller position sizes, predefined stop-losses and partial profit-taking are essential.
There is no reason to risk a large portion of your portfolio just to catch a trending coin.
The Real Signal Is Buying Demand, Not Attention
CAP, CT, PLAY and ARX show how different forces can drive altcoin discussions and short-term price movements.
But the lesson is simple:
A trending token doesn't automatically mean a good investment opportunity.
Before taking a position, find out who is actually buying, where the volume is coming from and whether the price structure supports the move.
The best trades aren't always the coins everyone is talking about. Sometimes the better opportunity appears when genuine buying demand starts showing up before the crowd notices.
Which of these four altcoins has the strongest potential for a sustainable rally in your opinion: CAP, CT, PLAY or ARX? And are you watching spot volume or social hype before entering a trade?
Share your analysis in the comments.
#CryptoAnalysis #altcoins #cryptouniverseofficial #TradingSignals #Binance
I've seen this pattern repeatedly in low-cap altcoins. Social activity suddenly increases, prices start moving, and traders rush in expecting a major breakout.
But the reality is often different.
Sometimes the movement comes from short liquidations. Sometimes leveraged traders are driving the price. And sometimes creator incentives generate attention without bringing meaningful spot buyers into the market.
That's why I wouldn't judge an altcoin by its discussion volume alone.
Four tokens currently offer an interesting case study: Capminal ($CAP ), Concrete ($CT ), PlaysOut (PLAY) and Arcium (ARX).
Their derivatives data reveals four different market situations.
1. Capminal (CAP): Is the Short Squeeze Running Out of Fuel?
Capminal's discussion activity reportedly climbed to around 2.17 times its five-day average in the November 11 observation.
The liquidation data was interesting.
Short liquidations: approximately $358K
Long liquidations: approximately $88K
Open Interest: approximately $52.5M
Short liquidations were roughly four times higher than long liquidations.
That's a sign of short-squeeze activity. When short sellers are forced to close their positions, their buybacks can push prices higher.
But there's another side to the story.
Short liquidations represented only around 0.7% of Open Interest. So, this wasn't enough to suggest that the entire short-position pool had been cleared.
My view: CAP could still see volatility, but I would want to see sustained spot buying before treating this move as genuine accumulation.
A squeeze can create momentum. Spot demand is what can help sustain it.
2. Concrete (CT): Long Traders Are Facing Pressure
Concrete recorded discussion activity around 2.13 times its five-day average in the November 9 observation.
However, its liquidation data showed a worrying imbalance.
Long liquidations: approximately $140.23K
Short liquidations: approximately $1.88K
Long-to-short liquidation ratio: around 75:1
In simple terms, bullish leveraged traders took most of the damage.
The November 14 snapshot also showed that approximately 94% of reported liquidations came from long positions.
This is important because crowded long positions can turn a normal price decline into a much sharper sell-off.
What I would watch:
Whether liquidation pressure begins to ease.
Whether buyers defend important support levels.
Whether Open Interest resets after the sell-off.
Whether spot volume confirms a recovery.
I wouldn't rush to buy CT just because its discussion activity is rising. I'd rather wait for price stabilisation and a clear sign that buyers are returning.
3. PlaysOut (PLAY): Futures Volume Is Dominating the Market
PlaysOut recorded more than five times its usual five-day discussion activity.
That sounds impressive, but the trading data deserves more attention.
The November 14 snapshot showed:
Spot volume: approximately $141K
Futures volume: approximately $16.87M
Open Interest: approximately $4.09M
24-hour price change: around -5.67%
Here's the number that stands out: futures volume was nearly 120 times higher than spot volume.
That suggests derivatives traders are dominating market activity.
It doesn't automatically mean PLAY will fall. However, it raises questions about how much genuine spot demand is supporting the price.
Creator reward campaigns can also increase social activity. Binance Square has used engagement-based creator incentives, although there is no verified evidence that such a campaign explains the entire PlaysOut discussion spike.
My view: $PLAY needs stronger spot participation before I would consider its rising popularity a convincing bullish signal.
A busy futures market is not the same as strong investor demand.
4. Arcium (ARX): Rising Open Interest Doesn't Guarantee a Breakout
ARX, referring to Arcium, also experienced a reported increase in discussion activity.
But its liquidation data tells a more complicated story.
The November 14 snapshot showed:
Open Interest: approximately $21.11M
Total liquidations: approximately $52.69K
Short liquidations: approximately $41.85K
Long liquidations: approximately $10.84K
Liquidations represented roughly 0.25% of Open Interest.
That's relatively small.
So, while short liquidations may have contributed to buying pressure, there isn't enough evidence to call this a major short squeeze.
Arcium's confidential-computing narrative may attract longer-term interest, but traders still need to separate that fundamental story from short-term price speculation.
My view: ARX deserves attention, but I would look for stronger spot demand and a confirmed price breakout before chasing the move.
What Should Traders Check Before Buying?
I pay more attention to market structure than social-media rankings.
Before entering a low-cap altcoin, these five indicators deserve a closer look:
Indicator What I want to see
Spot Volume Consistent buying activity
Open Interest Controlled growth
Funding Rate No excessive long positioning
Liquidations No repeated liquidation cascades
Price Structure Higher highs and higher lows
One combination is particularly useful:
Rising price + Rising Spot Volume + Controlled Open Interest Growth.
It can indicate healthier market participation than a rally driven mainly by forced liquidations.
Still, no indicator guarantees that a breakout will succeed.
My Trading Approach: Let the Market Confirm First
I wouldn't buy these four tokens simply because they are trending.
Each one needs a different setup:
CAP: Watch whether spot buyers continue after the short squeeze.
CT: Wait for long liquidation pressure to ease and price to stabilise.
PLAY: Look for a meaningful improvement in spot volume.
ARX: Monitor funding, Open Interest and actual buying demand.
I would also avoid entering after a sudden price spike.
Low-cap tokens can reverse quickly, especially when liquidity is thin. Smaller position sizes, predefined stop-losses and partial profit-taking are essential.
There is no reason to risk a large portion of your portfolio just to catch a trending coin.
The Real Signal Is Buying Demand, Not Attention
CAP, CT, PLAY and ARX show how different forces can drive altcoin discussions and short-term price movements.
But the lesson is simple:
A trending token doesn't automatically mean a good investment opportunity.
Before taking a position, find out who is actually buying, where the volume is coming from and whether the price structure supports the move.
The best trades aren't always the coins everyone is talking about. Sometimes the better opportunity appears when genuine buying demand starts showing up before the crowd notices.
Which of these four altcoins has the strongest potential for a sustainable rally in your opinion: CAP, CT, PLAY or ARX? And are you watching spot volume or social hype before entering a trade?
Share your analysis in the comments.
#CryptoAnalysis #altcoins #cryptouniverseofficial #TradingSignals #Binance
1
675

·
--
Bearish
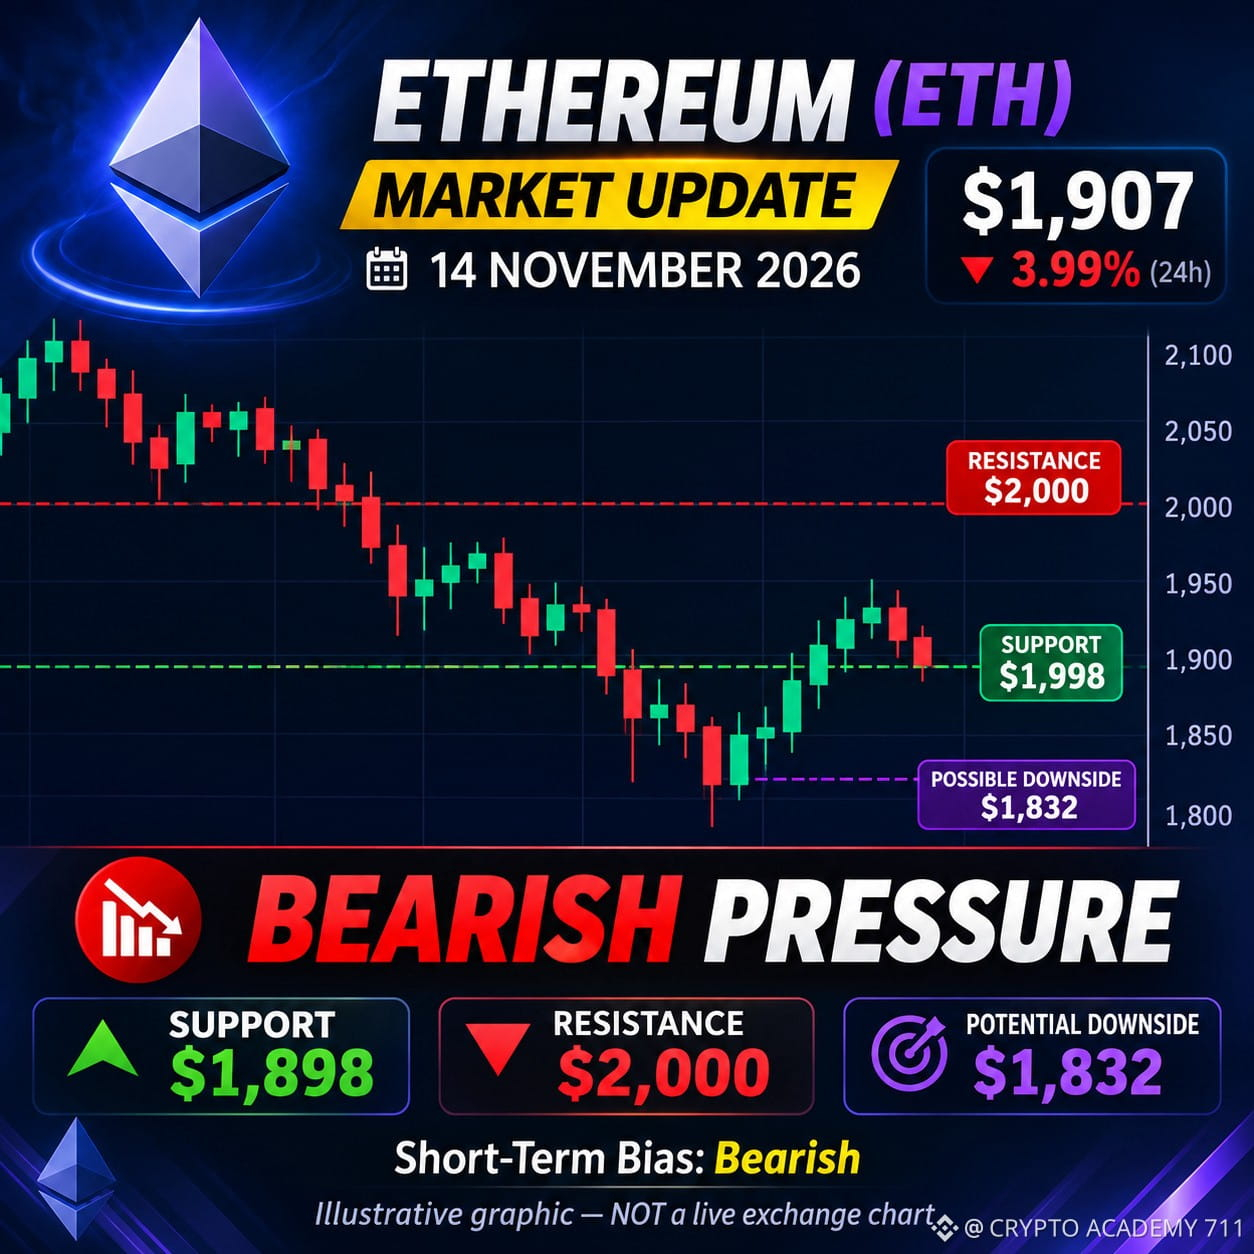
$ETH ETHEREUM (ETH) MARKET ANALYSIS | NOVEMBER 14, 2026
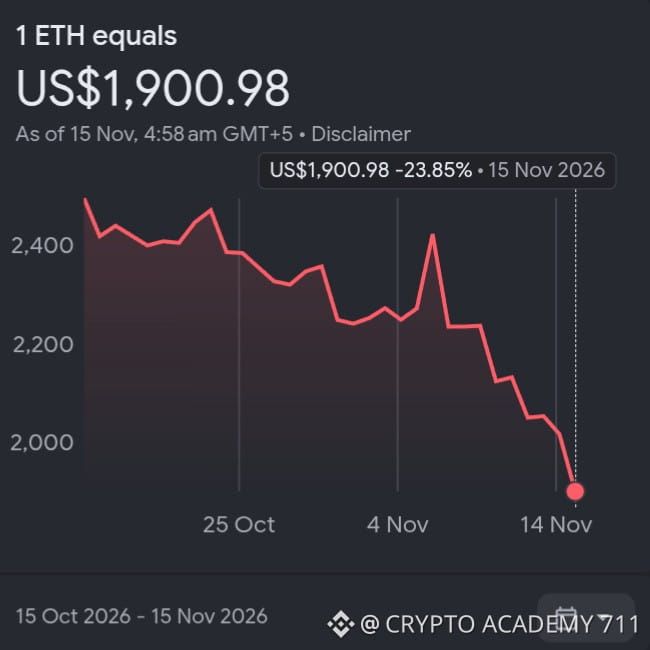
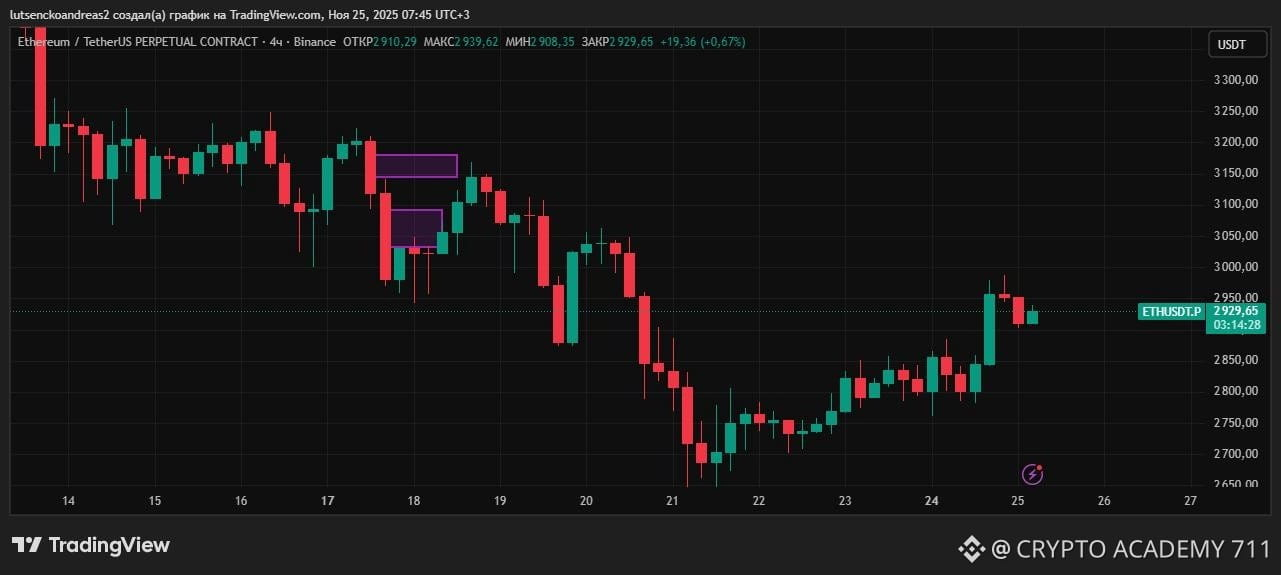
Ethereum is facing strong selling pressure as the broader crypto market remains weak.
💰 Current Price: ~$1,907
📉 Market Trend: Bearish
🔹 Support Levels: • $1,898 • $1,832
🔹 Resistance Levels: • $2,000 • $2,070
📈 Bullish Scenario: A strong breakout above $2,000 could open the door toward $2,070.
📉 Bearish Scenario: Losing $1,898 could expose ETH to further downside toward $1,832.
🎯 My Outlook: Cautious bearish until ETH reclaims the $2,000 resistance zone.
⚠️ Trade carefully. Always use proper risk management.
{spot}(ETHUSDT)
#Ethereum #ETH #CryptoAnalysis #BinanceSquare #Trading
$ETH ETHEREUM (ETH) MARKET ANALYSIS | NOVEMBER 14, 2026
Ethereum is facing strong selling pressure as the broader crypto market remains weak.
💰 Current Price: ~$1,907
📉 Market Trend: Bearish
🔹 Support Levels: • $1,898 • $1,832
🔹 Resistance Levels: • $2,000 • $2,070
📈 Bullish Scenario: A strong breakout above $2,000 could open the door toward $2,070.
📉 Bearish Scenario: Losing $1,898 could expose ETH to further downside toward $1,832.
🎯 My Outlook: Cautious bearish until ETH reclaims the $2,000 resistance zone.
⚠️ Trade carefully. Always use proper risk management.
#Ethereum #ETH #CryptoAnalysis #BinanceSquare #Trading
Ethereum is facing strong selling pressure as the broader crypto market remains weak.
💰 Current Price: ~$1,907
📉 Market Trend: Bearish
🔹 Support Levels: • $1,898 • $1,832
🔹 Resistance Levels: • $2,000 • $2,070
📈 Bullish Scenario: A strong breakout above $2,000 could open the door toward $2,070.
📉 Bearish Scenario: Losing $1,898 could expose ETH to further downside toward $1,832.
🎯 My Outlook: Cautious bearish until ETH reclaims the $2,000 resistance zone.
⚠️ Trade carefully. Always use proper risk management.
#Ethereum #ETH #CryptoAnalysis #BinanceSquare #Trading
61

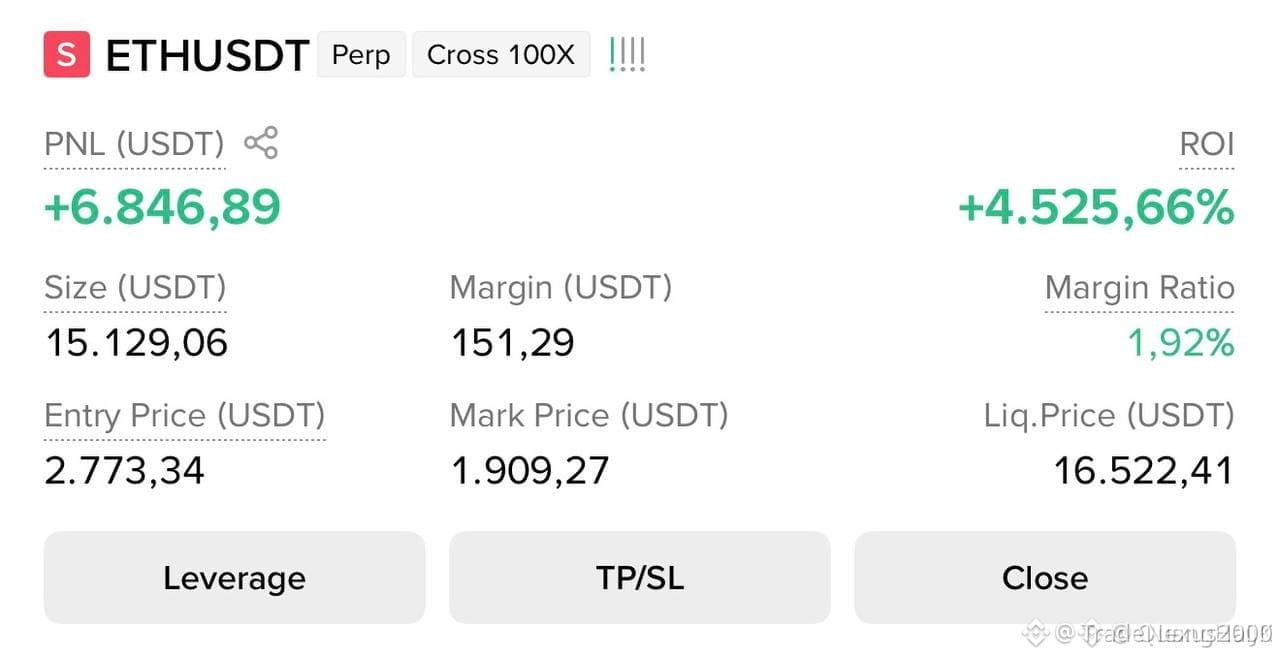
🚨 $ETH REJECTING OFF THE PREMIUM DISTRIBUTION ARRAY AS INSTITUTIONAL SELLERS STEP IN! 🐻
Entry: 1985 - 2158 ⚡
Target: 1932 - 1651 🎯
Stop Loss: 2200 🛑
Price has pushed directly into a high-timeframe institutional mitigation block, sweeping early breakout liquidity before showing clear signs of exhaustion. 📊 Order flow indicates aggressive passive selling pressure clustering around this premium zone as algorithmic supply absorbs retail FOMO. ⚡
We are eyeing a structural correction down toward deep inefficiency fills as market makers rebalance the imbalances left behind. 💡 Are you positioned for this liquidity hunt or waiting for a confirmed shift in market structure? 👇
⚠️ Not financial advice. Always manage your risk. 🛡️
🏷️ #ETH #ShortSetup #SmartMoney #CryptoAnalysis
🔥 🦈
🚨 $ETH REJECTING OFF THE PREMIUM DISTRIBUTION ARRAY AS INSTITUTIONAL SELLERS STEP IN! 🐻
Entry: 1985 - 2158 ⚡
Target: 1932 - 1651 🎯
Stop Loss: 2200 🛑
Price has pushed directly into a high-timeframe institutional mitigation block, sweeping early breakout liquidity before showing clear signs of exhaustion. 📊 Order flow indicates aggressive passive selling pressure clustering around this premium zone as algorithmic supply absorbs retail FOMO. ⚡
We are eyeing a structural correction down toward deep inefficiency fills as market makers rebalance the imbalances left behind. 💡 Are you positioned for this liquidity hunt or waiting for a confirmed shift in market structure? 👇
⚠️ Not financial advice. Always manage your risk. 🛡️
🏷️ #ETH #ShortSetup #SmartMoney #CryptoAnalysis
🔥 🦈
Entry: 1985 - 2158 ⚡
Target: 1932 - 1651 🎯
Stop Loss: 2200 🛑
Price has pushed directly into a high-timeframe institutional mitigation block, sweeping early breakout liquidity before showing clear signs of exhaustion. 📊 Order flow indicates aggressive passive selling pressure clustering around this premium zone as algorithmic supply absorbs retail FOMO. ⚡
We are eyeing a structural correction down toward deep inefficiency fills as market makers rebalance the imbalances left behind. 💡 Are you positioned for this liquidity hunt or waiting for a confirmed shift in market structure? 👇
⚠️ Not financial advice. Always manage your risk. 🛡️
🏷️ #ETH #ShortSetup #SmartMoney #CryptoAnalysis
🔥 🦈
8

{spot}(SHELLUSDT)
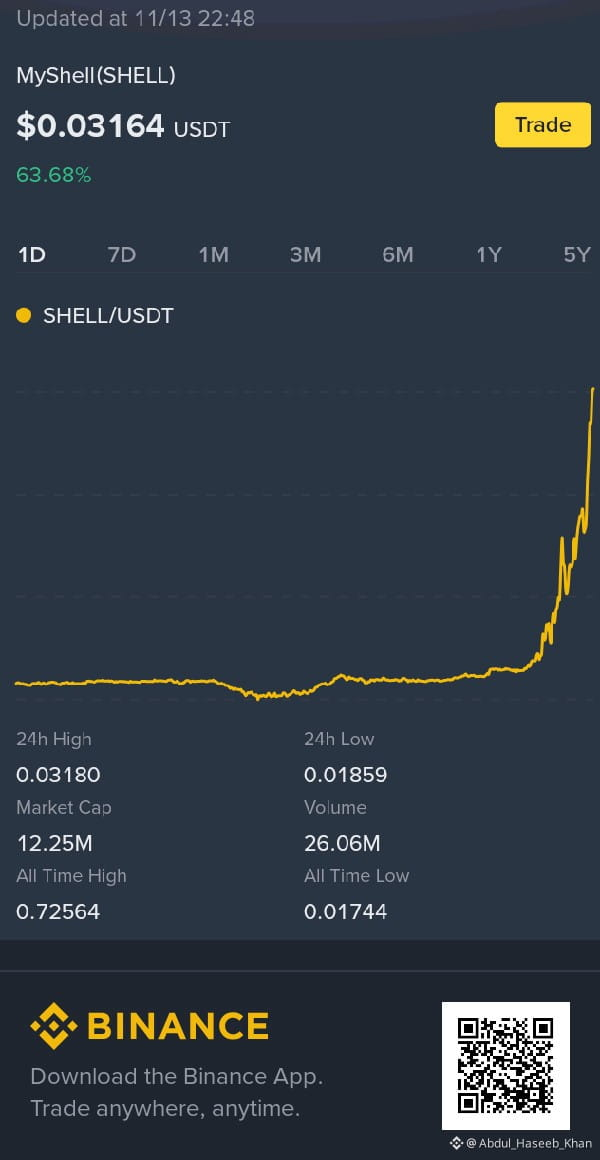
🚀 $SHELL USDT: +62% SURGE! Can the Rally Continue in the Next 24 Hours?
$SHELL is showing impressive bullish momentum, currently trading at $0.03139, up approximately 62.39% in the last 24 hours.
But the big question is: Can bulls push the price even higher, or is a short-term cooldown approaching?
📊 BULLISH SIGNALS
- MACD remains bullish after a recent golden cross on the 1H timeframe.
- MA7, MA25, and MA99 are aligned bullishly.
- Trading volume is 3.37x above its 7-hour average.
- Positive net capital inflow supports buying interest.
- Price has successfully broken above the previous $0.026 resistance zone.
⚠️ RISKS TO WATCH
- RSI(6) is at 99.27, indicating extremely overbought conditions.
- Price is significantly extended above its moving averages.
- $SHELL is trading close to its 24-hour high of $0.03180.
- A decline in buying volume could trigger a short-term correction.
🎯 KEY LEVELS & 24H SCENARIOS
🟢 Bullish Scenario: Sustained buying pressure and strong volume could support further upside.
🟡 Consolidation Scenario: Price may move sideways while momentum cools and volume returns to normal.
🔴 Bearish Scenario: Losing the $0.026 breakout zone could weaken the bullish structure and increase downside pressure.
🔥 MY TAKE: SHELL has strong bullish momentum, but chasing the rally at current levels carries significant risk. Watch volume and the $0.026 breakout zone closely.
Trade smart. Manage your risk. Never chase FOMO!
#SHELL #SHELLUSDT #Crypto #BinanceSquare #CryptoAnalysis
Disclaimer: This analysis is for informational and educational purposes only. It is not financial or investment advice. Always do your own research.
🚀 $SHELL USDT: +62% SURGE! Can the Rally Continue in the Next 24 Hours?
$SHELL is showing impressive bullish momentum, currently trading at $0.03139, up approximately 62.39% in the last 24 hours.
But the big question is: Can bulls push the price even higher, or is a short-term cooldown approaching?
📊 BULLISH SIGNALS
- MACD remains bullish after a recent golden cross on the 1H timeframe.
- MA7, MA25, and MA99 are aligned bullishly.
- Trading volume is 3.37x above its 7-hour average.
- Positive net capital inflow supports buying interest.
- Price has successfully broken above the previous $0.026 resistance zone.
⚠️ RISKS TO WATCH
- RSI(6) is at 99.27, indicating extremely overbought conditions.
- Price is significantly extended above its moving averages.
- $SHELL is trading close to its 24-hour high of $0.03180.
- A decline in buying volume could trigger a short-term correction.
🎯 KEY LEVELS & 24H SCENARIOS
🟢 Bullish Scenario: Sustained buying pressure and strong volume could support further upside.
🟡 Consolidation Scenario: Price may move sideways while momentum cools and volume returns to normal.
🔴 Bearish Scenario: Losing the $0.026 breakout zone could weaken the bullish structure and increase downside pressure.
🔥 MY TAKE: SHELL has strong bullish momentum, but chasing the rally at current levels carries significant risk. Watch volume and the $0.026 breakout zone closely.
Trade smart. Manage your risk. Never chase FOMO!
#SHELL #SHELLUSDT #Crypto #BinanceSquare #CryptoAnalysis
Disclaimer: This analysis is for informational and educational purposes only. It is not financial or investment advice. Always do your own research.
🚀 $SHELL USDT: +62% SURGE! Can the Rally Continue in the Next 24 Hours?
$SHELL is showing impressive bullish momentum, currently trading at $0.03139, up approximately 62.39% in the last 24 hours.
But the big question is: Can bulls push the price even higher, or is a short-term cooldown approaching?
📊 BULLISH SIGNALS
- MACD remains bullish after a recent golden cross on the 1H timeframe.
- MA7, MA25, and MA99 are aligned bullishly.
- Trading volume is 3.37x above its 7-hour average.
- Positive net capital inflow supports buying interest.
- Price has successfully broken above the previous $0.026 resistance zone.
⚠️ RISKS TO WATCH
- RSI(6) is at 99.27, indicating extremely overbought conditions.
- Price is significantly extended above its moving averages.
- $SHELL is trading close to its 24-hour high of $0.03180.
- A decline in buying volume could trigger a short-term correction.
🎯 KEY LEVELS & 24H SCENARIOS
🟢 Bullish Scenario: Sustained buying pressure and strong volume could support further upside.
🟡 Consolidation Scenario: Price may move sideways while momentum cools and volume returns to normal.
🔴 Bearish Scenario: Losing the $0.026 breakout zone could weaken the bullish structure and increase downside pressure.
🔥 MY TAKE: SHELL has strong bullish momentum, but chasing the rally at current levels carries significant risk. Watch volume and the $0.026 breakout zone closely.
Trade smart. Manage your risk. Never chase FOMO!
#SHELL #SHELLUSDT #Crypto #BinanceSquare #CryptoAnalysis
Disclaimer: This analysis is for informational and educational purposes only. It is not financial or investment advice. Always do your own research.

1
310

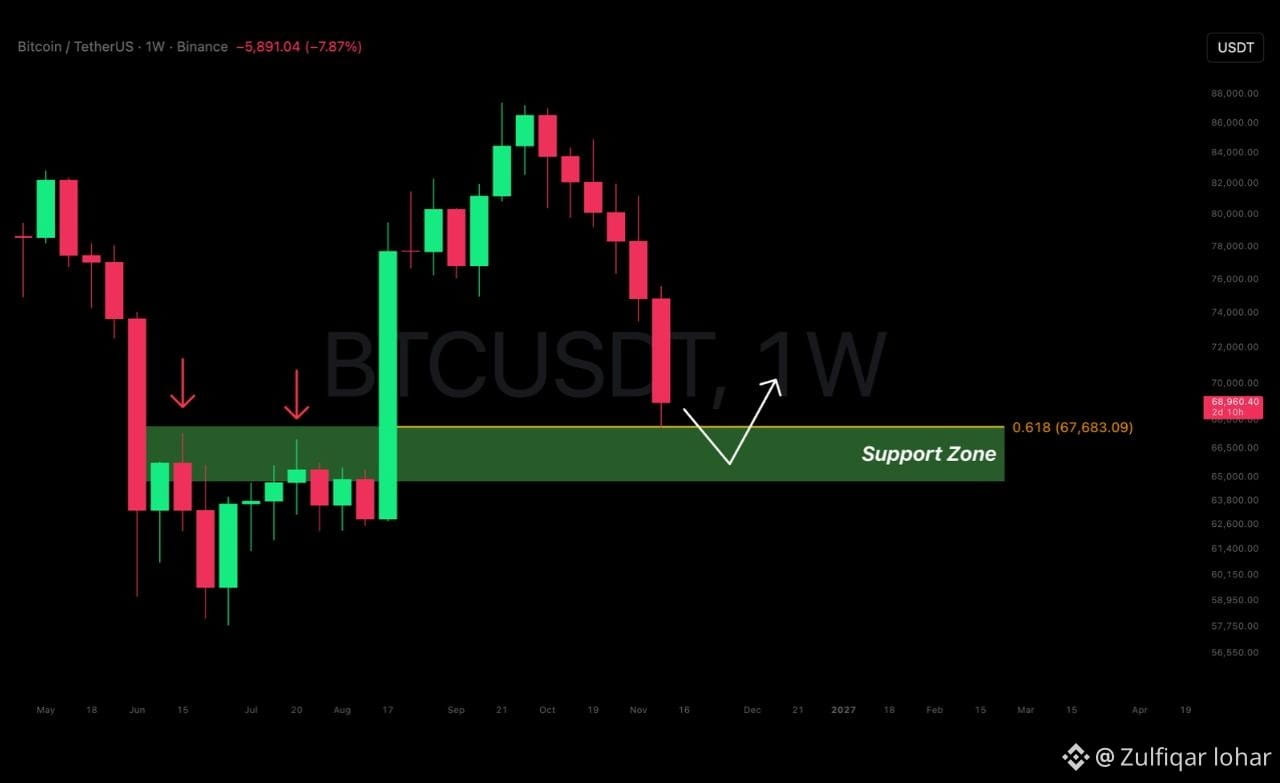
📌 BITCOIN MACRO ANALYSIS — 1W
Looking at Bitcoin from a higher-timeframe perspective, I believe we may be approaching a local bottom. 👀
Two major confluences support this outlook:
🔹 Previous Resistance → Support: A key resistance level is now acting as potential support.
🔹 Fibonacci Golden Ratio: BTC is approaching an important Fibonacci confluence zone.
🎯 My Outlook: Bitcoin may begin forming a base around the current price and these key support levels.
⚠️ This is a potential bottom, not a confirmed reversal. Watch for confirmation before making any trading decisions.
#BTC #Bitcoin #MacroAnalysis #FibonacciSecrets #CryptoAnalysis #BinanceSquare
📌 BITCOIN MACRO ANALYSIS — 1W
Looking at Bitcoin from a higher-timeframe perspective, I believe we may be approaching a local bottom. 👀
Two major confluences support this outlook:
🔹 Previous Resistance → Support: A key resistance level is now acting as potential support.
🔹 Fibonacci Golden Ratio: BTC is approaching an important Fibonacci confluence zone.
🎯 My Outlook: Bitcoin may begin forming a base around the current price and these key support levels.
⚠️ This is a potential bottom, not a confirmed reversal. Watch for confirmation before making any trading decisions.
#BTC #Bitcoin #MacroAnalysis #FibonacciSecrets #CryptoAnalysis #BinanceSquare
Looking at Bitcoin from a higher-timeframe perspective, I believe we may be approaching a local bottom. 👀
Two major confluences support this outlook:
🔹 Previous Resistance → Support: A key resistance level is now acting as potential support.
🔹 Fibonacci Golden Ratio: BTC is approaching an important Fibonacci confluence zone.
🎯 My Outlook: Bitcoin may begin forming a base around the current price and these key support levels.
⚠️ This is a potential bottom, not a confirmed reversal. Watch for confirmation before making any trading decisions.
#BTC #Bitcoin #MacroAnalysis #FibonacciSecrets #CryptoAnalysis #BinanceSquare
MSB_BTC:
btc
6
22

·
--
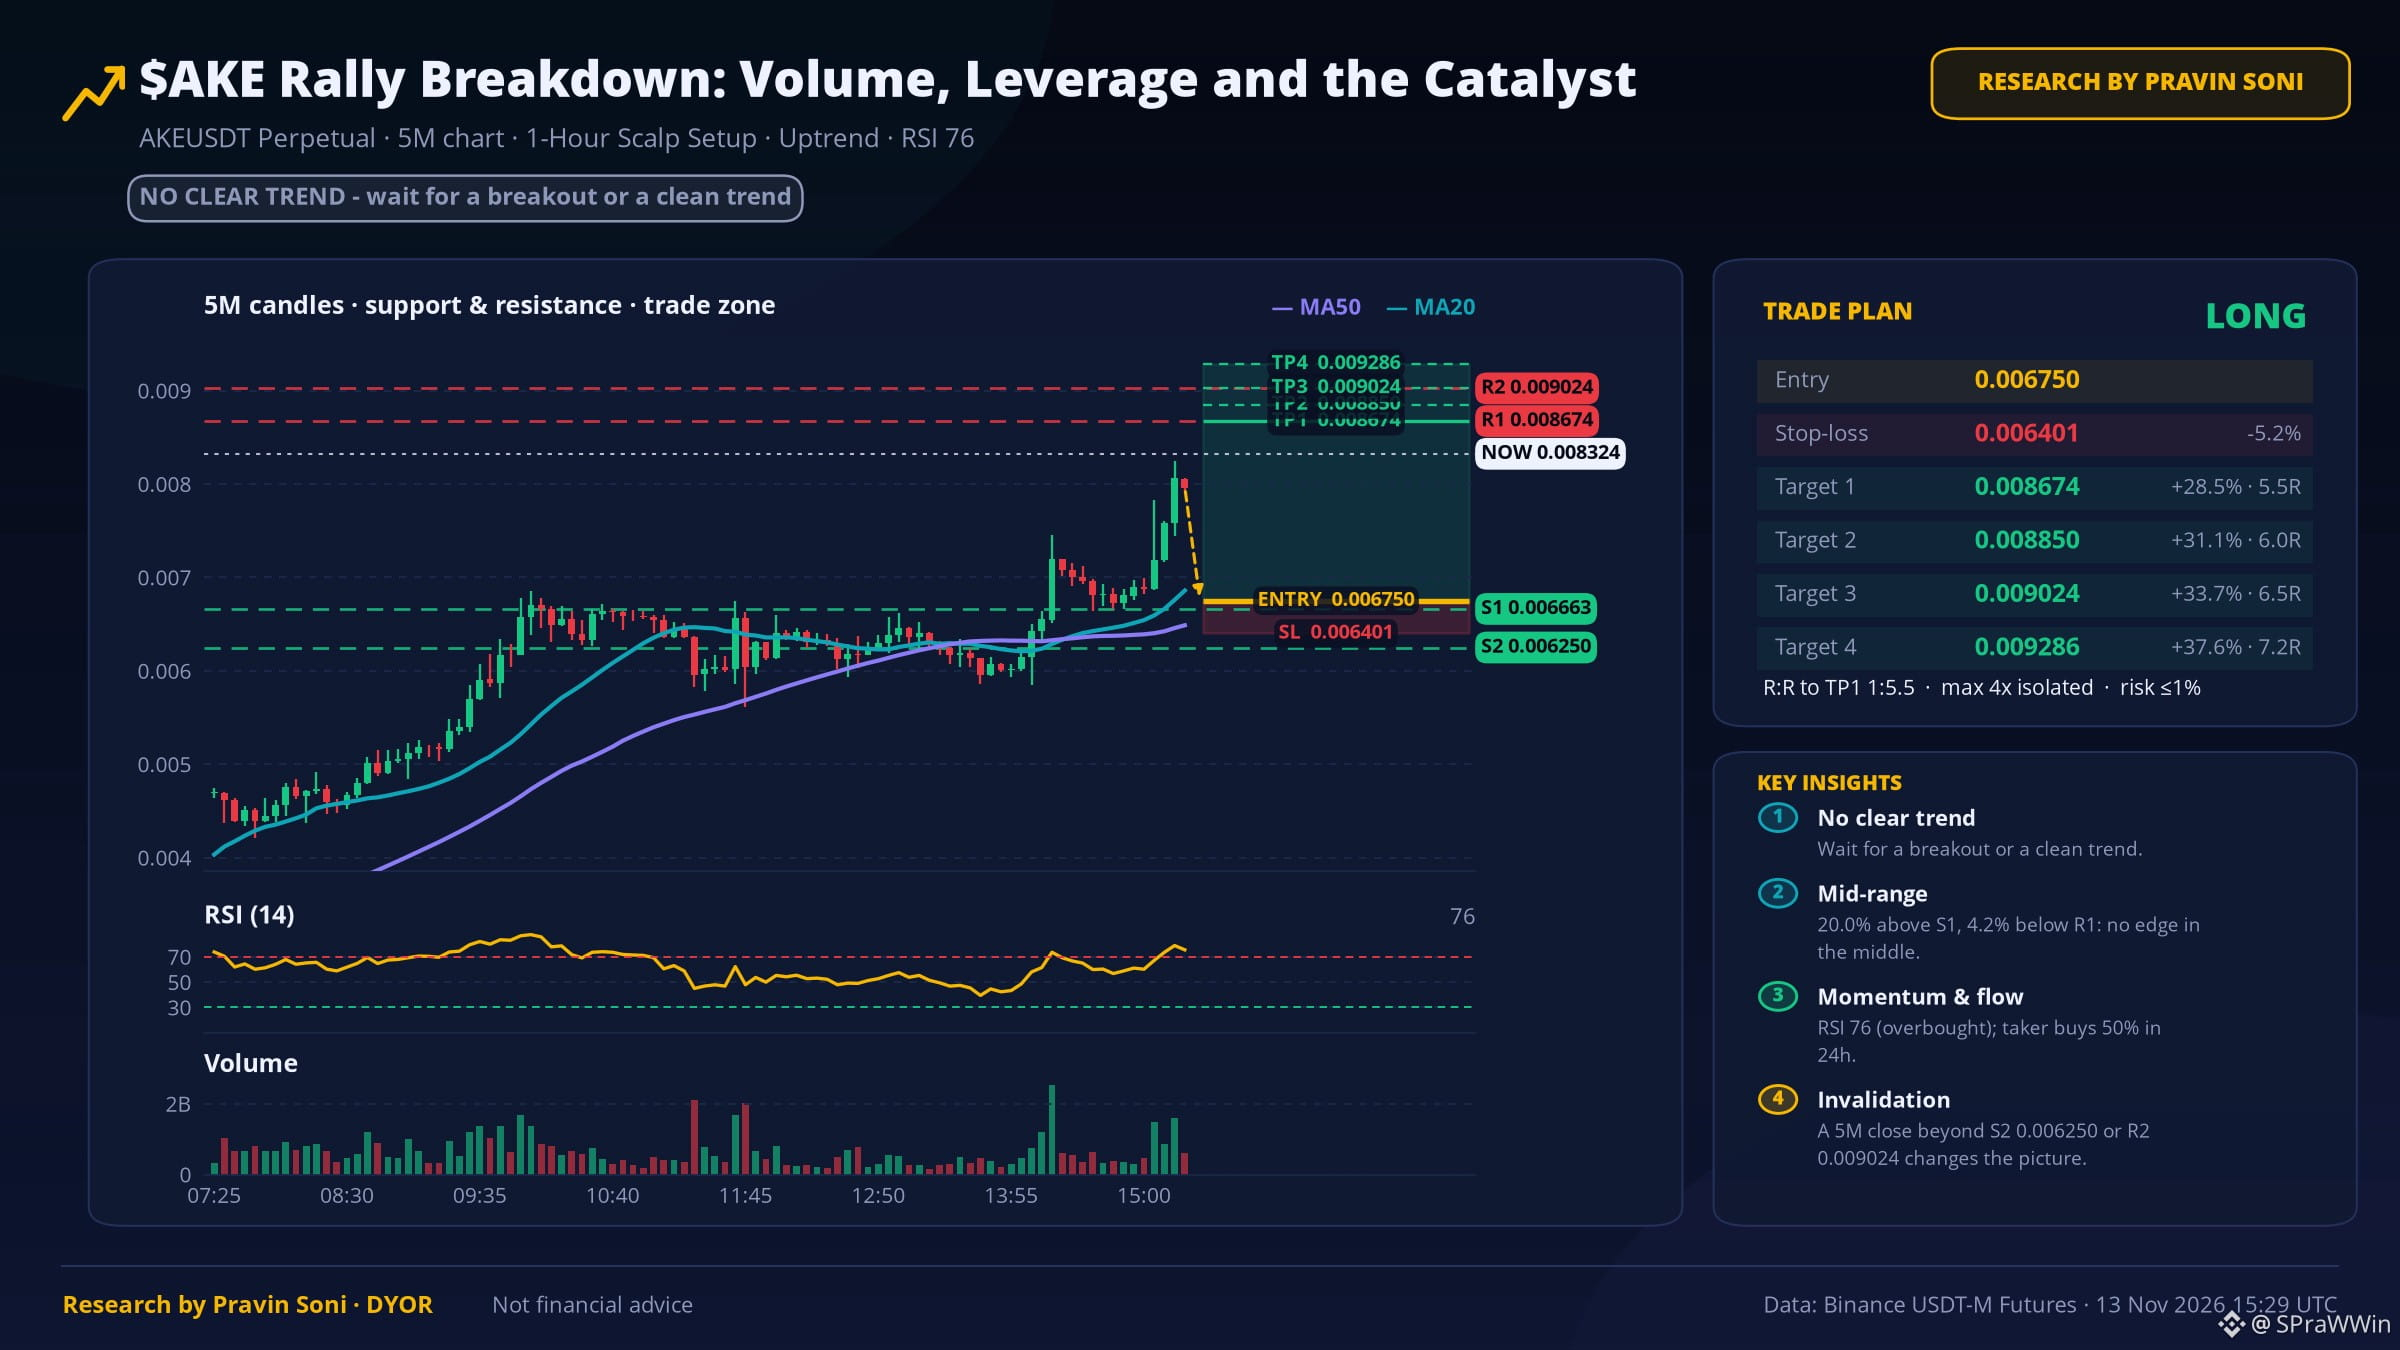
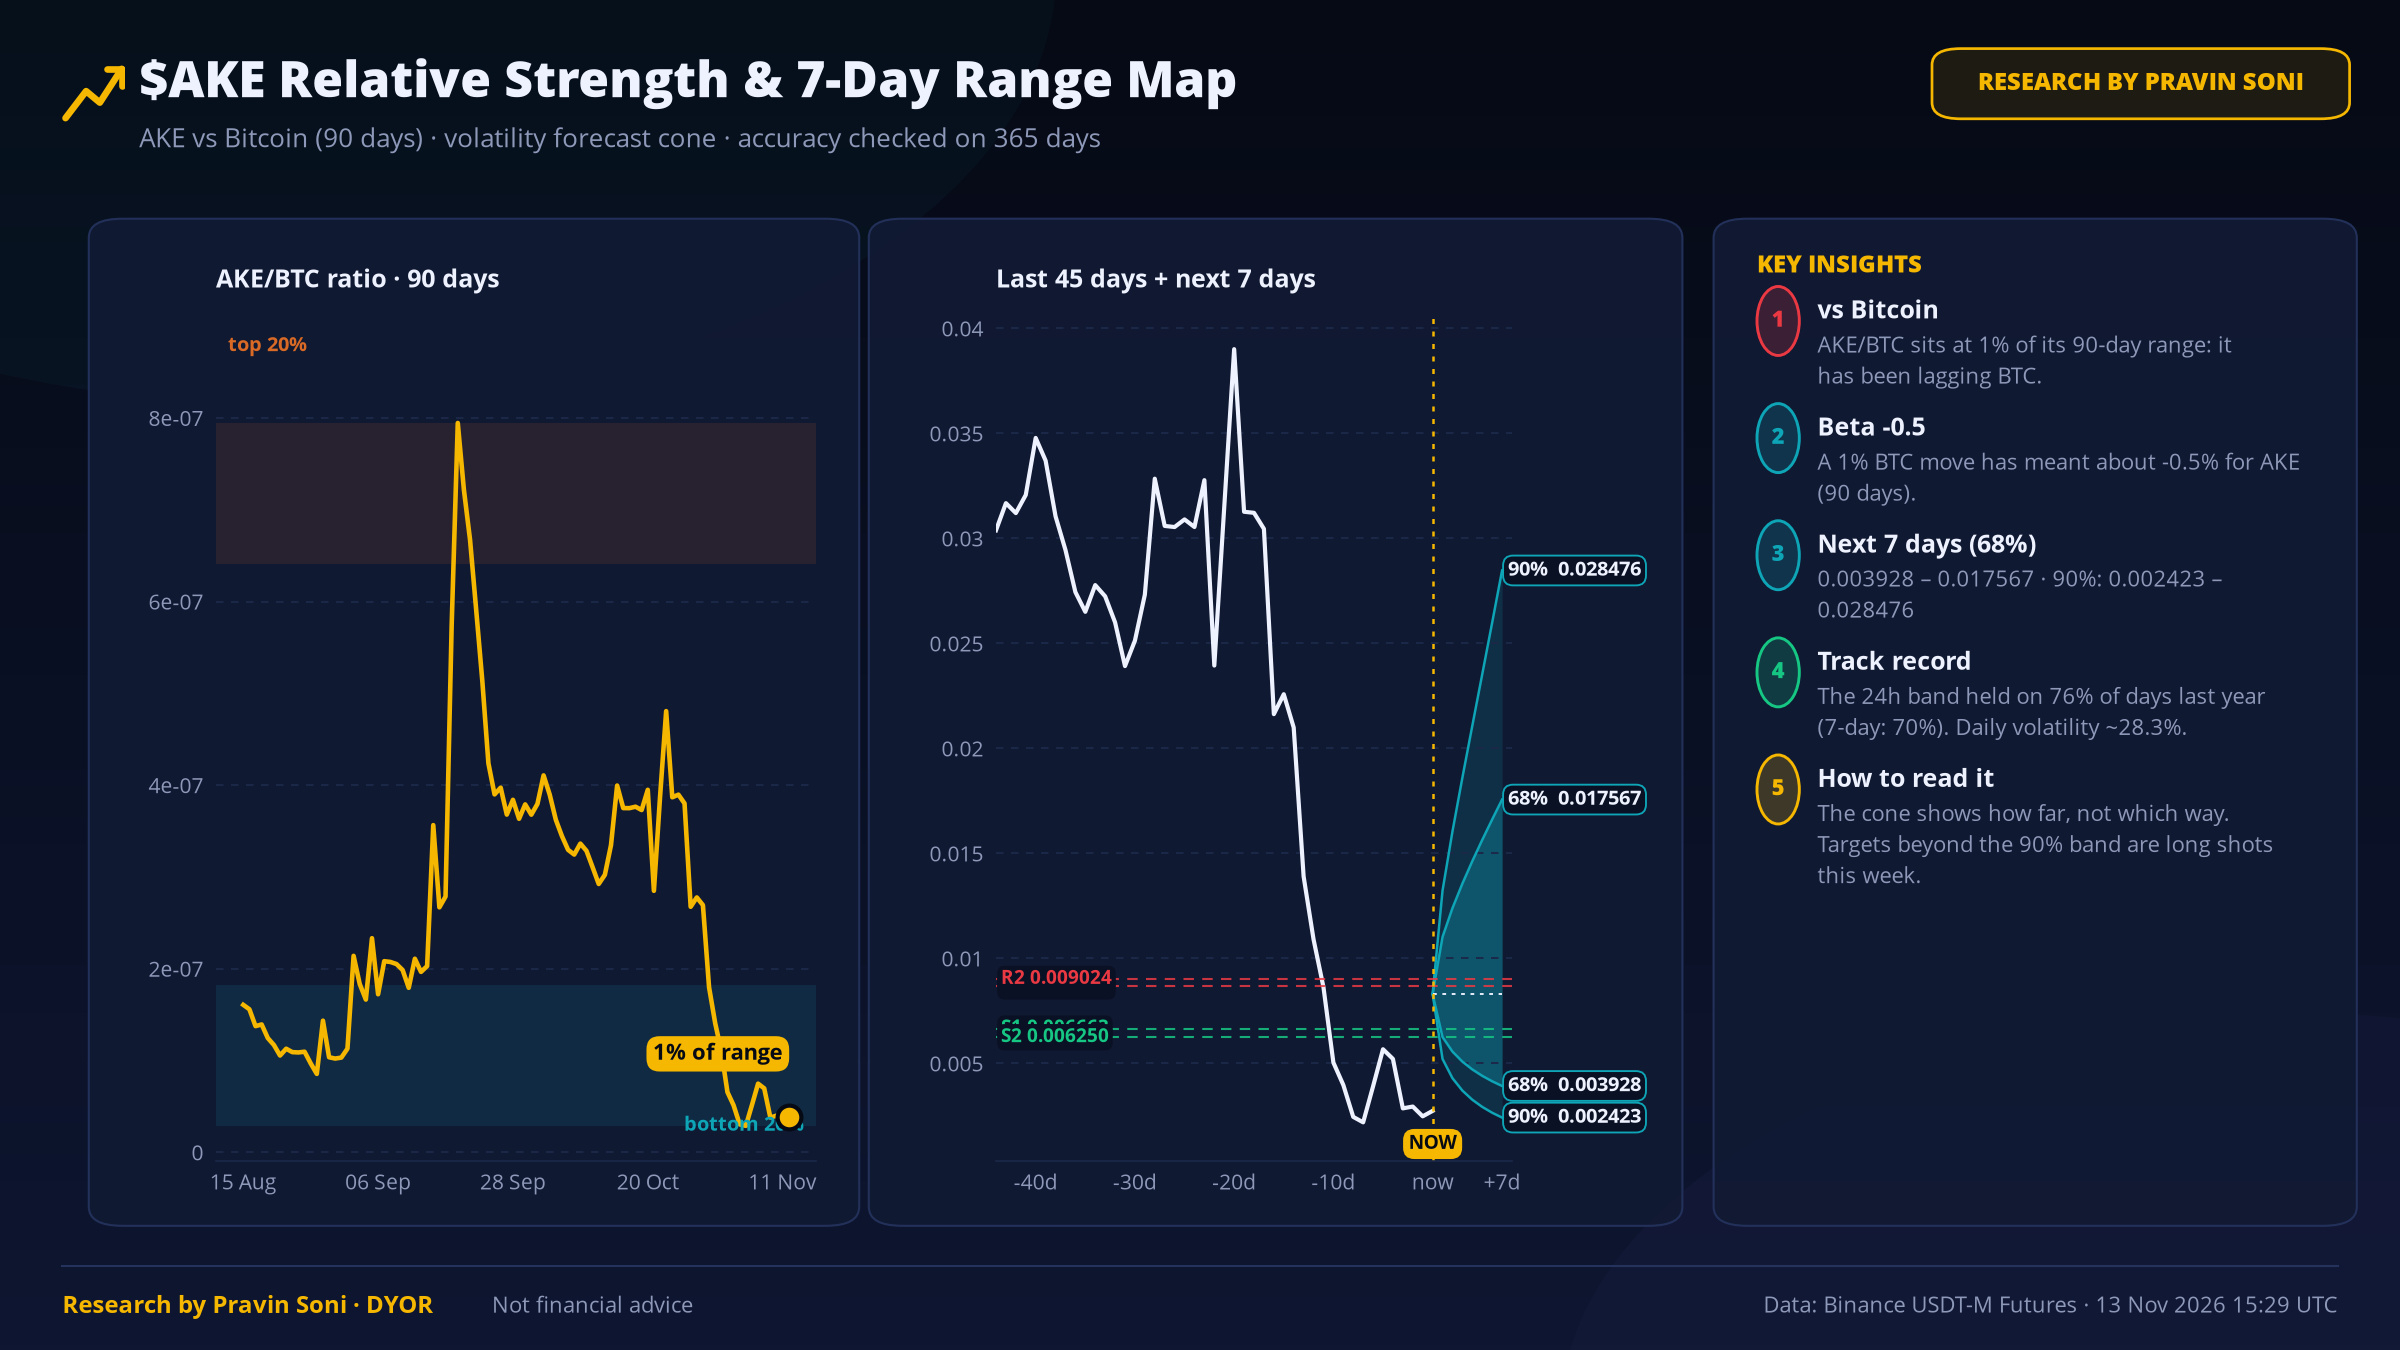
Where Next for $AKE? Entry, Stop-Loss and TP1-TP4 Mapped 🗺️
TL;DR: long idea from 0.006750, stop 0.006401 (-5.2%), first target 0.008674 (5.5R). Range play, smaller size.
🧪 Research verdict: NO CLEAR TREND - wait for a breakout or a clean trend
✅ What supports it
1️⃣ Open interest +224% in 24h
2️⃣ 95% below its 1-year high
3️⃣ Volume 4.0x its 30-day average
⚠️ Risk to the idea: lagging Bitcoin by 50% this month
🎯 The plan
⚡ Entry: 0.006750 (limit, on a retest)
⛔ Stop-loss: 0.006401 (-5.2%)
🎯 TP1: 0.008674 (+28.5% · 5.5R) · ~48% touch in 1h
🎯 TP2: 0.008850 (+31.1% · 6.0R) · ~29% touch in 1h
🎯 TP3: 0.009024 (+33.7% · 6.5R) · ~16% touch in 1h
🎯 TP4: 0.009286 (+37.6% · 7.2R) · ~6% touch in 1h
📐 Odds TP1 hits before the stop with no edge: 18%. That's why R:R must be ≥ 1.5.
🛠️ How I'd manage it
1) Limit order at entry, no chasing candles.
2) Stop goes in right after the fill and never gets widened.
3) Small partial at TP1, then trail the stop for TP2-TP4 (in our 2-year test, booking everything early cut the edge to ~0).
4) Risk ≤1% of capital, max 4x isolated.
❌ Invalid: daily close below 0.006401
Key levels: support 0.006663 / 0.006250 · resistance 0.008674 / 0.009024
📏 7-day range (68%): 0.003928 – 0.017567. This band held on 76% of days last year.
💬 Would you take this trade, or wait for a better price?
Not financial advice · Data: Binance Futures
$AKE #AKE #TradingSetup #CryptoAnalysis
⚠️ Research by Pravin Soni - DYOR
Where Next for $AKE ? Entry, Stop-Loss and TP1-TP4 Mapped 🗺️
TL;DR: long idea from 0.006750, stop 0.006401 (-5.2%), first target 0.008674 (5.5R). Range play, smaller size.
🧪 Research verdict: NO CLEAR TREND - wait for a breakout or a clean trend
✅ What supports it
1️⃣ Open interest +224% in 24h
2️⃣ 95% below its 1-year high
3️⃣ Volume 4.0x its 30-day average
⚠️ Risk to the idea: lagging Bitcoin by 50% this month
🎯 The plan
⚡ Entry: 0.006750 (limit, on a retest)
⛔ Stop-loss: 0.006401 (-5.2%)
🎯 TP1: 0.008674 (+28.5% · 5.5R) · ~48% touch in 1h
🎯 TP2: 0.008850 (+31.1% · 6.0R) · ~29% touch in 1h
🎯 TP3: 0.009024 (+33.7% · 6.5R) · ~16% touch in 1h
🎯 TP4: 0.009286 (+37.6% · 7.2R) · ~6% touch in 1h
📐 Odds TP1 hits before the stop with no edge: 18%. That's why R:R must be ≥ 1.5.
🛠️ How I'd manage it
1) Limit order at entry, no chasing candles.
2) Stop goes in right after the fill and never gets widened.
3) Small partial at TP1, then trail the stop for TP2-TP4 (in our 2-year test, booking everything early cut the edge to ~0).
4) Risk ≤1% of capital, max 4x isolated.
❌ Invalid: daily close below 0.006401
Key levels: support 0.006663 / 0.006250 · resistance 0.008674 / 0.009024
📏 7-day range (68%): 0.003928 – 0.017567. This band held on 76% of days last year.
💬 Would you take this trade, or wait for a better price?
Not financial advice · Data: Binance Futures
$AKE #AKE #TradingSetup #CryptoAnalysis
⚠️ Research by Pravin Soni - DYOR
TL;DR: long idea from 0.006750, stop 0.006401 (-5.2%), first target 0.008674 (5.5R). Range play, smaller size.
🧪 Research verdict: NO CLEAR TREND - wait for a breakout or a clean trend
✅ What supports it
1️⃣ Open interest +224% in 24h
2️⃣ 95% below its 1-year high
3️⃣ Volume 4.0x its 30-day average
⚠️ Risk to the idea: lagging Bitcoin by 50% this month
🎯 The plan
⚡ Entry: 0.006750 (limit, on a retest)
⛔ Stop-loss: 0.006401 (-5.2%)
🎯 TP1: 0.008674 (+28.5% · 5.5R) · ~48% touch in 1h
🎯 TP2: 0.008850 (+31.1% · 6.0R) · ~29% touch in 1h
🎯 TP3: 0.009024 (+33.7% · 6.5R) · ~16% touch in 1h
🎯 TP4: 0.009286 (+37.6% · 7.2R) · ~6% touch in 1h
📐 Odds TP1 hits before the stop with no edge: 18%. That's why R:R must be ≥ 1.5.
🛠️ How I'd manage it
1) Limit order at entry, no chasing candles.
2) Stop goes in right after the fill and never gets widened.
3) Small partial at TP1, then trail the stop for TP2-TP4 (in our 2-year test, booking everything early cut the edge to ~0).
4) Risk ≤1% of capital, max 4x isolated.
❌ Invalid: daily close below 0.006401
Key levels: support 0.006663 / 0.006250 · resistance 0.008674 / 0.009024
📏 7-day range (68%): 0.003928 – 0.017567. This band held on 76% of days last year.
💬 Would you take this trade, or wait for a better price?
Not financial advice · Data: Binance Futures
$AKE #AKE #TradingSetup #CryptoAnalysis
⚠️ Research by Pravin Soni - DYOR
431
·
--

Article
Bitcoin Below $70K: A Global Liquidity Shock or the Beginning of a Deeper Crypto Correction?Bitcoin has fallen below $70,000. More than $1.4 billion in leveraged positions have been liquidated. Institutional investors are pulling capital from Bitcoin ETFs, while uncertainty surrounding Nvidia and the Federal Reserve is adding pressure. But the biggest question is whether this is simply a crypto correction or a warning that global financial conditions are turning against risk assets.
November 13 has delivered another serious test for crypto investors.
Bitcoin dropped approximately 7% in 24 hours, reaching $68,408, its lowest level since August 20. Ethereum also fell below $2,000, trading near $1,921.
According to CoinGlass data cited by The Block, approximately $1.47 billion in crypto positions were liquidated within 24 hours. Long positions accounted for $1.31 billion.
This was not an ordinary market correction. It was a combination of macroeconomic pressure, institutional capital withdrawals and excessive leverage.
Three developments deserve particular attention: Federal Reserve rate expectations, Nvidia's leadership crisis and MSCI's decision to remove Strategy from its equity indexes.
Together, they reveal how closely cryptocurrency markets are connected to global financial power and capital allocation.
1. The Federal Reserve: The Biggest Macro Risk for Bitcoin
The Federal Reserve remains one of the most important forces influencing global liquidity.
On November 10, US inflation data showed that October's Consumer Price Index increased 0.4% month over month. Core CPI also increased 0.3% for the third consecutive month.
Although headline inflation slowed from September's 0.6%, underlying price pressure remains a concern.
Fed Governor Christopher Waller indicated that a 50-basis-point rate increase should be considered if core inflation remains at or above 0.3%.
Reuters reported that markets began pricing in a 12% probability of a 50-basis-point increase in December.
This is important for Bitcoin.
Higher interest rates make US Treasury securities more attractive relative to speculative investments. They also increase borrowing costs and reduce the incentive to maintain leveraged positions.
We have seen similar dynamics before.
The 2013 Taper Tantrum, the 2018 monetary tightening cycle and the 2022 rate-hiking campaign all demonstrated how quickly markets can reprice risk when liquidity conditions change.
Investor takeaway: Watch core CPI, Treasury yields and Federal Reserve communication. A change in rate expectations could influence Bitcoin more than a short-term technical breakout.
2. Geopolitics: How Middle East Tensions Reach Crypto Markets
The connection between geopolitics and cryptocurrency is often indirect, but its financial impact can be substantial.
Consider tensions involving Iran and the wider Middle East.
Any disruption to regional energy supplies can push oil prices higher. Higher energy costs can increase inflationary pressure across the global economy.
That creates a difficult situation for the Federal Reserve.
If inflation remains elevated, policymakers may have less room to reduce interest rates. This can support the US dollar and make risk-sensitive assets less attractive.
The transmission mechanism is straightforward:
Middle East tensions increase energy-market uncertainty.
Oil prices face upward pressure.
Inflation expectations become more sensitive.
The Fed may maintain tighter monetary conditions.
Institutional investors become more selective.
Bitcoin and other speculative assets face additional pressure.
This is why crypto investors should pay attention to diplomatic developments, energy markets and US monetary policy.
A reduction in geopolitical tensions could ease some of the pressure. However, investors should not assume that every diplomatic development will immediately translate into a Bitcoin rally.
3. Nvidia's Leadership Crisis: A New Risk for Global Technology Markets
Nvidia is central to the global artificial intelligence investment cycle.
Its chips power data centres, cloud computing and AI infrastructure. As a result, the company has become an important component of institutional growth portfolios.
On November 12, Nvidia officially announced that Jensen Huang had resigned as President, CEO and board member, effective immediately.
CFO Colette Kress was appointed interim CEO, while the board began searching for a permanent successor.
The circumstances surrounding the departure have attracted additional attention because of reported personal relationship allegations and investigations involving potential China-related security concerns.
These remain allegations and investigative matters, not established findings of wrongdoing. $NVDA has also stated that it expects its operations, customer commitments and product roadmap to continue without interruption.
Why does this matter to crypto?
Because institutional investors often manage technology stocks and digital assets within broader risk portfolios.
When uncertainty affects a major technology company, portfolio managers may reassess their exposure to volatile growth investments.
This does not establish Nvidia's leadership change as the direct cause of Bitcoin's decline. But it adds another source of uncertainty to an already fragile market.
Investor takeaway: Monitor Nvidia's stock performance, AI-sector sentiment and institutional risk appetite. A sustained technology-sector sell-off could create further pressure on cryptocurrencies.
4. Institutional Capital Is Moving Away From Bitcoin
Price movements show market sentiment. Capital flows reveal how investors are positioning themselves.
US spot Bitcoin ETFs have experienced consecutive sessions of net withdrawals.
According to Farside Investors data, approximately $299.8 million flowed out of US spot Bitcoin ETFs on November 11.
BlackRock's IBIT alone recorded around $269.7 million in net outflows.
The five-session withdrawal total had reached approximately $1.44 billion.
This is significant because spot Bitcoin ETFs have become an important bridge between traditional financial markets and cryptocurrency.
When investors withdraw capital, demand can weaken and selling pressure can increase.
However, ETF outflows do not necessarily mean institutions have abandoned Bitcoin permanently. They may reflect short-term risk reduction, portfolio rebalancing or profit-taking.
The important question is whether withdrawals continue or begin reversing.
Three indicators deserve attention:
Daily spot Bitcoin ETF net flows.
Futures open interest and funding rates.
Whether spot-market buying returns during price recoveries.
A recovery supported by renewed institutional demand would be more convincing than one driven by leveraged speculation.
5. MSCI's Decision on Strategy: A Different Kind of Institutional Risk
One development that deserves more attention is MSCI's decision to remove Strategy from its major equity indexes.
Strategy, formerly MicroStrategy, is one of the world's largest corporate Bitcoin holders.
MSCI announced that Strategy would be removed from its relevant equity benchmarks following its review of companies whose balance sheets are dominated by non-operating assets.
The removal is scheduled to take effect at the close of November 30.
Why does this matter?
Index-tracking funds generally adjust their holdings when benchmark constituents change.
That could create selling pressure on Strategy shares and affect the company's access to certain institutional capital channels.
The broader concern is the potential impact on its Bitcoin accumulation strategy.
However, one distinction is essential: removal from an equity index does not automatically mean Strategy must sell its Bitcoin.
The risk is indirect. It concerns equity demand, financing conditions and the sustainability of a corporate Bitcoin treasury model.
For investors, this is another reason to monitor institutional capital movements beyond spot ETF flows.
6. Why $1.47 Billion in Liquidations Matters
The liquidation event exposed a structural weakness in the crypto market.
Many traders had borrowed capital to maintain bullish positions.
When Bitcoin broke below $70,000, exchanges automatically closed positions that could no longer meet margin requirements.
Those forced closures generated additional selling pressure.
The sequence looked like this:
BTC breaks support → Long positions get liquidated → Forced selling increases → BTC falls further → More positions are liquidated.
This feedback loop explains why crypto prices can fall much faster than traditional assets during periods of excessive leverage.
There is a potential benefit.
When excessive leverage is removed, the market becomes less vulnerable to liquidation cascades.
But a leverage reset alone does not establish a market bottom. Sustainable recovery still requires stronger spot demand and improving liquidity conditions.
7. Three Cryptocurrencies Investors Should Watch
Bitcoin remains the main indicator of crypto-market liquidity. Ethereum and XRP, however, have different investment drivers.
Bitcoin (BTC): The Primary Market Signal
Bitcoin's move below $70,000 has weakened its short-term technical structure.
The reported low of $68,408 is an important reference point.
If BTC continues making lower lows, further downside remains possible.
On the recovery side, reclaiming $70,000 and holding above it would be an early indication that selling pressure is easing.
Investment approach:
Avoid chasing sudden rebounds.
Monitor ETF outflows and spot demand.
Watch whether funding rates return to healthier levels.
Consider gradual entries rather than committing the entire allocation at once.
Bitcoin's long-term investment case should be evaluated separately from its short-term price weakness.
Ethereum (ETH): Watching the $2,000 Threshold
Ethereum has fallen below $2,000, reflecting the wider reduction in risk appetite.
However, its longer-term investment narrative remains connected to smart contracts, decentralised finance, tokenisation and blockchain infrastructure.
The immediate challenge is reclaiming the $2,000 level.
A sustained recovery above it would improve market sentiment. Continued weakness would suggest that sellers remain in control.
Investment approach:
Monitor $ETH spot demand, ETF flows and its ability to recover above $2,000. Investors considering accumulation should wait for signs of stabilization rather than assuming that a lower price automatically represents value.
XRP: A Different Institutional Adoption Story
XRP is also under pressure from the broader market correction.
Its investment narrative differs from Bitcoin and Ethereum because it is influenced by payment infrastructure, institutional adoption, regulatory developments and liquidity.
This distinction matters.
Even if Bitcoin stabilizes, XRP may not immediately follow unless its own demand improves.
Investment approach:
Watch XRP's price structure, trading volume and broader market strength. A recovery supported by stronger spot buying would be more constructive than a short-lived speculative bounce.
8. The Investor's Logical Map: From Political Decisions to Portfolio Performance
Understanding how political decisions influence financial assets is essential for managing risk.
Consider the following transmission channels.
Geopolitical developments
↓
Oil prices and energy-market uncertainty
↓
Inflation expectations change
↓
Federal Reserve policy expectations shift
↓
US Treasury yields and dollar strength change
↓
Institutional capital allocation adjusts
↓
Bitcoin, Ethereum and other risk assets react
There is another important channel:
US-China technology and corporate governance uncertainty
↓
Technology-sector volatility increases
↓
Institutional portfolios reassess exposure
↓
Demand for speculative investments weakens
↓
Crypto markets face additional selling pressure
And a third channel:
MSCI index exclusion of Strategy
↓
Potential passive investment outflows from Strategy shares
↓
Equity financing conditions face pressure
↓
Questions emerge around future corporate Bitcoin accumulation
These channels demonstrate why cryptocurrency investors should follow monetary policy, international politics and institutional investment decisions alongside price charts.
9. What Comes Next? Three Scenarios
Scenario 1: Further downside
If core inflation remains persistent, Treasury yields rise, ETF withdrawals continue and Bitcoin fails to reclaim $70,000, further selling pressure could develop.
Capital preservation should take priority in this scenario.
Scenario 2: Market stabilization
If liquidation pressure declines, ETF outflows slow and Bitcoin holds above its recent low, the market could enter a consolidation phase.
This would give investors time to assess whether genuine spot demand is returning.
Scenario 3: A broader recovery
If inflation concerns ease, geopolitical tensions decline, technology stocks stabilize and institutional ETF flows turn positive, Bitcoin could regain momentum.
Ethereum and $XRP could also benefit from improving market liquidity, although their recovery patterns may differ.
None of these outcomes is guaranteed. Investors should respond to confirmed market signals rather than political headlines or speculative predictions.
Final Investment Perspective
Bitcoin's decline below $70,000 is not simply a cryptocurrency story.
It reflects a broader repricing of risk involving US monetary policy, geopolitical uncertainty, institutional capital withdrawals and instability in the technology sector.
The liquidation wave accelerated the decline, but the deeper question is whether global liquidity conditions are becoming less favourable for speculative assets.
For investors, this is a time to be selective.
Avoid excessive leverage. Do not chase every bounce. Monitor ETF flows, Treasury yields and the dollar. Consider gradual accumulation only when market conditions begin to stabilize.
The next meaningful recovery signal will not simply be a higher Bitcoin price. It will be the return of institutional demand alongside improving macroeconomic conditions.
What is your assessment?
Is Bitcoin's fall below $70,000 a temporary leverage reset before the next recovery, or are Federal Reserve policy, geopolitical risks and institutional capital withdrawals signalling a deeper correction?
Share your analysis in the comments.
{spot}(XRPUSDT)
{spot}(ETHUSDT)
{future}(NVDAUSDT)
#Geopolitics #CryptoAnalysis #NVDA #BTC #cryptouniverseofficial
Bitcoin Below $70K: A Global Liquidity Shock or the Beginning of a Deeper Crypto Correction?
Bitcoin has fallen below $70,000. More than $1.4 billion in leveraged positions have been liquidated. Institutional investors are pulling capital from Bitcoin ETFs, while uncertainty surrounding Nvidia and the Federal Reserve is adding pressure. But the biggest question is whether this is simply a crypto correction or a warning that global financial conditions are turning against risk assets.
November 13 has delivered another serious test for crypto investors.
Bitcoin dropped approximately 7% in 24 hours, reaching $68,408, its lowest level since August 20. Ethereum also fell below $2,000, trading near $1,921.
According to CoinGlass data cited by The Block, approximately $1.47 billion in crypto positions were liquidated within 24 hours. Long positions accounted for $1.31 billion.
This was not an ordinary market correction. It was a combination of macroeconomic pressure, institutional capital withdrawals and excessive leverage.
Three developments deserve particular attention: Federal Reserve rate expectations, Nvidia's leadership crisis and MSCI's decision to remove Strategy from its equity indexes.
Together, they reveal how closely cryptocurrency markets are connected to global financial power and capital allocation.
1. The Federal Reserve: The Biggest Macro Risk for Bitcoin
The Federal Reserve remains one of the most important forces influencing global liquidity.
On November 10, US inflation data showed that October's Consumer Price Index increased 0.4% month over month. Core CPI also increased 0.3% for the third consecutive month.
Although headline inflation slowed from September's 0.6%, underlying price pressure remains a concern.
Fed Governor Christopher Waller indicated that a 50-basis-point rate increase should be considered if core inflation remains at or above 0.3%.
Reuters reported that markets began pricing in a 12% probability of a 50-basis-point increase in December.
This is important for Bitcoin.
Higher interest rates make US Treasury securities more attractive relative to speculative investments. They also increase borrowing costs and reduce the incentive to maintain leveraged positions.
We have seen similar dynamics before.
The 2013 Taper Tantrum, the 2018 monetary tightening cycle and the 2022 rate-hiking campaign all demonstrated how quickly markets can reprice risk when liquidity conditions change.
Investor takeaway: Watch core CPI, Treasury yields and Federal Reserve communication. A change in rate expectations could influence Bitcoin more than a short-term technical breakout.
2. Geopolitics: How Middle East Tensions Reach Crypto Markets
The connection between geopolitics and cryptocurrency is often indirect, but its financial impact can be substantial.
Consider tensions involving Iran and the wider Middle East.
Any disruption to regional energy supplies can push oil prices higher. Higher energy costs can increase inflationary pressure across the global economy.
That creates a difficult situation for the Federal Reserve.
If inflation remains elevated, policymakers may have less room to reduce interest rates. This can support the US dollar and make risk-sensitive assets less attractive.
The transmission mechanism is straightforward:
Middle East tensions increase energy-market uncertainty.
Oil prices face upward pressure.
Inflation expectations become more sensitive.
The Fed may maintain tighter monetary conditions.
Institutional investors become more selective.
Bitcoin and other speculative assets face additional pressure.
This is why crypto investors should pay attention to diplomatic developments, energy markets and US monetary policy.
A reduction in geopolitical tensions could ease some of the pressure. However, investors should not assume that every diplomatic development will immediately translate into a Bitcoin rally.
3. Nvidia's Leadership Crisis: A New Risk for Global Technology Markets
Nvidia is central to the global artificial intelligence investment cycle.
Its chips power data centres, cloud computing and AI infrastructure. As a result, the company has become an important component of institutional growth portfolios.
On November 12, Nvidia officially announced that Jensen Huang had resigned as President, CEO and board member, effective immediately.
CFO Colette Kress was appointed interim CEO, while the board began searching for a permanent successor.
The circumstances surrounding the departure have attracted additional attention because of reported personal relationship allegations and investigations involving potential China-related security concerns.
These remain allegations and investigative matters, not established findings of wrongdoing. $NVDA has also stated that it expects its operations, customer commitments and product roadmap to continue without interruption.
Why does this matter to crypto?
Because institutional investors often manage technology stocks and digital assets within broader risk portfolios.
When uncertainty affects a major technology company, portfolio managers may reassess their exposure to volatile growth investments.
This does not establish Nvidia's leadership change as the direct cause of Bitcoin's decline. But it adds another source of uncertainty to an already fragile market.
Investor takeaway: Monitor Nvidia's stock performance, AI-sector sentiment and institutional risk appetite. A sustained technology-sector sell-off could create further pressure on cryptocurrencies.
4. Institutional Capital Is Moving Away From Bitcoin
Price movements show market sentiment. Capital flows reveal how investors are positioning themselves.
US spot Bitcoin ETFs have experienced consecutive sessions of net withdrawals.
According to Farside Investors data, approximately $299.8 million flowed out of US spot Bitcoin ETFs on November 11.
BlackRock's IBIT alone recorded around $269.7 million in net outflows.
The five-session withdrawal total had reached approximately $1.44 billion.
This is significant because spot Bitcoin ETFs have become an important bridge between traditional financial markets and cryptocurrency.
When investors withdraw capital, demand can weaken and selling pressure can increase.
However, ETF outflows do not necessarily mean institutions have abandoned Bitcoin permanently. They may reflect short-term risk reduction, portfolio rebalancing or profit-taking.
The important question is whether withdrawals continue or begin reversing.
Three indicators deserve attention:
Daily spot Bitcoin ETF net flows.
Futures open interest and funding rates.
Whether spot-market buying returns during price recoveries.
A recovery supported by renewed institutional demand would be more convincing than one driven by leveraged speculation.
5. MSCI's Decision on Strategy: A Different Kind of Institutional Risk
One development that deserves more attention is MSCI's decision to remove Strategy from its major equity indexes.
Strategy, formerly MicroStrategy, is one of the world's largest corporate Bitcoin holders.
MSCI announced that Strategy would be removed from its relevant equity benchmarks following its review of companies whose balance sheets are dominated by non-operating assets.
The removal is scheduled to take effect at the close of November 30.
Why does this matter?
Index-tracking funds generally adjust their holdings when benchmark constituents change.
That could create selling pressure on Strategy shares and affect the company's access to certain institutional capital channels.
The broader concern is the potential impact on its Bitcoin accumulation strategy.
However, one distinction is essential: removal from an equity index does not automatically mean Strategy must sell its Bitcoin.
The risk is indirect. It concerns equity demand, financing conditions and the sustainability of a corporate Bitcoin treasury model.
For investors, this is another reason to monitor institutional capital movements beyond spot ETF flows.
6. Why $1.47 Billion in Liquidations Matters
The liquidation event exposed a structural weakness in the crypto market.
Many traders had borrowed capital to maintain bullish positions.
When Bitcoin broke below $70,000, exchanges automatically closed positions that could no longer meet margin requirements.
Those forced closures generated additional selling pressure.
The sequence looked like this:
BTC breaks support → Long positions get liquidated → Forced selling increases → BTC falls further → More positions are liquidated.
This feedback loop explains why crypto prices can fall much faster than traditional assets during periods of excessive leverage.
There is a potential benefit.
When excessive leverage is removed, the market becomes less vulnerable to liquidation cascades.
But a leverage reset alone does not establish a market bottom. Sustainable recovery still requires stronger spot demand and improving liquidity conditions.
7. Three Cryptocurrencies Investors Should Watch
Bitcoin remains the main indicator of crypto-market liquidity. Ethereum and XRP, however, have different investment drivers.
Bitcoin (BTC): The Primary Market Signal
Bitcoin's move below $70,000 has weakened its short-term technical structure.
The reported low of $68,408 is an important reference point.
If BTC continues making lower lows, further downside remains possible.
On the recovery side, reclaiming $70,000 and holding above it would be an early indication that selling pressure is easing.
Investment approach:
Avoid chasing sudden rebounds.
Monitor ETF outflows and spot demand.
Watch whether funding rates return to healthier levels.
Consider gradual entries rather than committing the entire allocation at once.
Bitcoin's long-term investment case should be evaluated separately from its short-term price weakness.
Ethereum (ETH): Watching the $2,000 Threshold
Ethereum has fallen below $2,000, reflecting the wider reduction in risk appetite.
However, its longer-term investment narrative remains connected to smart contracts, decentralised finance, tokenisation and blockchain infrastructure.
The immediate challenge is reclaiming the $2,000 level.
A sustained recovery above it would improve market sentiment. Continued weakness would suggest that sellers remain in control.
Investment approach:
Monitor $ETH spot demand, ETF flows and its ability to recover above $2,000. Investors considering accumulation should wait for signs of stabilization rather than assuming that a lower price automatically represents value.
XRP: A Different Institutional Adoption Story
XRP is also under pressure from the broader market correction.
Its investment narrative differs from Bitcoin and Ethereum because it is influenced by payment infrastructure, institutional adoption, regulatory developments and liquidity.
This distinction matters.
Even if Bitcoin stabilizes, XRP may not immediately follow unless its own demand improves.
Investment approach:
Watch XRP's price structure, trading volume and broader market strength. A recovery supported by stronger spot buying would be more constructive than a short-lived speculative bounce.
8. The Investor's Logical Map: From Political Decisions to Portfolio Performance
Understanding how political decisions influence financial assets is essential for managing risk.
Consider the following transmission channels.
Geopolitical developments
↓
Oil prices and energy-market uncertainty
↓
Inflation expectations change
↓
Federal Reserve policy expectations shift
↓
US Treasury yields and dollar strength change
↓
Institutional capital allocation adjusts
↓
Bitcoin, Ethereum and other risk assets react
There is another important channel:
US-China technology and corporate governance uncertainty
↓
Technology-sector volatility increases
↓
Institutional portfolios reassess exposure
↓
Demand for speculative investments weakens
↓
Crypto markets face additional selling pressure
And a third channel:
MSCI index exclusion of Strategy
↓
Potential passive investment outflows from Strategy shares
↓
Equity financing conditions face pressure
↓
Questions emerge around future corporate Bitcoin accumulation
These channels demonstrate why cryptocurrency investors should follow monetary policy, international politics and institutional investment decisions alongside price charts.
9. What Comes Next? Three Scenarios
Scenario 1: Further downside
If core inflation remains persistent, Treasury yields rise, ETF withdrawals continue and Bitcoin fails to reclaim $70,000, further selling pressure could develop.
Capital preservation should take priority in this scenario.
Scenario 2: Market stabilization
If liquidation pressure declines, ETF outflows slow and Bitcoin holds above its recent low, the market could enter a consolidation phase.
This would give investors time to assess whether genuine spot demand is returning.
Scenario 3: A broader recovery
If inflation concerns ease, geopolitical tensions decline, technology stocks stabilize and institutional ETF flows turn positive, Bitcoin could regain momentum.
Ethereum and $XRP could also benefit from improving market liquidity, although their recovery patterns may differ.
None of these outcomes is guaranteed. Investors should respond to confirmed market signals rather than political headlines or speculative predictions.
Final Investment Perspective
Bitcoin's decline below $70,000 is not simply a cryptocurrency story.
It reflects a broader repricing of risk involving US monetary policy, geopolitical uncertainty, institutional capital withdrawals and instability in the technology sector.
The liquidation wave accelerated the decline, but the deeper question is whether global liquidity conditions are becoming less favourable for speculative assets.
For investors, this is a time to be selective.
Avoid excessive leverage. Do not chase every bounce. Monitor ETF flows, Treasury yields and the dollar. Consider gradual accumulation only when market conditions begin to stabilize.
The next meaningful recovery signal will not simply be a higher Bitcoin price. It will be the return of institutional demand alongside improving macroeconomic conditions.
What is your assessment?
Is Bitcoin's fall below $70,000 a temporary leverage reset before the next recovery, or are Federal Reserve policy, geopolitical risks and institutional capital withdrawals signalling a deeper correction?
Share your analysis in the comments.
#Geopolitics #CryptoAnalysis #NVDA #BTC #cryptouniverseofficial
November 13 has delivered another serious test for crypto investors.
Bitcoin dropped approximately 7% in 24 hours, reaching $68,408, its lowest level since August 20. Ethereum also fell below $2,000, trading near $1,921.
According to CoinGlass data cited by The Block, approximately $1.47 billion in crypto positions were liquidated within 24 hours. Long positions accounted for $1.31 billion.
This was not an ordinary market correction. It was a combination of macroeconomic pressure, institutional capital withdrawals and excessive leverage.
Three developments deserve particular attention: Federal Reserve rate expectations, Nvidia's leadership crisis and MSCI's decision to remove Strategy from its equity indexes.
Together, they reveal how closely cryptocurrency markets are connected to global financial power and capital allocation.
1. The Federal Reserve: The Biggest Macro Risk for Bitcoin
The Federal Reserve remains one of the most important forces influencing global liquidity.
On November 10, US inflation data showed that October's Consumer Price Index increased 0.4% month over month. Core CPI also increased 0.3% for the third consecutive month.
Although headline inflation slowed from September's 0.6%, underlying price pressure remains a concern.
Fed Governor Christopher Waller indicated that a 50-basis-point rate increase should be considered if core inflation remains at or above 0.3%.
Reuters reported that markets began pricing in a 12% probability of a 50-basis-point increase in December.
This is important for Bitcoin.
Higher interest rates make US Treasury securities more attractive relative to speculative investments. They also increase borrowing costs and reduce the incentive to maintain leveraged positions.
We have seen similar dynamics before.
The 2013 Taper Tantrum, the 2018 monetary tightening cycle and the 2022 rate-hiking campaign all demonstrated how quickly markets can reprice risk when liquidity conditions change.
Investor takeaway: Watch core CPI, Treasury yields and Federal Reserve communication. A change in rate expectations could influence Bitcoin more than a short-term technical breakout.
2. Geopolitics: How Middle East Tensions Reach Crypto Markets
The connection between geopolitics and cryptocurrency is often indirect, but its financial impact can be substantial.
Consider tensions involving Iran and the wider Middle East.
Any disruption to regional energy supplies can push oil prices higher. Higher energy costs can increase inflationary pressure across the global economy.
That creates a difficult situation for the Federal Reserve.
If inflation remains elevated, policymakers may have less room to reduce interest rates. This can support the US dollar and make risk-sensitive assets less attractive.
The transmission mechanism is straightforward:
Middle East tensions increase energy-market uncertainty.
Oil prices face upward pressure.
Inflation expectations become more sensitive.
The Fed may maintain tighter monetary conditions.
Institutional investors become more selective.
Bitcoin and other speculative assets face additional pressure.
This is why crypto investors should pay attention to diplomatic developments, energy markets and US monetary policy.
A reduction in geopolitical tensions could ease some of the pressure. However, investors should not assume that every diplomatic development will immediately translate into a Bitcoin rally.
3. Nvidia's Leadership Crisis: A New Risk for Global Technology Markets
Nvidia is central to the global artificial intelligence investment cycle.
Its chips power data centres, cloud computing and AI infrastructure. As a result, the company has become an important component of institutional growth portfolios.
On November 12, Nvidia officially announced that Jensen Huang had resigned as President, CEO and board member, effective immediately.
CFO Colette Kress was appointed interim CEO, while the board began searching for a permanent successor.
The circumstances surrounding the departure have attracted additional attention because of reported personal relationship allegations and investigations involving potential China-related security concerns.
These remain allegations and investigative matters, not established findings of wrongdoing. $NVDA has also stated that it expects its operations, customer commitments and product roadmap to continue without interruption.
Why does this matter to crypto?
Because institutional investors often manage technology stocks and digital assets within broader risk portfolios.
When uncertainty affects a major technology company, portfolio managers may reassess their exposure to volatile growth investments.
This does not establish Nvidia's leadership change as the direct cause of Bitcoin's decline. But it adds another source of uncertainty to an already fragile market.
Investor takeaway: Monitor Nvidia's stock performance, AI-sector sentiment and institutional risk appetite. A sustained technology-sector sell-off could create further pressure on cryptocurrencies.
4. Institutional Capital Is Moving Away From Bitcoin
Price movements show market sentiment. Capital flows reveal how investors are positioning themselves.
US spot Bitcoin ETFs have experienced consecutive sessions of net withdrawals.
According to Farside Investors data, approximately $299.8 million flowed out of US spot Bitcoin ETFs on November 11.
BlackRock's IBIT alone recorded around $269.7 million in net outflows.
The five-session withdrawal total had reached approximately $1.44 billion.
This is significant because spot Bitcoin ETFs have become an important bridge between traditional financial markets and cryptocurrency.
When investors withdraw capital, demand can weaken and selling pressure can increase.
However, ETF outflows do not necessarily mean institutions have abandoned Bitcoin permanently. They may reflect short-term risk reduction, portfolio rebalancing or profit-taking.
The important question is whether withdrawals continue or begin reversing.
Three indicators deserve attention:
Daily spot Bitcoin ETF net flows.
Futures open interest and funding rates.
Whether spot-market buying returns during price recoveries.
A recovery supported by renewed institutional demand would be more convincing than one driven by leveraged speculation.
5. MSCI's Decision on Strategy: A Different Kind of Institutional Risk
One development that deserves more attention is MSCI's decision to remove Strategy from its major equity indexes.
Strategy, formerly MicroStrategy, is one of the world's largest corporate Bitcoin holders.
MSCI announced that Strategy would be removed from its relevant equity benchmarks following its review of companies whose balance sheets are dominated by non-operating assets.
The removal is scheduled to take effect at the close of November 30.
Why does this matter?
Index-tracking funds generally adjust their holdings when benchmark constituents change.
That could create selling pressure on Strategy shares and affect the company's access to certain institutional capital channels.
The broader concern is the potential impact on its Bitcoin accumulation strategy.
However, one distinction is essential: removal from an equity index does not automatically mean Strategy must sell its Bitcoin.
The risk is indirect. It concerns equity demand, financing conditions and the sustainability of a corporate Bitcoin treasury model.
For investors, this is another reason to monitor institutional capital movements beyond spot ETF flows.
6. Why $1.47 Billion in Liquidations Matters
The liquidation event exposed a structural weakness in the crypto market.
Many traders had borrowed capital to maintain bullish positions.
When Bitcoin broke below $70,000, exchanges automatically closed positions that could no longer meet margin requirements.
Those forced closures generated additional selling pressure.
The sequence looked like this:
BTC breaks support → Long positions get liquidated → Forced selling increases → BTC falls further → More positions are liquidated.
This feedback loop explains why crypto prices can fall much faster than traditional assets during periods of excessive leverage.
There is a potential benefit.
When excessive leverage is removed, the market becomes less vulnerable to liquidation cascades.
But a leverage reset alone does not establish a market bottom. Sustainable recovery still requires stronger spot demand and improving liquidity conditions.
7. Three Cryptocurrencies Investors Should Watch
Bitcoin remains the main indicator of crypto-market liquidity. Ethereum and XRP, however, have different investment drivers.
Bitcoin (BTC): The Primary Market Signal
Bitcoin's move below $70,000 has weakened its short-term technical structure.
The reported low of $68,408 is an important reference point.
If BTC continues making lower lows, further downside remains possible.
On the recovery side, reclaiming $70,000 and holding above it would be an early indication that selling pressure is easing.
Investment approach:
Avoid chasing sudden rebounds.
Monitor ETF outflows and spot demand.
Watch whether funding rates return to healthier levels.
Consider gradual entries rather than committing the entire allocation at once.
Bitcoin's long-term investment case should be evaluated separately from its short-term price weakness.
Ethereum (ETH): Watching the $2,000 Threshold
Ethereum has fallen below $2,000, reflecting the wider reduction in risk appetite.
However, its longer-term investment narrative remains connected to smart contracts, decentralised finance, tokenisation and blockchain infrastructure.
The immediate challenge is reclaiming the $2,000 level.
A sustained recovery above it would improve market sentiment. Continued weakness would suggest that sellers remain in control.
Investment approach:
Monitor $ETH spot demand, ETF flows and its ability to recover above $2,000. Investors considering accumulation should wait for signs of stabilization rather than assuming that a lower price automatically represents value.
XRP: A Different Institutional Adoption Story
XRP is also under pressure from the broader market correction.
Its investment narrative differs from Bitcoin and Ethereum because it is influenced by payment infrastructure, institutional adoption, regulatory developments and liquidity.
This distinction matters.
Even if Bitcoin stabilizes, XRP may not immediately follow unless its own demand improves.
Investment approach:
Watch XRP's price structure, trading volume and broader market strength. A recovery supported by stronger spot buying would be more constructive than a short-lived speculative bounce.
8. The Investor's Logical Map: From Political Decisions to Portfolio Performance
Understanding how political decisions influence financial assets is essential for managing risk.
Consider the following transmission channels.
Geopolitical developments
↓
Oil prices and energy-market uncertainty
↓
Inflation expectations change
↓
Federal Reserve policy expectations shift
↓
US Treasury yields and dollar strength change
↓
Institutional capital allocation adjusts
↓
Bitcoin, Ethereum and other risk assets react
There is another important channel:
US-China technology and corporate governance uncertainty
↓
Technology-sector volatility increases
↓
Institutional portfolios reassess exposure
↓
Demand for speculative investments weakens
↓
Crypto markets face additional selling pressure
And a third channel:
MSCI index exclusion of Strategy
↓
Potential passive investment outflows from Strategy shares
↓
Equity financing conditions face pressure
↓
Questions emerge around future corporate Bitcoin accumulation
These channels demonstrate why cryptocurrency investors should follow monetary policy, international politics and institutional investment decisions alongside price charts.
9. What Comes Next? Three Scenarios
Scenario 1: Further downside
If core inflation remains persistent, Treasury yields rise, ETF withdrawals continue and Bitcoin fails to reclaim $70,000, further selling pressure could develop.
Capital preservation should take priority in this scenario.
Scenario 2: Market stabilization
If liquidation pressure declines, ETF outflows slow and Bitcoin holds above its recent low, the market could enter a consolidation phase.
This would give investors time to assess whether genuine spot demand is returning.
Scenario 3: A broader recovery
If inflation concerns ease, geopolitical tensions decline, technology stocks stabilize and institutional ETF flows turn positive, Bitcoin could regain momentum.
Ethereum and $XRP could also benefit from improving market liquidity, although their recovery patterns may differ.
None of these outcomes is guaranteed. Investors should respond to confirmed market signals rather than political headlines or speculative predictions.
Final Investment Perspective
Bitcoin's decline below $70,000 is not simply a cryptocurrency story.
It reflects a broader repricing of risk involving US monetary policy, geopolitical uncertainty, institutional capital withdrawals and instability in the technology sector.
The liquidation wave accelerated the decline, but the deeper question is whether global liquidity conditions are becoming less favourable for speculative assets.
For investors, this is a time to be selective.
Avoid excessive leverage. Do not chase every bounce. Monitor ETF flows, Treasury yields and the dollar. Consider gradual accumulation only when market conditions begin to stabilize.
The next meaningful recovery signal will not simply be a higher Bitcoin price. It will be the return of institutional demand alongside improving macroeconomic conditions.
What is your assessment?
Is Bitcoin's fall below $70,000 a temporary leverage reset before the next recovery, or are Federal Reserve policy, geopolitical risks and institutional capital withdrawals signalling a deeper correction?
Share your analysis in the comments.
#Geopolitics #CryptoAnalysis #NVDA #BTC #cryptouniverseofficial
1
259

·
--
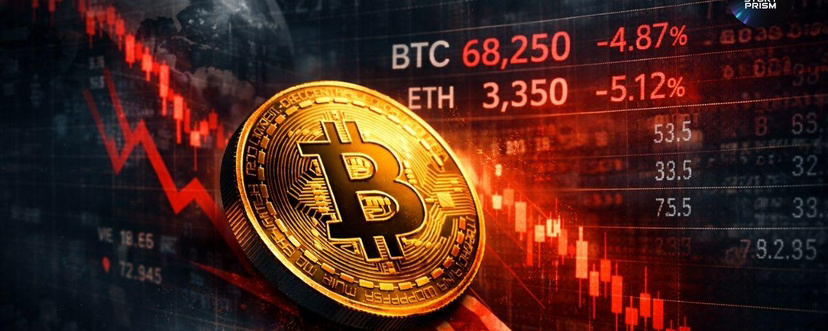
Article
Crypto Market Update – November 13, 2026The crypto market is having a rough day, and honestly, there’s a lot to watch right now.
Bitcoin has dropped to around $68,095, while $ETH is trading near $1,911. The total crypto market cap is down to approximately $2.41 trillion.
So, what’s really going on?
We’re seeing a combination of selling pressure, uncertainty around interest rates, ETF outflows and liquidations in leveraged positions.
But here’s something worth remembering: a red market doesn’t automatically mean the end of a bull run, just as a green candle doesn’t guarantee a recovery.
My thoughts on the current market:
Bitcoin needs to show strength around the $70K–$71K area. If buyers manage to push the price back above that zone, sentiment could improve.
Ethereum is also at an important point. The $1,900 level is worth watching, while a move back above $2,000 would be a positive sign.
As for altcoins, I’d be extra careful. When Bitcoin struggles, smaller cryptocurrencies can experience even bigger moves.
What am I watching now?
Bitcoin’s next move around $70K.Ethereum’s reaction near $1,900.ETF inflows and institutional activity.Whether selling pressure starts slowing down.
I’m not rushing to call the bottom. I’d rather wait for confirmation than make emotional decisions.
The market will always give us another opportunity. Protecting capital matters more than catching every move.
What’s your take?
Do you think Bitcoin will recover from here, or are we going to see another leg down?
Let’s discuss. 👇
#bitcoin #CryptoMarket #CryptoAnalysis #altcoins #trading
Crypto Market Update – November 13, 2026
The crypto market is having a rough day, and honestly, there’s a lot to watch right now.
Bitcoin has dropped to around $68,095, while $ETH is trading near $1,911. The total crypto market cap is down to approximately $2.41 trillion.
So, what’s really going on?
We’re seeing a combination of selling pressure, uncertainty around interest rates, ETF outflows and liquidations in leveraged positions.
But here’s something worth remembering: a red market doesn’t automatically mean the end of a bull run, just as a green candle doesn’t guarantee a recovery.
My thoughts on the current market:
Bitcoin needs to show strength around the $70K–$71K area. If buyers manage to push the price back above that zone, sentiment could improve.
Ethereum is also at an important point. The $1,900 level is worth watching, while a move back above $2,000 would be a positive sign.
As for altcoins, I’d be extra careful. When Bitcoin struggles, smaller cryptocurrencies can experience even bigger moves.
What am I watching now?
Bitcoin’s next move around $70K.Ethereum’s reaction near $1,900.ETF inflows and institutional activity.Whether selling pressure starts slowing down.
I’m not rushing to call the bottom. I’d rather wait for confirmation than make emotional decisions.
The market will always give us another opportunity. Protecting capital matters more than catching every move.
What’s your take?
Do you think Bitcoin will recover from here, or are we going to see another leg down?
Let’s discuss. 👇
#bitcoin #CryptoMarket #CryptoAnalysis #altcoins #trading
Bitcoin has dropped to around $68,095, while $ETH is trading near $1,911. The total crypto market cap is down to approximately $2.41 trillion.
So, what’s really going on?
We’re seeing a combination of selling pressure, uncertainty around interest rates, ETF outflows and liquidations in leveraged positions.
But here’s something worth remembering: a red market doesn’t automatically mean the end of a bull run, just as a green candle doesn’t guarantee a recovery.
My thoughts on the current market:
Bitcoin needs to show strength around the $70K–$71K area. If buyers manage to push the price back above that zone, sentiment could improve.
Ethereum is also at an important point. The $1,900 level is worth watching, while a move back above $2,000 would be a positive sign.
As for altcoins, I’d be extra careful. When Bitcoin struggles, smaller cryptocurrencies can experience even bigger moves.
What am I watching now?
Bitcoin’s next move around $70K.Ethereum’s reaction near $1,900.ETF inflows and institutional activity.Whether selling pressure starts slowing down.
I’m not rushing to call the bottom. I’d rather wait for confirmation than make emotional decisions.
The market will always give us another opportunity. Protecting capital matters more than catching every move.
What’s your take?
Do you think Bitcoin will recover from here, or are we going to see another leg down?
Let’s discuss. 👇
#bitcoin #CryptoMarket #CryptoAnalysis #altcoins #trading
62

·
--
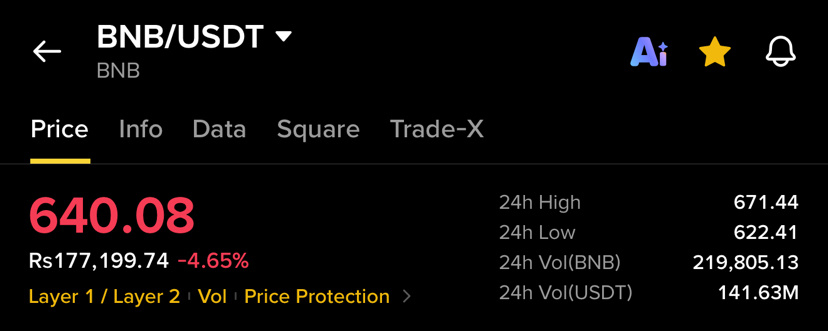
Article
BNB Price Prediction: Can Binance Coin Reclaim $650 and Target $670?BNB Price Analysis: Can Binance Coin Recover Above $650 After a Sharp Sell-Off?
BNB is currently facing significant selling pressure, with its latest price action showing a strong bearish trend on the 1-hour chart. Trading around $640.08, BNB has declined approximately 4.65% over the past 24 hours. However, after experiencing a sharp drop toward the $620–$625 region, the market is showing early signs of a recovery attempt.
The important question now is whether buyers can maintain this momentum and push BNB toward higher resistance levels.
Market Structure: Sellers Remain in Control
Looking at the 1-hour chart, BNB has been moving through a series of lower highs and lower lows. The price declined from the $685 region and gradually lost important support levels around $670 and $660.
The most significant selling activity appeared when BNB dropped below $650, followed by another sharp decline toward the $625 area.
This downward movement was accompanied by increased trading volume, indicating strong selling participation. Nevertheless, the latest candles suggest that buyers are attempting to recover some of the lost ground.
BNB has now moved back toward $640, making this an important short-term price area to monitor.
Key Support Levels
The first important support zone is around $630–$625. Buyers recently showed interest in this region, helping the price recover after the sharp decline.
Below this area, $622 is another important level, close to the displayed 24-hour low of $622.41.
If selling pressure returns and BNB breaks below this support region, further downside movement could develop.
Resistance Levels to Watch
On the upside, BNB faces its first important resistance around $645–$650.
A successful move above this zone could open the door toward $655–$660. These levels are important because the price previously consolidated around this region before the latest breakdown.
If bullish momentum strengthens and volume increases, a recovery toward $670 could become another area of interest.
However, buyers will need to overcome these resistance zones before the broader short-term structure begins to look stronger.
Volume Analysis and Market Sentiment
Trading volume tells an important story in the current BNB movement.
The chart shows noticeable volume expansion during the major red candles, suggesting that sellers were highly active during the decline.
More recently, green candles have appeared alongside the recovery from the $625 region. This indicates that buyers are attempting to enter the market.
For a stronger bullish recovery, buying volume needs to remain consistent. Without sufficient participation, the current upward movement could remain a temporary bounce rather than a confirmed trend reversal.
What Could Happen Next?
BNB is approaching an important decision zone around $640–$650.
Bullish scenario: If buyers maintain control above $630 and successfully break through $650, the price could move toward $655 and potentially $660.
Bearish scenario: If BNB faces rejection around $645–$650, sellers could regain control and push the price toward $630 and $625 again.
The next few 1-hour candles could provide important clues about the market’s direction.
Final Thoughts
BNB has experienced a considerable correction, but its recent recovery suggests that buyers are still trying to defend lower price levels.
The $625–$630 region remains important support, while $650 is the first major resistance to watch. A convincing breakout above resistance, supported by stronger volume, could improve the short-term outlook.
For now, the market needs confirmation before a stronger bullish reversal can be established.
BNB is at a crucial point: will buyers turn this recovery into a stronger upward move, or will sellers push the price lower once again?
What is your opinion? Can BNB reclaim $650 and move toward $670, or are we likely to see another correction? Share your thoughts in the comments! 🚀
#CryptoAnalysis #TechnicalAnalysis #altcoins #BNBPrice #tradingview
$BNB
{spot}(BNBUSDT)
BNB Price Prediction: Can Binance Coin Reclaim $650 and Target $670?
BNB Price Analysis: Can Binance Coin Recover Above $650 After a Sharp Sell-Off?
BNB is currently facing significant selling pressure, with its latest price action showing a strong bearish trend on the 1-hour chart. Trading around $640.08, BNB has declined approximately 4.65% over the past 24 hours. However, after experiencing a sharp drop toward the $620–$625 region, the market is showing early signs of a recovery attempt.
The important question now is whether buyers can maintain this momentum and push BNB toward higher resistance levels.
Market Structure: Sellers Remain in Control
Looking at the 1-hour chart, BNB has been moving through a series of lower highs and lower lows. The price declined from the $685 region and gradually lost important support levels around $670 and $660.
The most significant selling activity appeared when BNB dropped below $650, followed by another sharp decline toward the $625 area.
This downward movement was accompanied by increased trading volume, indicating strong selling participation. Nevertheless, the latest candles suggest that buyers are attempting to recover some of the lost ground.
BNB has now moved back toward $640, making this an important short-term price area to monitor.
Key Support Levels
The first important support zone is around $630–$625. Buyers recently showed interest in this region, helping the price recover after the sharp decline.
Below this area, $622 is another important level, close to the displayed 24-hour low of $622.41.
If selling pressure returns and BNB breaks below this support region, further downside movement could develop.
Resistance Levels to Watch
On the upside, BNB faces its first important resistance around $645–$650.
A successful move above this zone could open the door toward $655–$660. These levels are important because the price previously consolidated around this region before the latest breakdown.
If bullish momentum strengthens and volume increases, a recovery toward $670 could become another area of interest.
However, buyers will need to overcome these resistance zones before the broader short-term structure begins to look stronger.
Volume Analysis and Market Sentiment
Trading volume tells an important story in the current BNB movement.
The chart shows noticeable volume expansion during the major red candles, suggesting that sellers were highly active during the decline.
More recently, green candles have appeared alongside the recovery from the $625 region. This indicates that buyers are attempting to enter the market.
For a stronger bullish recovery, buying volume needs to remain consistent. Without sufficient participation, the current upward movement could remain a temporary bounce rather than a confirmed trend reversal.
What Could Happen Next?
BNB is approaching an important decision zone around $640–$650.
Bullish scenario: If buyers maintain control above $630 and successfully break through $650, the price could move toward $655 and potentially $660.
Bearish scenario: If BNB faces rejection around $645–$650, sellers could regain control and push the price toward $630 and $625 again.
The next few 1-hour candles could provide important clues about the market’s direction.
Final Thoughts
BNB has experienced a considerable correction, but its recent recovery suggests that buyers are still trying to defend lower price levels.
The $625–$630 region remains important support, while $650 is the first major resistance to watch. A convincing breakout above resistance, supported by stronger volume, could improve the short-term outlook.
For now, the market needs confirmation before a stronger bullish reversal can be established.
BNB is at a crucial point: will buyers turn this recovery into a stronger upward move, or will sellers push the price lower once again?
What is your opinion? Can BNB reclaim $650 and move toward $670, or are we likely to see another correction? Share your thoughts in the comments! 🚀
#CryptoAnalysis #TechnicalAnalysis #altcoins #BNBPrice #tradingview
$BNB
BNB is currently facing significant selling pressure, with its latest price action showing a strong bearish trend on the 1-hour chart. Trading around $640.08, BNB has declined approximately 4.65% over the past 24 hours. However, after experiencing a sharp drop toward the $620–$625 region, the market is showing early signs of a recovery attempt.
The important question now is whether buyers can maintain this momentum and push BNB toward higher resistance levels.
Market Structure: Sellers Remain in Control
Looking at the 1-hour chart, BNB has been moving through a series of lower highs and lower lows. The price declined from the $685 region and gradually lost important support levels around $670 and $660.
The most significant selling activity appeared when BNB dropped below $650, followed by another sharp decline toward the $625 area.
This downward movement was accompanied by increased trading volume, indicating strong selling participation. Nevertheless, the latest candles suggest that buyers are attempting to recover some of the lost ground.
BNB has now moved back toward $640, making this an important short-term price area to monitor.
Key Support Levels
The first important support zone is around $630–$625. Buyers recently showed interest in this region, helping the price recover after the sharp decline.
Below this area, $622 is another important level, close to the displayed 24-hour low of $622.41.
If selling pressure returns and BNB breaks below this support region, further downside movement could develop.
Resistance Levels to Watch
On the upside, BNB faces its first important resistance around $645–$650.
A successful move above this zone could open the door toward $655–$660. These levels are important because the price previously consolidated around this region before the latest breakdown.
If bullish momentum strengthens and volume increases, a recovery toward $670 could become another area of interest.
However, buyers will need to overcome these resistance zones before the broader short-term structure begins to look stronger.
Volume Analysis and Market Sentiment
Trading volume tells an important story in the current BNB movement.
The chart shows noticeable volume expansion during the major red candles, suggesting that sellers were highly active during the decline.
More recently, green candles have appeared alongside the recovery from the $625 region. This indicates that buyers are attempting to enter the market.
For a stronger bullish recovery, buying volume needs to remain consistent. Without sufficient participation, the current upward movement could remain a temporary bounce rather than a confirmed trend reversal.
What Could Happen Next?
BNB is approaching an important decision zone around $640–$650.
Bullish scenario: If buyers maintain control above $630 and successfully break through $650, the price could move toward $655 and potentially $660.
Bearish scenario: If BNB faces rejection around $645–$650, sellers could regain control and push the price toward $630 and $625 again.
The next few 1-hour candles could provide important clues about the market’s direction.
Final Thoughts
BNB has experienced a considerable correction, but its recent recovery suggests that buyers are still trying to defend lower price levels.
The $625–$630 region remains important support, while $650 is the first major resistance to watch. A convincing breakout above resistance, supported by stronger volume, could improve the short-term outlook.
For now, the market needs confirmation before a stronger bullish reversal can be established.
BNB is at a crucial point: will buyers turn this recovery into a stronger upward move, or will sellers push the price lower once again?
What is your opinion? Can BNB reclaim $650 and move toward $670, or are we likely to see another correction? Share your thoughts in the comments! 🚀
#CryptoAnalysis #TechnicalAnalysis #altcoins #BNBPrice #tradingview
$BNB
103

$BTC
{spot}(BTCUSDT)
📊 Bitcoin ($BTC) Market Analysis – November 13, 2026
Bitcoin faced heavy selling pressure today, breaking below the major $70,000 psychological barrier and dipping to an intraday low near $68,070 before finding minor stabilization around $68,600.
🔍 Technical & Market Breakdown:
• Trend: Short-term bearish momentum after losing the $70K support zone.
• Key Support: $68,000 (Immediate floor; losing this could open a move toward $65,500–$66,000).
• Key Resistance: $71,000 – $72,700 (Bulls need to reclaim this zone to shift momentum back to neutral/bullish).
📉 What’s Driving the Price?
1. Macro Pressure: Stronger U.S. inflation numbers pushed the U.S. Dollar Index (DXY) higher, sparking fresh Federal Reserve rate-hike fears.
2. Institutional Outflows: U.S. spot Bitcoin ETFs saw five consecutive days of net outflows totaling roughly $1.44B.
3. Leverage Flush: Over $677M in $BTC long positions were liquidated over the past 24 hours, accelerating the drop below $70K
Volatility remains high. Watching how $BTC reacts around the $68,000 support level is crucial—patience and strict risk management are key in this choppy market.
What’s your next move on $BTC—accumulating at support or waiting for confirmation above $71K? Share your chart views below! 👇
#BTC #bitcoin #CryptoAnalysis #BinancaSquare
$BTC
📊 Bitcoin ($BTC ) Market Analysis – November 13, 2026
Bitcoin faced heavy selling pressure today, breaking below the major $70,000 psychological barrier and dipping to an intraday low near $68,070 before finding minor stabilization around $68,600.
🔍 Technical & Market Breakdown:
• Trend: Short-term bearish momentum after losing the $70K support zone.
• Key Support: $68,000 (Immediate floor; losing this could open a move toward $65,500–$66,000).
• Key Resistance: $71,000 – $72,700 (Bulls need to reclaim this zone to shift momentum back to neutral/bullish).
📉 What’s Driving the Price?
1. Macro Pressure: Stronger U.S. inflation numbers pushed the U.S. Dollar Index (DXY) higher, sparking fresh Federal Reserve rate-hike fears.
2. Institutional Outflows: U.S. spot Bitcoin ETFs saw five consecutive days of net outflows totaling roughly $1.44B.
3. Leverage Flush: Over $677M in $BTC long positions were liquidated over the past 24 hours, accelerating the drop below $70K
Volatility remains high. Watching how $BTC reacts around the $68,000 support level is crucial—patience and strict risk management are key in this choppy market.
What’s your next move on $BTC —accumulating at support or waiting for confirmation above $71K? Share your chart views below! 👇
#BTC #bitcoin #CryptoAnalysis #BinancaSquare
📊 Bitcoin ($BTC ) Market Analysis – November 13, 2026
Bitcoin faced heavy selling pressure today, breaking below the major $70,000 psychological barrier and dipping to an intraday low near $68,070 before finding minor stabilization around $68,600.
🔍 Technical & Market Breakdown:
• Trend: Short-term bearish momentum after losing the $70K support zone.
• Key Support: $68,000 (Immediate floor; losing this could open a move toward $65,500–$66,000).
• Key Resistance: $71,000 – $72,700 (Bulls need to reclaim this zone to shift momentum back to neutral/bullish).
📉 What’s Driving the Price?
1. Macro Pressure: Stronger U.S. inflation numbers pushed the U.S. Dollar Index (DXY) higher, sparking fresh Federal Reserve rate-hike fears.
2. Institutional Outflows: U.S. spot Bitcoin ETFs saw five consecutive days of net outflows totaling roughly $1.44B.
3. Leverage Flush: Over $677M in $BTC long positions were liquidated over the past 24 hours, accelerating the drop below $70K
Volatility remains high. Watching how $BTC reacts around the $68,000 support level is crucial—patience and strict risk management are key in this choppy market.
What’s your next move on $BTC —accumulating at support or waiting for confirmation above $71K? Share your chart views below! 👇
#BTC #bitcoin #CryptoAnalysis #BinancaSquare
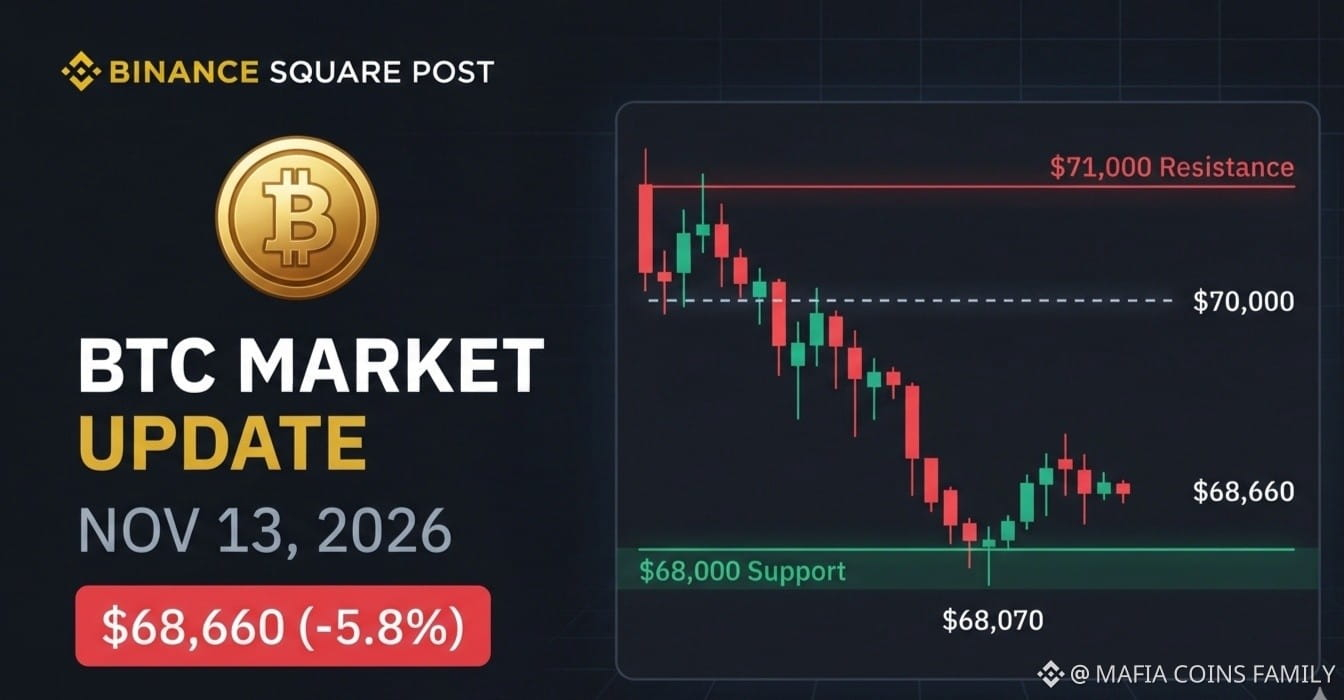
79

·
--
Bearish
🚨 $BTC and $ETH are under pressure as the crypto sell-off deepens.
Bitcoin is trading at $68,716.07, down 3.72%, with the daily low at $68,644.57. Reclaiming $70K would be an initial sign of stabilisation, but BTC remains below its 200-day moving average at $73,117.55.
Ethereum is at $1,923.67, down 4.64% and barely above its $1,923.16 daily low. The $2,000 level is the immediate recovery hurdle, with ETH also below its 50-day and 200-day averages.
In market news, CoinDesk reports a stronger U.S. dollar and more than $1.3B in 24-hour crypto liquidations as the sell-off accelerated. For now, both coins still need to show sustained buying—not just a quick bounce.
#BTC #ETH #Bitcoin #Ethereum #CryptoAnalysis
🚨 $BTC and $ETH are under pressure as the crypto sell-off deepens.
Bitcoin is trading at $68,716.07, down 3.72%, with the daily low at $68,644.57. Reclaiming $70K would be an initial sign of stabilisation, but BTC remains below its 200-day moving average at $73,117.55.
Ethereum is at $1,923.67, down 4.64% and barely above its $1,923.16 daily low. The $2,000 level is the immediate recovery hurdle, with ETH also below its 50-day and 200-day averages.
In market news, CoinDesk reports a stronger U.S. dollar and more than $1.3B in 24-hour crypto liquidations as the sell-off accelerated. For now, both coins still need to show sustained buying—not just a quick bounce.
#BTC #ETH #Bitcoin #Ethereum #CryptoAnalysis
Bitcoin is trading at $68,716.07, down 3.72%, with the daily low at $68,644.57. Reclaiming $70K would be an initial sign of stabilisation, but BTC remains below its 200-day moving average at $73,117.55.
Ethereum is at $1,923.67, down 4.64% and barely above its $1,923.16 daily low. The $2,000 level is the immediate recovery hurdle, with ETH also below its 50-day and 200-day averages.
In market news, CoinDesk reports a stronger U.S. dollar and more than $1.3B in 24-hour crypto liquidations as the sell-off accelerated. For now, both coins still need to show sustained buying—not just a quick bounce.
#BTC #ETH #Bitcoin #Ethereum #CryptoAnalysis
1
434

·
--
Bearish
📉 BTC Daily Analysis
BTC is showing bearish momentum near $68.8K.
🟢 Support: $66.5K–$67K
🔴 Next Support: $64.5K–$65K
⚡ Resistance: $70K–$72K
Holding support could trigger a bounce, while a breakdown may lead to further downside.
#BTC #Bitcoin #CryptoAnalysis #BinanceSquare #BinanceSquareTalks $BTC
{future}(BTCUSDT)
📉 BTC Daily Analysis
BTC is showing bearish momentum near $68.8K.
🟢 Support: $66.5K–$67K
🔴 Next Support: $64.5K–$65K
⚡ Resistance: $70K–$72K
Holding support could trigger a bounce, while a breakdown may lead to further downside.
#BTC #Bitcoin #CryptoAnalysis #BinanceSquare #BinanceSquareTalks $BTC
BTC is showing bearish momentum near $68.8K.
🟢 Support: $66.5K–$67K
🔴 Next Support: $64.5K–$65K
⚡ Resistance: $70K–$72K
Holding support could trigger a bounce, while a breakdown may lead to further downside.
#BTC #Bitcoin #CryptoAnalysis #BinanceSquare #BinanceSquareTalks $BTC
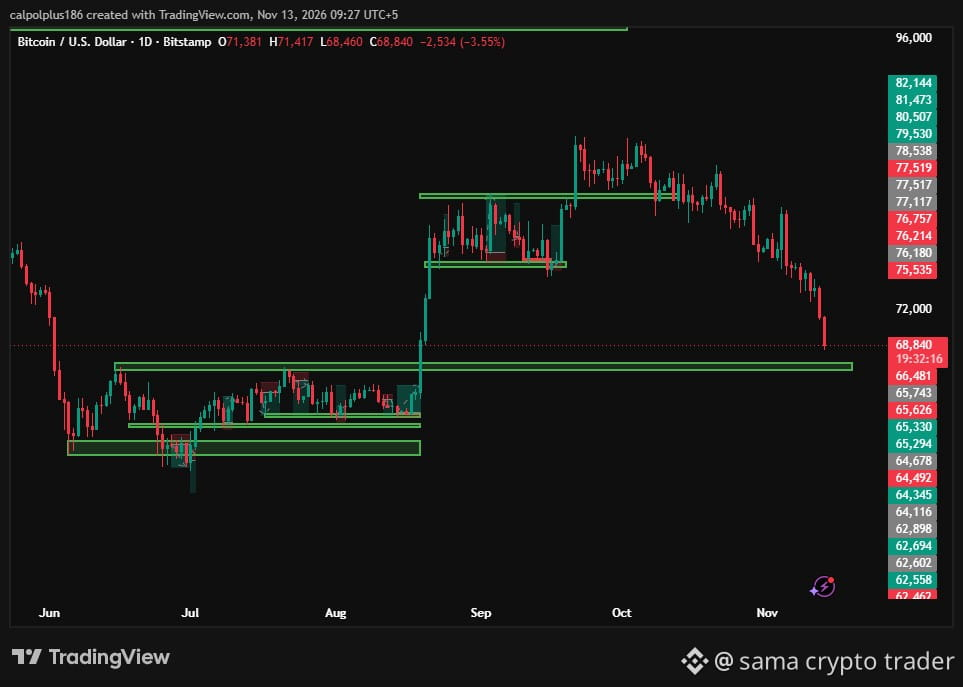
122

·
--
$BTC - BITCOIN - Dips Below $69,000*
Current Price:* ~ $68,860
24h:* -6.67%
BTC broke below the key $69,000 level today and made a low of $68,527.
From its ATH of $126,080, BTC is now down -45.4%. Panic is real, but this is where weak hands sell and smart money watches.
RSI is at 29.2 - deep oversold. A short bounce is possible, but no confirmation yet.
*Key Levels:*
Support: $65,097
If it breaks, next support: $62,440
Resistance: $71,600 - $73,800
*My View:* Don't panic sell. If BTC holds $65K, bounce to $71K is possible. If it breaks, wait - don't catch a falling knife.
#bitcoin #BTC #Crypto #CryptoAnalysis #WhatWillDriveCryptoandStocks’NextRebound?
{spot}(BTCUSDT)
$BTC - BITCOIN - Dips Below $69,000*
Current Price:* ~ $68,860
24h:* -6.67%
BTC broke below the key $69,000 level today and made a low of $68,527.
From its ATH of $126,080, BTC is now down -45.4%. Panic is real, but this is where weak hands sell and smart money watches.
RSI is at 29.2 - deep oversold. A short bounce is possible, but no confirmation yet.
*Key Levels:*
Support: $65,097
If it breaks, next support: $62,440
Resistance: $71,600 - $73,800
*My View:* Don't panic sell. If BTC holds $65K, bounce to $71K is possible. If it breaks, wait - don't catch a falling knife.
#bitcoin #BTC #Crypto #CryptoAnalysis #WhatWillDriveCryptoandStocks’NextRebound?
Current Price:* ~ $68,860
24h:* -6.67%
BTC broke below the key $69,000 level today and made a low of $68,527.
From its ATH of $126,080, BTC is now down -45.4%. Panic is real, but this is where weak hands sell and smart money watches.
RSI is at 29.2 - deep oversold. A short bounce is possible, but no confirmation yet.
*Key Levels:*
Support: $65,097
If it breaks, next support: $62,440
Resistance: $71,600 - $73,800
*My View:* Don't panic sell. If BTC holds $65K, bounce to $71K is possible. If it breaks, wait - don't catch a falling knife.
#bitcoin #BTC #Crypto #CryptoAnalysis #WhatWillDriveCryptoandStocks’NextRebound?
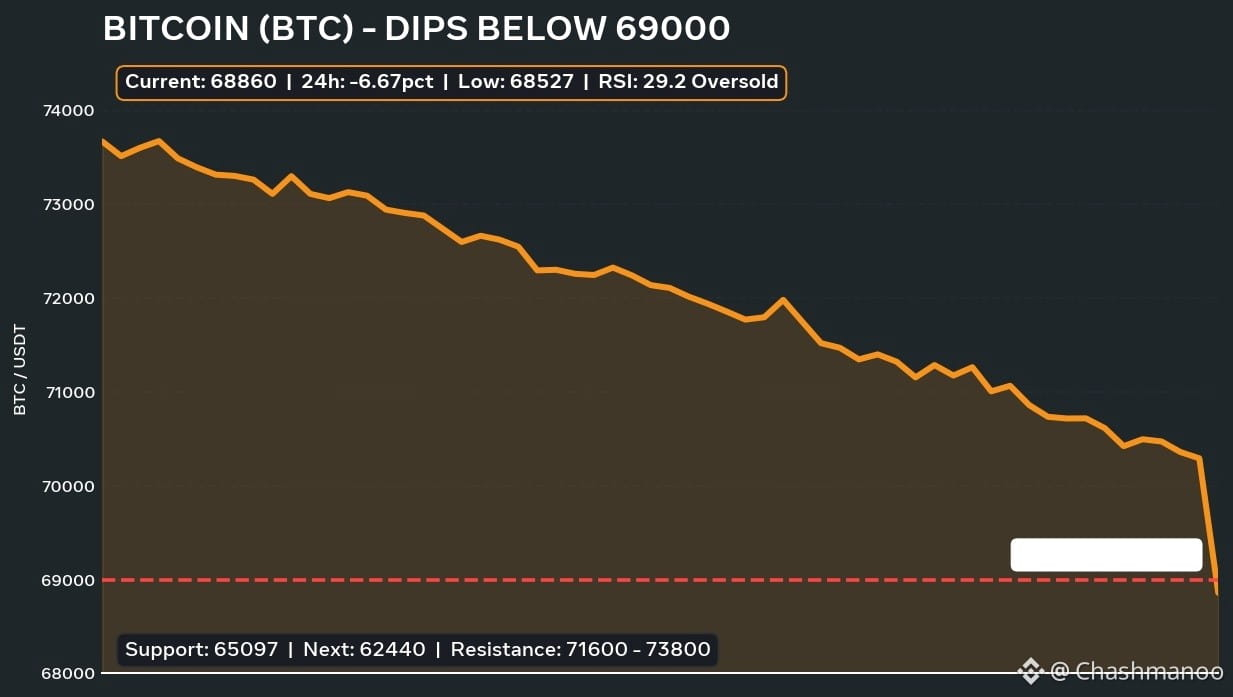
1
142

·
--
Bullish
$BTC
{future}(BTCUSDT)
BTC is sitting at the bottom of its descending channel on the 4H chart.
Price has tapped the demand zone around $71K.
I'm expecting a bounce from here, a breakout from the channel, and a move toward $82K.
#BTC #Bitcoin #CryptoAnalysis #TechnicalAnalysis
$BTC
BTC is sitting at the bottom of its descending channel on the 4H chart.
Price has tapped the demand zone around $71K.
I'm expecting a bounce from here, a breakout from the channel, and a move toward $82K.
#BTC #Bitcoin #CryptoAnalysis #TechnicalAnalysis
BTC is sitting at the bottom of its descending channel on the 4H chart.
Price has tapped the demand zone around $71K.
I'm expecting a bounce from here, a breakout from the channel, and a move toward $82K.
#BTC #Bitcoin #CryptoAnalysis #TechnicalAnalysis
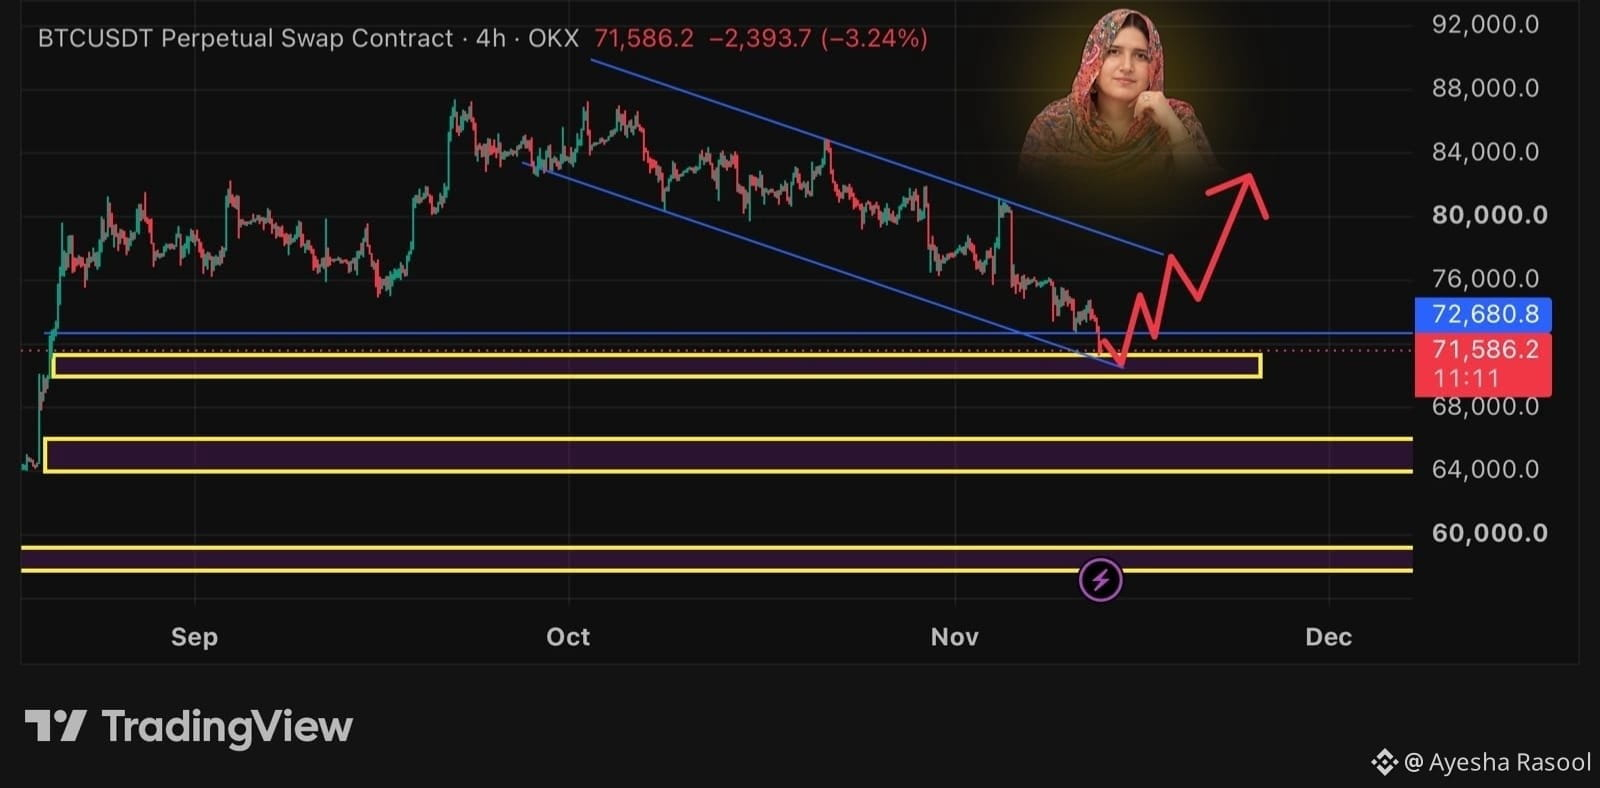
1
73

·
--
Bullish
$BTC
{future}(BTCUSDT)
dropped from $74.8K to a low of $71,218.
Both futures and spot CVD are falling hard.
Futures CVD: -2.94B
Spot CVD: -92.53M
Bear divergences printed at the highs before the drop. Sellers are still in control.
#BTC #Bitcoin #CVD #CryptoAnalysis
$BTC
dropped from $74.8K to a low of $71,218.
Both futures and spot CVD are falling hard.
Futures CVD: -2.94B
Spot CVD: -92.53M
Bear divergences printed at the highs before the drop. Sellers are still in control.
#BTC #Bitcoin #CVD #CryptoAnalysis
dropped from $74.8K to a low of $71,218.
Both futures and spot CVD are falling hard.
Futures CVD: -2.94B
Spot CVD: -92.53M
Bear divergences printed at the highs before the drop. Sellers are still in control.
#BTC #Bitcoin #CVD #CryptoAnalysis
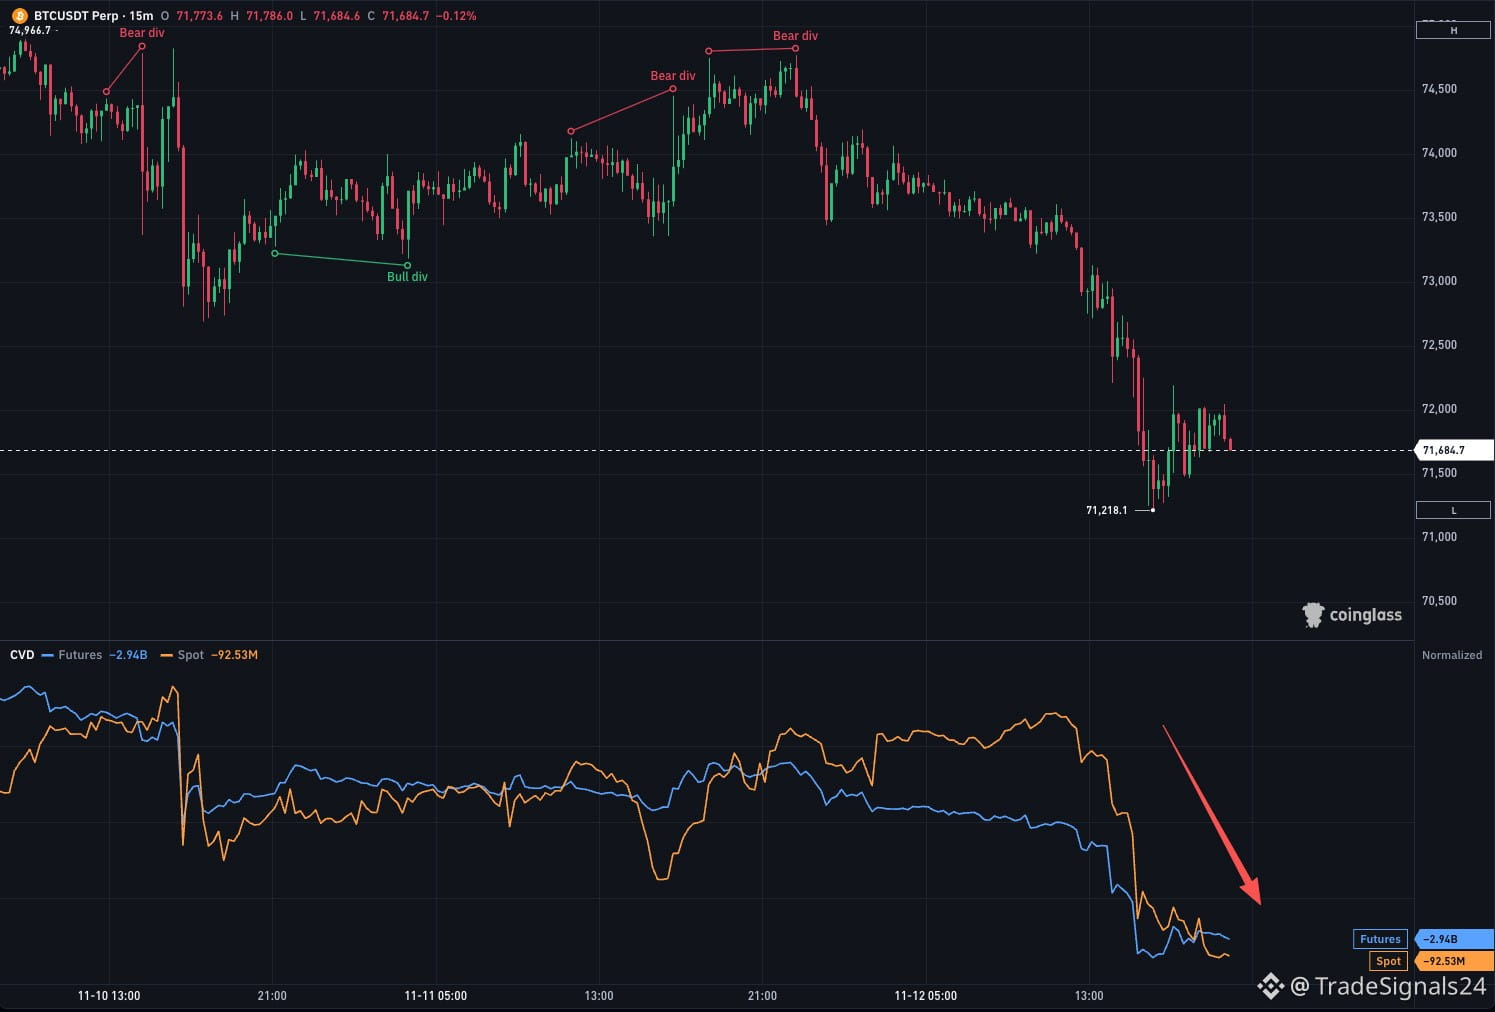
4
Log in to explore more content
Join global crypto users on Binance Square
⚡️ Get latest and useful information about crypto.
💬 Trusted by the world’s largest crypto exchange.
👍 Discover real insights from verified creators.
Email / Phone number
Trending Topics
1
#WhoWillSucceedJensenHuangatNvidia?
87,627 views
1,149 Discussing
2
#WhatWillDriveCryptoandStocks’NextRebound?
443,192 views
3,055 Discussing
3
#BitcoinActiveSupplyInProfitDropsBelow45%
26,051 views
365 Discussing
4
#KavaSaysAbnormalActivityLimitedToKavaLend
10,638 views
182 Discussing
5
#USSpotXRPETFsSeeLargestWeeklyOutflowIn8Months
9,738 views
175 Discussing
6
#USPPIMissMayEaseBTCPressure
213,404 views
2,065 Discussing
7
#WORPTLetsTouristsConvertCryptoToThaiBaht
2,831 views
51 Discussing
8
#TONStrategyReports$23.97MQ3NetLoss
3,714 views
41 Discussing
9
#PolkadotCommunityApprovesNewStrategyWith97%Vote
19,491 views
249 Discussing
10
#dYdXPlansV9.9UpgradeToShiftUSDCToInjective
12,350 views
200 Discussing