
#trading
trading
117.8M views
768,460 Discussing
Hot
Latest

🚨 $AKE: A Massive Rally, But Is It Running Out of Steam? 📉
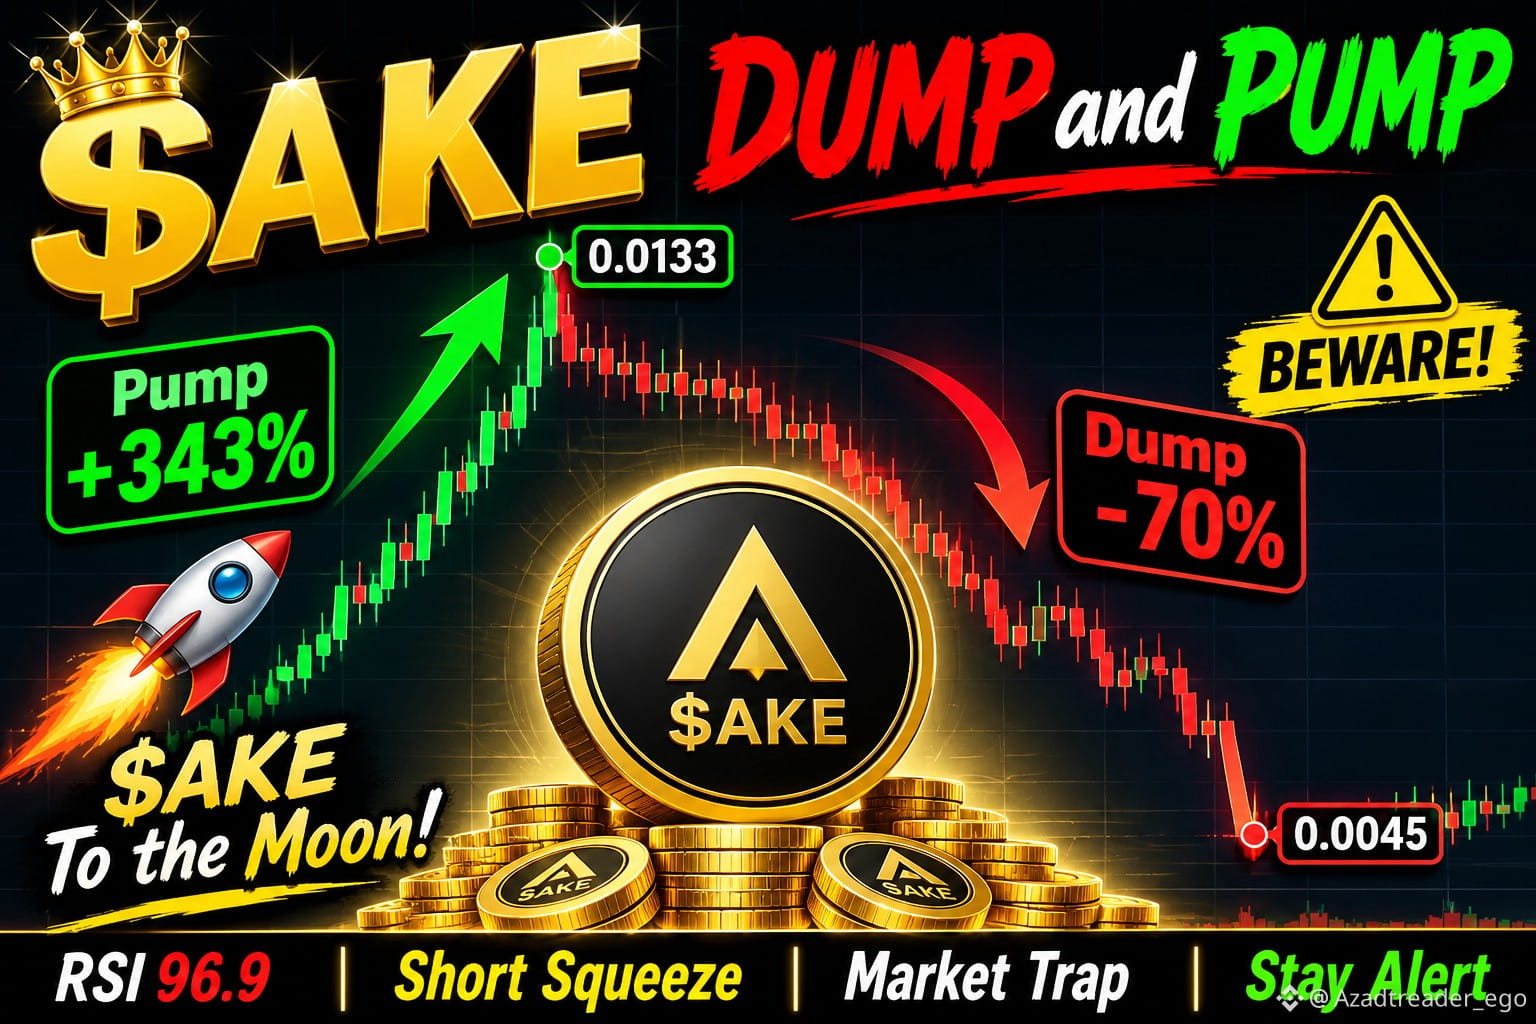
$AKE has made an impressive move, climbing from $0.0018 to $0.0133 in a relatively short period. With RSI reaching 96.9, the market is showing extremely overheated momentum.
After such a sharp rally, traders should be cautious about entering at elevated prices. A cooling phase or price correction could be possible.
👀 Important Levels to Watch:
- $0.0070 — Key EMA7 support area.
- $0.0045 — Potential downside reference level.
If buyers fail to defend the $0.0070 zone, further weakness could bring $0.0045 into focus.
⚠️ Don't let FOMO control your decisions. Watch price action, manage risk, and wait for confirmation before making a move.
Is $AKE preparing for another rally or heading toward a correction? 🚀
#AKE #CryptoMarket #altcoins #CryptoAnalysis #Trading
🚨 $AKE: A Massive Rally, But Is It Running Out of Steam? 📉
$AKE has made an impressive move, climbing from $0.0018 to $0.0133 in a relatively short period. With RSI reaching 96.9, the market is showing extremely overheated momentum.
After such a sharp rally, traders should be cautious about entering at elevated prices. A cooling phase or price correction could be possible.
👀 Important Levels to Watch:
- $0.0070 — Key EMA7 support area.
- $0.0045 — Potential downside reference level.
If buyers fail to defend the $0.0070 zone, further weakness could bring $0.0045 into focus.
⚠️ Don't let FOMO control your decisions. Watch price action, manage risk, and wait for confirmation before making a move.
Is $AKE preparing for another rally or heading toward a correction? 🚀
#AKE #CryptoMarket #altcoins #CryptoAnalysis #Trading
$AKE has made an impressive move, climbing from $0.0018 to $0.0133 in a relatively short period. With RSI reaching 96.9, the market is showing extremely overheated momentum.
After such a sharp rally, traders should be cautious about entering at elevated prices. A cooling phase or price correction could be possible.
👀 Important Levels to Watch:
- $0.0070 — Key EMA7 support area.
- $0.0045 — Potential downside reference level.
If buyers fail to defend the $0.0070 zone, further weakness could bring $0.0045 into focus.
⚠️ Don't let FOMO control your decisions. Watch price action, manage risk, and wait for confirmation before making a move.
Is $AKE preparing for another rally or heading toward a correction? 🚀
#AKE #CryptoMarket #altcoins #CryptoAnalysis #Trading
963

ZEC Respecting the MA100 Again 🚀Take a look at the $ZEC/USDT chart. Every time price has touched the MA100 (the red line), buyers stepped in and pushed it higher. This has happened more than once, and the MA100 has acted as strong dynamic support throughout this trend.
📊 What the chart shows:
Price is back at the MA100 after a pullback of about 10%
The RSI (14) has cooled to around 37, away from the overbought zone, which gives room for another move up
Past bounces from this level led to strong continuation
🎯 My target: $3,000 if the MA100 holds and momentum returns.
⚠️ Keep in mind: If price closes clearly below the MA100, this setup becomes weaker. Always use a stop-loss and manage your risk.
Keep learning and exploring. 📚
This is my personal analysis, not financial advice. Do your own research (DYOR).
#ZEC #BinanceSquare #Trading #TechnicalAnalysis
ZEC Respecting the MA100 Again 🚀
Take a look at the $ZEC/USDT chart. Every time price has touched the MA100 (the red line), buyers stepped in and pushed it higher. This has happened more than once, and the MA100 has acted as strong dynamic support throughout this trend.
📊 What the chart shows:
Price is back at the MA100 after a pullback of about 10%
The RSI (14) has cooled to around 37, away from the overbought zone, which gives room for another move up
Past bounces from this level led to strong continuation
🎯 My target: $3,000 if the MA100 holds and momentum returns.
⚠️ Keep in mind: If price closes clearly below the MA100, this setup becomes weaker. Always use a stop-loss and manage your risk.
Keep learning and exploring. 📚
This is my personal analysis, not financial advice. Do your own research (DYOR).
#ZEC #BinanceSquare #Trading #TechnicalAnalysis
📊 What the chart shows:
Price is back at the MA100 after a pullback of about 10%
The RSI (14) has cooled to around 37, away from the overbought zone, which gives room for another move up
Past bounces from this level led to strong continuation
🎯 My target: $3,000 if the MA100 holds and momentum returns.
⚠️ Keep in mind: If price closes clearly below the MA100, this setup becomes weaker. Always use a stop-loss and manage your risk.
Keep learning and exploring. 📚
This is my personal analysis, not financial advice. Do your own research (DYOR).
#ZEC #BinanceSquare #Trading #TechnicalAnalysis
548

·
--
Bullish
30D trade $SOL 152.2 USDT
🩸 $SOL : CAPITULATION. THE PANIC SELLING IS OVER. I AM BUYING. 🩸
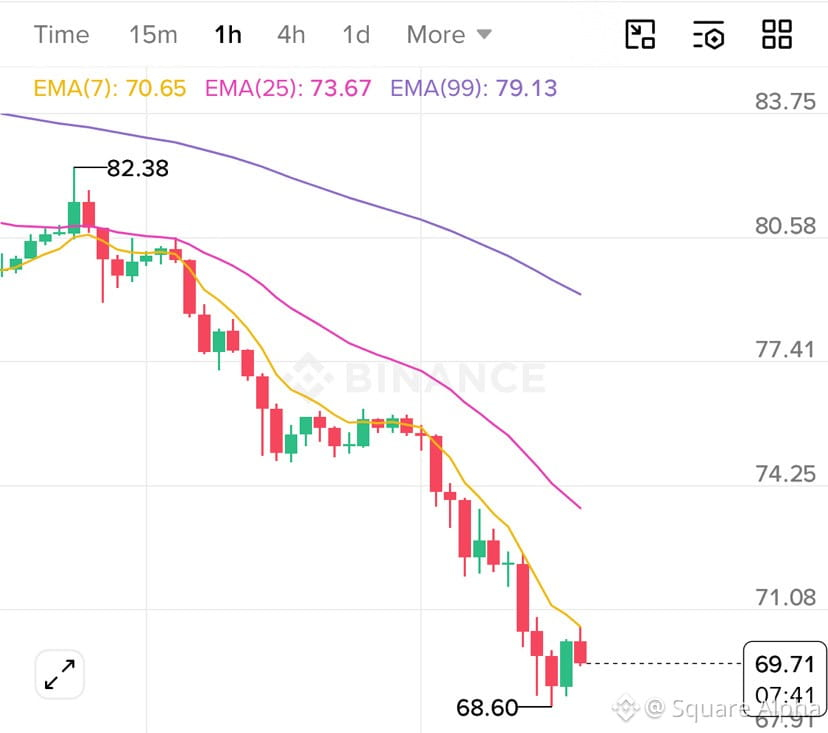
The brutal flush to 68.60 just wiped out the weak hands.
The 1H RSI is screaming oversold at 24. A violent bounce is loading.
Going LONG right here at 69.71.
Look at the momentum shift. Sellers are completely exhausted. We are seeing the first green candle print off the bottom, and the RSI is practically pinned to the floor. This gives us a massive runway for a mean-reversion squeeze back to the moving averages.
THE TRADE PLAN:
🎯 Target 1: 70.65 (EMA 7) - We are reclaiming this first.
🎯 Target 2: 73.67 (EMA 25)
🛑 Hard Stop: 68.50 (If we break the low, I'm out. No emotions, just execution.)
Trade the chart, not your feelings. The bounce is live. Who is taking this trade with me? 👇
$SOL #solana #trading #LongSetup
(NFA. Always manage your risk.)
{spot}(SOLUSDT)
🩸 $SOL : CAPITULATION. THE PANIC SELLING IS OVER. I AM BUYING. 🩸
The brutal flush to 68.60 just wiped out the weak hands.
The 1H RSI is screaming oversold at 24. A violent bounce is loading.
Going LONG right here at 69.71.
Look at the momentum shift. Sellers are completely exhausted. We are seeing the first green candle print off the bottom, and the RSI is practically pinned to the floor. This gives us a massive runway for a mean-reversion squeeze back to the moving averages.
THE TRADE PLAN:
🎯 Target 1: 70.65 (EMA 7) - We are reclaiming this first.
🎯 Target 2: 73.67 (EMA 25)
🛑 Hard Stop: 68.50 (If we break the low, I'm out. No emotions, just execution.)
Trade the chart, not your feelings. The bounce is live. Who is taking this trade with me? 👇
$SOL #solana #trading #LongSetup
(NFA. Always manage your risk.)
The brutal flush to 68.60 just wiped out the weak hands.
The 1H RSI is screaming oversold at 24. A violent bounce is loading.
Going LONG right here at 69.71.
Look at the momentum shift. Sellers are completely exhausted. We are seeing the first green candle print off the bottom, and the RSI is practically pinned to the floor. This gives us a massive runway for a mean-reversion squeeze back to the moving averages.
THE TRADE PLAN:
🎯 Target 1: 70.65 (EMA 7) - We are reclaiming this first.
🎯 Target 2: 73.67 (EMA 25)
🛑 Hard Stop: 68.50 (If we break the low, I'm out. No emotions, just execution.)
Trade the chart, not your feelings. The bounce is live. Who is taking this trade with me? 👇
$SOL #solana #trading #LongSetup
(NFA. Always manage your risk.)
700

🚨 #GOLD IS APPROACHING A MAJOR DECISION ZONE! 🔥
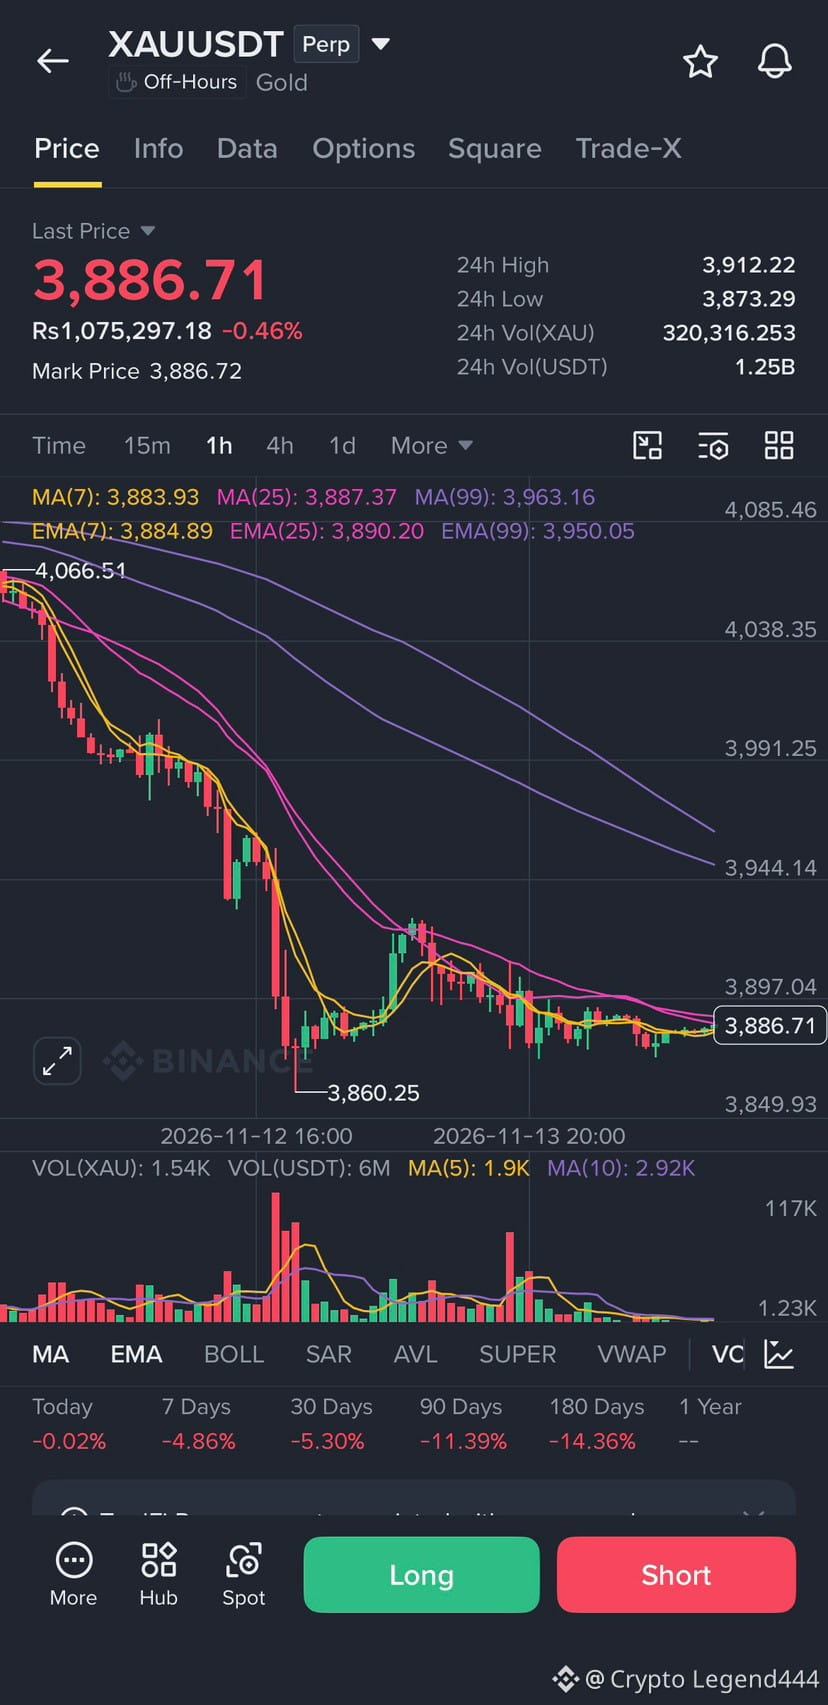
$XAUT is testing a key support area around $3,850–$3,900.
A potential double-bottom pattern is forming. If buyers hold this zone, GOLD could rebound towards $4,250–$4,300.
A confirmed breakout above resistance could push price towards $4,700.
But if support fails, further downside could follow.
👀 Will GOLD bounce strongly or break below support?
#GOLD #XAUUSD #trading #Crypto
{future}(XAUTUSDT)
🚨 #GOLD IS APPROACHING A MAJOR DECISION ZONE! 🔥
$XAUT is testing a key support area around $3,850–$3,900.
A potential double-bottom pattern is forming. If buyers hold this zone, GOLD could rebound towards $4,250–$4,300.
A confirmed breakout above resistance could push price towards $4,700.
But if support fails, further downside could follow.
👀 Will GOLD bounce strongly or break below support?
#GOLD #XAUUSD #trading #Crypto
$XAUT is testing a key support area around $3,850–$3,900.
A potential double-bottom pattern is forming. If buyers hold this zone, GOLD could rebound towards $4,250–$4,300.
A confirmed breakout above resistance could push price towards $4,700.
But if support fails, further downside could follow.
👀 Will GOLD bounce strongly or break below support?
#GOLD #XAUUSD #trading #Crypto
1
791

·
--
Bullish
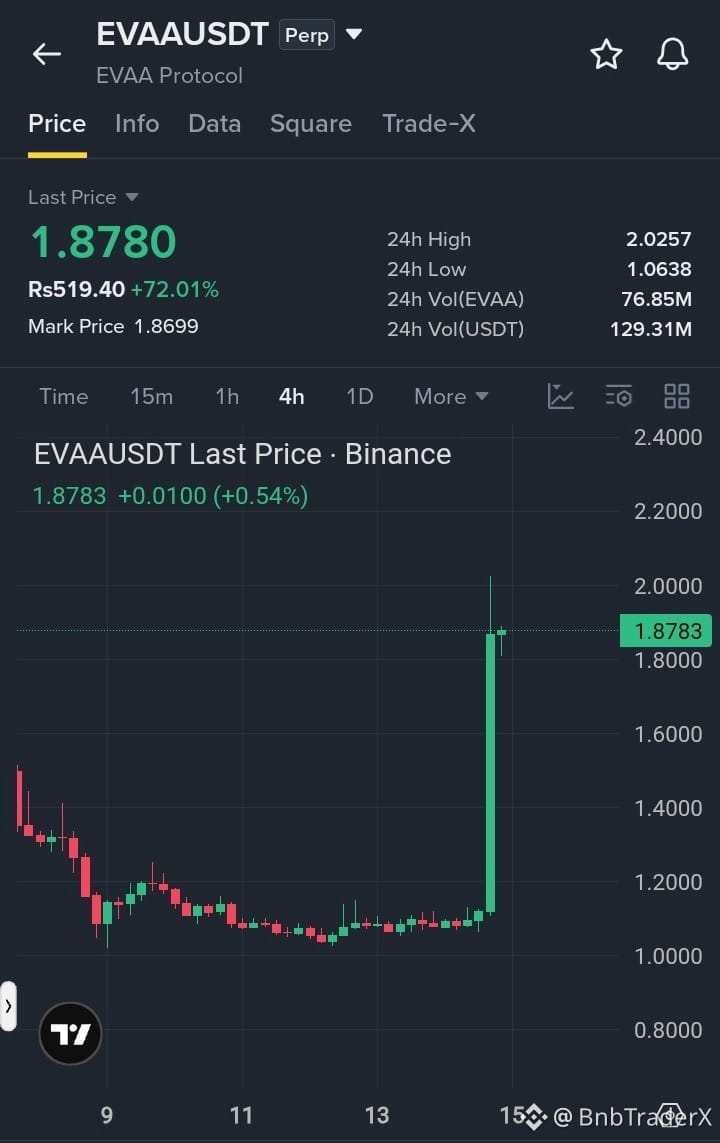
$EVAA is showing strong bullish momentum on the 4h chart, surging over +72.01% to test resistance near the 2.0257 level after a powerful breakout from its recent low of 1.0638. The aggressive green candles and expanding volume indicate strong buyer backing off the recent lows, pointing toward potential continuation toward higher targets if the price maintains support above the intermediate zone.
Target 1: 2.0257
Target 2: 2.2500
Target 3: 2.5000
#EVAA #Crypto #Trading
{future}(EVAAUSDT)
$AKE
{future}(AKEUSDT)
$PYTH
{spot}(PYTHUSDT)
$EVAA is showing strong bullish momentum on the 4h chart, surging over +72.01% to test resistance near the 2.0257 level after a powerful breakout from its recent low of 1.0638. The aggressive green candles and expanding volume indicate strong buyer backing off the recent lows, pointing toward potential continuation toward higher targets if the price maintains support above the intermediate zone.
Target 1: 2.0257
Target 2: 2.2500
Target 3: 2.5000
#EVAA #Crypto #Trading
$AKE
$PYTH
Target 1: 2.0257
Target 2: 2.2500
Target 3: 2.5000
#EVAA #Crypto #Trading
$AKE
$PYTH
4
1.5k
·
--
🔥 $SUI
{future}(SUIUSDT)
– Short Setup (Nov 14)
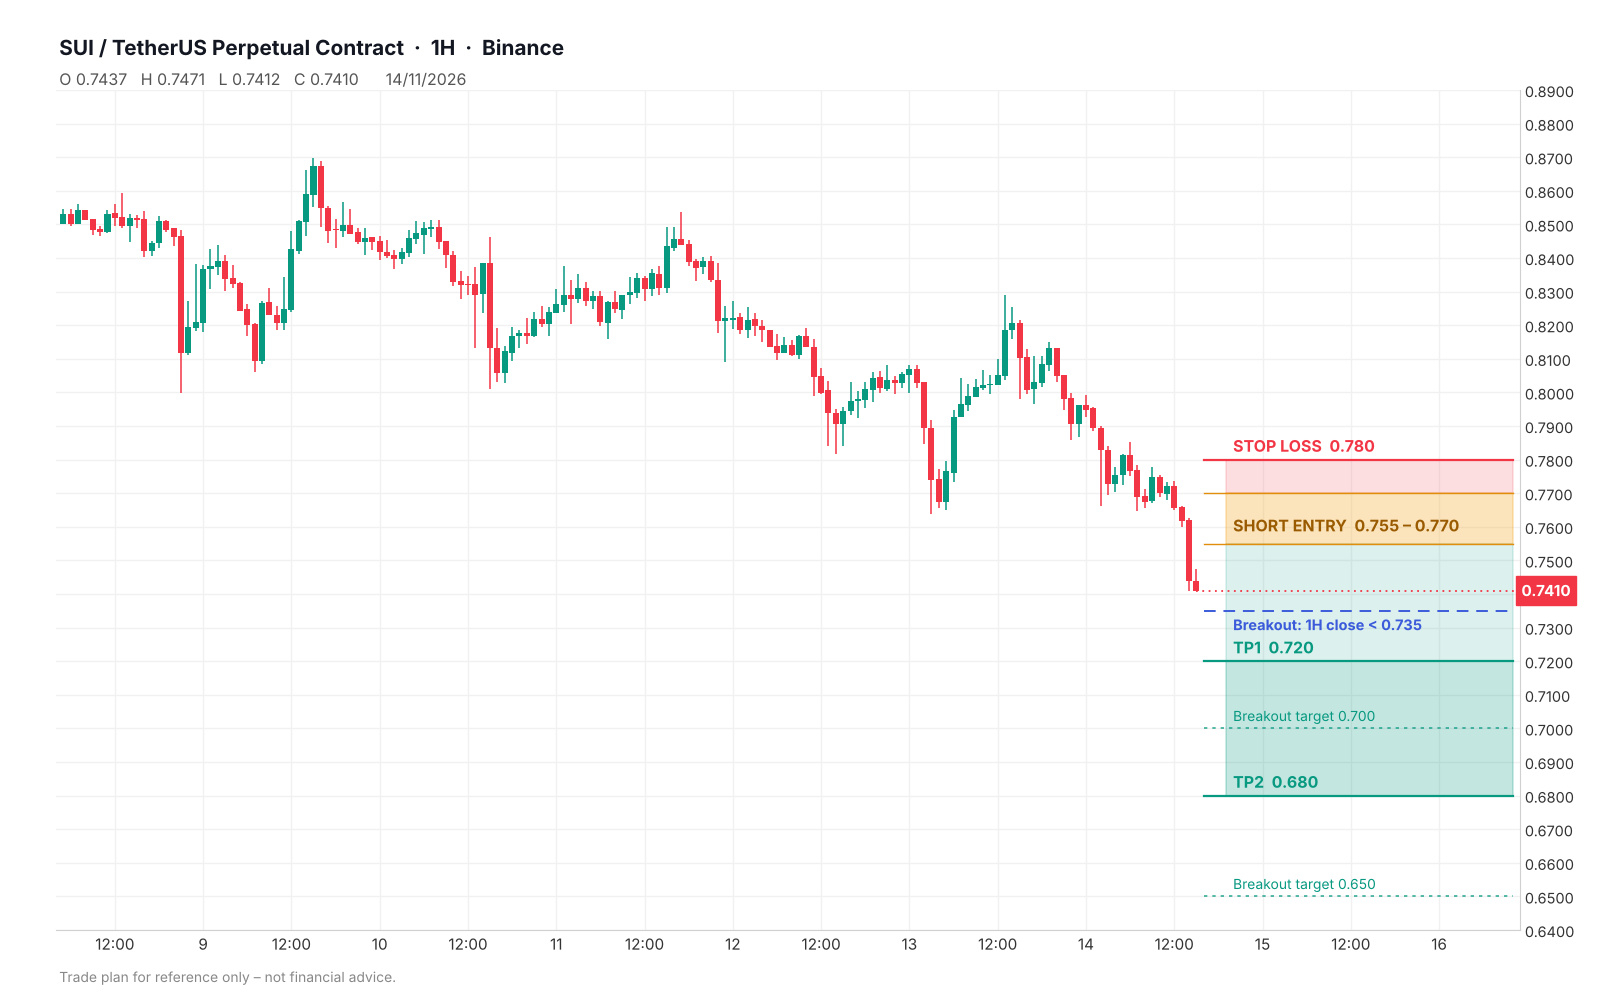
SUI is bearish on every timeframe (1W–5m): lower highs, repeated BOS down, price sliding into Discount near 0.74. Cheap isn't a buy signal in a downtrend, so don't catch the falling knife.
📉 Entry: short on a pullback to 0.755–0.770 after a rejection candle
🛑 Stop loss: 0.780
🎯 TP1: 0.720
🎯 TP2: 0.680
Breakout play: a 1H close below 0.735 opens 0.70 → 0.65. Longs only after a bullish CHoCH on 15m/1H.
Context: Suiet wallet is ending support, DeFi TVL is down ~22% in a month, Fear & Greed at 18. Weekend liquidity is thin, so keep risk at 1–2% per trade.
⚠️ Not financial advice. DYOR.
#SUI #Crypto #Trading #TechnicalAnalysis
🔥 $SUI
– Short Setup (Nov 14)
SUI is bearish on every timeframe (1W–5m): lower highs, repeated BOS down, price sliding into Discount near 0.74. Cheap isn't a buy signal in a downtrend, so don't catch the falling knife.
📉 Entry: short on a pullback to 0.755–0.770 after a rejection candle
🛑 Stop loss: 0.780
🎯 TP1: 0.720
🎯 TP2: 0.680
Breakout play: a 1H close below 0.735 opens 0.70 → 0.65. Longs only after a bullish CHoCH on 15m/1H.
Context: Suiet wallet is ending support, DeFi TVL is down ~22% in a month, Fear & Greed at 18. Weekend liquidity is thin, so keep risk at 1–2% per trade.
⚠️ Not financial advice. DYOR.
#SUI #Crypto #Trading #TechnicalAnalysis
– Short Setup (Nov 14)
SUI is bearish on every timeframe (1W–5m): lower highs, repeated BOS down, price sliding into Discount near 0.74. Cheap isn't a buy signal in a downtrend, so don't catch the falling knife.
📉 Entry: short on a pullback to 0.755–0.770 after a rejection candle
🛑 Stop loss: 0.780
🎯 TP1: 0.720
🎯 TP2: 0.680
Breakout play: a 1H close below 0.735 opens 0.70 → 0.65. Longs only after a bullish CHoCH on 15m/1H.
Context: Suiet wallet is ending support, DeFi TVL is down ~22% in a month, Fear & Greed at 18. Weekend liquidity is thin, so keep risk at 1–2% per trade.
⚠️ Not financial advice. DYOR.
#SUI #Crypto #Trading #TechnicalAnalysis
162


Mujib59:
Hello I followed you please follow me back 💖
1
4
876

·
--
Bearish
Brother & Sister $S is now strong bearish. Now the time of taking profit from short trade. 4h downtrend crossover and high selling pressure will decrease the price. Short trade profit target - $0.03541 and stop loss- $0.037 #bearish #ShortSignal #trading
{future}(SUSDT)
Brother & Sister $S is now strong bearish. Now the time of taking profit from short trade. 4h downtrend crossover and high selling pressure will decrease the price. Short trade profit target - $0.03541 and stop loss- $0.037 #bearish #ShortSignal #trading
1
458

·
--
$CFX is being pitched as a short-term CFX/USDT buy setup, but the chart has reset hard to $0.0336 after a 16.42% daily drop. A tactical buying zone is $0.0325–$0.0350, with upside targets at $0.040, $0.048 and $0.053. RSI 17 and 3.1x volume show panic, while shorts pay funding. High risk, but the reward map is clear 🚀 #CFX #Altcoin #Trading
Inspired by Ayesha Siddika 99 on Binance Square.
$CFX is being pitched as a short-term CFX/USDT buy setup, but the chart has reset hard to $0.0336 after a 16.42% daily drop. A tactical buying zone is $0.0325–$0.0350, with upside targets at $0.040, $0.048 and $0.053. RSI 17 and 3.1x volume show panic, while shorts pay funding. High risk, but the reward map is clear 🚀 #CFX #Altcoin #Trading
Inspired by Ayesha Siddika 99 on Binance Square.
Inspired by Ayesha Siddika 99 on Binance Square.

19

🚨 $XRP LOSES THE PSYCHOLOGICAL $1 FLOOR AMID WIDER MACRO BLEED! 📉
Entry: 1.00 📉
Liquidity is draining fast as $XRP slides under parity, dragging sentiment down alongside tech sector jitters. When key psychological barriers shatter under heavy volume, the order books beneath get tested in a hurry. 📊
Sellers are currently pressing their advantage while broader market correlations amplify the downward momentum. ⚡ Are you stepping in to catch the falling knife near support or waiting for a confirmed reclaim above parity? 👇
⚠️ Not financial advice. Always manage your risk. 🛡️
🏷️ #XRP #Crypto #MarketUpdate #Trading
📉 🦈
🚨 $XRP LOSES THE PSYCHOLOGICAL $1 FLOOR AMID WIDER MACRO BLEED! 📉
Entry: 1.00 📉
Liquidity is draining fast as $XRP slides under parity, dragging sentiment down alongside tech sector jitters. When key psychological barriers shatter under heavy volume, the order books beneath get tested in a hurry. 📊
Sellers are currently pressing their advantage while broader market correlations amplify the downward momentum. ⚡ Are you stepping in to catch the falling knife near support or waiting for a confirmed reclaim above parity? 👇
⚠️ Not financial advice. Always manage your risk. 🛡️
🏷️ #XRP #Crypto #MarketUpdate #Trading
📉 🦈
Entry: 1.00 📉
Liquidity is draining fast as $XRP slides under parity, dragging sentiment down alongside tech sector jitters. When key psychological barriers shatter under heavy volume, the order books beneath get tested in a hurry. 📊
Sellers are currently pressing their advantage while broader market correlations amplify the downward momentum. ⚡ Are you stepping in to catch the falling knife near support or waiting for a confirmed reclaim above parity? 👇
⚠️ Not financial advice. Always manage your risk. 🛡️
🏷️ #XRP #Crypto #MarketUpdate #Trading
📉 🦈
24

·
--
Bullish
FallenAngel From Utopia:
not yet ...wait 40-50k👎📉💩😁
4
1
1k

·
--
Bearish
Partly True
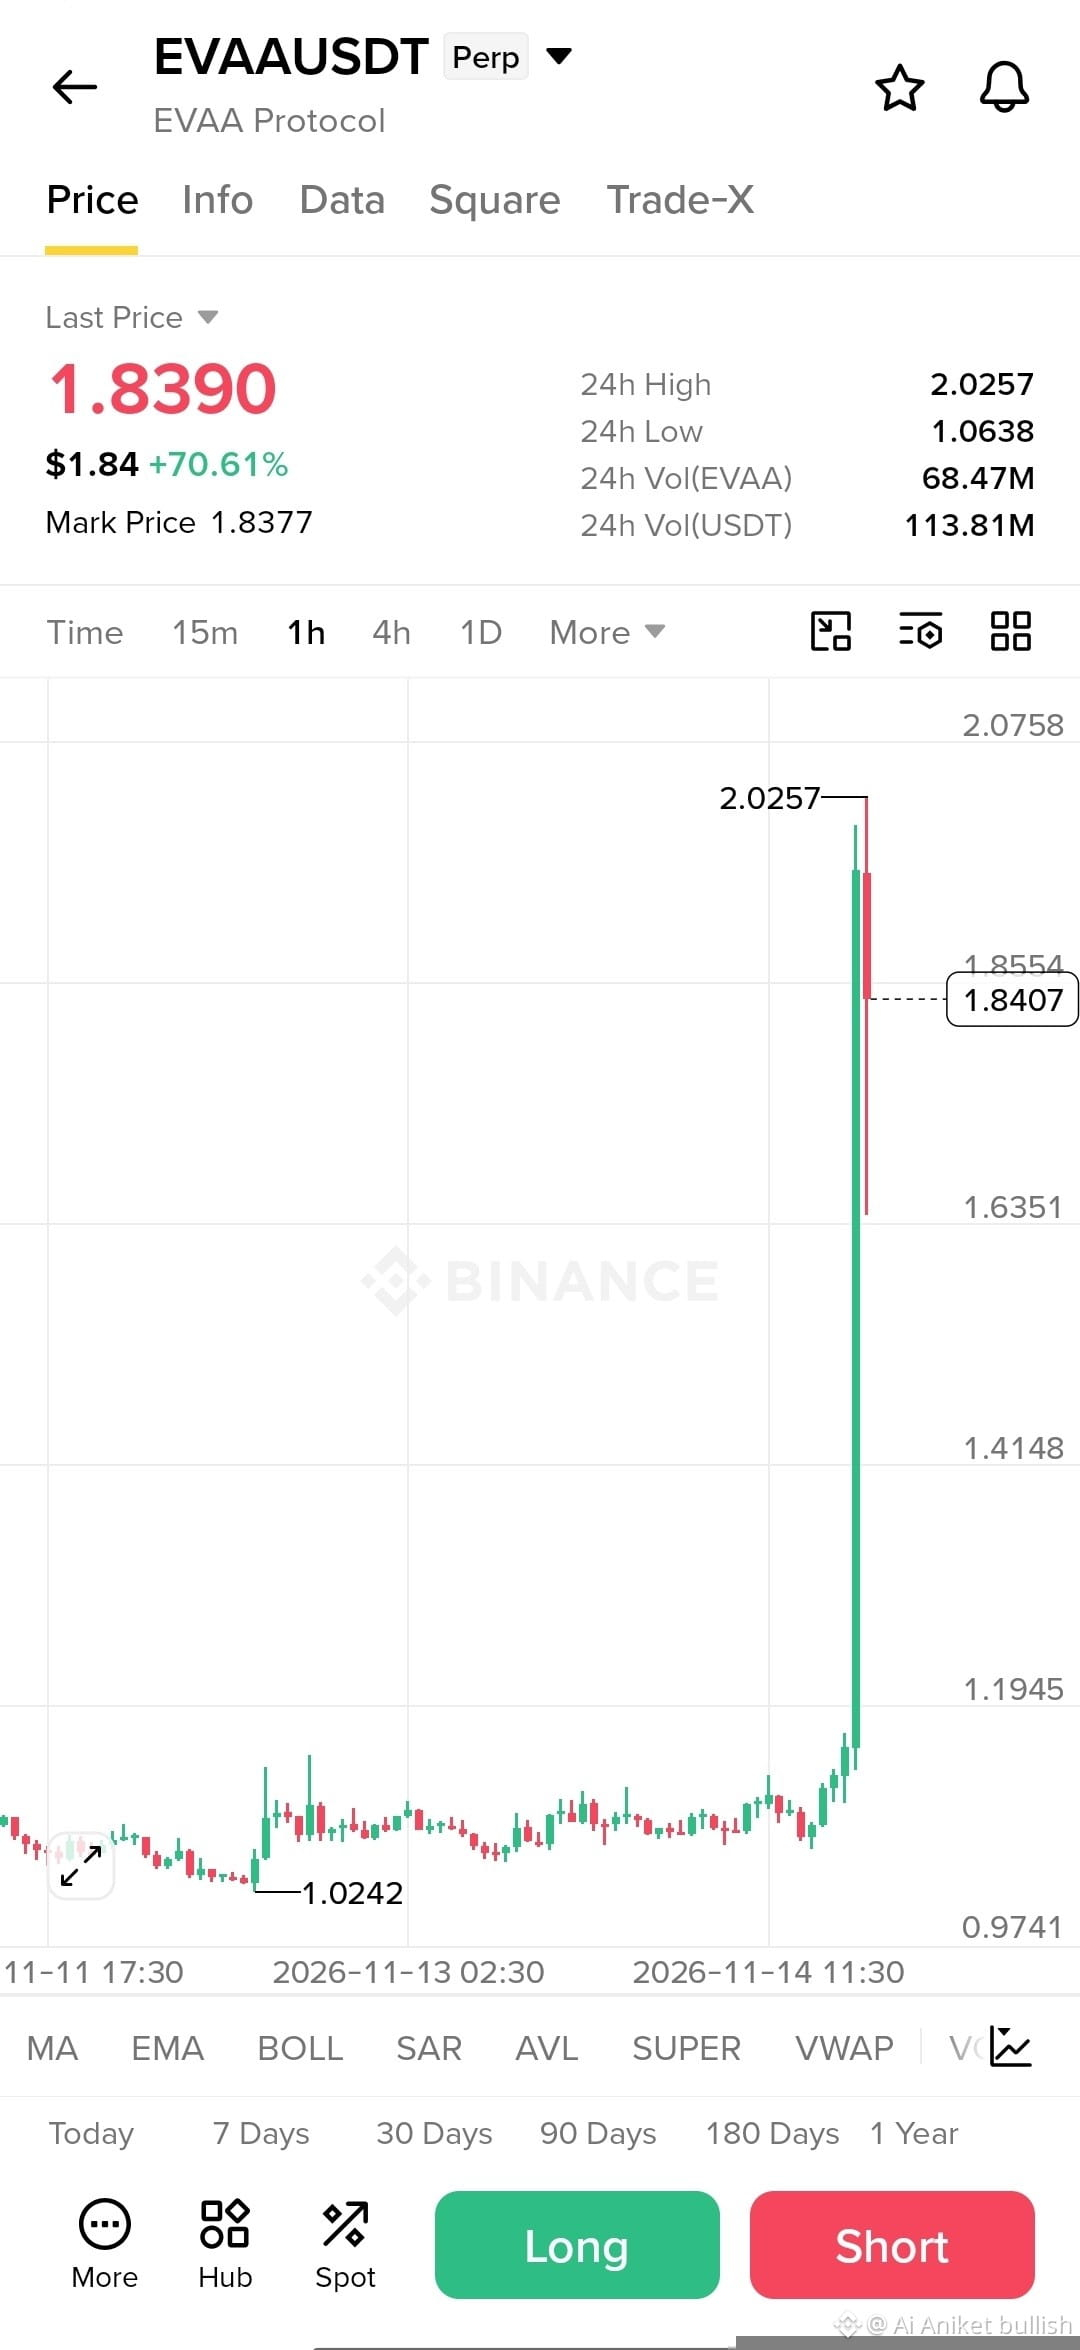
🚨 $EVAA : 70% Pump — Is a Reversal Loading?
$EVAA surged to $2.0257 but faced sharp rejection. At $1.8390, the 1H chart shows a strong rally followed by selling pressure.
My view: SHORT BIAS.
News adds caution: around 535,000 EVAA tokens are scheduled to unlock on November 27. Earlier coverage also reported that deposits in the TON Main Pool fell roughly 3% during a previous major rally, with no clear catalyst identified.
The chart-based short idea is driven by the rejection after the spike; the token unlock is an additional risk factor, not proof of an imminent drop.
⚠️ A volatile coin after a 70% move — shorting here carries high squeeze risk. This is a bearish view, not a guaranteed trade.
{future}(EVAAUSDT)
#EVAA #crypto #Trading
🚨 $EVAA : 70% Pump — Is a Reversal Loading?
$EVAA surged to $2.0257 but faced sharp rejection. At $1.8390, the 1H chart shows a strong rally followed by selling pressure.
My view: SHORT BIAS.
News adds caution: around 535,000 EVAA tokens are scheduled to unlock on November 27. Earlier coverage also reported that deposits in the TON Main Pool fell roughly 3% during a previous major rally, with no clear catalyst identified.
The chart-based short idea is driven by the rejection after the spike; the token unlock is an additional risk factor, not proof of an imminent drop.
⚠️ A volatile coin after a 70% move — shorting here carries high squeeze risk. This is a bearish view, not a guaranteed trade.
#EVAA #crypto #Trading
$EVAA surged to $2.0257 but faced sharp rejection. At $1.8390, the 1H chart shows a strong rally followed by selling pressure.
My view: SHORT BIAS.
News adds caution: around 535,000 EVAA tokens are scheduled to unlock on November 27. Earlier coverage also reported that deposits in the TON Main Pool fell roughly 3% during a previous major rally, with no clear catalyst identified.
The chart-based short idea is driven by the rejection after the spike; the token unlock is an additional risk factor, not proof of an imminent drop.
⚠️ A volatile coin after a 70% move — shorting here carries high squeeze risk. This is a bearish view, not a guaranteed trade.
#EVAA #crypto #Trading
1
2
671

·
--
Is $HYPE at $66.21 a breakdown or the flush before a reversal? 🤔
Down 8.75% today, with the last 4h down 9.2%. RSI is 33, price sits below both the 20d and 50d MAs, and longs are still paying funding. That’s not a clean setup.
Volume hit $56.15M, only 1.2x average. Even $XRP has shown stronger relative strength lately. I’d watch $66 closely, not chase it. ⚠️
Would you enter here or wait for a retest? 👀
#HYPE #Trading
Is $HYPE at $66.21 a breakdown or the flush before a reversal? 🤔
Down 8.75% today, with the last 4h down 9.2%. RSI is 33, price sits below both the 20d and 50d MAs, and longs are still paying funding. That’s not a clean setup.
Volume hit $56.15M, only 1.2x average. Even $XRP has shown stronger relative strength lately. I’d watch $66 closely, not chase it. ⚠️
Would you enter here or wait for a retest? 👀
#HYPE #Trading
Down 8.75% today, with the last 4h down 9.2%. RSI is 33, price sits below both the 20d and 50d MAs, and longs are still paying funding. That’s not a clean setup.
Volume hit $56.15M, only 1.2x average. Even $XRP has shown stronger relative strength lately. I’d watch $66 closely, not chase it. ⚠️
Would you enter here or wait for a retest? 👀
#HYPE #Trading
45

Article
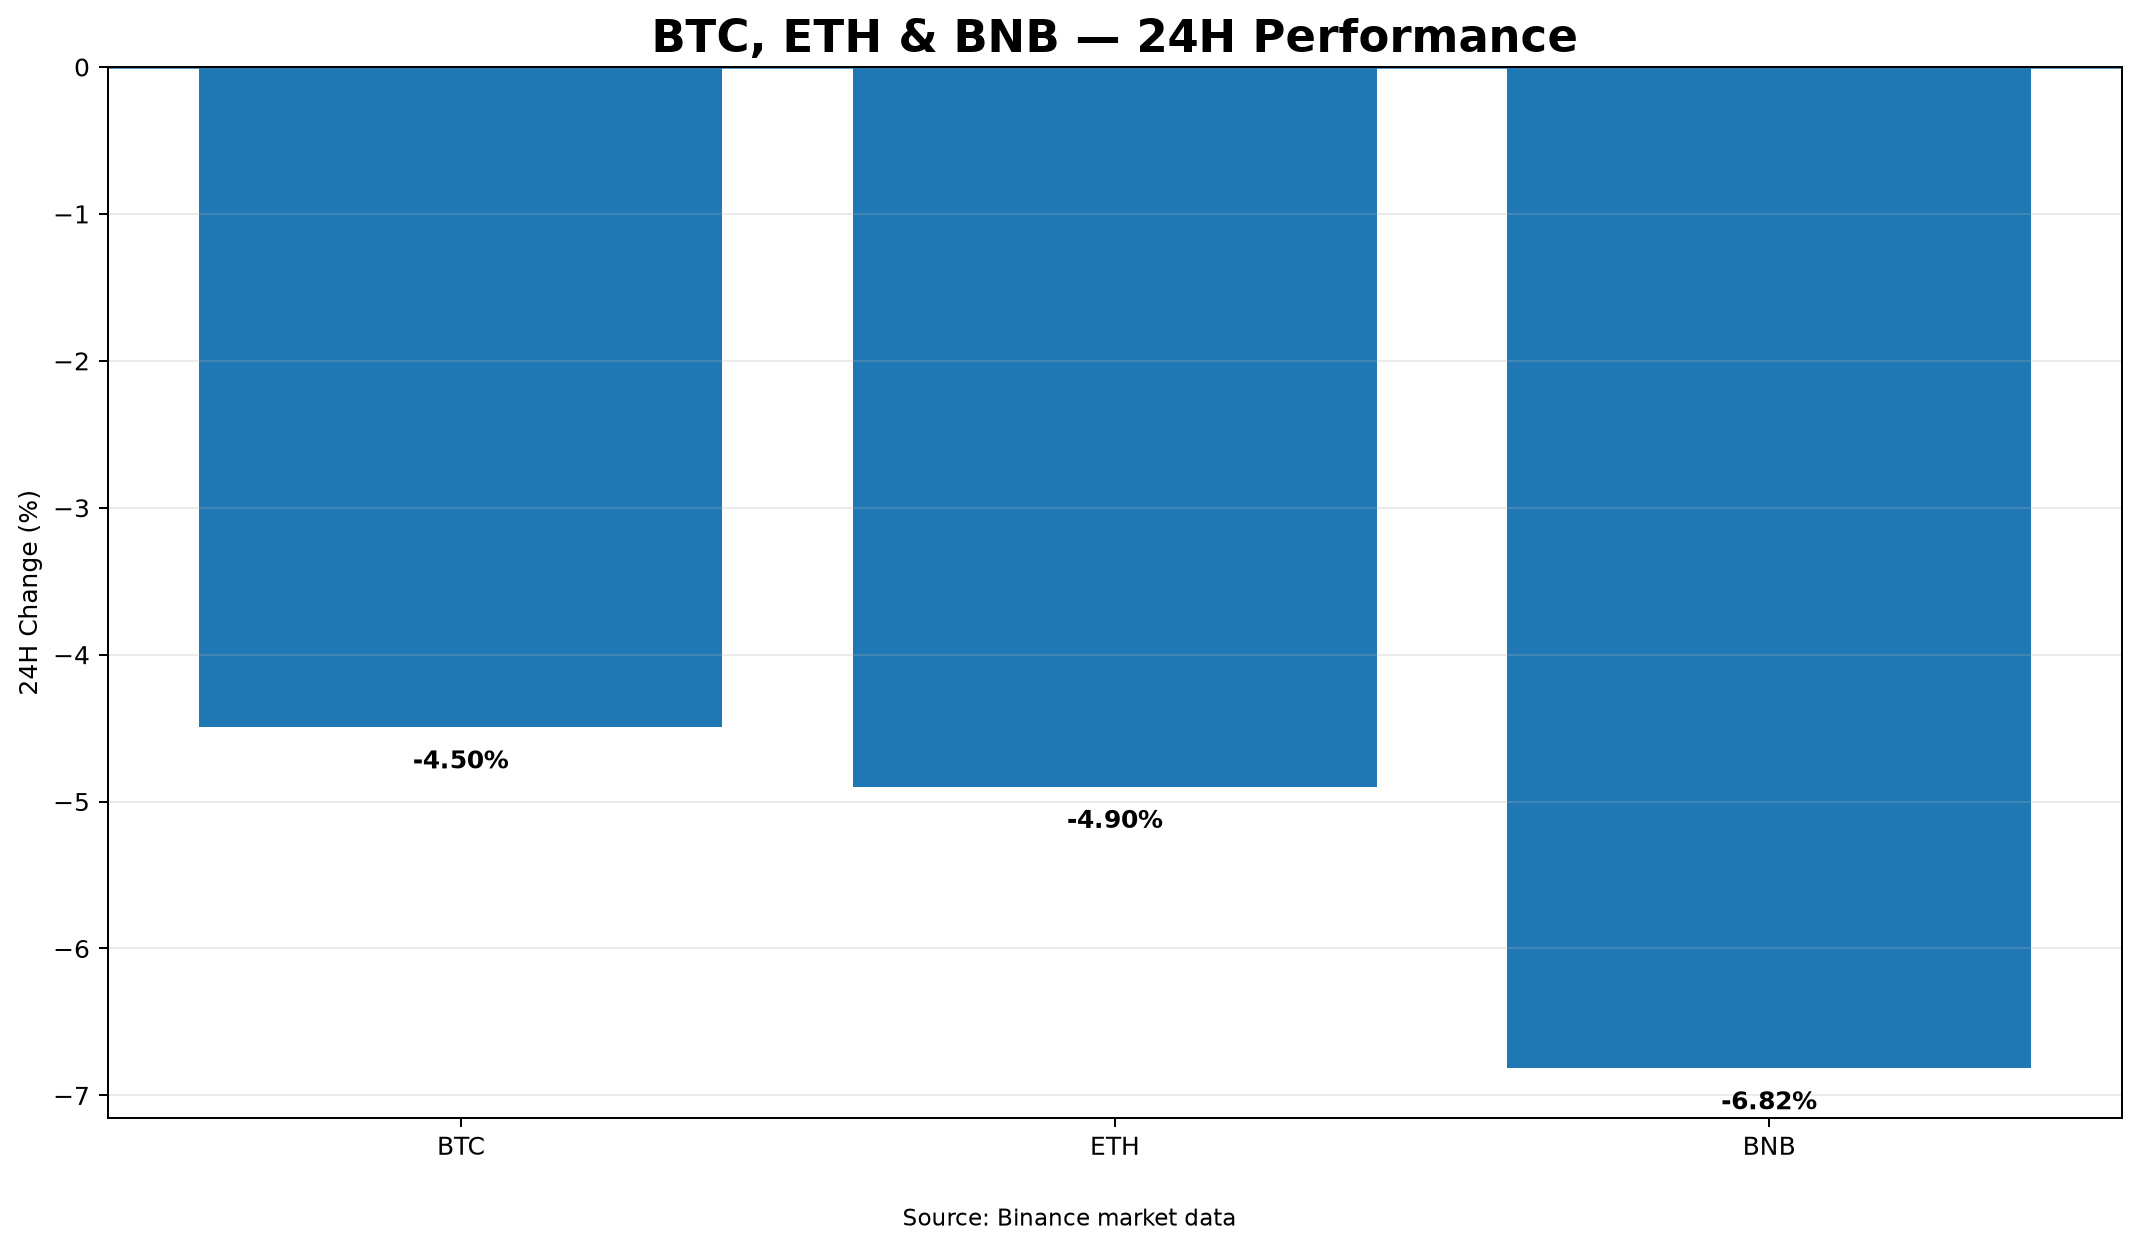
Crypto Market Overview: Intraday Pullback Across Major AssetsThe crypto market experienced notable selling pressure over the past 24 hours. $BTC fell 4.50% to $65,382.65, $ETH dropped 4.90% to $1,828.22, and $BNB saw a steeper decline of 6.82% to $586.97.
Relative Strength & Volatility:
Bitcoin held up slightly better on a relative basis compared to Ethereum and BNB. High intraday volatility pushed all three assets close to their 24-hour lows by the end of the window.
High/Low Ranges & Volume:
- Bitcoin ranged from $65,066.66 to $69,134.01, leading total activity with $1.55B in quote volume.
- Ethereum traded between $1,815.35 and $1,956.50, accumulating $592.13M in volume.
- BNB fluctuated between $586.51 and $639.29, registering $120.92M in volume.
Market Scenarios:
- Bullish Scenario: Reclaiming recent daily highs ($69,134.01 for Bitcoin, $1,956.50 for Ethereum, $639.29 for BNB) accompanied by expanding buy volume could indicate structural stabilization.
- Bearish Scenario: Sustained trading below current 24-hour lows ($65,066.66, $1,815.35, and $586.51) could lead to extended downside momentum.
Risks & What to Watch:
Key risks center around elevated volume during red candles pushing prices past immediate low thresholds. Watch for shifts in trade volume and price action stability around current support levels.
#CryptoAnalysis #MarketUpdate #Trading
Crypto Market Overview: Intraday Pullback Across Major Assets
The crypto market experienced notable selling pressure over the past 24 hours. $BTC fell 4.50% to $65,382.65, $ETH dropped 4.90% to $1,828.22, and $BNB saw a steeper decline of 6.82% to $586.97.
Relative Strength & Volatility:
Bitcoin held up slightly better on a relative basis compared to Ethereum and BNB. High intraday volatility pushed all three assets close to their 24-hour lows by the end of the window.
High/Low Ranges & Volume:
- Bitcoin ranged from $65,066.66 to $69,134.01, leading total activity with $1.55B in quote volume.
- Ethereum traded between $1,815.35 and $1,956.50, accumulating $592.13M in volume.
- BNB fluctuated between $586.51 and $639.29, registering $120.92M in volume.
Market Scenarios:
- Bullish Scenario: Reclaiming recent daily highs ($69,134.01 for Bitcoin, $1,956.50 for Ethereum, $639.29 for BNB) accompanied by expanding buy volume could indicate structural stabilization.
- Bearish Scenario: Sustained trading below current 24-hour lows ($65,066.66, $1,815.35, and $586.51) could lead to extended downside momentum.
Risks & What to Watch:
Key risks center around elevated volume during red candles pushing prices past immediate low thresholds. Watch for shifts in trade volume and price action stability around current support levels.
#CryptoAnalysis #MarketUpdate #Trading
Relative Strength & Volatility:
Bitcoin held up slightly better on a relative basis compared to Ethereum and BNB. High intraday volatility pushed all three assets close to their 24-hour lows by the end of the window.
High/Low Ranges & Volume:
- Bitcoin ranged from $65,066.66 to $69,134.01, leading total activity with $1.55B in quote volume.
- Ethereum traded between $1,815.35 and $1,956.50, accumulating $592.13M in volume.
- BNB fluctuated between $586.51 and $639.29, registering $120.92M in volume.
Market Scenarios:
- Bullish Scenario: Reclaiming recent daily highs ($69,134.01 for Bitcoin, $1,956.50 for Ethereum, $639.29 for BNB) accompanied by expanding buy volume could indicate structural stabilization.
- Bearish Scenario: Sustained trading below current 24-hour lows ($65,066.66, $1,815.35, and $586.51) could lead to extended downside momentum.
Risks & What to Watch:
Key risks center around elevated volume during red candles pushing prices past immediate low thresholds. Watch for shifts in trade volume and price action stability around current support levels.
#CryptoAnalysis #MarketUpdate #Trading
78


·
--
🚀 $PIEVERSE LONG 🚀
Entry: 1.9203 – 1.9319
SL: 1.8352
TP1: 2.0040
TP2: 2.0559
TP3: 2.1208
📈 Technical Outlook:
$PIEVERSE is showing strong bullish momentum after confirming strength near a key technical zone. The setup is supported by EMA trend is bullish, price is breaking above recent resistance, RSI supports bullish momentum. As long as price holds above the entry area, buyers may continue pushing toward the listed targets.
#PIEVERSE #Crypto #BinanceSquare #Trading
🚀 $PIEVERSE LONG 🚀
Entry: 1.9203 – 1.9319
SL: 1.8352
TP1: 2.0040
TP2: 2.0559
TP3: 2.1208
📈 Technical Outlook:
$PIEVERSE is showing strong bullish momentum after confirming strength near a key technical zone. The setup is supported by EMA trend is bullish, price is breaking above recent resistance, RSI supports bullish momentum. As long as price holds above the entry area, buyers may continue pushing toward the listed targets.
#PIEVERSE #Crypto #BinanceSquare #Trading
Entry: 1.9203 – 1.9319
SL: 1.8352
TP1: 2.0040
TP2: 2.0559
TP3: 2.1208
📈 Technical Outlook:
$PIEVERSE is showing strong bullish momentum after confirming strength near a key technical zone. The setup is supported by EMA trend is bullish, price is breaking above recent resistance, RSI supports bullish momentum. As long as price holds above the entry area, buyers may continue pushing toward the listed targets.
#PIEVERSE #Crypto #BinanceSquare #Trading

1

·
--
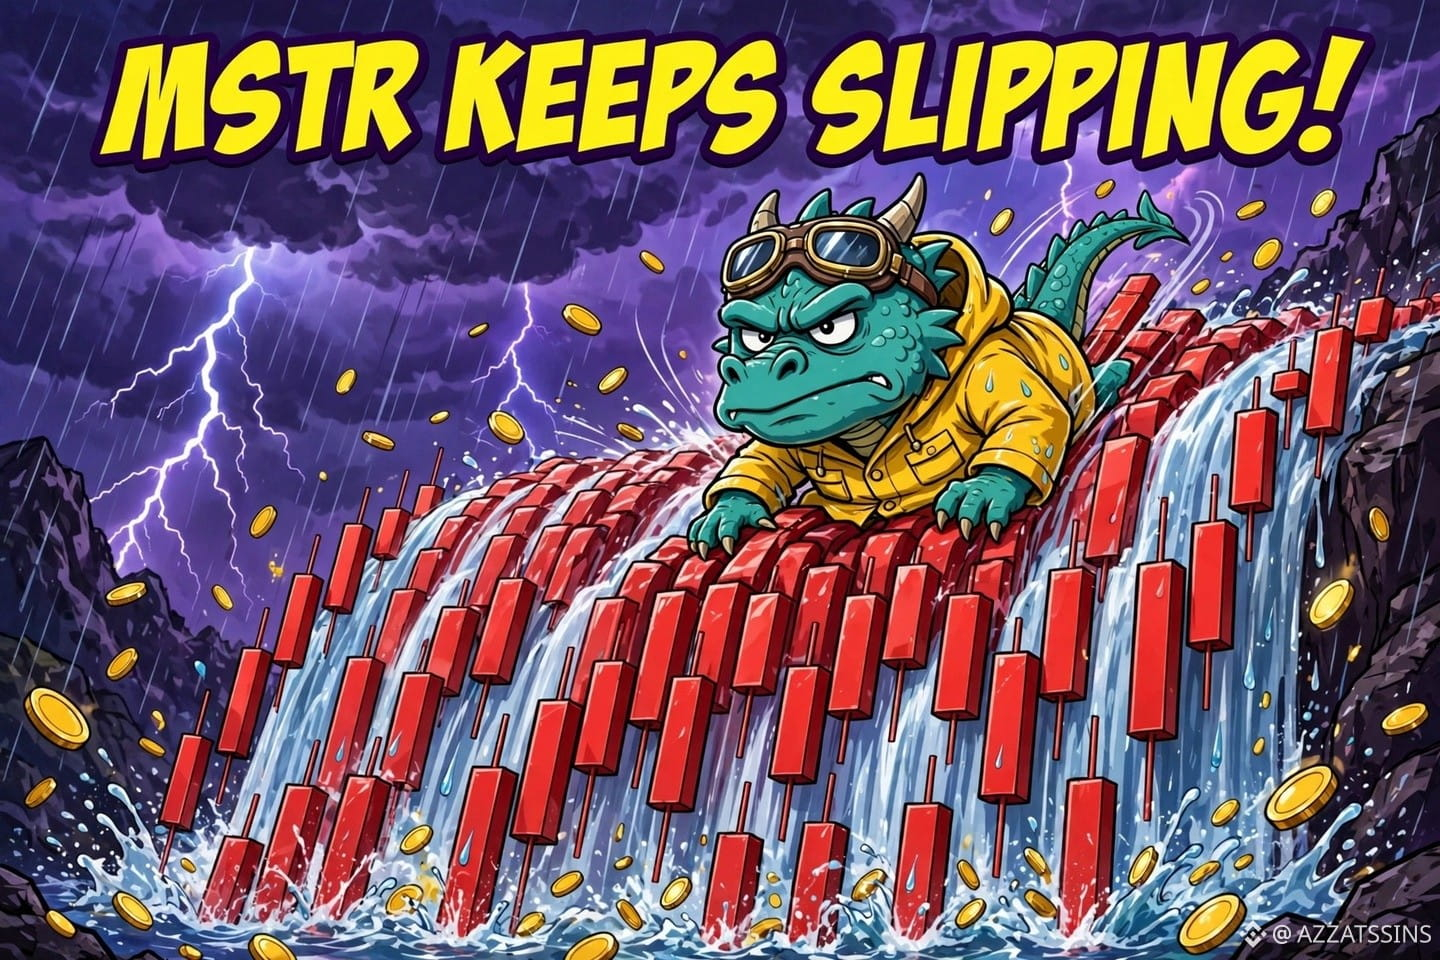
$MSTR SHORT • Score 80
Entry 99.37 | TP 94.90 | RR 1:2
MSTR's already down over 9% today and the 15m trend is still pointing down with lower highs and lower lows, so I'm not fighting this slide while BTC stays this bearish.
MTF 15m down only (4H unavailable) • LH/LL
BTC Bias: BEARISH (-100)
Not financial advice. DYOR.
#BTC #CryptoSignals #Trading
$MSTR SHORT • Score 80
Entry 99.37 | TP 94.90 | RR 1:2
MSTR's already down over 9% today and the 15m trend is still pointing down with lower highs and lower lows, so I'm not fighting this slide while BTC stays this bearish.
MTF 15m down only (4H unavailable) • LH/LL
BTC Bias: BEARISH (-100)
Not financial advice. DYOR.
#BTC #CryptoSignals #Trading
Entry 99.37 | TP 94.90 | RR 1:2
MSTR's already down over 9% today and the 15m trend is still pointing down with lower highs and lower lows, so I'm not fighting this slide while BTC stays this bearish.
MTF 15m down only (4H unavailable) • LH/LL
BTC Bias: BEARISH (-100)
Not financial advice. DYOR.
#BTC #CryptoSignals #Trading
19
Log in to explore more content
Join global crypto users on Binance Square
⚡️ Get latest and useful information about crypto.
💬 Trusted by the world’s largest crypto exchange.
👍 Discover real insights from verified creators.
Email / Phone number
Trending Topics
1
#WhoWillSucceedJensenHuangatNvidia?
192,714 views
1,760 Discussing
2
#WhatWillDriveCryptoandStocks’NextRebound?
609,508 views
3,598 Discussing
3
#TradFiForBeginners
745,437 views
4,570 Discussing
4
#BitcoinActiveSupplyInProfitDropsBelow45%
86,864 views
792 Discussing
5
#KavaSaysAbnormalActivityLimitedToKavaLend
51,504 views
445 Discussing
6
#USSpotXRPETFsSeeLargestWeeklyOutflowIn8Months
36,684 views
386 Discussing
7
#USPPIMissMayEaseBTCPressure
321,748 views
2,313 Discussing
8
#WORPTLetsTouristsConvertCryptoToThaiBaht
11,451 views
110 Discussing
9
#TONStrategyReports$23.97MQ3NetLoss
11,128 views
49 Discussing
10
#PolkadotCommunityApprovesNewStrategyWith97%Vote
31,211 views
303 Discussing