
#bitcoin
bitcoin
347.2M views
842,279 Discussing
Hot
Latest

·
--
Verified
🚀 SpaceX and Tesla Merger Talks Put Over 30,000 Bitcoins Back in Focus
Ongoing discussions between SpaceX and Tesla regarding a potential merger into a massive conglomerate valued at roughly $3.4 trillion have once again drawn market attention to their combined cryptocurrency holdings.
According to recent corporate filings, the two companies hold a combined total of more than 30,220 Bitcoins on their balance sheets. SpaceX accounts for 18,712 BTC of that sum, while Tesla holds 11,509 BTC. At current market prices, the combined value of these cryptocurrency reserves sits at approximately $2.1 billion. Despite the substantial figure, it represents only a tiny fraction of the merged entity's projected market capitalization, meaning the deal itself would not require additional large-scale crypto purchases, instead simply consolidating existing assets under one roof.
However, significant corporate and regulatory hurdles stand in the way of finalizing the landmark deal. Tesla's board of directors has already formed a special independent committee to evaluate the merits of the merger and protect shareholder interests. The primary challenge remains aligning corporate governance and navigating complex regulatory oversight, as SpaceX is heavily involved in classified US government and defense contracts, whereas Tesla maintains major manufacturing operations and business interests in China.
#ELONMUSK #BTC #BITCOIN $BTC $SPCX $TSLA
{future}(TSLAUSDT)
{future}(SPCXUSDT)
{future}(BTCUSDT)
🚀 SpaceX and Tesla Merger Talks Put Over 30,000 Bitcoins Back in Focus
Ongoing discussions between SpaceX and Tesla regarding a potential merger into a massive conglomerate valued at roughly $3.4 trillion have once again drawn market attention to their combined cryptocurrency holdings.
According to recent corporate filings, the two companies hold a combined total of more than 30,220 Bitcoins on their balance sheets. SpaceX accounts for 18,712 BTC of that sum, while Tesla holds 11,509 BTC. At current market prices, the combined value of these cryptocurrency reserves sits at approximately $2.1 billion. Despite the substantial figure, it represents only a tiny fraction of the merged entity's projected market capitalization, meaning the deal itself would not require additional large-scale crypto purchases, instead simply consolidating existing assets under one roof.
However, significant corporate and regulatory hurdles stand in the way of finalizing the landmark deal. Tesla's board of directors has already formed a special independent committee to evaluate the merits of the merger and protect shareholder interests. The primary challenge remains aligning corporate governance and navigating complex regulatory oversight, as SpaceX is heavily involved in classified US government and defense contracts, whereas Tesla maintains major manufacturing operations and business interests in China.
#ELONMUSK #BTC #BITCOIN $BTC $SPCX $TSLA
Ongoing discussions between SpaceX and Tesla regarding a potential merger into a massive conglomerate valued at roughly $3.4 trillion have once again drawn market attention to their combined cryptocurrency holdings.
According to recent corporate filings, the two companies hold a combined total of more than 30,220 Bitcoins on their balance sheets. SpaceX accounts for 18,712 BTC of that sum, while Tesla holds 11,509 BTC. At current market prices, the combined value of these cryptocurrency reserves sits at approximately $2.1 billion. Despite the substantial figure, it represents only a tiny fraction of the merged entity's projected market capitalization, meaning the deal itself would not require additional large-scale crypto purchases, instead simply consolidating existing assets under one roof.
However, significant corporate and regulatory hurdles stand in the way of finalizing the landmark deal. Tesla's board of directors has already formed a special independent committee to evaluate the merits of the merger and protect shareholder interests. The primary challenge remains aligning corporate governance and navigating complex regulatory oversight, as SpaceX is heavily involved in classified US government and defense contracts, whereas Tesla maintains major manufacturing operations and business interests in China.
#ELONMUSK #BTC #BITCOIN $BTC $SPCX $TSLA
1
327

·
--
Bearish
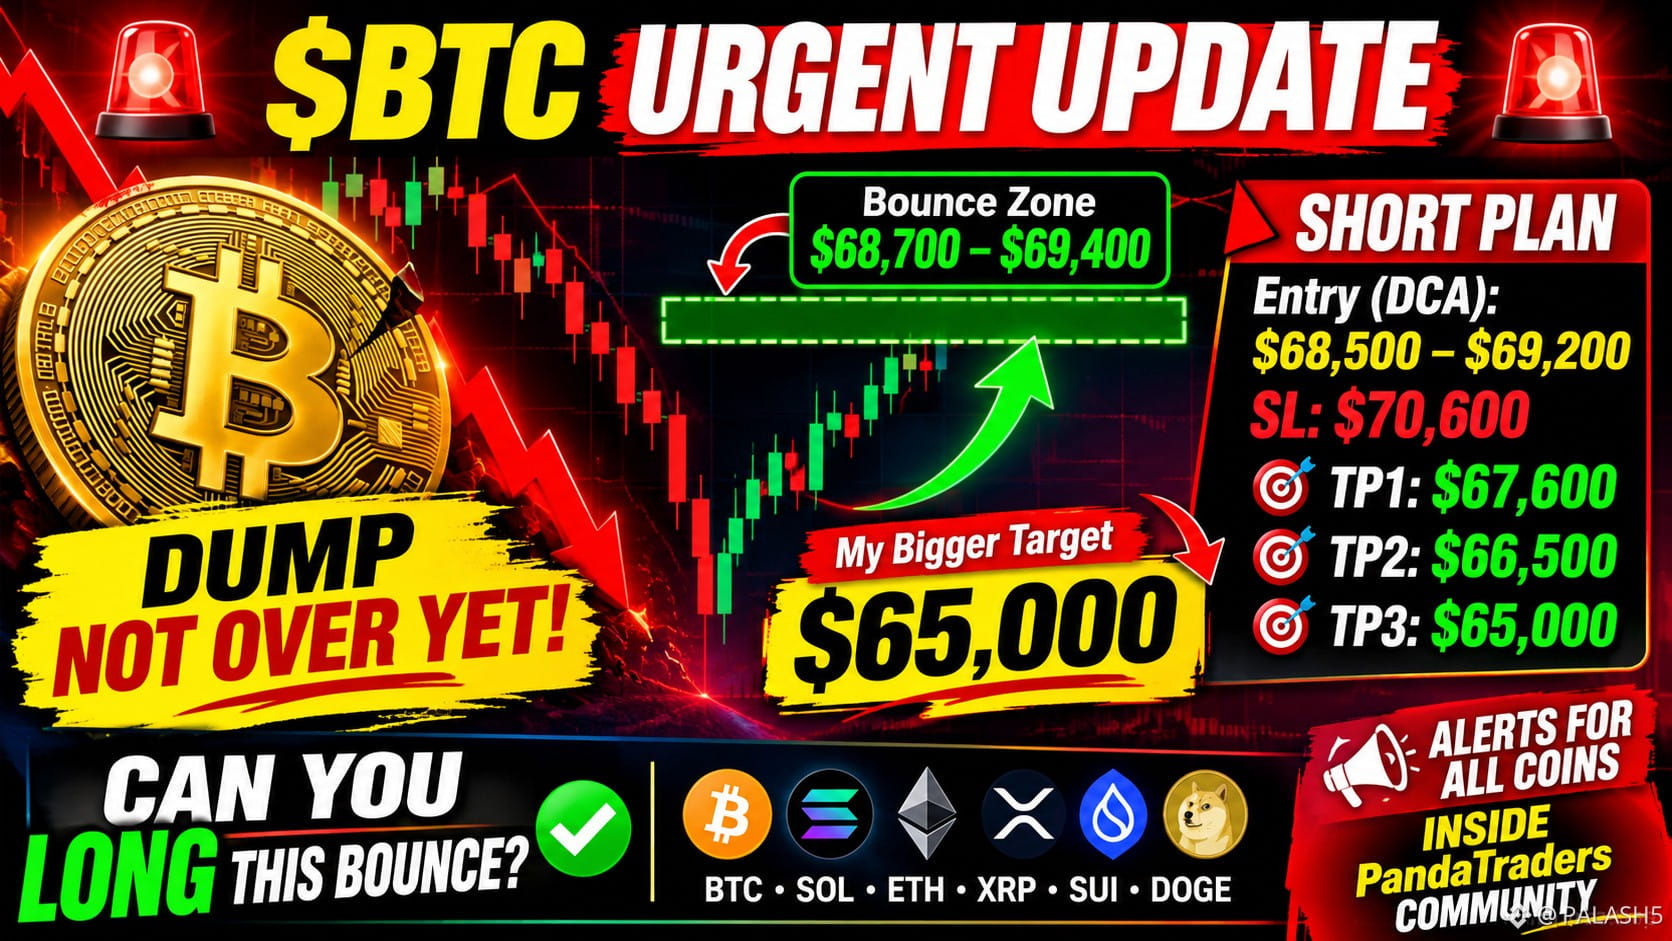
🚨 BTC'S NEXT MOVE COULD TRAP BOTH SIDES! IS $65K STILL COMING? 👀
Bitcoin's latest sell-off has created an interesting market structure. But here's something many traders might be overlooking:
A relief bounce doesn't necessarily mean the bears have lost control.
After such aggressive downside movement, short-term buyers may step in and push BTC toward $68,700–$69,400. However, that zone could become a critical decision point.
🔥 MY MARKET PERSPECTIVE:
The biggest opportunity might not be chasing the current dump. It could be waiting for BTC to recover, attract late buyers, and then show signs of bearish rejection.
📊 BTC SHORT WATCHLIST
Entry zone: $68,500–$69,200
Stop Loss: $70,600
TP1: $67,600
TP2: $66,500
TP3: $65,000
My main focus remains $65K, provided bearish momentum continues and the market confirms the setup.
THE BIGGER DISCUSSION:
Could this bounce be the market's way of creating liquidity before another leg down?
Or are we approaching a genuine trend reversal that could catch aggressive short sellers off guard?
I'm also watching SOL, ETH, XRP, SUI and DOGE for similar opportunities.
🐼 More market updates and coin alerts will be shared inside the PandaTraders community.
👇 LET'S DISCUSS:
If BTC reaches $69K, would you:
Look for a short after bearish rejection?
Take a quick long during the relief bounce?
Stay on the sidelines until confirmation?
Share your reasoning below. Let's discuss the market structure, not just guess the direction!
#Bitcoin #BTC #CryptoTrading
$BTC
{future}(BTCUSDT)
🚨 BTC'S NEXT MOVE COULD TRAP BOTH SIDES! IS $65K STILL COMING? 👀
Bitcoin's latest sell-off has created an interesting market structure. But here's something many traders might be overlooking:
A relief bounce doesn't necessarily mean the bears have lost control.
After such aggressive downside movement, short-term buyers may step in and push BTC toward $68,700–$69,400. However, that zone could become a critical decision point.
🔥 MY MARKET PERSPECTIVE:
The biggest opportunity might not be chasing the current dump. It could be waiting for BTC to recover, attract late buyers, and then show signs of bearish rejection.
📊 BTC SHORT WATCHLIST
Entry zone: $68,500–$69,200
Stop Loss: $70,600
TP1: $67,600
TP2: $66,500
TP3: $65,000
My main focus remains $65K, provided bearish momentum continues and the market confirms the setup.
THE BIGGER DISCUSSION:
Could this bounce be the market's way of creating liquidity before another leg down?
Or are we approaching a genuine trend reversal that could catch aggressive short sellers off guard?
I'm also watching SOL, ETH, XRP, SUI and DOGE for similar opportunities.
🐼 More market updates and coin alerts will be shared inside the PandaTraders community.
👇 LET'S DISCUSS:
If BTC reaches $69K, would you:
Look for a short after bearish rejection?
Take a quick long during the relief bounce?
Stay on the sidelines until confirmation?
Share your reasoning below. Let's discuss the market structure, not just guess the direction!
#Bitcoin #BTC #CryptoTrading
$BTC
Bitcoin's latest sell-off has created an interesting market structure. But here's something many traders might be overlooking:
A relief bounce doesn't necessarily mean the bears have lost control.
After such aggressive downside movement, short-term buyers may step in and push BTC toward $68,700–$69,400. However, that zone could become a critical decision point.
🔥 MY MARKET PERSPECTIVE:
The biggest opportunity might not be chasing the current dump. It could be waiting for BTC to recover, attract late buyers, and then show signs of bearish rejection.
📊 BTC SHORT WATCHLIST
Entry zone: $68,500–$69,200
Stop Loss: $70,600
TP1: $67,600
TP2: $66,500
TP3: $65,000
My main focus remains $65K, provided bearish momentum continues and the market confirms the setup.
THE BIGGER DISCUSSION:
Could this bounce be the market's way of creating liquidity before another leg down?
Or are we approaching a genuine trend reversal that could catch aggressive short sellers off guard?
I'm also watching SOL, ETH, XRP, SUI and DOGE for similar opportunities.
🐼 More market updates and coin alerts will be shared inside the PandaTraders community.
👇 LET'S DISCUSS:
If BTC reaches $69K, would you:
Look for a short after bearish rejection?
Take a quick long during the relief bounce?
Stay on the sidelines until confirmation?
Share your reasoning below. Let's discuss the market structure, not just guess the direction!
#Bitcoin #BTC #CryptoTrading
$BTC
2
1.4k

·
--
Bearish
$BTC to $30K: Is It Really Going to Happen? 👀
#Bitcoin is trading around $67K. But what if the next major destination is not $100K... but $30K?
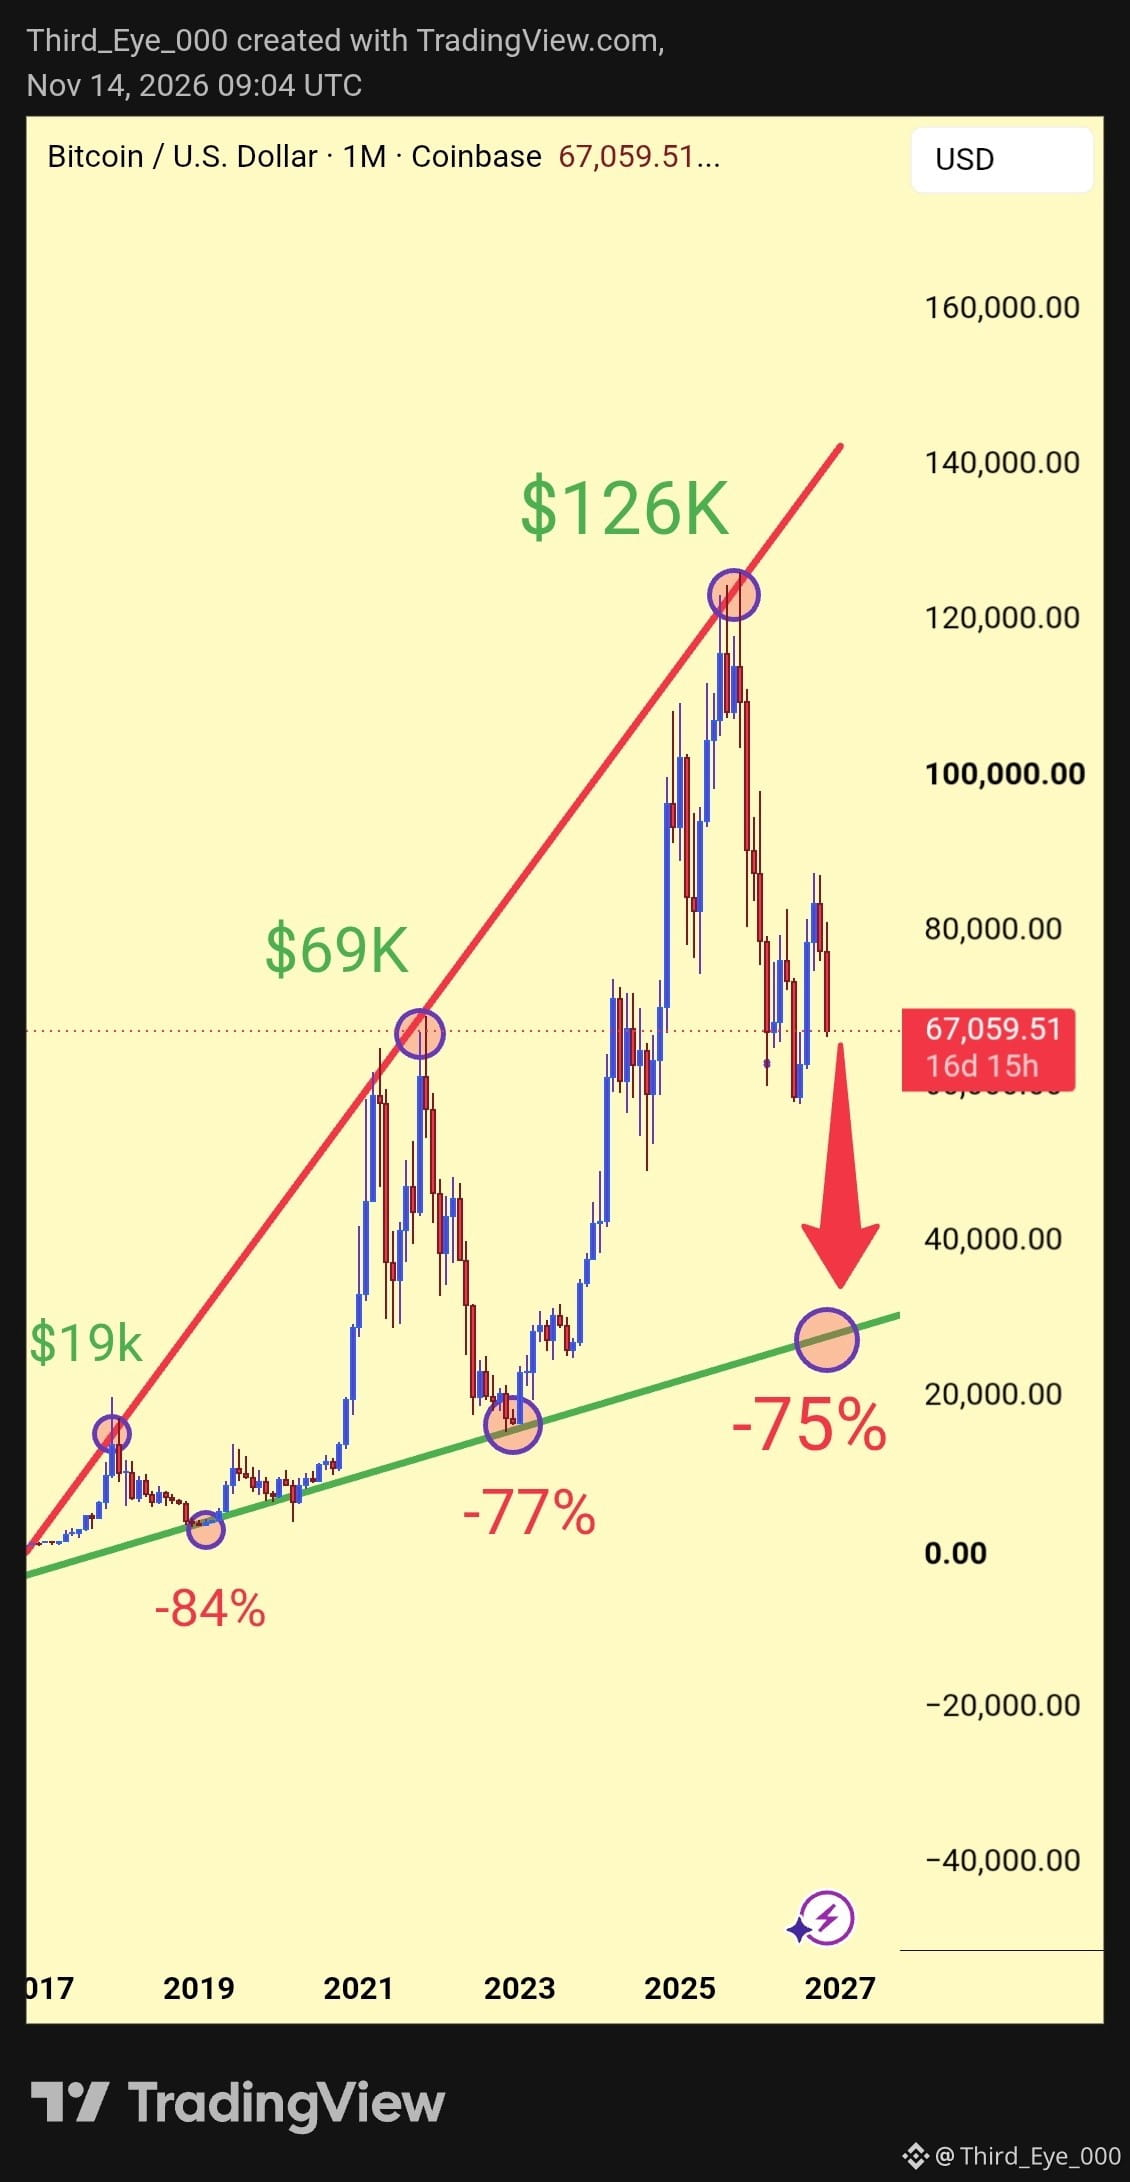
Look at this monthly chart.
Bitcoin has experienced some brutal corrections after previous cycle peaks:
🔻 2017–2018: -84%
🔻 2021–2022: -77%
🔻 2025–2026: Could history repeat with another -75% correction?
Bitcoin previously reached around $126K. A 75% drop from there would bring #BTC close to $30K.
And there's something interesting about the green trendline. It connects major historical cycle bottoms, and its projected path points toward the $30K region around 2027.
But this time, we also have a complicated macro environment.
🌍 GEOPOLITICAL RISK
The Iran conflict, energy prices and global uncertainty are keeping markets nervous. Any escalation could push oil prices higher, fuel inflation and trigger another risk-off reaction across financial markets.
🏦 THE FED'S DECEMBER DECISION
Things are getting even more interesting.
October US inflation came in hotter than expected, while the Reuters poll of 101 economists points to another 25 bps rate hike in December.
Markets are also pricing in the possibility of a larger 50 bps hike.😭
Higher rates, stronger dollar and tighter liquidity are not exactly what #bitcoin bulls want to see.
So, do we really need to prepare for $30K?
My view: I won't rule it out, but I won't call it inevitable either.
If geopolitical tensions escalate and the Fed keeps tightening, Bitcoin could face another brutal correction.
But if inflation cools, tensions ease and monetary conditions improve, this bearish scenario could fail completely.
Remember, the chart shows a possibility, not a promise.
Would you start accumulating at $50K, $40K or wait for $30K?
Let's hear your thoughts. 👁️
{future}(BTCUSDT)
$BTC to $30K: Is It Really Going to Happen? 👀
#Bitcoin is trading around $67K. But what if the next major destination is not $100K... but $30K?
Look at this monthly chart.
Bitcoin has experienced some brutal corrections after previous cycle peaks:
🔻 2017–2018: -84%
🔻 2021–2022: -77%
🔻 2025–2026: Could history repeat with another -75% correction?
Bitcoin previously reached around $126K. A 75% drop from there would bring #BTC close to $30K.
And there's something interesting about the green trendline. It connects major historical cycle bottoms, and its projected path points toward the $30K region around 2027.
But this time, we also have a complicated macro environment.
🌍 GEOPOLITICAL RISK
The Iran conflict, energy prices and global uncertainty are keeping markets nervous. Any escalation could push oil prices higher, fuel inflation and trigger another risk-off reaction across financial markets.
🏦 THE FED'S DECEMBER DECISION
Things are getting even more interesting.
October US inflation came in hotter than expected, while the Reuters poll of 101 economists points to another 25 bps rate hike in December.
Markets are also pricing in the possibility of a larger 50 bps hike.😭
Higher rates, stronger dollar and tighter liquidity are not exactly what #bitcoin bulls want to see.
So, do we really need to prepare for $30K?
My view: I won't rule it out, but I won't call it inevitable either.
If geopolitical tensions escalate and the Fed keeps tightening, Bitcoin could face another brutal correction.
But if inflation cools, tensions ease and monetary conditions improve, this bearish scenario could fail completely.
Remember, the chart shows a possibility, not a promise.
Would you start accumulating at $50K, $40K or wait for $30K?
Let's hear your thoughts. 👁️
#Bitcoin is trading around $67K. But what if the next major destination is not $100K... but $30K?
Look at this monthly chart.
Bitcoin has experienced some brutal corrections after previous cycle peaks:
🔻 2017–2018: -84%
🔻 2021–2022: -77%
🔻 2025–2026: Could history repeat with another -75% correction?
Bitcoin previously reached around $126K. A 75% drop from there would bring #BTC close to $30K.
And there's something interesting about the green trendline. It connects major historical cycle bottoms, and its projected path points toward the $30K region around 2027.
But this time, we also have a complicated macro environment.
🌍 GEOPOLITICAL RISK
The Iran conflict, energy prices and global uncertainty are keeping markets nervous. Any escalation could push oil prices higher, fuel inflation and trigger another risk-off reaction across financial markets.
🏦 THE FED'S DECEMBER DECISION
Things are getting even more interesting.
October US inflation came in hotter than expected, while the Reuters poll of 101 economists points to another 25 bps rate hike in December.
Markets are also pricing in the possibility of a larger 50 bps hike.😭
Higher rates, stronger dollar and tighter liquidity are not exactly what #bitcoin bulls want to see.
So, do we really need to prepare for $30K?
My view: I won't rule it out, but I won't call it inevitable either.
If geopolitical tensions escalate and the Fed keeps tightening, Bitcoin could face another brutal correction.
But if inflation cools, tensions ease and monetary conditions improve, this bearish scenario could fail completely.
Remember, the chart shows a possibility, not a promise.
Would you start accumulating at $50K, $40K or wait for $30K?
Let's hear your thoughts. 👁️
Trader M08:
Binance spot puts the cycle high at 126,200 in October 2025 and the low so far at 57,800 in July, about 54% down. A 75% cut from that high lands near 31,500, which is still another 53% below today's 67K. I'd watch the June and July lows near 58K first, since the market already defended that zone once.
1
5
2.3k

🚨 More than half of active $BTC is now underwater.
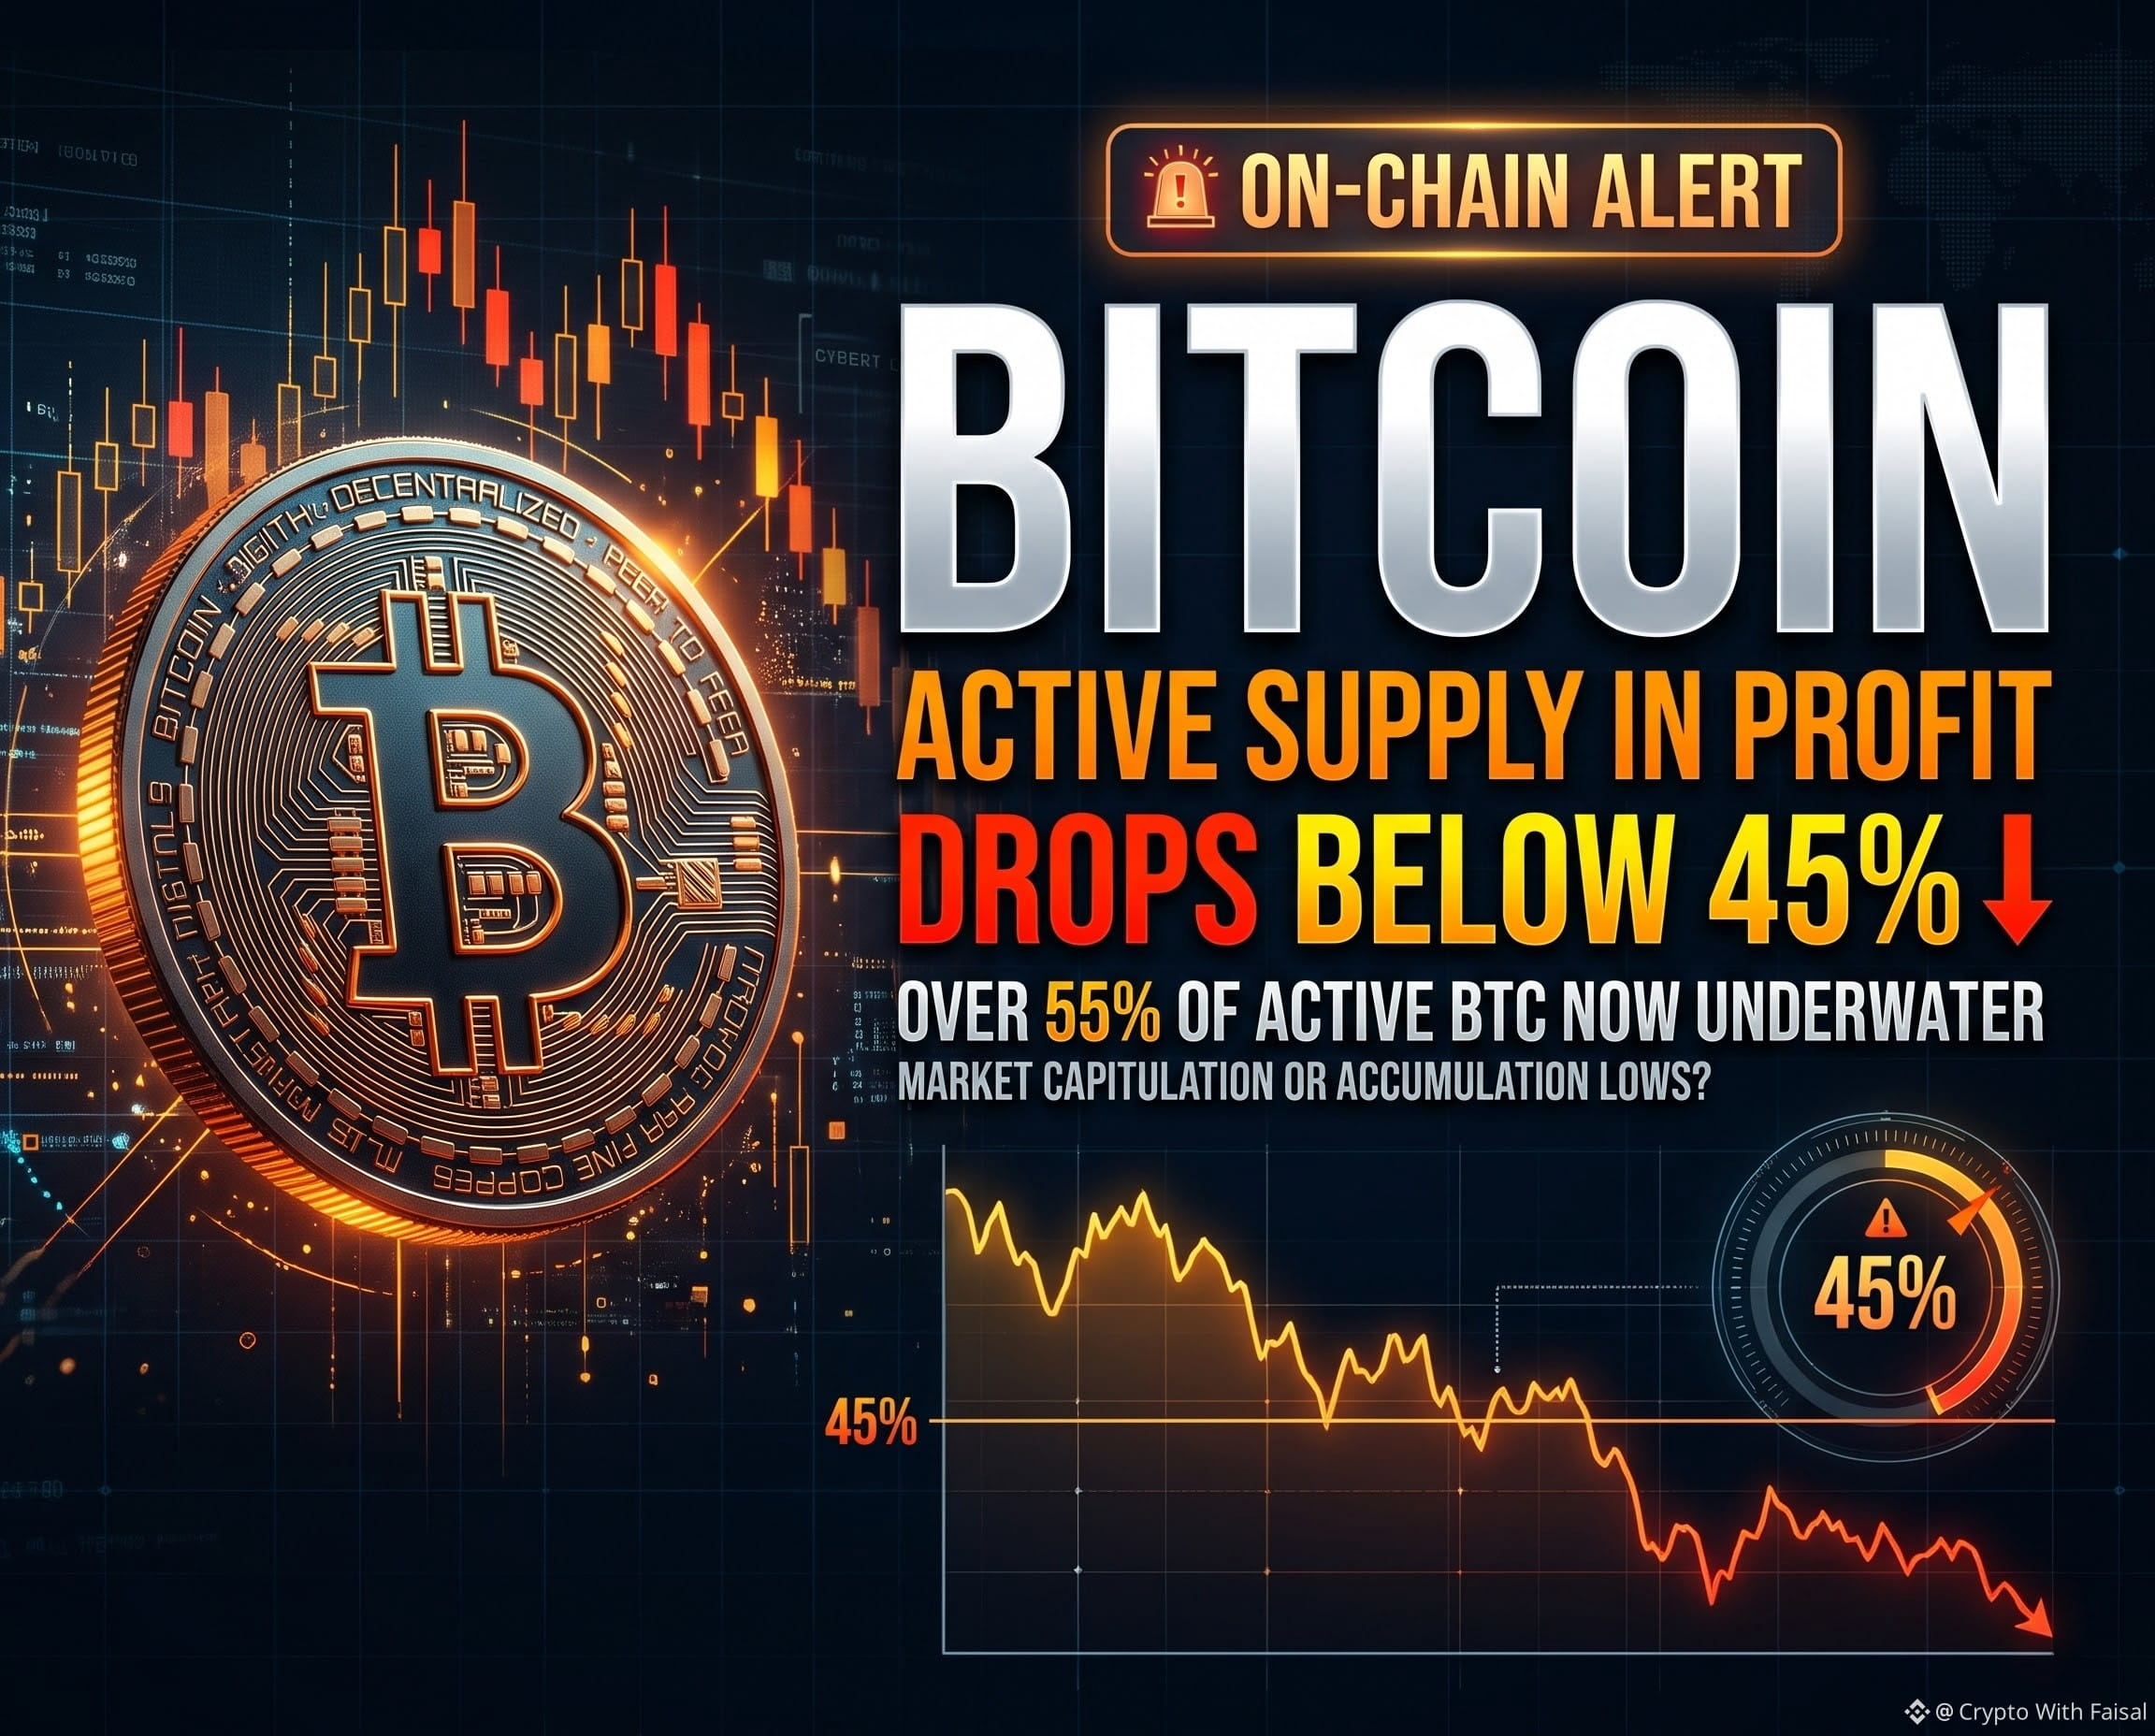
Fresh on-chain data from analyst Darkfost confirms that less than 45% of Bitcoin’s active supply is currently in profit.
What the data shows:
• Dormant coins excluded: This metric strips out BTC untouched for 10+ years (illiquid/lost coins), focusing strictly on active market holders.
• The pain shift: With BTC trading near $67,000—its lowest level since August—addresses holding at a loss now outnumber those in profit.
• Historical playbook: Readings near 100% warn of overheated tops. Readings dropping below 40% have historically aligned with late-stage correction lows and contrarian accumulation.
Trader take:
We are entering the capitulation-watch zone. Weak hands feel maximum pressure here, while disciplined capital watches for seller exhaustion rather than chasing green candles. Keep the 40% threshold on your radar—not as a blind buy trigger, but as a key gauge of downside momentum.
Are you scaling in here or waiting for sub-40% confirmation? Drop your plan below 👇
$AKE
{future}(AKEUSDT)
$SHELL
{future}(SHELLUSDT)
{future}(BTCUSDT)
#Bitcoin #Onchain #MarketUpdate #bitcoinactivesupplyinprofitdropsbelow45%
🚨 More than half of active $BTC is now underwater.
Fresh on-chain data from analyst Darkfost confirms that less than 45% of Bitcoin’s active supply is currently in profit.
What the data shows:
• Dormant coins excluded: This metric strips out BTC untouched for 10+ years (illiquid/lost coins), focusing strictly on active market holders.
• The pain shift: With BTC trading near $67,000—its lowest level since August—addresses holding at a loss now outnumber those in profit.
• Historical playbook: Readings near 100% warn of overheated tops. Readings dropping below 40% have historically aligned with late-stage correction lows and contrarian accumulation.
Trader take:
We are entering the capitulation-watch zone. Weak hands feel maximum pressure here, while disciplined capital watches for seller exhaustion rather than chasing green candles. Keep the 40% threshold on your radar—not as a blind buy trigger, but as a key gauge of downside momentum.
Are you scaling in here or waiting for sub-40% confirmation? Drop your plan below 👇
$AKE
$SHELL
#Bitcoin #Onchain #MarketUpdate #bitcoinactivesupplyinprofitdropsbelow45%
Fresh on-chain data from analyst Darkfost confirms that less than 45% of Bitcoin’s active supply is currently in profit.
What the data shows:
• Dormant coins excluded: This metric strips out BTC untouched for 10+ years (illiquid/lost coins), focusing strictly on active market holders.
• The pain shift: With BTC trading near $67,000—its lowest level since August—addresses holding at a loss now outnumber those in profit.
• Historical playbook: Readings near 100% warn of overheated tops. Readings dropping below 40% have historically aligned with late-stage correction lows and contrarian accumulation.
Trader take:
We are entering the capitulation-watch zone. Weak hands feel maximum pressure here, while disciplined capital watches for seller exhaustion rather than chasing green candles. Keep the 40% threshold on your radar—not as a blind buy trigger, but as a key gauge of downside momentum.
Are you scaling in here or waiting for sub-40% confirmation? Drop your plan below 👇
$AKE
$SHELL
#Bitcoin #Onchain #MarketUpdate #bitcoinactivesupplyinprofitdropsbelow45%
Danilo Vence:
Soma zero...
2
5
3.4k

·
--
🚨 BITCOIN TOUCHES THE 200-WEEK MOVING AVERAGE — IS THE MARKET IN TROUBLE? 📉
Bitcoin briefly dropped to $67,568, slipping below the key 200-week moving average near $68K, before bouncing back towards $68,750. This has put traders on high alert! 👀
📊 What’s Happening?
💥 Reports suggest that more than $1.3 billion in leveraged long positions were liquidated, adding heavy selling pressure to the market.
📉 Why Is the 200-Week MA Important?
The 200-week moving average is a major long-term indicator that many Bitcoin traders watch to assess the broader market trend. A brief dip below it does not automatically confirm a breakdown. The weekly candle close will be especially important.
⚠️ What Are Traders Watching Now?
• Whether BTC can reclaim and hold above the $68K zone.
• Whether the recent bounce has enough strength to continue.
• Whether more leveraged positions could face liquidation if volatility continues.
What's your view, frnd? Is $67K a potential bottom, or could BTC see another drop before recovering!💥
$AKE -$SHELL - $BTC
{future}(AKEUSDT)
{future}(SHELLUSDT)
{future}(BTCUSDT)
#Bitcoin #CryptoMarketAlert
#bitcoinbreaksbelow200weekmovingaverage
"Do you think Bitcoin has found its bottom at $67K"!?⚡
🚨 BITCOIN TOUCHES THE 200-WEEK MOVING AVERAGE — IS THE MARKET IN TROUBLE? 📉
Bitcoin briefly dropped to $67,568, slipping below the key 200-week moving average near $68K, before bouncing back towards $68,750. This has put traders on high alert! 👀
📊 What’s Happening?
💥 Reports suggest that more than $1.3 billion in leveraged long positions were liquidated, adding heavy selling pressure to the market.
📉 Why Is the 200-Week MA Important?
The 200-week moving average is a major long-term indicator that many Bitcoin traders watch to assess the broader market trend. A brief dip below it does not automatically confirm a breakdown. The weekly candle close will be especially important.
⚠️ What Are Traders Watching Now?
• Whether BTC can reclaim and hold above the $68K zone.
• Whether the recent bounce has enough strength to continue.
• Whether more leveraged positions could face liquidation if volatility continues.
What's your view, frnd? Is $67K a potential bottom, or could BTC see another drop before recovering!💥
$AKE -$SHELL - $BTC
#Bitcoin #CryptoMarketAlert
#bitcoinbreaksbelow200weekmovingaverage
"Do you think Bitcoin has found its bottom at $67K"!?⚡
Bitcoin briefly dropped to $67,568, slipping below the key 200-week moving average near $68K, before bouncing back towards $68,750. This has put traders on high alert! 👀
📊 What’s Happening?
💥 Reports suggest that more than $1.3 billion in leveraged long positions were liquidated, adding heavy selling pressure to the market.
📉 Why Is the 200-Week MA Important?
The 200-week moving average is a major long-term indicator that many Bitcoin traders watch to assess the broader market trend. A brief dip below it does not automatically confirm a breakdown. The weekly candle close will be especially important.
⚠️ What Are Traders Watching Now?
• Whether BTC can reclaim and hold above the $68K zone.
• Whether the recent bounce has enough strength to continue.
• Whether more leveraged positions could face liquidation if volatility continues.
What's your view, frnd? Is $67K a potential bottom, or could BTC see another drop before recovering!💥
$AKE -$SHELL - $BTC
#Bitcoin #CryptoMarketAlert
#bitcoinbreaksbelow200weekmovingaverage
"Do you think Bitcoin has found its bottom at $67K"!?⚡
🟢 Yes — $67K Is the Bottom 🚀
🔴 No — More Downside Ahead 📉
21 hr(s) left
3
477


BITCOIN UNDER HEAVY SELLING PRESSURE — BEARS ARE IN CONTROL
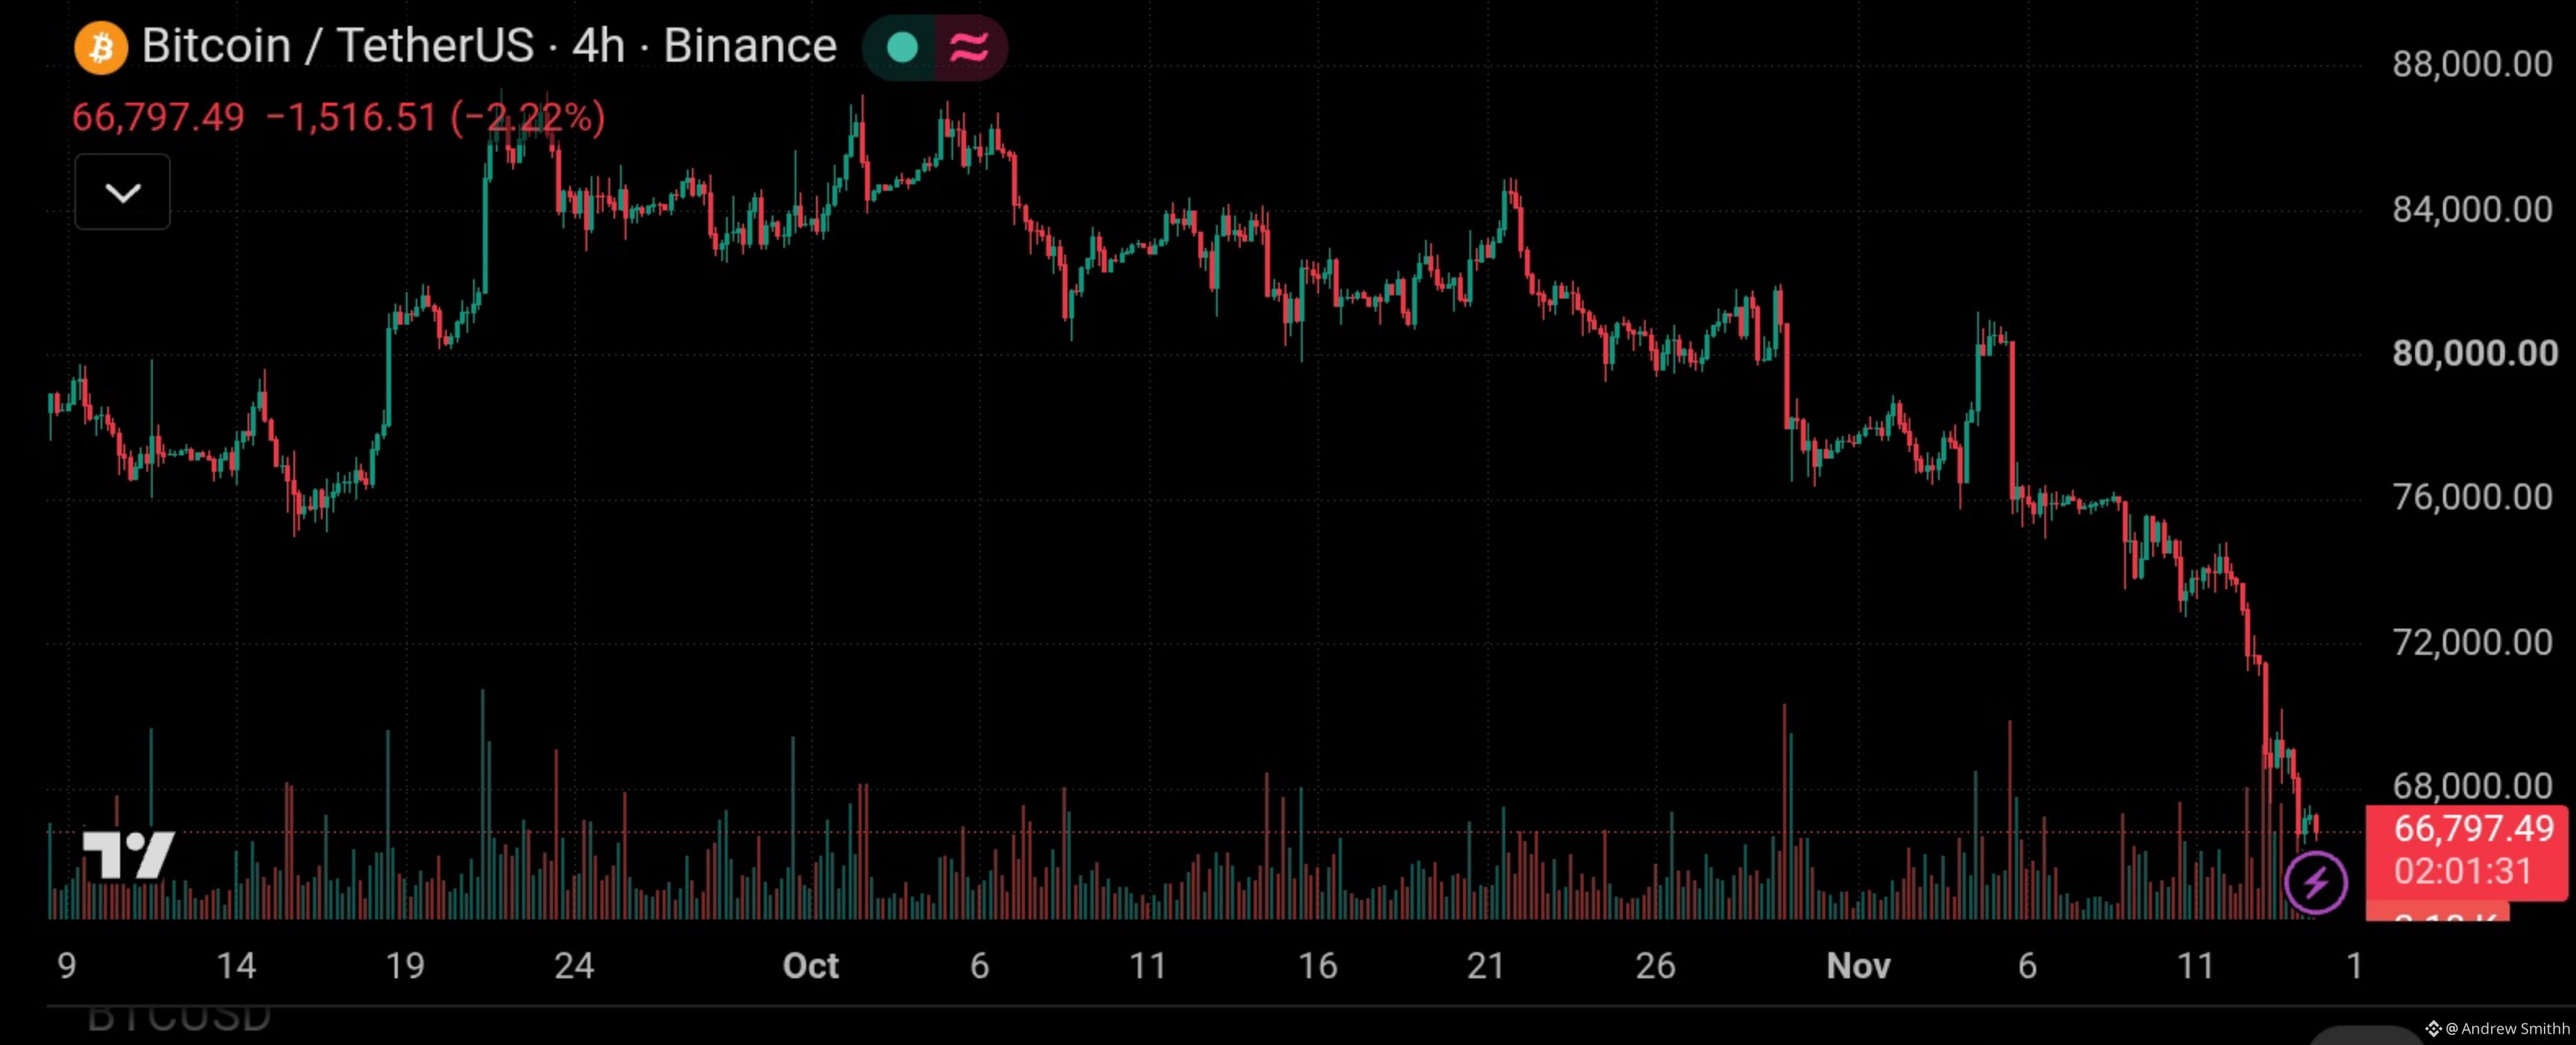
$BTC has taken another sharp hit, dropping to around $66,797 on the 4H chart, down approximately 2.22% at the time of the screenshot.
The technical picture is becoming increasingly bearish.
📉 What the chart tells us:
• BTC continues forming lower highs and lower lows.
• The $72,000 support zone has already given way.
• Price has now slipped below the important $68,000 level.
• Selling volume has increased during the latest breakdown, showing strong bearish pressure.
Key levels to watch:
🔴 Resistance: $68,000 – $72,000
🔴 Next resistance: $76,000
🟢 Immediate area to monitor: $66,000 – $65,000
What comes next?
Bulls need to reclaim $68K and establish support above it to improve the short-term outlook. Otherwise, further downside remains a possibility.
The broader market pressure is also significant, with ETF outflows, heavy liquidations and macroeconomic uncertainty weighing on sentiment.
#Bitcoin #BTC #CryptoMarket
BITCOIN UNDER HEAVY SELLING PRESSURE — BEARS ARE IN CONTROL
$BTC has taken another sharp hit, dropping to around $66,797 on the 4H chart, down approximately 2.22% at the time of the screenshot.
The technical picture is becoming increasingly bearish.
📉 What the chart tells us:
• BTC continues forming lower highs and lower lows.
• The $72,000 support zone has already given way.
• Price has now slipped below the important $68,000 level.
• Selling volume has increased during the latest breakdown, showing strong bearish pressure.
Key levels to watch:
🔴 Resistance: $68,000 – $72,000
🔴 Next resistance: $76,000
🟢 Immediate area to monitor: $66,000 – $65,000
What comes next?
Bulls need to reclaim $68K and establish support above it to improve the short-term outlook. Otherwise, further downside remains a possibility.
The broader market pressure is also significant, with ETF outflows, heavy liquidations and macroeconomic uncertainty weighing on sentiment.
#Bitcoin #BTC #CryptoMarket
$BTC has taken another sharp hit, dropping to around $66,797 on the 4H chart, down approximately 2.22% at the time of the screenshot.
The technical picture is becoming increasingly bearish.
📉 What the chart tells us:
• BTC continues forming lower highs and lower lows.
• The $72,000 support zone has already given way.
• Price has now slipped below the important $68,000 level.
• Selling volume has increased during the latest breakdown, showing strong bearish pressure.
Key levels to watch:
🔴 Resistance: $68,000 – $72,000
🔴 Next resistance: $76,000
🟢 Immediate area to monitor: $66,000 – $65,000
What comes next?
Bulls need to reclaim $68K and establish support above it to improve the short-term outlook. Otherwise, further downside remains a possibility.
The broader market pressure is also significant, with ETF outflows, heavy liquidations and macroeconomic uncertainty weighing on sentiment.
#Bitcoin #BTC #CryptoMarket
Stuart Crown:
ETF outflows and liquidations are adding more pressure to an already weak market.
2
4
404

·
--
Article
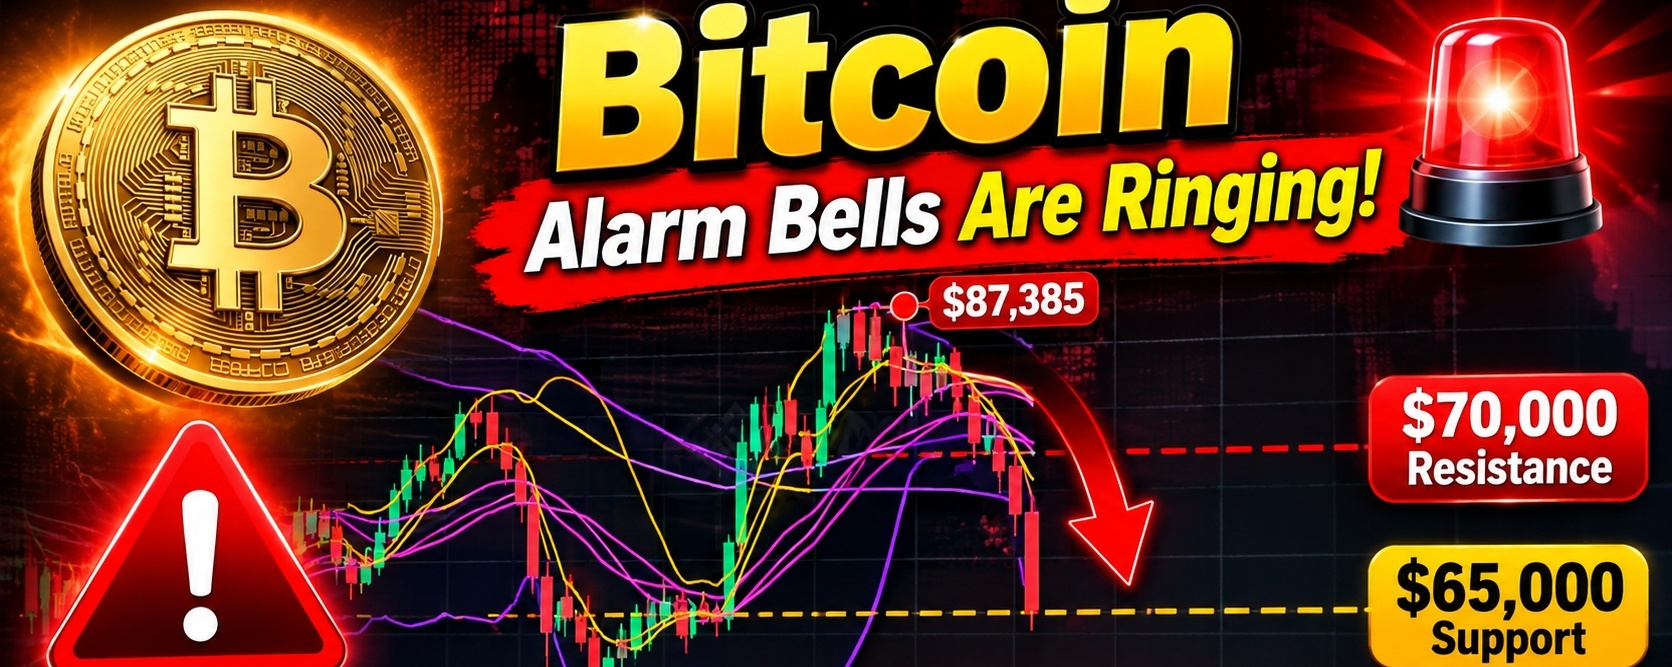
🚨 Guys, the alarm bells are ringing! 🔔$BTC 😱😱😱😱
Guys, what is happening with Bitcoin right now deserves our attention. The coin has lost the $70,000 level and has fallen to around $67,000 following a strong selling wave that has lasted for several weeks. Looking at the 3-day chart, we can see that the price has broken below several important moving averages, while the MACD indicator remains in negative territory. In my view, this is not just an ordinary market movement that we can ignore; it is a sign that sellers are still controlling the market.
And this is not just about technical analysis; there are real economic pressures behind this decline. US inflation data for October came in higher than expected, bringing back concerns about interest rate hikes by the Federal Reserve, alongside rising US Treasury yields and a stronger dollar. In addition, spot Bitcoin ETFs have experienced significant outflows, reaching approximately $1.57 billion over five trading sessions, while leveraged long positions have faced a wave of liquidations. All these factors make a recovery more challenging at the moment.
From a technical perspective, I believe the $66,400–$65,000 zone has become one of the most important areas to watch. Losing this range could open the door toward $62,700, and possibly $60,000 if selling pressure continues. On the other hand, if Bitcoin manages to reclaim $70,000, then break above $72,000 and hold above it, we could see a rebound toward $74,000 and then $77,500. Here, we must distinguish between a temporary bounce and a genuine trend reversal.
As for the outlook, the latest CoinShares report places the base-case scenario within a broad range of $60,000 to $90,000, with sideways movement remaining a possibility unless a strong catalyst changes the market's direction. Meanwhile, StoneX analysis highlights $65,000 as an important support level. Personally, I would not rush into buying simply because the price has dropped, and I would not consider every rebound the beginning of a new bull market. I want to see liquidity returning, institutional fund flows improving, and key resistance levels being reclaimed before changing my market outlook.
Here is the question I want to ask you: Do you think Bitcoin is preparing for a strong rebound before the end of November, or are we facing another wave of selling that could take it down to $60,000 or even lower? 📉📈
#Bitcoin #BTC #CryptoMarket
{spot}(BTCUSDT)
🚨 Guys, the alarm bells are ringing! 🔔
$BTC 😱😱😱😱
Guys, what is happening with Bitcoin right now deserves our attention. The coin has lost the $70,000 level and has fallen to around $67,000 following a strong selling wave that has lasted for several weeks. Looking at the 3-day chart, we can see that the price has broken below several important moving averages, while the MACD indicator remains in negative territory. In my view, this is not just an ordinary market movement that we can ignore; it is a sign that sellers are still controlling the market.
And this is not just about technical analysis; there are real economic pressures behind this decline. US inflation data for October came in higher than expected, bringing back concerns about interest rate hikes by the Federal Reserve, alongside rising US Treasury yields and a stronger dollar. In addition, spot Bitcoin ETFs have experienced significant outflows, reaching approximately $1.57 billion over five trading sessions, while leveraged long positions have faced a wave of liquidations. All these factors make a recovery more challenging at the moment.
From a technical perspective, I believe the $66,400–$65,000 zone has become one of the most important areas to watch. Losing this range could open the door toward $62,700, and possibly $60,000 if selling pressure continues. On the other hand, if Bitcoin manages to reclaim $70,000, then break above $72,000 and hold above it, we could see a rebound toward $74,000 and then $77,500. Here, we must distinguish between a temporary bounce and a genuine trend reversal.
As for the outlook, the latest CoinShares report places the base-case scenario within a broad range of $60,000 to $90,000, with sideways movement remaining a possibility unless a strong catalyst changes the market's direction. Meanwhile, StoneX analysis highlights $65,000 as an important support level. Personally, I would not rush into buying simply because the price has dropped, and I would not consider every rebound the beginning of a new bull market. I want to see liquidity returning, institutional fund flows improving, and key resistance levels being reclaimed before changing my market outlook.
Here is the question I want to ask you: Do you think Bitcoin is preparing for a strong rebound before the end of November, or are we facing another wave of selling that could take it down to $60,000 or even lower? 📉📈
#Bitcoin #BTC #CryptoMarket
Guys, what is happening with Bitcoin right now deserves our attention. The coin has lost the $70,000 level and has fallen to around $67,000 following a strong selling wave that has lasted for several weeks. Looking at the 3-day chart, we can see that the price has broken below several important moving averages, while the MACD indicator remains in negative territory. In my view, this is not just an ordinary market movement that we can ignore; it is a sign that sellers are still controlling the market.
And this is not just about technical analysis; there are real economic pressures behind this decline. US inflation data for October came in higher than expected, bringing back concerns about interest rate hikes by the Federal Reserve, alongside rising US Treasury yields and a stronger dollar. In addition, spot Bitcoin ETFs have experienced significant outflows, reaching approximately $1.57 billion over five trading sessions, while leveraged long positions have faced a wave of liquidations. All these factors make a recovery more challenging at the moment.
From a technical perspective, I believe the $66,400–$65,000 zone has become one of the most important areas to watch. Losing this range could open the door toward $62,700, and possibly $60,000 if selling pressure continues. On the other hand, if Bitcoin manages to reclaim $70,000, then break above $72,000 and hold above it, we could see a rebound toward $74,000 and then $77,500. Here, we must distinguish between a temporary bounce and a genuine trend reversal.
As for the outlook, the latest CoinShares report places the base-case scenario within a broad range of $60,000 to $90,000, with sideways movement remaining a possibility unless a strong catalyst changes the market's direction. Meanwhile, StoneX analysis highlights $65,000 as an important support level. Personally, I would not rush into buying simply because the price has dropped, and I would not consider every rebound the beginning of a new bull market. I want to see liquidity returning, institutional fund flows improving, and key resistance levels being reclaimed before changing my market outlook.
Here is the question I want to ask you: Do you think Bitcoin is preparing for a strong rebound before the end of November, or are we facing another wave of selling that could take it down to $60,000 or even lower? 📉📈
#Bitcoin #BTC #CryptoMarket
83

·
--
#whatwilldrivecryptoandstocks’nextrebound?
Stocks bounced this week. Bitcoin didn’t. 📉
$BTC is trading near $67K, below its 200-week MA (~$68K), and this week’s candle is down ~10% with the weekly close still open. $ETH sits under $2K.
Why the split from equities? The Dollar Index is above 103 (19-month high), October CPI ran hot, and spot ETFs have shed nearly $2B in November. CME FedWatch shows ~90% odds of a 25bp Fed hike on Dec 9.
What I’m watching into the weekly close (Mon 00:00 UTC):
🔹 Close back above ~$68K = failed breakdown, bulls stay in play
🔹 Close below = $63–66K is the next zone, where BTC based before its August breakout
A real rebound then needs DXY cooling, ETF flows turning positive, and a calm Nvidia print on Nov 17 ($NVDA is the AI-risk barometer).
Extreme Fear and $1.3B in liquidations show leverage is being flushed, but that isn’t a confirmed bottom.
Which matters more for the bounce: Fed, ETFs or Nvidia? 👇
Not financial advice.
#Bitcoin #Fed #CryptoMarket
{future}(NVDAUSDT)
{future}(ETHUSDT)
{future}(BTCUSDT)
#whatwilldrivecryptoandstocks’nextrebound?
Stocks bounced this week. Bitcoin didn’t. 📉
$BTC is trading near $67K, below its 200-week MA (~$68K), and this week’s candle is down ~10% with the weekly close still open. $ETH sits under $2K.
Why the split from equities? The Dollar Index is above 103 (19-month high), October CPI ran hot, and spot ETFs have shed nearly $2B in November. CME FedWatch shows ~90% odds of a 25bp Fed hike on Dec 9.
What I’m watching into the weekly close (Mon 00:00 UTC):
🔹 Close back above ~$68K = failed breakdown, bulls stay in play
🔹 Close below = $63–66K is the next zone, where BTC based before its August breakout
A real rebound then needs DXY cooling, ETF flows turning positive, and a calm Nvidia print on Nov 17 ($NVDA is the AI-risk barometer).
Extreme Fear and $1.3B in liquidations show leverage is being flushed, but that isn’t a confirmed bottom.
Which matters more for the bounce: Fed, ETFs or Nvidia? 👇
Not financial advice.
#Bitcoin #Fed #CryptoMarket
Stocks bounced this week. Bitcoin didn’t. 📉
$BTC is trading near $67K, below its 200-week MA (~$68K), and this week’s candle is down ~10% with the weekly close still open. $ETH sits under $2K.
Why the split from equities? The Dollar Index is above 103 (19-month high), October CPI ran hot, and spot ETFs have shed nearly $2B in November. CME FedWatch shows ~90% odds of a 25bp Fed hike on Dec 9.
What I’m watching into the weekly close (Mon 00:00 UTC):
🔹 Close back above ~$68K = failed breakdown, bulls stay in play
🔹 Close below = $63–66K is the next zone, where BTC based before its August breakout
A real rebound then needs DXY cooling, ETF flows turning positive, and a calm Nvidia print on Nov 17 ($NVDA is the AI-risk barometer).
Extreme Fear and $1.3B in liquidations show leverage is being flushed, but that isn’t a confirmed bottom.
Which matters more for the bounce: Fed, ETFs or Nvidia? 👇
Not financial advice.
#Bitcoin #Fed #CryptoMarket

majspace:
For me it's the dollar and ETF flows first — Nvidia is just one print, and a strong dollar keeps pressure on everything. A weekly close back above $68K would change the picture for me.
4
2
5.1k

·
--
🚨 CRYPTO IS IN FREE FALL. AND HONESTLY, IT'S GETTING FRUSTRATING.
Every time the market looks ready to recover, another wave of selling hits.
BTC falls. ETH falls. Altcoins bleed.
📉 Fear & Greed Index: 13/100 — EXTREME FEAR.
And the worst part isn't even the red numbers.
It's not knowing what comes next.
Buy the dip? Hold? Cut losses? Or just stop watching the charts?
I'm tired of hearing "the bottom is in" every time we get another red candle.
I don't know where the bottom is. And I'm not going to pretend I do.
🔥 What do YOU think?
When will the market finally recover?
Are we close to the bottom, or is the worst still ahead?
And what are you doing right now — buying, holding, selling, or just waiting?
Let's hear some real opinions, not another round of empty predictions.
$BTC $ETH $SOL
#crypto #Bitcoin #Ethereum #ANALYZOR
Data over hype. Strategy over emotion.
🚨 CRYPTO IS IN FREE FALL. AND HONESTLY, IT'S GETTING FRUSTRATING.
Every time the market looks ready to recover, another wave of selling hits.
BTC falls. ETH falls. Altcoins bleed.
📉 Fear & Greed Index: 13/100 — EXTREME FEAR.
And the worst part isn't even the red numbers.
It's not knowing what comes next.
Buy the dip? Hold? Cut losses? Or just stop watching the charts?
I'm tired of hearing "the bottom is in" every time we get another red candle.
I don't know where the bottom is. And I'm not going to pretend I do.
🔥 What do YOU think?
When will the market finally recover?
Are we close to the bottom, or is the worst still ahead?
And what are you doing right now — buying, holding, selling, or just waiting?
Let's hear some real opinions, not another round of empty predictions.
$BTC $ETH $SOL
#crypto #Bitcoin #Ethereum #ANALYZOR
Data over hype. Strategy over emotion.
Every time the market looks ready to recover, another wave of selling hits.
BTC falls. ETH falls. Altcoins bleed.
📉 Fear & Greed Index: 13/100 — EXTREME FEAR.
And the worst part isn't even the red numbers.
It's not knowing what comes next.
Buy the dip? Hold? Cut losses? Or just stop watching the charts?
I'm tired of hearing "the bottom is in" every time we get another red candle.
I don't know where the bottom is. And I'm not going to pretend I do.
🔥 What do YOU think?
When will the market finally recover?
Are we close to the bottom, or is the worst still ahead?
And what are you doing right now — buying, holding, selling, or just waiting?
Let's hear some real opinions, not another round of empty predictions.
$BTC $ETH $SOL
#crypto #Bitcoin #Ethereum #ANALYZOR
Data over hype. Strategy over emotion.
264

·
--
Bearish
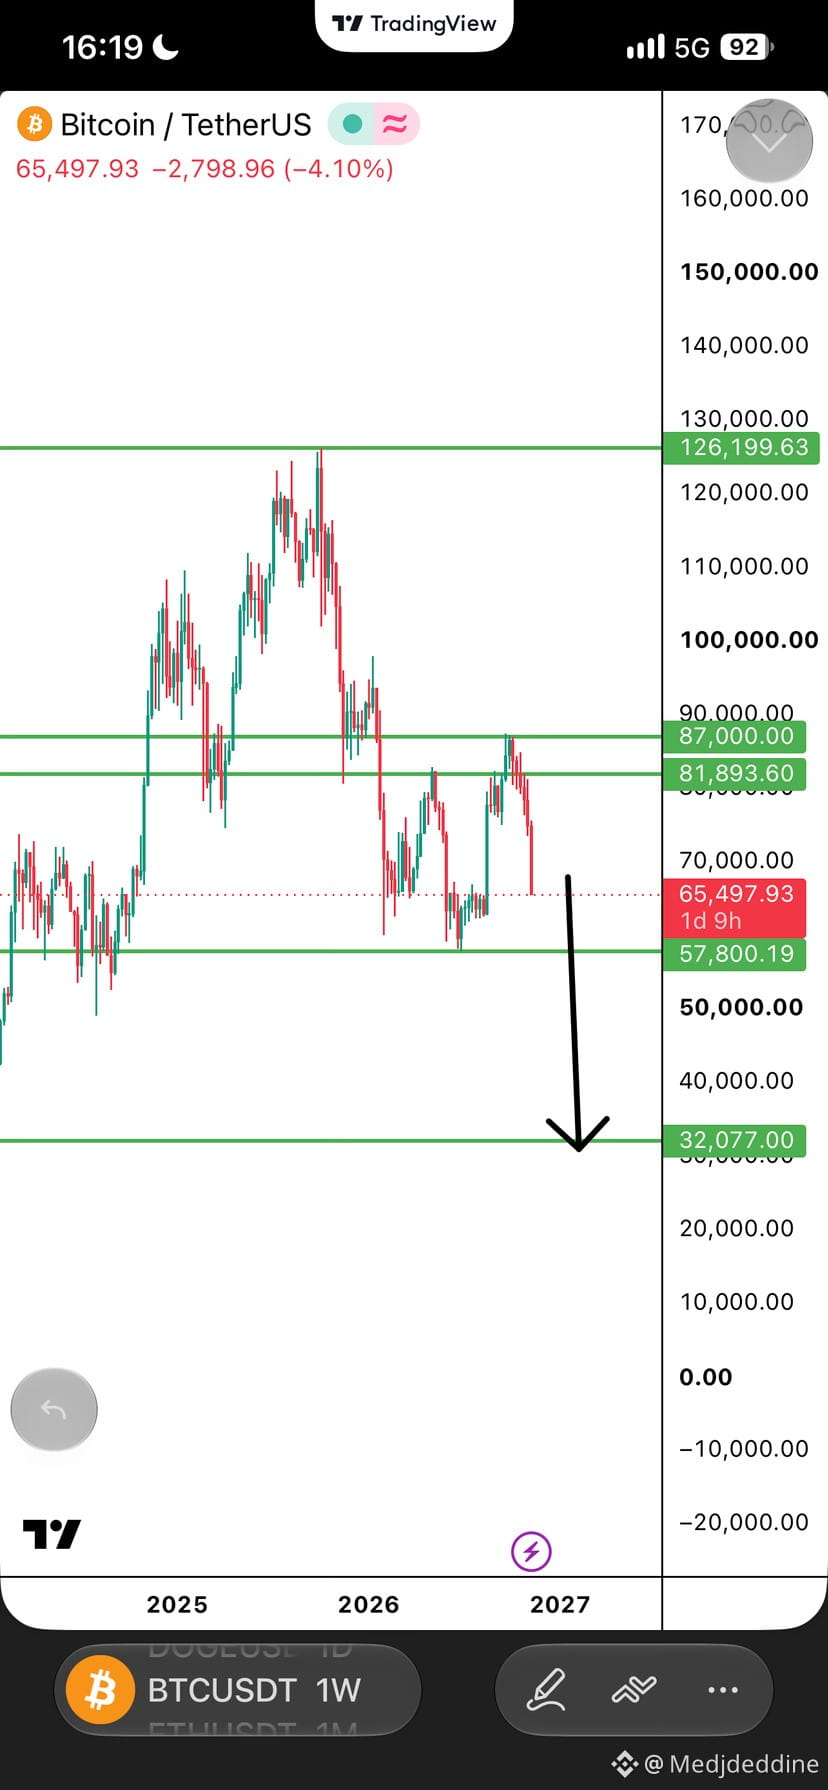
🚨 Is $BTC Heading to $32K? 🐻
Everyone is waiting for a bounce… but the weekly chart is screaming something else 👀
📉 ATH: $126K
📉 Rejected at $87K: a clear LOWER HIGH
📉 Now: $65.5K and falling
History says: BTC dropped -77% and -84% in previous bear markets.
-75% from $126K = $32K 🎯
⚠️ The key level: $57.8K
Weekly close below it → $32K is on the table
Hold above it → bulls get one more chance
I could be wrong, nothing is guaranteed in crypto.
But I'm not buying the dip yet 🙅♂️
🔥 Bulls vs Bears: where do YOU think $BTC goes first? $87K or $32K? 👇
#BTC #bitcoin #crypto #BinanceSquare
{spot}(BTCUSDT)
🚨 Is $BTC Heading to $32K? 🐻
Everyone is waiting for a bounce… but the weekly chart is screaming something else 👀
📉 ATH: $126K
📉 Rejected at $87K: a clear LOWER HIGH
📉 Now: $65.5K and falling
History says: BTC dropped -77% and -84% in previous bear markets.
-75% from $126K = $32K 🎯
⚠️ The key level: $57.8K
Weekly close below it → $32K is on the table
Hold above it → bulls get one more chance
I could be wrong, nothing is guaranteed in crypto.
But I'm not buying the dip yet 🙅♂️
🔥 Bulls vs Bears: where do YOU think $BTC goes first? $87K or $32K? 👇
#BTC #bitcoin #crypto #BinanceSquare
Everyone is waiting for a bounce… but the weekly chart is screaming something else 👀
📉 ATH: $126K
📉 Rejected at $87K: a clear LOWER HIGH
📉 Now: $65.5K and falling
History says: BTC dropped -77% and -84% in previous bear markets.
-75% from $126K = $32K 🎯
⚠️ The key level: $57.8K
Weekly close below it → $32K is on the table
Hold above it → bulls get one more chance
I could be wrong, nothing is guaranteed in crypto.
But I'm not buying the dip yet 🙅♂️
🔥 Bulls vs Bears: where do YOU think $BTC goes first? $87K or $32K? 👇
#BTC #bitcoin #crypto #BinanceSquare
243

·
--
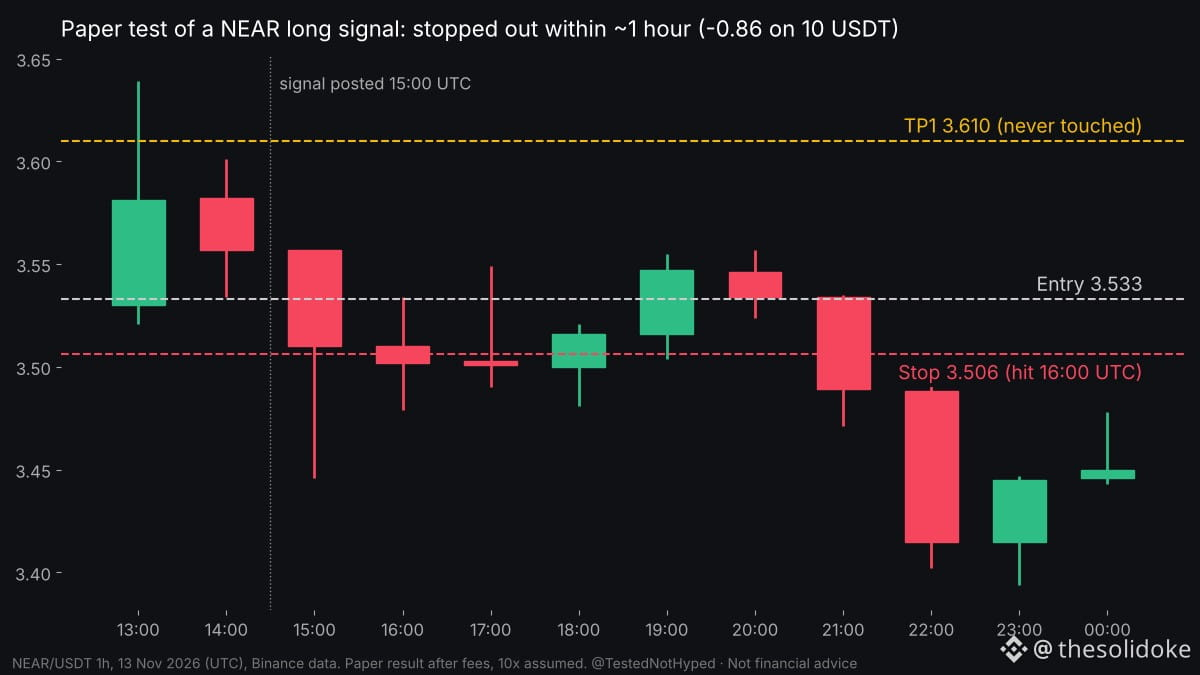
I paper-tested a NEAR long signal from Square: -0.86 USDT on 10 USDT margin, after fees. Stopped out within about an hour.
The levels as posted (13 Nov, 15:00 UTC): entry 3.533, stop 3.506, TP1 3.610, "valid 24h". No leverage stated, so I used 10x.
What the real 1h candles did: the 16:00 UTC candle went through the entry and the stop in the same hour. Highest price after the post: 3.557. TP1 was never touched.
The odd part: on paper this one made sense. Reward about 2.2%, risk about 0.8%, stop well before liquidation. It passed my screen.
Lesson: a stop 0.8% away on a 1h setup sits inside one normal hour's range. Good R:R on paper doesn't help if a single candle can take the stop out.
I'm paper-testing Square signals with 10 USDT each, real Binance prices, fees included. Score so far: 2 closed, 0 wins, -4.90 USDT. Winners get posted too.
How far from entry do you put your stop on a 1h setup?
Not financial advice. Paper results, real Binance prices.
#TradingSignals #FuturesTrading #TradingBots #bitcoin $NEAR
I paper-tested a NEAR long signal from Square: -0.86 USDT on 10 USDT margin, after fees. Stopped out within about an hour.
The levels as posted (13 Nov, 15:00 UTC): entry 3.533, stop 3.506, TP1 3.610, "valid 24h". No leverage stated, so I used 10x.
What the real 1h candles did: the 16:00 UTC candle went through the entry and the stop in the same hour. Highest price after the post: 3.557. TP1 was never touched.
The odd part: on paper this one made sense. Reward about 2.2%, risk about 0.8%, stop well before liquidation. It passed my screen.
Lesson: a stop 0.8% away on a 1h setup sits inside one normal hour's range. Good R:R on paper doesn't help if a single candle can take the stop out.
I'm paper-testing Square signals with 10 USDT each, real Binance prices, fees included. Score so far: 2 closed, 0 wins, -4.90 USDT. Winners get posted too.
How far from entry do you put your stop on a 1h setup?
Not financial advice. Paper results, real Binance prices.
#TradingSignals #FuturesTrading #TradingBots #bitcoin $NEAR
The levels as posted (13 Nov, 15:00 UTC): entry 3.533, stop 3.506, TP1 3.610, "valid 24h". No leverage stated, so I used 10x.
What the real 1h candles did: the 16:00 UTC candle went through the entry and the stop in the same hour. Highest price after the post: 3.557. TP1 was never touched.
The odd part: on paper this one made sense. Reward about 2.2%, risk about 0.8%, stop well before liquidation. It passed my screen.
Lesson: a stop 0.8% away on a 1h setup sits inside one normal hour's range. Good R:R on paper doesn't help if a single candle can take the stop out.
I'm paper-testing Square signals with 10 USDT each, real Binance prices, fees included. Score so far: 2 closed, 0 wins, -4.90 USDT. Winners get posted too.
How far from entry do you put your stop on a 1h setup?
Not financial advice. Paper results, real Binance prices.
#TradingSignals #FuturesTrading #TradingBots #bitcoin $NEAR
467

·
--
Article
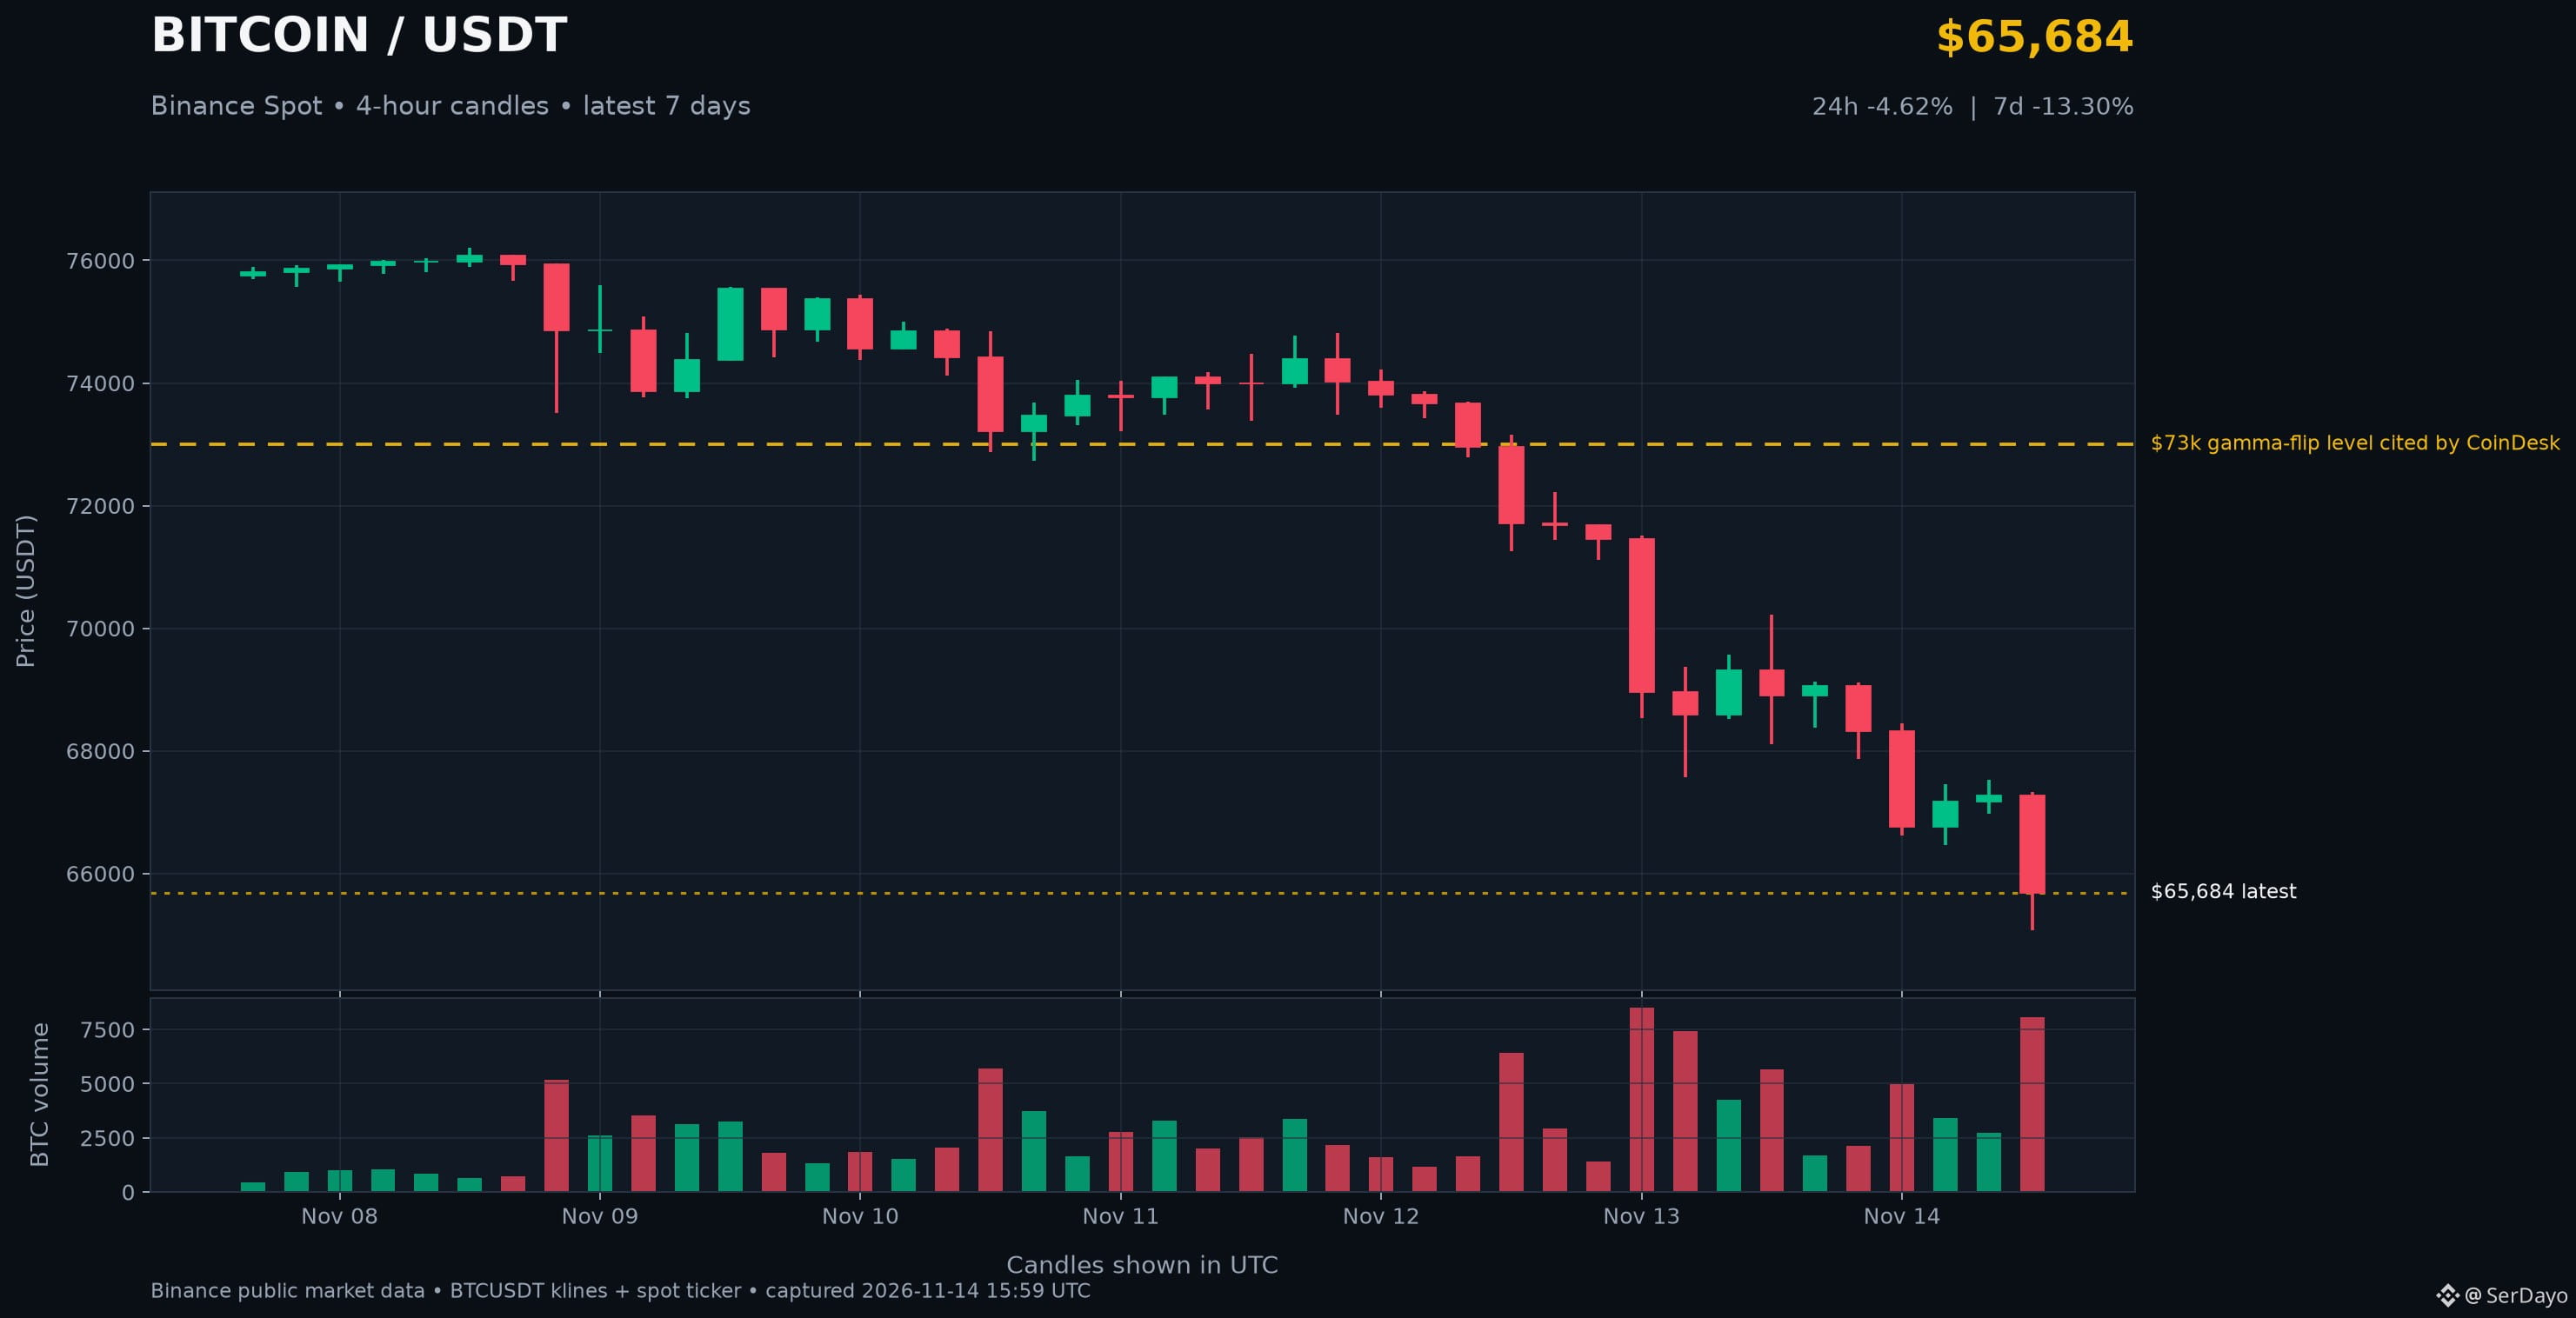
BTC’s downside is getting a volatility assistBitcoin’s weakness is no longer just a spot-chart story. Binance’s BTC/USDT data puts BTC near $65,684 at 15:59 UTC Saturday, down 4.6% over 24 hours and about 13.3% over seven days. The intraday low was roughly $65,067, so the next question is whether buyers can defend that area, not whether one bounce automatically means the low is in.
CoinDesk reported today, citing options data from Greeks.Live, that dealer positioning was in negative gamma across Bitcoin’s then-current range, with a potential flip near $73,000. In plain terms, hedging flows can add to an existing move: dealers may sell into weakness and buy into strength. That is a mechanism, not a price forecast, and the positioning can change as BTC moves and options expire.
For traders, that argues for respecting volatility and waiting for price to confirm. I’d watch whether the $65K area holds, how price behaves on any rebound toward the recent $69K intraday high, and whether volume expands on a reclaim or a breakdown. $ETH is also in the same volatility conversation. The cleanest signal is follow-through, not a headline or a single wick.
#Bitcoin #CryptoMarket #CryptoTrading $BTC $ETH
BTC’s downside is getting a volatility assist
Bitcoin’s weakness is no longer just a spot-chart story. Binance’s BTC/USDT data puts BTC near $65,684 at 15:59 UTC Saturday, down 4.6% over 24 hours and about 13.3% over seven days. The intraday low was roughly $65,067, so the next question is whether buyers can defend that area, not whether one bounce automatically means the low is in.
CoinDesk reported today, citing options data from Greeks.Live, that dealer positioning was in negative gamma across Bitcoin’s then-current range, with a potential flip near $73,000. In plain terms, hedging flows can add to an existing move: dealers may sell into weakness and buy into strength. That is a mechanism, not a price forecast, and the positioning can change as BTC moves and options expire.
For traders, that argues for respecting volatility and waiting for price to confirm. I’d watch whether the $65K area holds, how price behaves on any rebound toward the recent $69K intraday high, and whether volume expands on a reclaim or a breakdown. $ETH is also in the same volatility conversation. The cleanest signal is follow-through, not a headline or a single wick.
#Bitcoin #CryptoMarket #CryptoTrading $BTC $ETH
CoinDesk reported today, citing options data from Greeks.Live, that dealer positioning was in negative gamma across Bitcoin’s then-current range, with a potential flip near $73,000. In plain terms, hedging flows can add to an existing move: dealers may sell into weakness and buy into strength. That is a mechanism, not a price forecast, and the positioning can change as BTC moves and options expire.
For traders, that argues for respecting volatility and waiting for price to confirm. I’d watch whether the $65K area holds, how price behaves on any rebound toward the recent $69K intraday high, and whether volume expands on a reclaim or a breakdown. $ETH is also in the same volatility conversation. The cleanest signal is follow-through, not a headline or a single wick.
#Bitcoin #CryptoMarket #CryptoTrading $BTC $ETH
136
·
--
Bearish
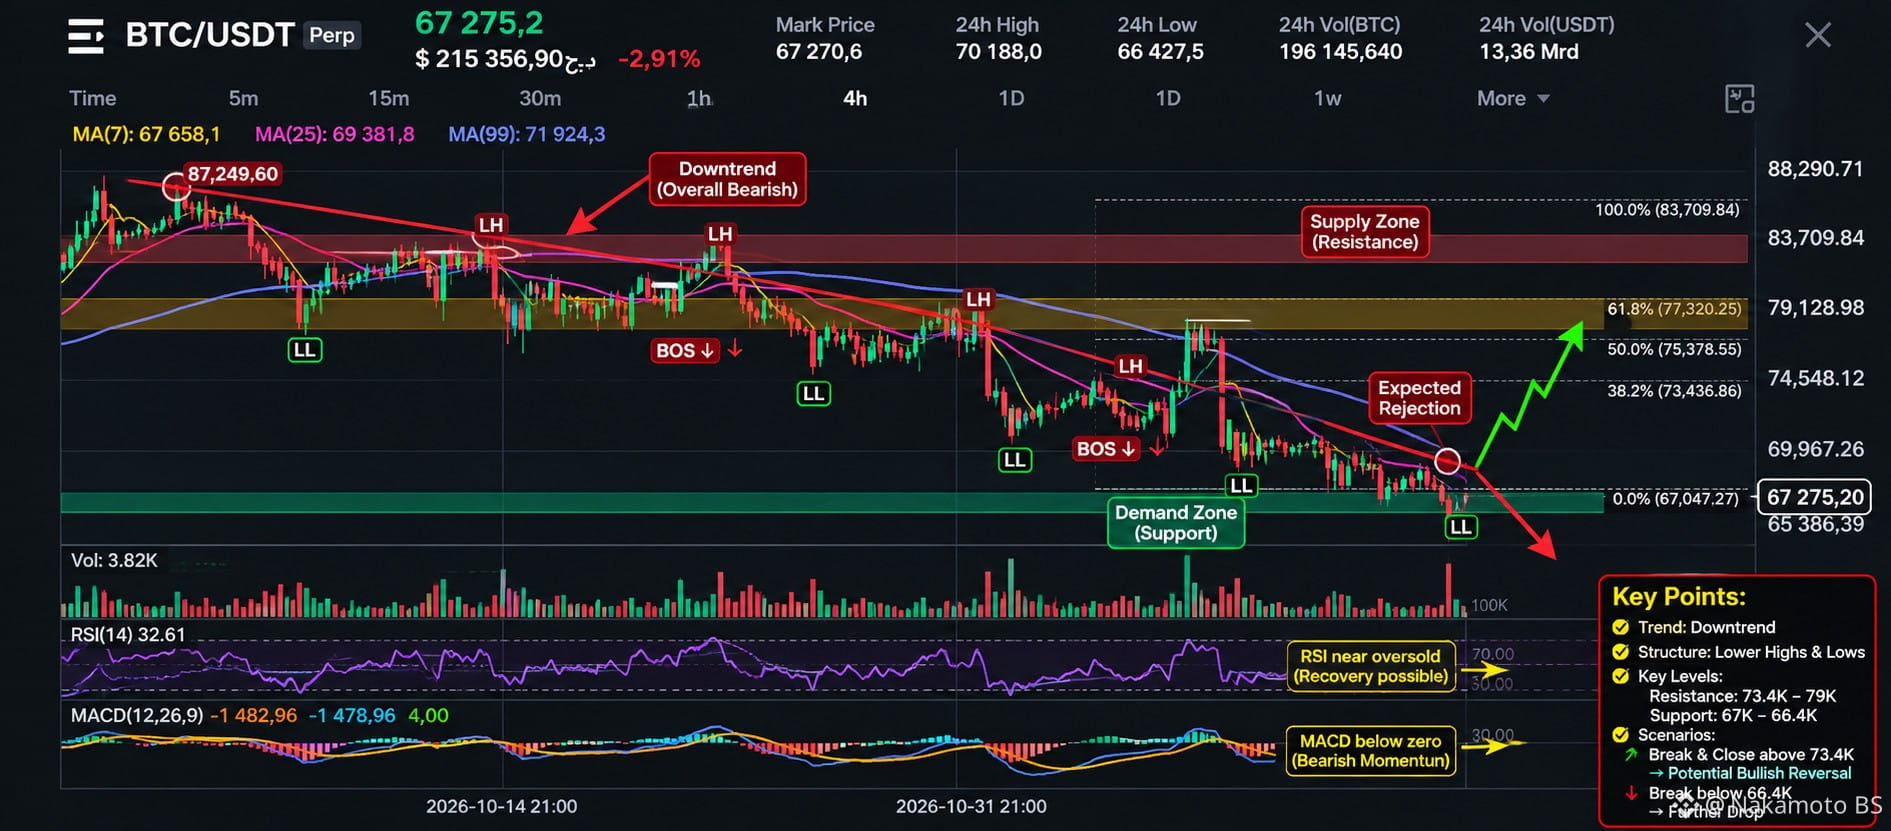
📊 In-Depth Bitcoin Analysis $BTC USDT | Key Indicators and Levels to Watch
I conducted an in-depth analysis of Bitcoin's price action on the 4-hour timeframe, focusing on market structure, overall trend, liquidity zones, support and resistance levels, as well as momentum indicators. Here are the key findings:
📉 Overall Trend:$BTC
The trend remains bearish, with lower highs and lower lows continuing to form, indicating that sellers are still in control.
🎯 Key Levels:$BTC
- Current support: $66,400 – $67,000.
- Next support: $65,386.
- First resistance: $69,967.
- Major resistance: $74,548.
- Strong supply zone: $79,128.
🔍 What Do I See?
- RSI at 32.61, approaching oversold territory.
- MACD below zero, reflecting continued bearish momentum.
- Moving averages indicate that the overall trend remains weak.
👀 What Am I Watching Now?
🟢 A breakout above $73,400 and holding above this level could open the door to a gradual recovery.
🔴 A break below $66,400 could push the price into another downward move.
Conclusion: I don't think rushing into a trade is the best decision right now. I prefer to wait for trend confirmation before making any move. Protecting capital is more important than chasing every market movement.
#BTC #Bitcoin #CryptoAnalysis
{future}(BTCUSDT)
📊 In-Depth Bitcoin Analysis $BTC USDT | Key Indicators and Levels to Watch
I conducted an in-depth analysis of Bitcoin's price action on the 4-hour timeframe, focusing on market structure, overall trend, liquidity zones, support and resistance levels, as well as momentum indicators. Here are the key findings:
📉 Overall Trend:$BTC
The trend remains bearish, with lower highs and lower lows continuing to form, indicating that sellers are still in control.
🎯 Key Levels:$BTC
- Current support: $66,400 – $67,000.
- Next support: $65,386.
- First resistance: $69,967.
- Major resistance: $74,548.
- Strong supply zone: $79,128.
🔍 What Do I See?
- RSI at 32.61, approaching oversold territory.
- MACD below zero, reflecting continued bearish momentum.
- Moving averages indicate that the overall trend remains weak.
👀 What Am I Watching Now?
🟢 A breakout above $73,400 and holding above this level could open the door to a gradual recovery.
🔴 A break below $66,400 could push the price into another downward move.
Conclusion: I don't think rushing into a trade is the best decision right now. I prefer to wait for trend confirmation before making any move. Protecting capital is more important than chasing every market movement.
#BTC #Bitcoin #CryptoAnalysis
I conducted an in-depth analysis of Bitcoin's price action on the 4-hour timeframe, focusing on market structure, overall trend, liquidity zones, support and resistance levels, as well as momentum indicators. Here are the key findings:
📉 Overall Trend:$BTC
The trend remains bearish, with lower highs and lower lows continuing to form, indicating that sellers are still in control.
🎯 Key Levels:$BTC
- Current support: $66,400 – $67,000.
- Next support: $65,386.
- First resistance: $69,967.
- Major resistance: $74,548.
- Strong supply zone: $79,128.
🔍 What Do I See?
- RSI at 32.61, approaching oversold territory.
- MACD below zero, reflecting continued bearish momentum.
- Moving averages indicate that the overall trend remains weak.
👀 What Am I Watching Now?
🟢 A breakout above $73,400 and holding above this level could open the door to a gradual recovery.
🔴 A break below $66,400 could push the price into another downward move.
Conclusion: I don't think rushing into a trade is the best decision right now. I prefer to wait for trend confirmation before making any move. Protecting capital is more important than chasing every market movement.
#BTC #Bitcoin #CryptoAnalysis
24

·
--

Article
Binance Recovers All Stolen Assets Worth $6.30 Billion🚨 Binance Recovers $6.30 Billion - The Biggest Comeback in Crypto!
Crypto history just changed. Binance has fully recovered all $6.30 Billion stolen in the biggest hack ever.
What Happened?
On Oct 29, hackers attacked Binance hot wallets and stole $6.3B in crypto. The attack was linked to North Korea's group TraderTraitor.
How Binance Covered The Loss?
Binance promised users will not lose anything. It used:
- Company Profits
- Emergency Funds
- SAFU Fund
- Futures Insurance Fund
By Nov 12, Binance confirmed on X: All assets fully restored.
Where Did The Money Go?
Hackers used 20,000+ wallets and 65,000+ transactions to hide the funds. US authorities froze over $2.7B and got court approval to seize $1.2B+.
Bitcoin Upgrade - Good News For Users
Along with this recovery, Bitcoin network is also getting stronger with new upgrades for faster transactions, lower fees, and better security. This is a big positive signal for the whole market.
What It Means For You?
- User BTC: 687,900 BTC
- User ETH: 3.48 Million
- Assets are backed 1:1
Binance proved it can survive even the biggest attack. This hack was 4x bigger than the Bybit hack.
Final Lesson
Keep 2FA ON, don't keep all funds on one exchange, and use a cold wallet for long-term holding.
Do you think Binance is now safer than before? Comment below 👇
#bitcoin #Binance #crypto #US
#Binance
{spot}(BTCUSDT)
Binance Recovers All Stolen Assets Worth $6.30 Billion
🚨 Binance Recovers $6.30 Billion - The Biggest Comeback in Crypto!
Crypto history just changed. Binance has fully recovered all $6.30 Billion stolen in the biggest hack ever.
What Happened?
On Oct 29, hackers attacked Binance hot wallets and stole $6.3B in crypto. The attack was linked to North Korea's group TraderTraitor.
How Binance Covered The Loss?
Binance promised users will not lose anything. It used:
- Company Profits
- Emergency Funds
- SAFU Fund
- Futures Insurance Fund
By Nov 12, Binance confirmed on X: All assets fully restored.
Where Did The Money Go?
Hackers used 20,000+ wallets and 65,000+ transactions to hide the funds. US authorities froze over $2.7B and got court approval to seize $1.2B+.
Bitcoin Upgrade - Good News For Users
Along with this recovery, Bitcoin network is also getting stronger with new upgrades for faster transactions, lower fees, and better security. This is a big positive signal for the whole market.
What It Means For You?
- User BTC: 687,900 BTC
- User ETH: 3.48 Million
- Assets are backed 1:1
Binance proved it can survive even the biggest attack. This hack was 4x bigger than the Bybit hack.
Final Lesson
Keep 2FA ON, don't keep all funds on one exchange, and use a cold wallet for long-term holding.
Do you think Binance is now safer than before? Comment below 👇
#bitcoin #Binance #crypto #US
#Binance
Crypto history just changed. Binance has fully recovered all $6.30 Billion stolen in the biggest hack ever.
What Happened?
On Oct 29, hackers attacked Binance hot wallets and stole $6.3B in crypto. The attack was linked to North Korea's group TraderTraitor.
How Binance Covered The Loss?
Binance promised users will not lose anything. It used:
- Company Profits
- Emergency Funds
- SAFU Fund
- Futures Insurance Fund
By Nov 12, Binance confirmed on X: All assets fully restored.
Where Did The Money Go?
Hackers used 20,000+ wallets and 65,000+ transactions to hide the funds. US authorities froze over $2.7B and got court approval to seize $1.2B+.
Bitcoin Upgrade - Good News For Users
Along with this recovery, Bitcoin network is also getting stronger with new upgrades for faster transactions, lower fees, and better security. This is a big positive signal for the whole market.
What It Means For You?
- User BTC: 687,900 BTC
- User ETH: 3.48 Million
- Assets are backed 1:1
Binance proved it can survive even the biggest attack. This hack was 4x bigger than the Bybit hack.
Final Lesson
Keep 2FA ON, don't keep all funds on one exchange, and use a cold wallet for long-term holding.
Do you think Binance is now safer than before? Comment below 👇
#bitcoin #Binance #crypto #US
#Binance
209

·
--
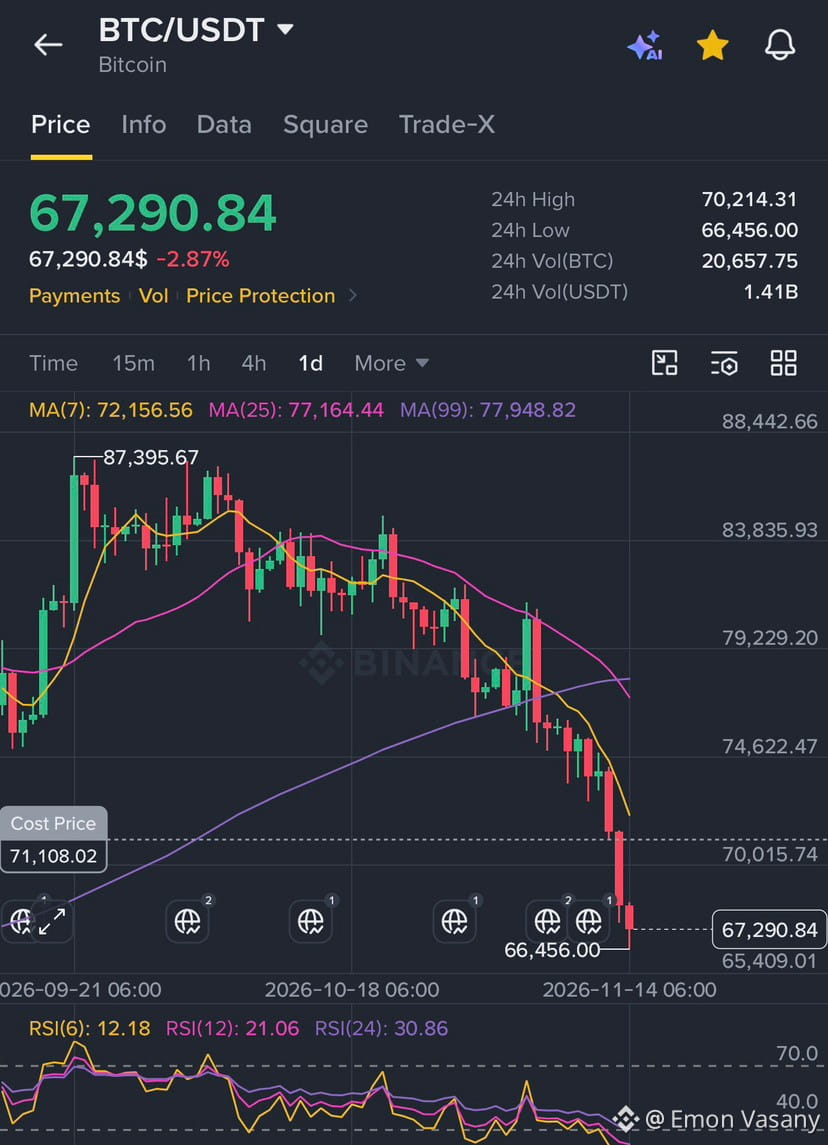
What the hell is happening with BTC? 😭
Is the market going to drop even further? Honestly, I’m completely confused at this point.
No matter how much we analyze the market, it keeps moving in the opposite direction. I’m honestly scared to even check my portfolio balance anymore.
What a painful market! 💔
What are your thoughts, experienced traders? Is there more downside ahead?
#BTC #bitcoin #crypto #BinanceSquare
What the hell is happening with BTC? 😭
Is the market going to drop even further? Honestly, I’m completely confused at this point.
No matter how much we analyze the market, it keeps moving in the opposite direction. I’m honestly scared to even check my portfolio balance anymore.
What a painful market! 💔
What are your thoughts, experienced traders? Is there more downside ahead?
#BTC #bitcoin #crypto #BinanceSquare
Is the market going to drop even further? Honestly, I’m completely confused at this point.
No matter how much we analyze the market, it keeps moving in the opposite direction. I’m honestly scared to even check my portfolio balance anymore.
What a painful market! 💔
What are your thoughts, experienced traders? Is there more downside ahead?
#BTC #bitcoin #crypto #BinanceSquare
2
4
507

·
--
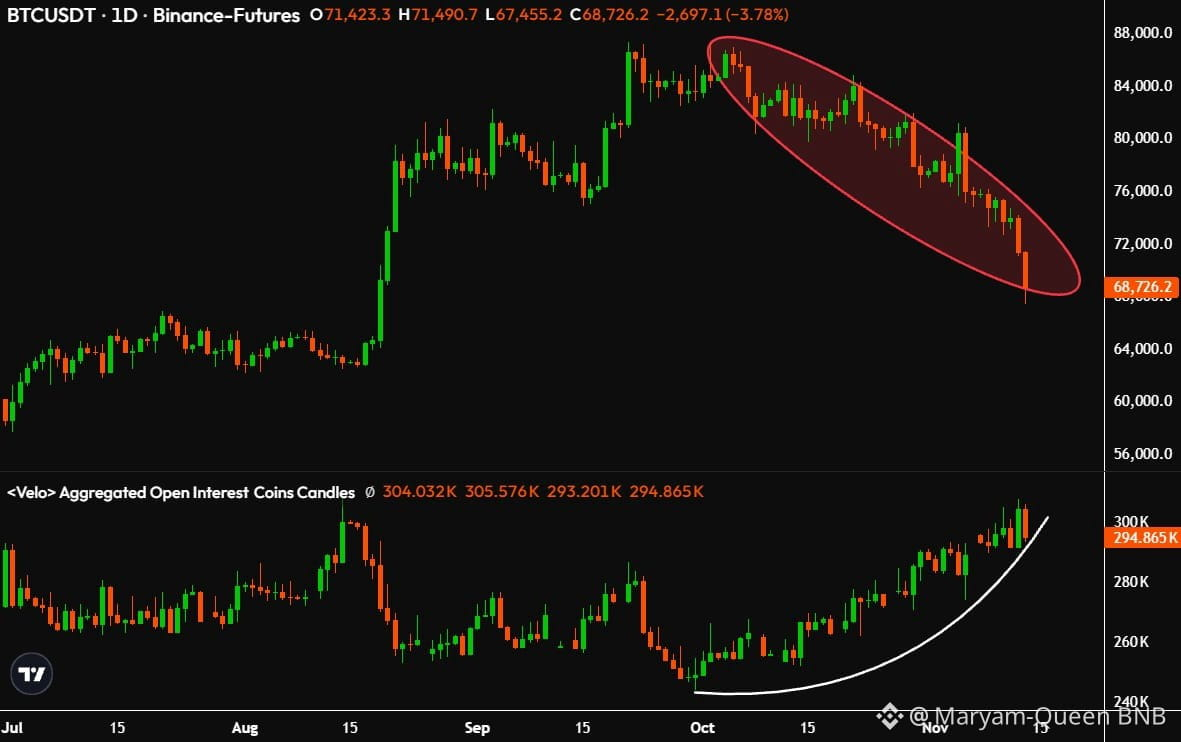
Bitcoin dropped from $87K to $65K and everyone is scared.
But this has happened many times before. Price goes down, people panic and sell. Later, the market recovers and those same people wish they had stayed calm.
A drop like this is normal. It clears out the weak hands and the over-leveraged traders. It's not the end of Bitcoin.
I'm not scared. I'm staying patient, watching key levels, and managing my risk.
Fear is loud right now. That's usually when smart people pay attention.
Stay calm. Protect your capital.
Not financial advice. DYOR.
#Bitcoin #BTC #Crypto $BTC
{future}(BTCUSDT)
Bitcoin dropped from $87K to $65K and everyone is scared.
But this has happened many times before. Price goes down, people panic and sell. Later, the market recovers and those same people wish they had stayed calm.
A drop like this is normal. It clears out the weak hands and the over-leveraged traders. It's not the end of Bitcoin.
I'm not scared. I'm staying patient, watching key levels, and managing my risk.
Fear is loud right now. That's usually when smart people pay attention.
Stay calm. Protect your capital.
Not financial advice. DYOR.
#Bitcoin #BTC #Crypto $BTC
But this has happened many times before. Price goes down, people panic and sell. Later, the market recovers and those same people wish they had stayed calm.
A drop like this is normal. It clears out the weak hands and the over-leveraged traders. It's not the end of Bitcoin.
I'm not scared. I'm staying patient, watching key levels, and managing my risk.
Fear is loud right now. That's usually when smart people pay attention.
Stay calm. Protect your capital.
Not financial advice. DYOR.
#Bitcoin #BTC #Crypto $BTC
47
·
--
Bearish
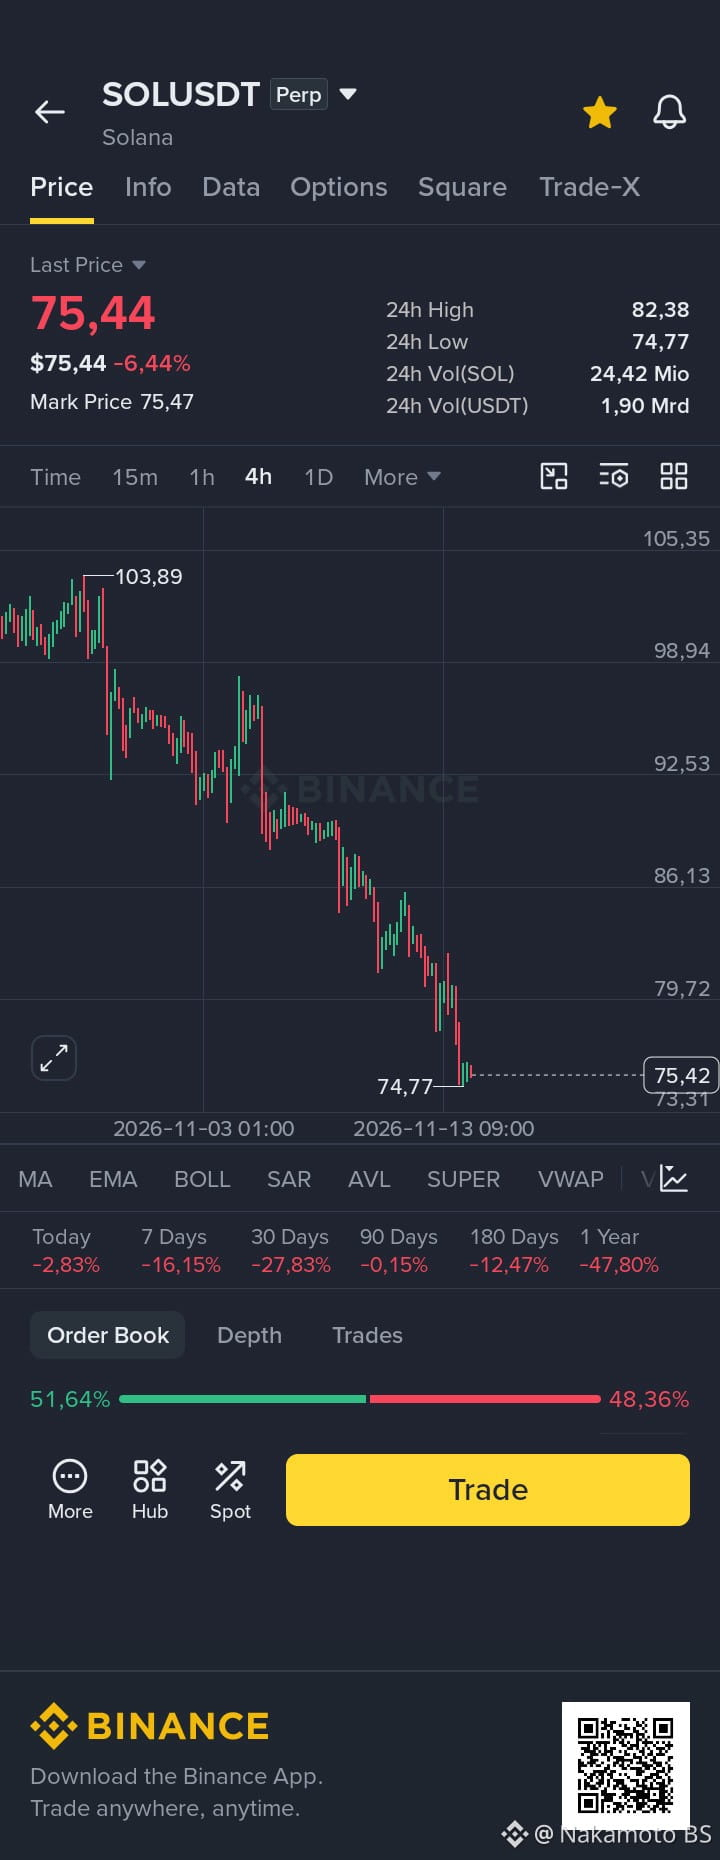
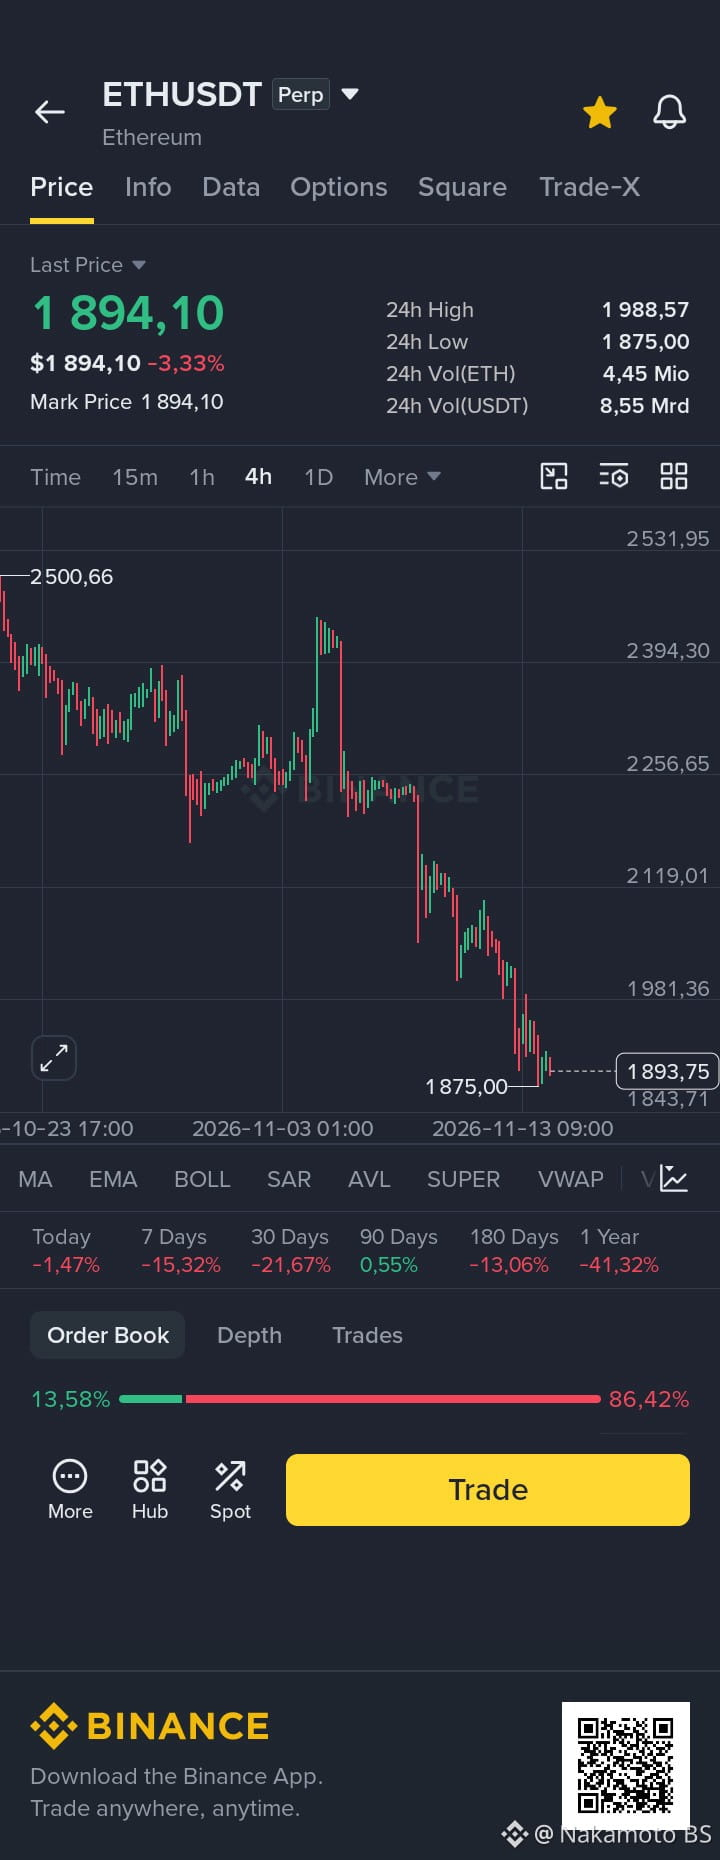
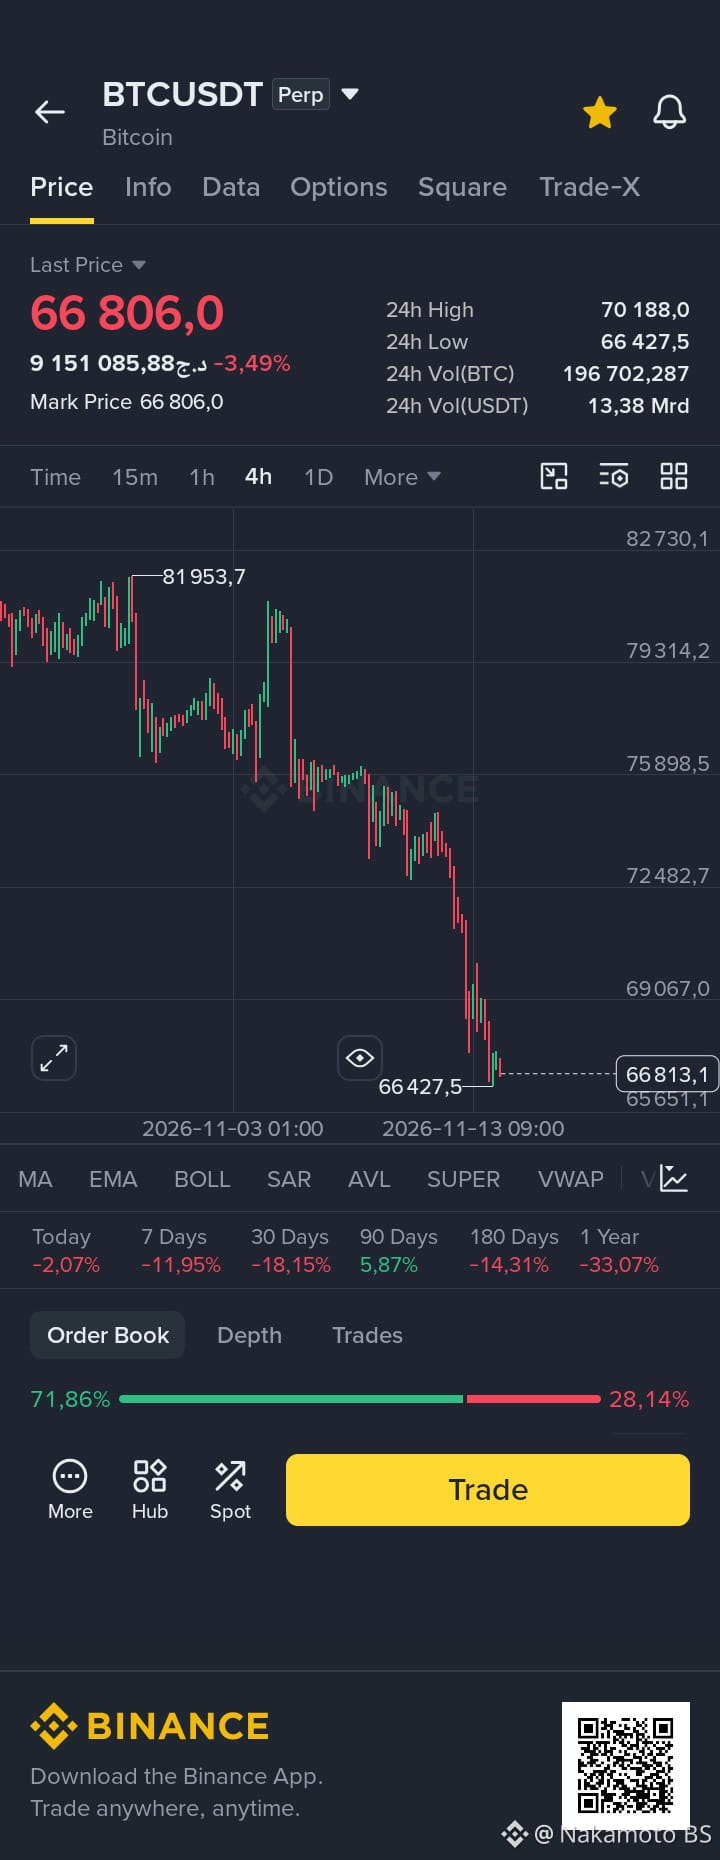
📊 My Analysis of BTC – ETH – SOL | Will the Downtrend Continue or Will We See a Rebound
I analyzed the three cryptocurrencies on the 4-hour timeframe and noticed a clear similarity in their trends, with selling pressure dominating as prices continue to form lower highs and lower lows.
🔶 $BTC – Bitcoin
Support: $66,427 – $65,651
Resistance: $69,067 – $72,482
🔷 $ETH – Ethereum
Support: $1,875 – $1,843
Resistance: $1,981 – $2,119
🟣 $SOL – Solana
Support: $74.77 – $73.31
Resistance: $79.72 – $86.13
What Do I See?
I believe all three cryptocurrencies are still in a downtrend.
I notice that Bitcoin is attempting to stabilize near its support zone.
Ethereum is still facing continuous selling pressure.
Solana is showing greater weakness in the current market movement compared to the other two cryptocurrencies.
My Conclusion: In my view, there is still no confirmed signal of a trend reversal. I will monitor the support zones and the ability of prices to reclaim key resistance levels before considering any rebound the beginning of a genuine recovery.
I don't rush into decisions. For me, confirming the trend is far more important than simply predicting it.
#Bitcoin #Ethereum #solana
{future}(BTCUSDT)
{future}(ETHUSDT)
{future}(SOLUSDT)
📊 My Analysis of BTC – ETH – SOL | Will the Downtrend Continue or Will We See a Rebound
I analyzed the three cryptocurrencies on the 4-hour timeframe and noticed a clear similarity in their trends, with selling pressure dominating as prices continue to form lower highs and lower lows.
🔶 $BTC – Bitcoin
Support: $66,427 – $65,651
Resistance: $69,067 – $72,482
🔷 $ETH – Ethereum
Support: $1,875 – $1,843
Resistance: $1,981 – $2,119
🟣 $SOL – Solana
Support: $74.77 – $73.31
Resistance: $79.72 – $86.13
What Do I See?
I believe all three cryptocurrencies are still in a downtrend.
I notice that Bitcoin is attempting to stabilize near its support zone.
Ethereum is still facing continuous selling pressure.
Solana is showing greater weakness in the current market movement compared to the other two cryptocurrencies.
My Conclusion: In my view, there is still no confirmed signal of a trend reversal. I will monitor the support zones and the ability of prices to reclaim key resistance levels before considering any rebound the beginning of a genuine recovery.
I don't rush into decisions. For me, confirming the trend is far more important than simply predicting it.
#Bitcoin #Ethereum #solana
I analyzed the three cryptocurrencies on the 4-hour timeframe and noticed a clear similarity in their trends, with selling pressure dominating as prices continue to form lower highs and lower lows.
🔶 $BTC – Bitcoin
Support: $66,427 – $65,651
Resistance: $69,067 – $72,482
🔷 $ETH – Ethereum
Support: $1,875 – $1,843
Resistance: $1,981 – $2,119
🟣 $SOL – Solana
Support: $74.77 – $73.31
Resistance: $79.72 – $86.13
What Do I See?
I believe all three cryptocurrencies are still in a downtrend.
I notice that Bitcoin is attempting to stabilize near its support zone.
Ethereum is still facing continuous selling pressure.
Solana is showing greater weakness in the current market movement compared to the other two cryptocurrencies.
My Conclusion: In my view, there is still no confirmed signal of a trend reversal. I will monitor the support zones and the ability of prices to reclaim key resistance levels before considering any rebound the beginning of a genuine recovery.
I don't rush into decisions. For me, confirming the trend is far more important than simply predicting it.
#Bitcoin #Ethereum #solana
26

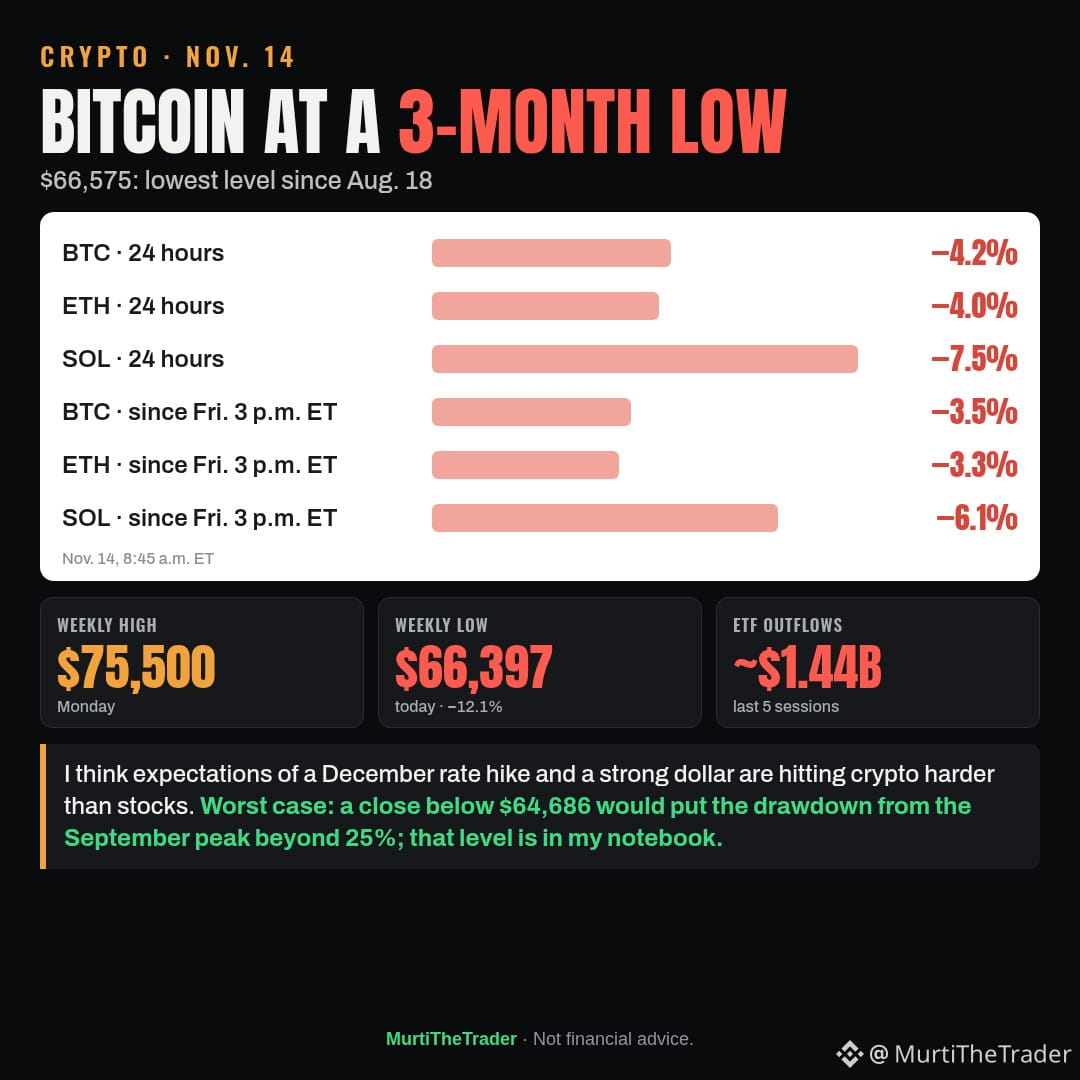
Crypto: Bitcoin at $66,575 is at its lowest since Aug. 18, down 3.5% since 3 p.m. ET Friday.
→ Over 24 hours, BTC is down 4.2%, ETH down 4.0% ($1,887), SOL down 7.5% ($75.30)
→ The week's high was $75,500 (Monday) and today's low is $66,397: a 12.1% drop
→ US spot Bitcoin ETFs saw ~$1.44B in outflows over 5 sessions
I think expectations of a December rate hike and a strong dollar are hitting crypto harder than stocks. Worst case: a close below $64,686 would put the drawdown from the September peak beyond 25%; that level is in my notebook.
#Bitcoin #FedDecision
Watching: $BTC $ETH $SOL
Crypto: Bitcoin at $66,575 is at its lowest since Aug. 18, down 3.5% since 3 p.m. ET Friday.
→ Over 24 hours, BTC is down 4.2%, ETH down 4.0% ($1,887), SOL down 7.5% ($75.30)
→ The week's high was $75,500 (Monday) and today's low is $66,397: a 12.1% drop
→ US spot Bitcoin ETFs saw ~$1.44B in outflows over 5 sessions
I think expectations of a December rate hike and a strong dollar are hitting crypto harder than stocks. Worst case: a close below $64,686 would put the drawdown from the September peak beyond 25%; that level is in my notebook.
#Bitcoin #FedDecision
Watching: $BTC $ETH $SOL
→ Over 24 hours, BTC is down 4.2%, ETH down 4.0% ($1,887), SOL down 7.5% ($75.30)
→ The week's high was $75,500 (Monday) and today's low is $66,397: a 12.1% drop
→ US spot Bitcoin ETFs saw ~$1.44B in outflows over 5 sessions
I think expectations of a December rate hike and a strong dollar are hitting crypto harder than stocks. Worst case: a close below $64,686 would put the drawdown from the September peak beyond 25%; that level is in my notebook.
#Bitcoin #FedDecision
Watching: $BTC $ETH $SOL
332

🚨 CRYPTO MARKET UPDATE
Bitcoin has dropped below $68K, heading toward its sixth consecutive weekly loss. The entire market is feeling the pressure.
📉 $BTC : $67K–$67.4K
📉 $ETH : Around $1,905–$2,050
📉 $SOL : $75–$83
💥 Total crypto market cap: $2.26T
Over $1.3 billion in leveraged positions were liquidated within 24 hours, showing how aggressive the selling pressure has become.
Rising US inflation, Treasury yields, and tech market weakness are adding more pressure.
My view: This is a critical moment for crypto. Bulls need to reclaim key levels, otherwise more downside cannot be ruled out. Stay patient, manage risk, and avoid emotional trades.
#Crypto #Bitcoin #Ethereum #MarketUpdate
🚨 CRYPTO MARKET UPDATE
Bitcoin has dropped below $68K, heading toward its sixth consecutive weekly loss. The entire market is feeling the pressure.
📉 $BTC : $67K–$67.4K
📉 $ETH : Around $1,905–$2,050
📉 $SOL : $75–$83
💥 Total crypto market cap: $2.26T
Over $1.3 billion in leveraged positions were liquidated within 24 hours, showing how aggressive the selling pressure has become.
Rising US inflation, Treasury yields, and tech market weakness are adding more pressure.
My view: This is a critical moment for crypto. Bulls need to reclaim key levels, otherwise more downside cannot be ruled out. Stay patient, manage risk, and avoid emotional trades.
#Crypto #Bitcoin #Ethereum #MarketUpdate
Bitcoin has dropped below $68K, heading toward its sixth consecutive weekly loss. The entire market is feeling the pressure.
📉 $BTC : $67K–$67.4K
📉 $ETH : Around $1,905–$2,050
📉 $SOL : $75–$83
💥 Total crypto market cap: $2.26T
Over $1.3 billion in leveraged positions were liquidated within 24 hours, showing how aggressive the selling pressure has become.
Rising US inflation, Treasury yields, and tech market weakness are adding more pressure.
My view: This is a critical moment for crypto. Bulls need to reclaim key levels, otherwise more downside cannot be ruled out. Stay patient, manage risk, and avoid emotional trades.
#Crypto #Bitcoin #Ethereum #MarketUpdate
228

·
--
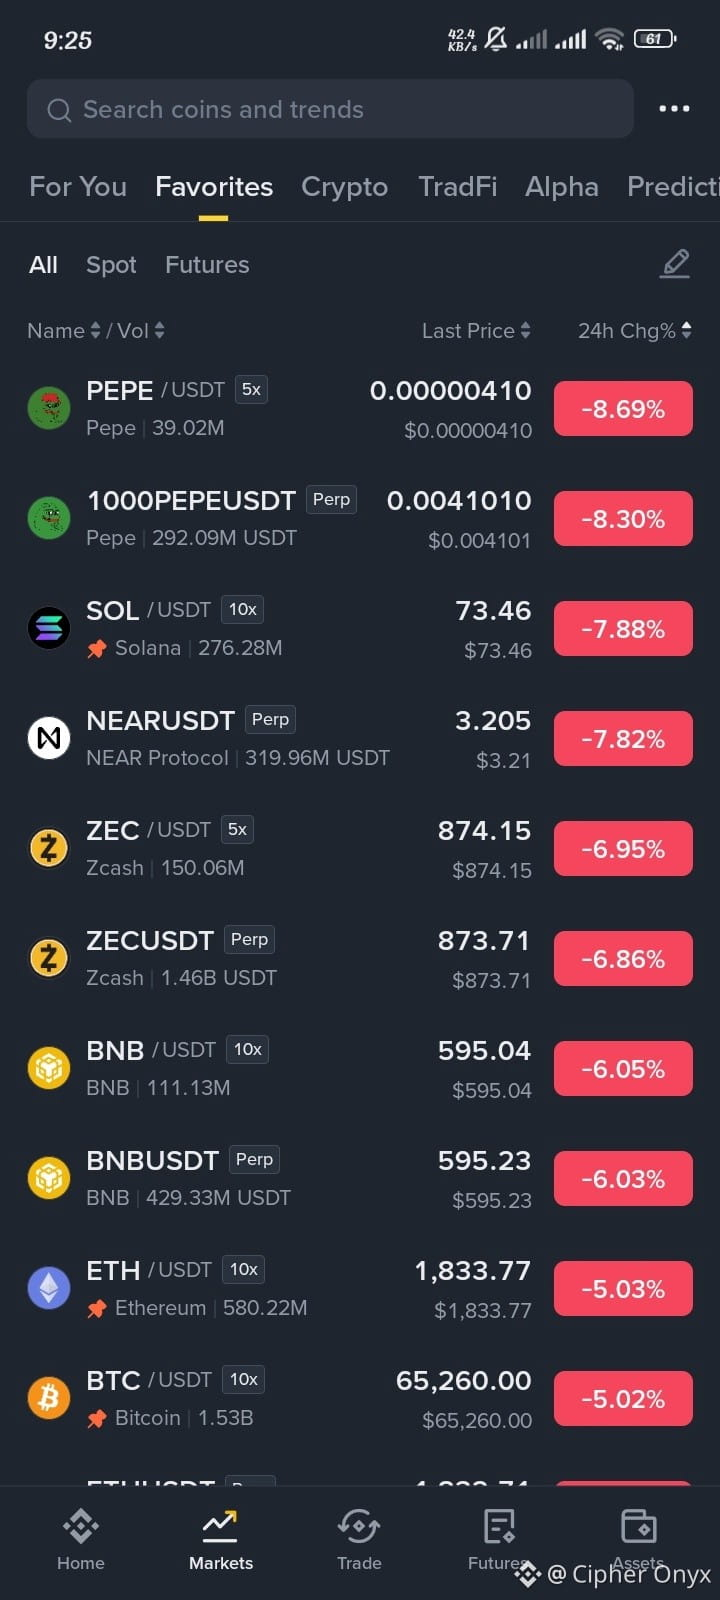
Crypto Market Update 📉
$PEPE : $0.00000410 (-8.69%)
$SOL : $73.46 (-7.88%)
$NEAR : $3.205 (-7.82%)
$ZEC : $874.15 (-6.95%)
$BNB : $595.04 (-6.05%)
$ETH : $1,833.77 (-5.03%)
$BTC : $65,260 (-5.02%)
Market sentiment: Bearish pressure is dominating the crypto market, with altcoins experiencing heavier losses than Bitcoin.
#CryptoMarket #Bitcoin #Altcoins #Binance
Crypto Market Update 📉
$PEPE : $0.00000410 (-8.69%)
$SOL : $73.46 (-7.88%)
$NEAR : $3.205 (-7.82%)
$ZEC : $874.15 (-6.95%)
$BNB : $595.04 (-6.05%)
$ETH : $1,833.77 (-5.03%)
$BTC : $65,260 (-5.02%)
Market sentiment: Bearish pressure is dominating the crypto market, with altcoins experiencing heavier losses than Bitcoin.
#CryptoMarket #Bitcoin #Altcoins #Binance
$PEPE : $0.00000410 (-8.69%)
$SOL : $73.46 (-7.88%)
$NEAR : $3.205 (-7.82%)
$ZEC : $874.15 (-6.95%)
$BNB : $595.04 (-6.05%)
$ETH : $1,833.77 (-5.03%)
$BTC : $65,260 (-5.02%)
Market sentiment: Bearish pressure is dominating the crypto market, with altcoins experiencing heavier losses than Bitcoin.
#CryptoMarket #Bitcoin #Altcoins #Binance
1
6
Log in to explore more content
Join global crypto users on Binance Square
⚡️ Get latest and useful information about crypto.
💬 Trusted by the world’s largest crypto exchange.
👍 Discover real insights from verified creators.
Email / Phone number
Trending Topics
1
#WhoWillSucceedJensenHuangatNvidia?
81,433 views
1,099 Discussing
2
#WhatWillDriveCryptoandStocks’NextRebound?
431,655 views
3,003 Discussing
3
#BitcoinActiveSupplyInProfitDropsBelow45%
21,738 views
326 Discussing
4
#KavaSaysAbnormalActivityLimitedToKavaLend
8,507 views
166 Discussing
5
#USSpotXRPETFsSeeLargestWeeklyOutflowIn8Months
7,720 views
155 Discussing
6
#USPPIMissMayEaseBTCPressure
206,752 views
2,036 Discussing
7
#WORPTLetsTouristsConvertCryptoToThaiBaht
2,550 views
49 Discussing
8
#TONStrategyReports$23.97MQ3NetLoss
3,193 views
41 Discussing
9
#PolkadotCommunityApprovesNewStrategyWith97%Vote
18,626 views
241 Discussing
10
#dYdXPlansV9.9UpgradeToShiftUSDCToInjective
11,380 views
193 Discussing