
#bitcoinbreaksbelow200weekmovingaverage
bitcoinbreaksbelow200weekmovingaverage
187,246 views
1,005 Discussing
Hot
Latest

·
--
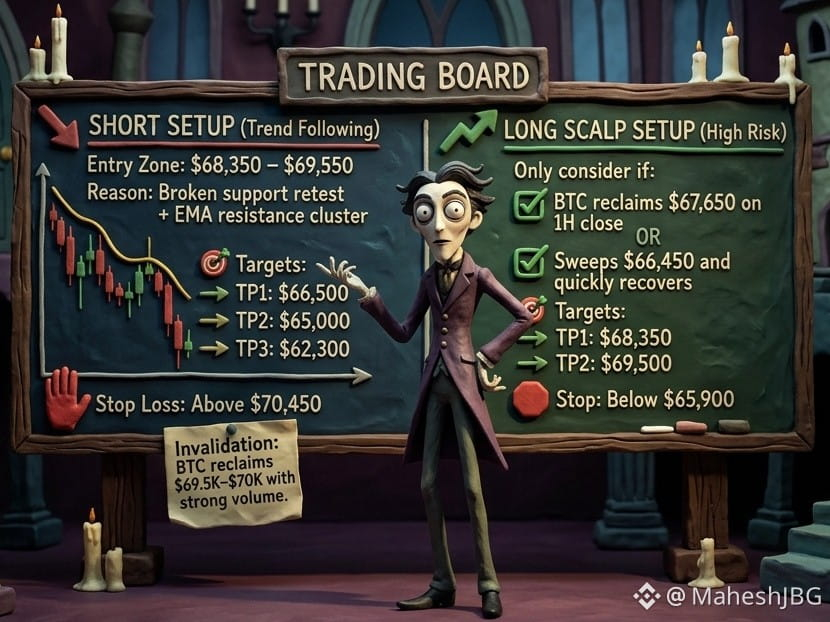
$BTC Technical Review (Based on Provided Data)
🔴 Market Bias: Bearish Until Reclaim
BTC is in a strong downside momentum phase. The important point is that RSI is deeply oversold, but oversold does not automatically mean a bottom. A relief bounce is possible before another leg down.
📉 Key Levels To Watch
Major Support Zones
- 🟢 $66,450 — Immediate intraday support
- 🟢 $65,000 — Psychological + liquidity zone
- 🟢 $62,300 — Major swing support
- 🟢 $57,800 — Macro downside target if breakdown continues
Resistance Zones
- 🔴 $67,650–$68,350 — First bounce resistance
- 🔴 $69,500–$69,540 — Critical weekly 200 EMA reclaim zone
- 🔴 $72,200+ — Short-term trend reversal area
📉 SHORT SETUP (Trend Following)
Entry Zone: $68,350 – $69,550
Reason: Broken support retest + EMA resistance cluster
🎯 Targets:
- TP1: $66,500
- TP2: $65,000
- TP3: $62,300
🛑 Stop Loss: Above $70,450
Invalidation: BTC reclaims $69.5K–$70K with strong volume.
📈 LONG SCALP SETUP (High Risk)
Only consider if:
✅ BTC reclaims $67,650 on 1H close
OR
✅ Sweeps $66,450 and quickly recovers
🎯 Targets:
- TP1: $68,350
- TP2: $69,500
🛑 Stop: Below $65,900
🧠 Current Market Psychology
- Extreme RSI = possible short squeeze ⚡
- Broken weekly support = bears remain in control 🐻
- ETF outflows + liquidations = volatility remains high
- Chasing shorts near $66K = risky due to bounce probability
Simple Trading Plan:
Below $69.5K → Bears control.
Above $69.5K → Recovery attempt begins.
Below $65K → $62K becomes likely.
⚠️ High volatility zone: reduce leverage and wait for confirmation. DYOR.
#BitcoinCoreDisclosesTorTrafficVulnerability #BitcoinBreaksBelow200WeekMovingAverage
$BTC Technical Review (Based on Provided Data)
🔴 Market Bias: Bearish Until Reclaim
BTC is in a strong downside momentum phase. The important point is that RSI is deeply oversold, but oversold does not automatically mean a bottom. A relief bounce is possible before another leg down.
📉 Key Levels To Watch
Major Support Zones
- 🟢 $66,450 — Immediate intraday support
- 🟢 $65,000 — Psychological + liquidity zone
- 🟢 $62,300 — Major swing support
- 🟢 $57,800 — Macro downside target if breakdown continues
Resistance Zones
- 🔴 $67,650–$68,350 — First bounce resistance
- 🔴 $69,500–$69,540 — Critical weekly 200 EMA reclaim zone
- 🔴 $72,200+ — Short-term trend reversal area
📉 SHORT SETUP (Trend Following)
Entry Zone: $68,350 – $69,550
Reason: Broken support retest + EMA resistance cluster
🎯 Targets:
- TP1: $66,500
- TP2: $65,000
- TP3: $62,300
🛑 Stop Loss: Above $70,450
Invalidation: BTC reclaims $69.5K–$70K with strong volume.
📈 LONG SCALP SETUP (High Risk)
Only consider if:
✅ BTC reclaims $67,650 on 1H close
OR
✅ Sweeps $66,450 and quickly recovers
🎯 Targets:
- TP1: $68,350
- TP2: $69,500
🛑 Stop: Below $65,900
🧠 Current Market Psychology
- Extreme RSI = possible short squeeze ⚡
- Broken weekly support = bears remain in control 🐻
- ETF outflows + liquidations = volatility remains high
- Chasing shorts near $66K = risky due to bounce probability
Simple Trading Plan:
Below $69.5K → Bears control.
Above $69.5K → Recovery attempt begins.
Below $65K → $62K becomes likely.
⚠️ High volatility zone: reduce leverage and wait for confirmation. DYOR.
#BitcoinCoreDisclosesTorTrafficVulnerability #BitcoinBreaksBelow200WeekMovingAverage
🔴 Market Bias: Bearish Until Reclaim
BTC is in a strong downside momentum phase. The important point is that RSI is deeply oversold, but oversold does not automatically mean a bottom. A relief bounce is possible before another leg down.
📉 Key Levels To Watch
Major Support Zones
- 🟢 $66,450 — Immediate intraday support
- 🟢 $65,000 — Psychological + liquidity zone
- 🟢 $62,300 — Major swing support
- 🟢 $57,800 — Macro downside target if breakdown continues
Resistance Zones
- 🔴 $67,650–$68,350 — First bounce resistance
- 🔴 $69,500–$69,540 — Critical weekly 200 EMA reclaim zone
- 🔴 $72,200+ — Short-term trend reversal area
📉 SHORT SETUP (Trend Following)
Entry Zone: $68,350 – $69,550
Reason: Broken support retest + EMA resistance cluster
🎯 Targets:
- TP1: $66,500
- TP2: $65,000
- TP3: $62,300
🛑 Stop Loss: Above $70,450
Invalidation: BTC reclaims $69.5K–$70K with strong volume.
📈 LONG SCALP SETUP (High Risk)
Only consider if:
✅ BTC reclaims $67,650 on 1H close
OR
✅ Sweeps $66,450 and quickly recovers
🎯 Targets:
- TP1: $68,350
- TP2: $69,500
🛑 Stop: Below $65,900
🧠 Current Market Psychology
- Extreme RSI = possible short squeeze ⚡
- Broken weekly support = bears remain in control 🐻
- ETF outflows + liquidations = volatility remains high
- Chasing shorts near $66K = risky due to bounce probability
Simple Trading Plan:
Below $69.5K → Bears control.
Above $69.5K → Recovery attempt begins.
Below $65K → $62K becomes likely.
⚠️ High volatility zone: reduce leverage and wait for confirmation. DYOR.
#BitcoinCoreDisclosesTorTrafficVulnerability #BitcoinBreaksBelow200WeekMovingAverage
SHERAZ FAHEEM 01:
Bitcoin losing the 200-week moving average is a significant technical development. Traders will be watching closely for a potential recovery.
2
395

·
--
🚨 BITCOIN TOUCHES THE 200-WEEK MOVING AVERAGE — IS THE MARKET IN TROUBLE? 📉
Bitcoin briefly dropped to $67,568, slipping below the key 200-week moving average near $68K, before bouncing back towards $68,750. This has put traders on high alert! 👀
📊 What’s Happening?
💥 Reports suggest that more than $1.3 billion in leveraged long positions were liquidated, adding heavy selling pressure to the market.
📉 Why Is the 200-Week MA Important?
The 200-week moving average is a major long-term indicator that many Bitcoin traders watch to assess the broader market trend. A brief dip below it does not automatically confirm a breakdown. The weekly candle close will be especially important.
⚠️ What Are Traders Watching Now?
• Whether BTC can reclaim and hold above the $68K zone.
• Whether the recent bounce has enough strength to continue.
• Whether more leveraged positions could face liquidation if volatility continues.
What's your view, frnd? Is $67K a potential bottom, or could BTC see another drop before recovering!💥
$AKE -$SHELL - $BTC
{future}(AKEUSDT)
{future}(SHELLUSDT)
{future}(BTCUSDT)
#Bitcoin #CryptoMarketAlert
#bitcoinbreaksbelow200weekmovingaverage
"Do you think Bitcoin has found its bottom at $67K"!?⚡
🚨 BITCOIN TOUCHES THE 200-WEEK MOVING AVERAGE — IS THE MARKET IN TROUBLE? 📉
Bitcoin briefly dropped to $67,568, slipping below the key 200-week moving average near $68K, before bouncing back towards $68,750. This has put traders on high alert! 👀
📊 What’s Happening?
💥 Reports suggest that more than $1.3 billion in leveraged long positions were liquidated, adding heavy selling pressure to the market.
📉 Why Is the 200-Week MA Important?
The 200-week moving average is a major long-term indicator that many Bitcoin traders watch to assess the broader market trend. A brief dip below it does not automatically confirm a breakdown. The weekly candle close will be especially important.
⚠️ What Are Traders Watching Now?
• Whether BTC can reclaim and hold above the $68K zone.
• Whether the recent bounce has enough strength to continue.
• Whether more leveraged positions could face liquidation if volatility continues.
What's your view, frnd? Is $67K a potential bottom, or could BTC see another drop before recovering!💥
$AKE -$SHELL - $BTC
#Bitcoin #CryptoMarketAlert
#bitcoinbreaksbelow200weekmovingaverage
"Do you think Bitcoin has found its bottom at $67K"!?⚡
Bitcoin briefly dropped to $67,568, slipping below the key 200-week moving average near $68K, before bouncing back towards $68,750. This has put traders on high alert! 👀
📊 What’s Happening?
💥 Reports suggest that more than $1.3 billion in leveraged long positions were liquidated, adding heavy selling pressure to the market.
📉 Why Is the 200-Week MA Important?
The 200-week moving average is a major long-term indicator that many Bitcoin traders watch to assess the broader market trend. A brief dip below it does not automatically confirm a breakdown. The weekly candle close will be especially important.
⚠️ What Are Traders Watching Now?
• Whether BTC can reclaim and hold above the $68K zone.
• Whether the recent bounce has enough strength to continue.
• Whether more leveraged positions could face liquidation if volatility continues.
What's your view, frnd? Is $67K a potential bottom, or could BTC see another drop before recovering!💥
$AKE -$SHELL - $BTC
#Bitcoin #CryptoMarketAlert
#bitcoinbreaksbelow200weekmovingaverage
"Do you think Bitcoin has found its bottom at $67K"!?⚡
🟢 Yes — $67K Is the Bottom 🚀
🔴 No — More Downside Ahead 📉
21 hr(s) left
3
477


·
--
bitcoin is under its 200 week average and suddenly everyone cares about one line
#BitcoinBreaksBelow200WeekMovingAverage
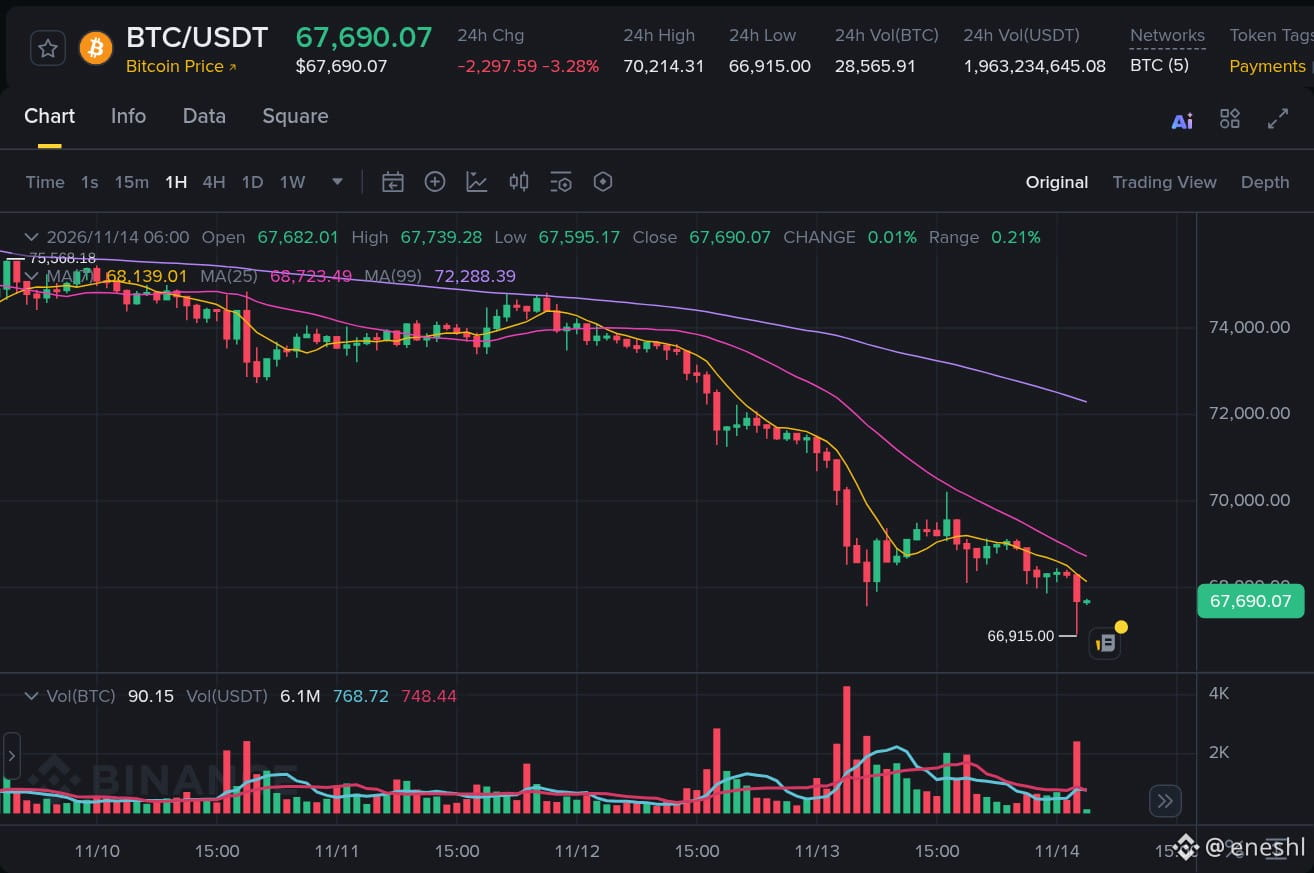
$BTC slipped below the 200 week moving average, which sits right around 68k. funding also flipped negative per glassnode, so shorts are now paying longs
two ways to read it. bears see a long term trend line giving up after a rough few weeks. the other side is that negative funding into a major average is usually where crowded shorts get squeezed, not where new ones get paid
the signal i care about is the weekly close, not the intraday wick. close back above and this was a shakeout. close below and the weekly trend is broken, and $ETH usually takes it harder
not doing anything brave before sunday night, the weekly candle talks first
bitcoin is under its 200 week average and suddenly everyone cares about one line
#BitcoinBreaksBelow200WeekMovingAverage
$BTC slipped below the 200 week moving average, which sits right around 68k. funding also flipped negative per glassnode, so shorts are now paying longs
two ways to read it. bears see a long term trend line giving up after a rough few weeks. the other side is that negative funding into a major average is usually where crowded shorts get squeezed, not where new ones get paid
the signal i care about is the weekly close, not the intraday wick. close back above and this was a shakeout. close below and the weekly trend is broken, and $ETH usually takes it harder
not doing anything brave before sunday night, the weekly candle talks first
#BitcoinBreaksBelow200WeekMovingAverage
$BTC slipped below the 200 week moving average, which sits right around 68k. funding also flipped negative per glassnode, so shorts are now paying longs
two ways to read it. bears see a long term trend line giving up after a rough few weeks. the other side is that negative funding into a major average is usually where crowded shorts get squeezed, not where new ones get paid
the signal i care about is the weekly close, not the intraday wick. close back above and this was a shakeout. close below and the weekly trend is broken, and $ETH usually takes it harder
not doing anything brave before sunday night, the weekly candle talks first
SHERAZ FAHEEM 01:
The 200-week moving average has historically been an important long-term indicator. A break below it deserves serious attention.
4
6
4.9k

·
--
Bearish
#bitcoinbreaksbelow200weekmovingaverage
🚨 BITCOIN BREAKS BELOW THE 200-WEEK MOVING AVERAGE — IS THE MARKET ENTERING A DEEPER CORRECTION?
Bitcoin has fallen below one of its most important long-term technical indicators: the 200-week moving average, currently around $68,000.
On November 13, BTC briefly dropped toward $67,500, raising concerns about the strength of the broader market.
📉 WHY DOES THIS MATTER?
The 200-week moving average has historically acted as an important long-term support zone during major Bitcoin market corrections.
However, history doesn't guarantee that this level will hold again.
🔍 WHAT SHOULD TRADERS WATCH?
- Bullish scenario: BTC reclaims $68K and maintains a strong weekly close above the moving average.
- Bearish scenario: Continued trading below this level could increase selling pressure and expose lower support zones.
- Key concern: Weak market liquidity, ETF outflows, and broader economic uncertainty could make recovery more difficult.
💡 MY MARKET TAKE:
The important question isn't simply whether Bitcoin breaks below the 200-week moving average.
It's whether buyers can reclaim this level or whether it turns into resistance.
A temporary breakdown doesn't automatically confirm a bear market. But sustained weakness below such an important long-term indicator deserves serious attention.
For now, patience and risk management matter more than trying to predict the exact bottom.
The next weekly close could provide a much clearer picture of Bitcoin's long-term direction.
#Bitcoin #BTC #CryptoMarket #BitcoinAnalysis
$BTC
{future}(BTCUSDT)
$BTW
{future}(BTWUSDT)
$MVLL
{future}(MVLLUSDT)
#bitcoinbreaksbelow200weekmovingaverage
🚨 BITCOIN BREAKS BELOW THE 200-WEEK MOVING AVERAGE — IS THE MARKET ENTERING A DEEPER CORRECTION?
Bitcoin has fallen below one of its most important long-term technical indicators: the 200-week moving average, currently around $68,000.
On November 13, BTC briefly dropped toward $67,500, raising concerns about the strength of the broader market.
📉 WHY DOES THIS MATTER?
The 200-week moving average has historically acted as an important long-term support zone during major Bitcoin market corrections.
However, history doesn't guarantee that this level will hold again.
🔍 WHAT SHOULD TRADERS WATCH?
- Bullish scenario: BTC reclaims $68K and maintains a strong weekly close above the moving average.
- Bearish scenario: Continued trading below this level could increase selling pressure and expose lower support zones.
- Key concern: Weak market liquidity, ETF outflows, and broader economic uncertainty could make recovery more difficult.
💡 MY MARKET TAKE:
The important question isn't simply whether Bitcoin breaks below the 200-week moving average.
It's whether buyers can reclaim this level or whether it turns into resistance.
A temporary breakdown doesn't automatically confirm a bear market. But sustained weakness below such an important long-term indicator deserves serious attention.
For now, patience and risk management matter more than trying to predict the exact bottom.
The next weekly close could provide a much clearer picture of Bitcoin's long-term direction.
#Bitcoin #BTC #CryptoMarket #BitcoinAnalysis
$BTC
$BTW
$MVLL
🚨 BITCOIN BREAKS BELOW THE 200-WEEK MOVING AVERAGE — IS THE MARKET ENTERING A DEEPER CORRECTION?
Bitcoin has fallen below one of its most important long-term technical indicators: the 200-week moving average, currently around $68,000.
On November 13, BTC briefly dropped toward $67,500, raising concerns about the strength of the broader market.
📉 WHY DOES THIS MATTER?
The 200-week moving average has historically acted as an important long-term support zone during major Bitcoin market corrections.
However, history doesn't guarantee that this level will hold again.
🔍 WHAT SHOULD TRADERS WATCH?
- Bullish scenario: BTC reclaims $68K and maintains a strong weekly close above the moving average.
- Bearish scenario: Continued trading below this level could increase selling pressure and expose lower support zones.
- Key concern: Weak market liquidity, ETF outflows, and broader economic uncertainty could make recovery more difficult.
💡 MY MARKET TAKE:
The important question isn't simply whether Bitcoin breaks below the 200-week moving average.
It's whether buyers can reclaim this level or whether it turns into resistance.
A temporary breakdown doesn't automatically confirm a bear market. But sustained weakness below such an important long-term indicator deserves serious attention.
For now, patience and risk management matter more than trying to predict the exact bottom.
The next weekly close could provide a much clearer picture of Bitcoin's long-term direction.
#Bitcoin #BTC #CryptoMarket #BitcoinAnalysis
$BTC
$BTW
$MVLL

SHERAZ FAHEEM 01:
BTC is facing an important technical challenge. Reclaiming this level could become crucial for restoring market confidence.
5
2
12
23.7k

·
--
Bearish
#bitcoinbreaksbelow200weekmovingaverage
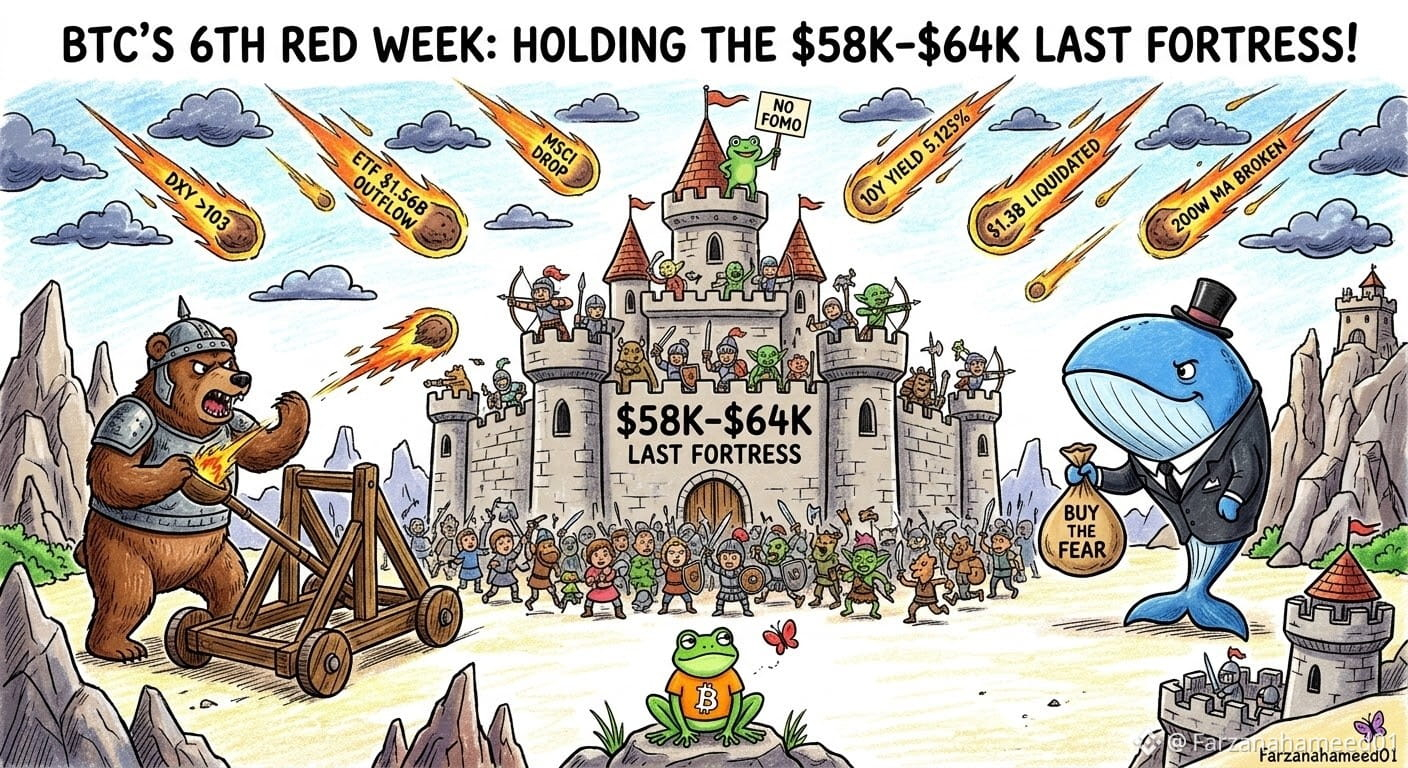
🚨 $BTC Has Posted Its Sixth Consecutive Weekly Decline!
Bitcoin has officially posted its sixth consecutive weekly decline, falling below both the 68k mark and the 200-week MA!
Bad news is piling up every day: the DXY has topped 103, U.S. Treasury yields have reached 5.125%, and ETFs have seen net outflows of $1.56 billion since the start of the year, with $2.6 billion vanishing in just the past two weeks! Add to that the prospect of Strategy being dropped from the MSCI USA Index and more than $1.3 billion in derivatives liquidations, and the market is left on oxygen!
On the weekly chart, the bear flag pattern has confirmed a breakdown, turning the solid support zone of 58k-64k into the Bulls last stronghold! If this final line of defense gives way, the crypto winter will be brutally cold! Even so, some whales like Joe Carlasare see this extreme fear as a chance to scoop up coins at bargain prices!
💡 What should traders do now? Stay put and keep a low profile! Absolutely do not FOMO into a falling market or use high leverage! Patiently wait for the price to test the 58k-64k zone, and wait for a clear reversal signal before entering!
⚠️ This is not financial advice.
👇
$BTC - Watch for 58k-64k last fortress, strong.
$ETH - Watch for ETF outflow pressure, strong.
$BARD - Watch for whale bargain buying, strong.
✨𝐅𝐀𝐑𝐙𝐀𝐍𝐀 𝐇𝐀𝐌𝐄𝐄𝐃 𝐎𝐅𝐅𝐈𝐂𝐈𝐀𝐋 • 🦋 ✨
#BitcoinBreaksBelow200WeekMovingAverage #Bitcoin #CryptoNews #TradingTips
{future}(ETHUSDT)
{future}(BARDUSDT)
#bitcoinbreaksbelow200weekmovingaverage
🚨 $BTC Has Posted Its Sixth Consecutive Weekly Decline!
Bitcoin has officially posted its sixth consecutive weekly decline, falling below both the 68k mark and the 200-week MA!
Bad news is piling up every day: the DXY has topped 103, U.S. Treasury yields have reached 5.125%, and ETFs have seen net outflows of $1.56 billion since the start of the year, with $2.6 billion vanishing in just the past two weeks! Add to that the prospect of Strategy being dropped from the MSCI USA Index and more than $1.3 billion in derivatives liquidations, and the market is left on oxygen!
On the weekly chart, the bear flag pattern has confirmed a breakdown, turning the solid support zone of 58k-64k into the Bulls last stronghold! If this final line of defense gives way, the crypto winter will be brutally cold! Even so, some whales like Joe Carlasare see this extreme fear as a chance to scoop up coins at bargain prices!
💡 What should traders do now? Stay put and keep a low profile! Absolutely do not FOMO into a falling market or use high leverage! Patiently wait for the price to test the 58k-64k zone, and wait for a clear reversal signal before entering!
⚠️ This is not financial advice.
👇
$BTC - Watch for 58k-64k last fortress, strong.
$ETH - Watch for ETF outflow pressure, strong.
$BARD - Watch for whale bargain buying, strong.
✨𝐅𝐀𝐑𝐙𝐀𝐍𝐀 𝐇𝐀𝐌𝐄𝐄𝐃 𝐎𝐅𝐅𝐈𝐂𝐈𝐀𝐋 • 🦋 ✨
#BitcoinBreaksBelow200WeekMovingAverage #Bitcoin #CryptoNews #TradingTips
🚨 $BTC Has Posted Its Sixth Consecutive Weekly Decline!
Bitcoin has officially posted its sixth consecutive weekly decline, falling below both the 68k mark and the 200-week MA!
Bad news is piling up every day: the DXY has topped 103, U.S. Treasury yields have reached 5.125%, and ETFs have seen net outflows of $1.56 billion since the start of the year, with $2.6 billion vanishing in just the past two weeks! Add to that the prospect of Strategy being dropped from the MSCI USA Index and more than $1.3 billion in derivatives liquidations, and the market is left on oxygen!
On the weekly chart, the bear flag pattern has confirmed a breakdown, turning the solid support zone of 58k-64k into the Bulls last stronghold! If this final line of defense gives way, the crypto winter will be brutally cold! Even so, some whales like Joe Carlasare see this extreme fear as a chance to scoop up coins at bargain prices!
💡 What should traders do now? Stay put and keep a low profile! Absolutely do not FOMO into a falling market or use high leverage! Patiently wait for the price to test the 58k-64k zone, and wait for a clear reversal signal before entering!
⚠️ This is not financial advice.
👇
$BTC - Watch for 58k-64k last fortress, strong.
$ETH - Watch for ETF outflow pressure, strong.
$BARD - Watch for whale bargain buying, strong.
✨𝐅𝐀𝐑𝐙𝐀𝐍𝐀 𝐇𝐀𝐌𝐄𝐄𝐃 𝐎𝐅𝐅𝐈𝐂𝐈𝐀𝐋 • 🦋 ✨
#BitcoinBreaksBelow200WeekMovingAverage #Bitcoin #CryptoNews #TradingTips
Trong_Hatachi:
Six weekly declines is a serious streak, and that 58k–64k zone is clearly the key level everyone’s watching. Waiting for confirmation makes sense in a market this volatile.
35
1
27
35.7k

·
--
#bitcoinbreaksbelow200weekmovingaverage Bitcoin just dropped below its 200-week moving average near $68,000, touching lows around $67,550. This is a big test for the crypto market because this line usually acts as a strong long-term floor.
The drop happened as the US dollar grew stronger, inflation stayed high, and investors pulled billions out of Bitcoin funds. Over $1.3 billion in crypto trades were wiped out in one day. Traders are now watching closely to see if Bitcoin can climb back above $68,000 before the week ends. #BitcoinBreaksBelow200WeekMovingAverage
$XRP $NEAR $PROVE
{spot}(PROVEUSDT)
{spot}(NEARUSDT)
{spot}(XRPUSDT)
#bitcoinbreaksbelow200weekmovingaverage Bitcoin just dropped below its 200-week moving average near $68,000, touching lows around $67,550. This is a big test for the crypto market because this line usually acts as a strong long-term floor.
The drop happened as the US dollar grew stronger, inflation stayed high, and investors pulled billions out of Bitcoin funds. Over $1.3 billion in crypto trades were wiped out in one day. Traders are now watching closely to see if Bitcoin can climb back above $68,000 before the week ends. #BitcoinBreaksBelow200WeekMovingAverage
$XRP $NEAR $PROVE
The drop happened as the US dollar grew stronger, inflation stayed high, and investors pulled billions out of Bitcoin funds. Over $1.3 billion in crypto trades were wiped out in one day. Traders are now watching closely to see if Bitcoin can climb back above $68,000 before the week ends. #BitcoinBreaksBelow200WeekMovingAverage
$XRP $NEAR $PROVE

SHERAZ FAHEEM 01:
Losing a major long-term support level can increase uncertainty, especially among investors with a longer-term outlook.
3
6
13.1k

·
--
Bearish
🚨 BITCOIN BREAKS BELOW ITS CRITICAL 200-WEEK MOVING AVERAGE!
Bitcoin is facing one of its most important long-term technical tests as BTC drops below the 200-week Simple Moving Average, a level closely watched by long-term investors.
The 200-week average was sitting near $68,000 as Bitcoin briefly fell toward $67,500 on November 13.
Why does this matter?
Historically, the 200-week moving average has acted as an important support zone during major Bitcoin market corrections.
Key levels to watch:
$68,000 — Critical long-term support
$66,000–$67,000 — Next support zone
$62,300 — Deeper downside support
$75,000 — Potential recovery hurdle
A weekly close below this average could strengthen bearish sentiment, while a recovery above it may signal that buyers are defending the long-term trend.
⚠️ The next weekly close could be crucial for Bitcoin's market structure.
Is BTC entering a deeper correction, or will bulls defend this historic support?
#bitcoinbreaksbelow200weekmovingaverage $BTC
{spot}(BTCUSDT)
🚨 BITCOIN BREAKS BELOW ITS CRITICAL 200-WEEK MOVING AVERAGE!
Bitcoin is facing one of its most important long-term technical tests as BTC drops below the 200-week Simple Moving Average, a level closely watched by long-term investors.
The 200-week average was sitting near $68,000 as Bitcoin briefly fell toward $67,500 on November 13.
Why does this matter?
Historically, the 200-week moving average has acted as an important support zone during major Bitcoin market corrections.
Key levels to watch:
$68,000 — Critical long-term support
$66,000–$67,000 — Next support zone
$62,300 — Deeper downside support
$75,000 — Potential recovery hurdle
A weekly close below this average could strengthen bearish sentiment, while a recovery above it may signal that buyers are defending the long-term trend.
⚠️ The next weekly close could be crucial for Bitcoin's market structure.
Is BTC entering a deeper correction, or will bulls defend this historic support?
#bitcoinbreaksbelow200weekmovingaverage $BTC
Bitcoin is facing one of its most important long-term technical tests as BTC drops below the 200-week Simple Moving Average, a level closely watched by long-term investors.
The 200-week average was sitting near $68,000 as Bitcoin briefly fell toward $67,500 on November 13.
Why does this matter?
Historically, the 200-week moving average has acted as an important support zone during major Bitcoin market corrections.
Key levels to watch:
$68,000 — Critical long-term support
$66,000–$67,000 — Next support zone
$62,300 — Deeper downside support
$75,000 — Potential recovery hurdle
A weekly close below this average could strengthen bearish sentiment, while a recovery above it may signal that buyers are defending the long-term trend.
⚠️ The next weekly close could be crucial for Bitcoin's market structure.
Is BTC entering a deeper correction, or will bulls defend this historic support?
#bitcoinbreaksbelow200weekmovingaverage $BTC

SHERAZ FAHEEM 01:
Bitcoin's next move will be important. A strong recovery above the 200-week moving average could change the current market narrative.
3
5
9k

🚨 Bitcoin Loses a Major Long-Term Support Level!
Bitcoin briefly dropped below its 200-week moving average near $68,000, putting long-term market confidence to the test. Traders are now watching whether BTC can reclaim this important technical level or face further downside pressure.
$BTC $ETH $BNB
#bitcoinbreaksbelow200weekmovingaverage
🚨 Bitcoin Loses a Major Long-Term Support Level!
Bitcoin briefly dropped below its 200-week moving average near $68,000, putting long-term market confidence to the test. Traders are now watching whether BTC can reclaim this important technical level or face further downside pressure.
$BTC $ETH $BNB
#bitcoinbreaksbelow200weekmovingaverage
Bitcoin briefly dropped below its 200-week moving average near $68,000, putting long-term market confidence to the test. Traders are now watching whether BTC can reclaim this important technical level or face further downside pressure.
$BTC $ETH $BNB
#bitcoinbreaksbelow200weekmovingaverage
172

·
--
Bullish
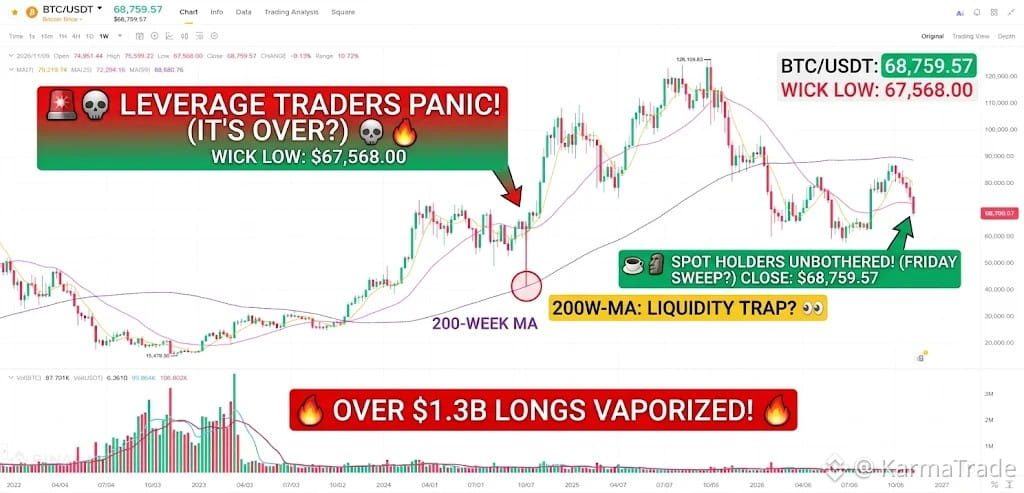
🚨 TIMELINE MELTDOWN: BITCOIN TOUCHES THE 200-WEEK MA! 😱📉
Every leverage trader on Crypto Twitter right now:
"IT’S OVER! PACK IT UP! ZERO IS COMING!" 💀🔥
Meanwhile, spot holders watching BTC wick down to $67,568 and immediately bounce back toward $68,750:
"Oh look, the classic Friday liquidation sweep." ☕🗿
Let’s be real:
Over $1.3B in leveraged longs just got vaporized so Wall Street could grab cheap liquidity.
An intraday wick below the 200-Week Moving Average (~$68K) is literally just a trap for late shorters—only the weekly close actually matters.
While the timeline panics over 4H red candles, high-timeframe spot bags ($BTC, $XRP,$PYTH) stay completely unbothered. 🛡️⚡
Are you panic-selling the bottom wick, or laughing at the leverage wipeout? Drop your move below! 👇😂
$BTC $XRP $PYTH
#bitcoinbreaksbelow200weekmovingaverage #BinanceSquare #crypto #altcoins
{spot}(BTCUSDT)
🚨 TIMELINE MELTDOWN: BITCOIN TOUCHES THE 200-WEEK MA! 😱📉
Every leverage trader on Crypto Twitter right now:
"IT’S OVER! PACK IT UP! ZERO IS COMING!" 💀🔥
Meanwhile, spot holders watching BTC wick down to $67,568 and immediately bounce back toward $68,750:
"Oh look, the classic Friday liquidation sweep." ☕🗿
Let’s be real:
Over $1.3B in leveraged longs just got vaporized so Wall Street could grab cheap liquidity.
An intraday wick below the 200-Week Moving Average (~$68K) is literally just a trap for late shorters—only the weekly close actually matters.
While the timeline panics over 4H red candles, high-timeframe spot bags ($BTC , $XRP ,$PYTH ) stay completely unbothered. 🛡️⚡
Are you panic-selling the bottom wick, or laughing at the leverage wipeout? Drop your move below! 👇😂
$BTC $XRP $PYTH
#bitcoinbreaksbelow200weekmovingaverage #BinanceSquare #crypto #altcoins
Every leverage trader on Crypto Twitter right now:
"IT’S OVER! PACK IT UP! ZERO IS COMING!" 💀🔥
Meanwhile, spot holders watching BTC wick down to $67,568 and immediately bounce back toward $68,750:
"Oh look, the classic Friday liquidation sweep." ☕🗿
Let’s be real:
Over $1.3B in leveraged longs just got vaporized so Wall Street could grab cheap liquidity.
An intraday wick below the 200-Week Moving Average (~$68K) is literally just a trap for late shorters—only the weekly close actually matters.
While the timeline panics over 4H red candles, high-timeframe spot bags ($BTC , $XRP ,$PYTH ) stay completely unbothered. 🛡️⚡
Are you panic-selling the bottom wick, or laughing at the leverage wipeout? Drop your move below! 👇😂
$BTC $XRP $PYTH
#bitcoinbreaksbelow200weekmovingaverage #BinanceSquare #crypto #altcoins
Mr Viral:
My portfolio crying in the corner 😢😭
13
44
55.4k

·
--
Bearish
#bitcoinbreaksbelow200weekmovingaverage
🚨 Bitcoin Breaks Below the 200-Week Moving Average
Bitcoin has fallen to around $67,500, briefly slipping below its 200-week moving average near $68,000 — a long-term trend level that traders closely watch during major market drawdowns.
This matters because the 200-week MA has historically acted as an important long-term support zone. However, a brief intraday break is not the same as a confirmed weekly breakdown. Traders will likely focus on whether BTC can reclaim the level or establish sustained closes below it.
Market sentiment is currently defensive, with broader risk assets also under pressure and roughly $600M in crypto long positions reportedly liquidated during the latest move.
From a technical perspective, holding the ~$68K region could stabilize sentiment. A sustained loss of this area would make the broader structure more vulnerable and could bring lower historical support zones back into focus.
Bottom line: The 200-week MA is now a critical battleground. The next few daily and weekly closes may be more important than the initial breakdown itself.
#Bitcoin #BTC #CryptoMarket #BitcoinNews
$AGT $BULLA $JCT
{future}(JCTUSDT)
{future}(BULLAUSDT)
{future}(AGTUSDT)
#bitcoinbreaksbelow200weekmovingaverage
🚨 Bitcoin Breaks Below the 200-Week Moving Average
Bitcoin has fallen to around $67,500, briefly slipping below its 200-week moving average near $68,000 — a long-term trend level that traders closely watch during major market drawdowns.
This matters because the 200-week MA has historically acted as an important long-term support zone. However, a brief intraday break is not the same as a confirmed weekly breakdown. Traders will likely focus on whether BTC can reclaim the level or establish sustained closes below it.
Market sentiment is currently defensive, with broader risk assets also under pressure and roughly $600M in crypto long positions reportedly liquidated during the latest move.
From a technical perspective, holding the ~$68K region could stabilize sentiment. A sustained loss of this area would make the broader structure more vulnerable and could bring lower historical support zones back into focus.
Bottom line: The 200-week MA is now a critical battleground. The next few daily and weekly closes may be more important than the initial breakdown itself.
#Bitcoin #BTC #CryptoMarket #BitcoinNews
$AGT $BULLA $JCT
🚨 Bitcoin Breaks Below the 200-Week Moving Average
Bitcoin has fallen to around $67,500, briefly slipping below its 200-week moving average near $68,000 — a long-term trend level that traders closely watch during major market drawdowns.
This matters because the 200-week MA has historically acted as an important long-term support zone. However, a brief intraday break is not the same as a confirmed weekly breakdown. Traders will likely focus on whether BTC can reclaim the level or establish sustained closes below it.
Market sentiment is currently defensive, with broader risk assets also under pressure and roughly $600M in crypto long positions reportedly liquidated during the latest move.
From a technical perspective, holding the ~$68K region could stabilize sentiment. A sustained loss of this area would make the broader structure more vulnerable and could bring lower historical support zones back into focus.
Bottom line: The 200-week MA is now a critical battleground. The next few daily and weekly closes may be more important than the initial breakdown itself.
#Bitcoin #BTC #CryptoMarket #BitcoinNews
$AGT $BULLA $JCT

SHERAZ FAHEEM 01:
The 200-week moving average is more than just another technical indicator. It represents an important historical reference for Bitcoin traders.
6
2
1.6k

Bitcoin has fallen below its 200-week moving average, a level many traders view as important long-term support. Is this just short-term volatility, or could it signal a deeper trend change?
How are you interpreting this move, and what price levels are you watching next?
#bitcoin #BTC
#bitcoinbreaksbelow200weekmovingaverage
Bitcoin has fallen below its 200-week moving average, a level many traders view as important long-term support. Is this just short-term volatility, or could it signal a deeper trend change?
How are you interpreting this move, and what price levels are you watching next?
#bitcoin #BTC
#bitcoinbreaksbelow200weekmovingaverage
How are you interpreting this move, and what price levels are you watching next?
#bitcoin #BTC
#bitcoinbreaksbelow200weekmovingaverage
145

·
--
Bitcoin slipping beneath its 200‑week moving average after a run of weekly declines is more than a chart talking point — it tests a long-term psychological support that many use to gauge regime shifts. A break can accelerate deleveraging and invite volatile liquidity sweeps, while a quick wick-and-bounce pattern can equally signal that spot demand still defends those levels.
My take: this move reads like an interplay of technical selling and macro pressure — others have tied it to dollar strength, higher yields, and ETF flows — which raises the odds of an extended volatile phase or a redefined trading range. Caveat: a single breach isn’t definitive; improving macro conditions or concentrated on‑chain holder behavior could reverse the signal.
Will long-term allocators treat the 200‑week MA as a buying anchor again, or has the macro regime made a lower structural floor more likely?
#bitcoinbreaksbelow200weekmovingaverage #BinanceSquare #CryptoTrends
Source discussion: https://binance.bnstatic.com/en/square/post/388023863439751
Bitcoin slipping beneath its 200‑week moving average after a run of weekly declines is more than a chart talking point — it tests a long-term psychological support that many use to gauge regime shifts. A break can accelerate deleveraging and invite volatile liquidity sweeps, while a quick wick-and-bounce pattern can equally signal that spot demand still defends those levels.
My take: this move reads like an interplay of technical selling and macro pressure — others have tied it to dollar strength, higher yields, and ETF flows — which raises the odds of an extended volatile phase or a redefined trading range. Caveat: a single breach isn’t definitive; improving macro conditions or concentrated on‑chain holder behavior could reverse the signal.
Will long-term allocators treat the 200‑week MA as a buying anchor again, or has the macro regime made a lower structural floor more likely?
#bitcoinbreaksbelow200weekmovingaverage #BinanceSquare #CryptoTrends
Source discussion: https://binance.bnstatic.com/en/square/post/388023863439751
My take: this move reads like an interplay of technical selling and macro pressure — others have tied it to dollar strength, higher yields, and ETF flows — which raises the odds of an extended volatile phase or a redefined trading range. Caveat: a single breach isn’t definitive; improving macro conditions or concentrated on‑chain holder behavior could reverse the signal.
Will long-term allocators treat the 200‑week MA as a buying anchor again, or has the macro regime made a lower structural floor more likely?
#bitcoinbreaksbelow200weekmovingaverage #BinanceSquare #CryptoTrends
Source discussion: https://binance.bnstatic.com/en/square/post/388023863439751
31

🚨 THE MOMENT OF TRUTH: BITCOIN TESTS THE 200-WEEK MA 🚨
We are officially testing one of the most critical long-term indicators in crypto. Today, Bitcoin flushed down to the $67,500 zone, directly retesting the 200-Week Moving Average sitting around $67,760 to $67,975.
Here is the unfiltered truth from a professional trader's desk:
📉 The Bear Case: If we print a definitive weekly close below the 200-WMA, the structural uptrend is at risk. The next major support band rests between $66,000 and $67,000, and if that gives way, the final structural floor is $62,300.
📈 The Bull Case: This exact same moving average caught the July sell-off and launched the August rally. Furthermore, the daily RSI is currently deeply oversold (registering at 26). Historically, capitulation wicks below this slow-moving average trap late shorts before a reversal.
The Gameplan:
Do not panic trade intraday noise. A single daily wick means little—the upcoming weekly close is everything. Protect your capital, wait for confirmation, and watch how the market reacts at this line in the sand.
Are you buying this retest or waiting for lower levels? Drop your strategy below. 👇
$BTC $AKE $KGEN
{future}(KGENUSDT)
{future}(AKEUSDT)
{future}(BTCUSDT)
#bitcoinbreaksbelow200weekmovingaverage #BTC #CryptoTrading #BinanceSquare
🚨 THE MOMENT OF TRUTH: BITCOIN TESTS THE 200-WEEK MA 🚨
We are officially testing one of the most critical long-term indicators in crypto. Today, Bitcoin flushed down to the $67,500 zone, directly retesting the 200-Week Moving Average sitting around $67,760 to $67,975.
Here is the unfiltered truth from a professional trader's desk:
📉 The Bear Case: If we print a definitive weekly close below the 200-WMA, the structural uptrend is at risk. The next major support band rests between $66,000 and $67,000, and if that gives way, the final structural floor is $62,300.
📈 The Bull Case: This exact same moving average caught the July sell-off and launched the August rally. Furthermore, the daily RSI is currently deeply oversold (registering at 26). Historically, capitulation wicks below this slow-moving average trap late shorts before a reversal.
The Gameplan:
Do not panic trade intraday noise. A single daily wick means little—the upcoming weekly close is everything. Protect your capital, wait for confirmation, and watch how the market reacts at this line in the sand.
Are you buying this retest or waiting for lower levels? Drop your strategy below. 👇
$BTC $AKE $KGEN
#bitcoinbreaksbelow200weekmovingaverage #BTC #CryptoTrading #BinanceSquare
We are officially testing one of the most critical long-term indicators in crypto. Today, Bitcoin flushed down to the $67,500 zone, directly retesting the 200-Week Moving Average sitting around $67,760 to $67,975.
Here is the unfiltered truth from a professional trader's desk:
📉 The Bear Case: If we print a definitive weekly close below the 200-WMA, the structural uptrend is at risk. The next major support band rests between $66,000 and $67,000, and if that gives way, the final structural floor is $62,300.
📈 The Bull Case: This exact same moving average caught the July sell-off and launched the August rally. Furthermore, the daily RSI is currently deeply oversold (registering at 26). Historically, capitulation wicks below this slow-moving average trap late shorts before a reversal.
The Gameplan:
Do not panic trade intraday noise. A single daily wick means little—the upcoming weekly close is everything. Protect your capital, wait for confirmation, and watch how the market reacts at this line in the sand.
Are you buying this retest or waiting for lower levels? Drop your strategy below. 👇
$BTC $AKE $KGEN
#bitcoinbreaksbelow200weekmovingaverage #BTC #CryptoTrading #BinanceSquare

SpaVodka:
One detail from Binance perps: the 24h low was 66,427, so that pocket already took a first sweep and price held above it. A second test with open interest rising again would be the real warning sign.
10
7
4.7k

·
--
Bullish
#bitcoinbreaksbelow200weekmovingaverage
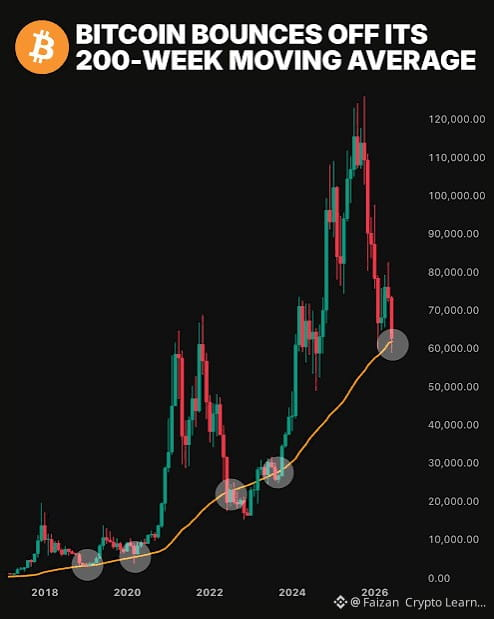
🚨 Bitcoin Loses Its 200-Week Moving Average — Is a Deeper Correction Coming?
Bitcoin has broken below its 200-week moving average, one of the most closely watched long-term indicators in the crypto market.
This level has historically acted as an important support zone during major market corrections. Losing it could signal weakening long-term momentum and increase uncertainty among investors.
Why It Matters:
Bearish pressure: $BTC trading below the 200-week MA raises concerns about further downside.
Critical support: Bulls need to reclaim this level to restore confidence.
Market sentiment: A sustained breakdown could trigger additional selling pressure across altcoins.
My Take: Bitcoin's next move is critical. If buyers fail to reclaim the 200-week moving average, the market could face another wave of volatility. However, a quick recovery above this level could turn the breakdown into a potential bear trap.
Will BTC reclaim the 200-week moving average, or are bears taking control?
#bitcoin #BTC #CryptoMarket
#bitcoinbreaksbelow200weekmovingaverage
🚨 Bitcoin Loses Its 200-Week Moving Average — Is a Deeper Correction Coming?
Bitcoin has broken below its 200-week moving average, one of the most closely watched long-term indicators in the crypto market.
This level has historically acted as an important support zone during major market corrections. Losing it could signal weakening long-term momentum and increase uncertainty among investors.
Why It Matters:
Bearish pressure: $BTC trading below the 200-week MA raises concerns about further downside.
Critical support: Bulls need to reclaim this level to restore confidence.
Market sentiment: A sustained breakdown could trigger additional selling pressure across altcoins.
My Take: Bitcoin's next move is critical. If buyers fail to reclaim the 200-week moving average, the market could face another wave of volatility. However, a quick recovery above this level could turn the breakdown into a potential bear trap.
Will BTC reclaim the 200-week moving average, or are bears taking control?
#bitcoin #BTC #CryptoMarket
🚨 Bitcoin Loses Its 200-Week Moving Average — Is a Deeper Correction Coming?
Bitcoin has broken below its 200-week moving average, one of the most closely watched long-term indicators in the crypto market.
This level has historically acted as an important support zone during major market corrections. Losing it could signal weakening long-term momentum and increase uncertainty among investors.
Why It Matters:
Bearish pressure: $BTC trading below the 200-week MA raises concerns about further downside.
Critical support: Bulls need to reclaim this level to restore confidence.
Market sentiment: A sustained breakdown could trigger additional selling pressure across altcoins.
My Take: Bitcoin's next move is critical. If buyers fail to reclaim the 200-week moving average, the market could face another wave of volatility. However, a quick recovery above this level could turn the breakdown into a potential bear trap.
Will BTC reclaim the 200-week moving average, or are bears taking control?
#bitcoin #BTC #CryptoMarket
SHERAZ FAHEEM 01:
Bitcoin is entering a technically sensitive zone. The ability to regain lost support could determine the next major direction.
1
3
1.9k

·
--
#BitcoinBreaksBelow200WeekMovingAverage
📊 What Does It Mean When Bitcoin Breaks Below the 200-Week Moving Average?
The 200-Week Moving Average (200W MA) is one of the most important long-term indicators in Bitcoin's technical analysis.
It represents Bitcoin's average price over approximately the last 200 weeks (nearly 4 years).
Historically, this level has acted as an important long-term support zone during several Bitcoin market cycles.
🔴 Why is it important?
When Bitcoin falls below the 200W MA, it may indicate weakening long-term market momentum and increased selling pressure.
🟢 What should traders watch next?
1. Whether BTC can recover above the 200W MA.
2. Whether the weekly candle closes below this level.
3. Whether buyers return with stronger volume.
4. Whether this level turns from support into resistance.
Important: A temporary break below the 200W MA does not automatically mean a bear market is confirmed. Confirmation requires further price action.
💬 What do you think? Will Bitcoin recover above the 200W MA, or could further downside follow?
#bitcoin #BTC #CryptoAnalysis #TechnicalAnalysisPost
#BitcoinBreaksBelow200WeekMovingAverage
📊 What Does It Mean When Bitcoin Breaks Below the 200-Week Moving Average?
The 200-Week Moving Average (200W MA) is one of the most important long-term indicators in Bitcoin's technical analysis.
It represents Bitcoin's average price over approximately the last 200 weeks (nearly 4 years).
Historically, this level has acted as an important long-term support zone during several Bitcoin market cycles.
🔴 Why is it important?
When Bitcoin falls below the 200W MA, it may indicate weakening long-term market momentum and increased selling pressure.
🟢 What should traders watch next?
1. Whether BTC can recover above the 200W MA.
2. Whether the weekly candle closes below this level.
3. Whether buyers return with stronger volume.
4. Whether this level turns from support into resistance.
Important: A temporary break below the 200W MA does not automatically mean a bear market is confirmed. Confirmation requires further price action.
💬 What do you think? Will Bitcoin recover above the 200W MA, or could further downside follow?
#bitcoin #BTC #CryptoAnalysis #TechnicalAnalysisPost
📊 What Does It Mean When Bitcoin Breaks Below the 200-Week Moving Average?
The 200-Week Moving Average (200W MA) is one of the most important long-term indicators in Bitcoin's technical analysis.
It represents Bitcoin's average price over approximately the last 200 weeks (nearly 4 years).
Historically, this level has acted as an important long-term support zone during several Bitcoin market cycles.
🔴 Why is it important?
When Bitcoin falls below the 200W MA, it may indicate weakening long-term market momentum and increased selling pressure.
🟢 What should traders watch next?
1. Whether BTC can recover above the 200W MA.
2. Whether the weekly candle closes below this level.
3. Whether buyers return with stronger volume.
4. Whether this level turns from support into resistance.
Important: A temporary break below the 200W MA does not automatically mean a bear market is confirmed. Confirmation requires further price action.
💬 What do you think? Will Bitcoin recover above the 200W MA, or could further downside follow?
#bitcoin #BTC #CryptoAnalysis #TechnicalAnalysisPost
1
396

#bitcoinbreaksbelow200weekmovingaverage
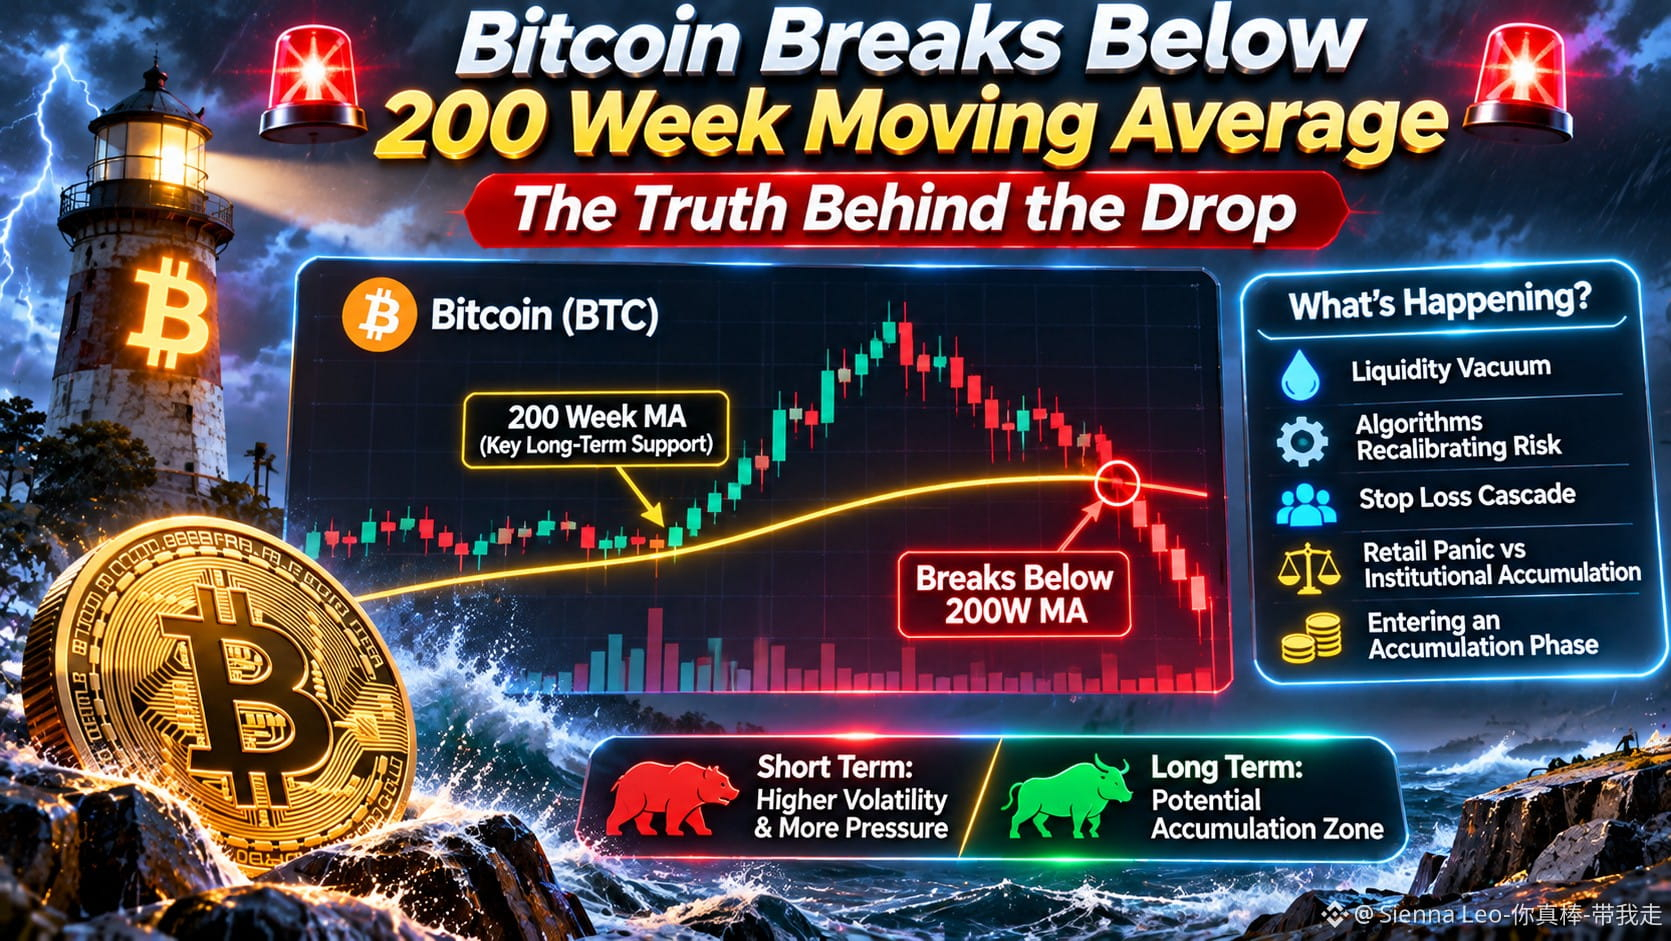
🚨 $BITCOIN Breaks Below 200 Week Moving Average: The Truth Behind the Drop 🚨
🌊 Imagine watching a lighthouse blink out during a storm. For years, that beam guided traders through the darkest crypto winters. Today, the light just faded.
📉 Bitcoin has officially slipped below its 200 week moving average. This is not just a technical glitch, but a profound shift in market psychology.
💧 The real driver here is a liquidity vacuum. Institutional algorithms are recalibrating risk, triggering a cascade of stop losses that drained short term support.
🧠 When this historic line breaks, retail panic usually meets institutional accumulation. We are entering a volatility squeeze where weak hands exit and patient capital builds positions.
🛡️ Do not let the red candles blind you. Historically, this level marks the beginning of a painful but necessary accumulation phase, not the end of the cycle.
💎 The market is testing your conviction, not your portfolio.
❓ Are you buying this dip or waiting for a confirmed reversal?
⚠️ This is not financial advice. Always do your own research.
#Bitcoin #CryptoMarket #GrowWithSAC $CBRSB $HUMA
#BitcoinBreaksBelow200WeekMovingAverage
#bitcoinbreaksbelow200weekmovingaverage
🚨 $BITCOIN Breaks Below 200 Week Moving Average: The Truth Behind the Drop 🚨
🌊 Imagine watching a lighthouse blink out during a storm. For years, that beam guided traders through the darkest crypto winters. Today, the light just faded.
📉 Bitcoin has officially slipped below its 200 week moving average. This is not just a technical glitch, but a profound shift in market psychology.
💧 The real driver here is a liquidity vacuum. Institutional algorithms are recalibrating risk, triggering a cascade of stop losses that drained short term support.
🧠 When this historic line breaks, retail panic usually meets institutional accumulation. We are entering a volatility squeeze where weak hands exit and patient capital builds positions.
🛡️ Do not let the red candles blind you. Historically, this level marks the beginning of a painful but necessary accumulation phase, not the end of the cycle.
💎 The market is testing your conviction, not your portfolio.
❓ Are you buying this dip or waiting for a confirmed reversal?
⚠️ This is not financial advice. Always do your own research.
#Bitcoin #CryptoMarket #GrowWithSAC $CBRSB $HUMA
#BitcoinBreaksBelow200WeekMovingAverage
🚨 $BITCOIN Breaks Below 200 Week Moving Average: The Truth Behind the Drop 🚨
🌊 Imagine watching a lighthouse blink out during a storm. For years, that beam guided traders through the darkest crypto winters. Today, the light just faded.
📉 Bitcoin has officially slipped below its 200 week moving average. This is not just a technical glitch, but a profound shift in market psychology.
💧 The real driver here is a liquidity vacuum. Institutional algorithms are recalibrating risk, triggering a cascade of stop losses that drained short term support.
🧠 When this historic line breaks, retail panic usually meets institutional accumulation. We are entering a volatility squeeze where weak hands exit and patient capital builds positions.
🛡️ Do not let the red candles blind you. Historically, this level marks the beginning of a painful but necessary accumulation phase, not the end of the cycle.
💎 The market is testing your conviction, not your portfolio.
❓ Are you buying this dip or waiting for a confirmed reversal?
⚠️ This is not financial advice. Always do your own research.
#Bitcoin #CryptoMarket #GrowWithSAC $CBRSB $HUMA
#BitcoinBreaksBelow200WeekMovingAverage
SHERAZ FAHEEM 01:
Long-term investors should focus on the bigger market structure rather than reacting emotionally to short-term volatility.
1
3
4k

#bitcoinbreaksbelow200weekmovingaverage#bitcoinbreaksbelow200weekmovingaverage
Bitcoin has broken below its 200-week simple moving average (200WMA).
Historically, the 200WMA has served as the ultimate structural baseline support across major multi-year cycles. When price action drops below this boundary, it reshapes both macro sentiment and tactical trading strategies.
Current Market Breakdown Context
Key Support Breach: Bitcoin traded as low as $67,500 – $67,652, penetrating the critical 200WMA boundary near $68,000.Macro Pressure: The breakdown coincides with macroeconomic tightening—driven by elevated U.S. 10-year Treasury yields reaching 5.125%, the DXY breaking above 103, and persistent spot Bitcoin ETF outflows totaling $1.44B to $2.57B over recent weeks.Leverage Wipeout: Over $1.3B in total futures liquidations hit the market across 24 hours, with more than $677M in Bitcoin positions liquidated.
What History Teaches About 200WMA Breaches
Historically, a 200WMA breakdown marks a transition into deep structural value zones or prolonged macro accumulation periods:
Cycle Bottom Proximity: In previous major crypto cycles (such as 2018–2019 and 2022–2023), trading below the 200WMA signaled the terminal structural phase of a bear trend.The Liquidity Sweep Risk: Historically, wicks below the 200-week line act as high-volume liquidity clearouts designed to trigger mass stop-losses before structural bottoms form.Indicator Confluence: When the weekly Relative Strength Index (RSI) drops alongside a 200WMA breach, failure to hold immediate horizontal floors (e.g., around $57,700) leaves open potential retests of prior cycle demand blocks.
Key Technical Levels to Track
#Ethereum #BTC #solana
#bitcoinbreaksbelow200weekmovingaverage
#bitcoinbreaksbelow200weekmovingaverage
Bitcoin has broken below its 200-week simple moving average (200WMA).
Historically, the 200WMA has served as the ultimate structural baseline support across major multi-year cycles. When price action drops below this boundary, it reshapes both macro sentiment and tactical trading strategies.
Current Market Breakdown Context
Key Support Breach: Bitcoin traded as low as $67,500 – $67,652, penetrating the critical 200WMA boundary near $68,000.Macro Pressure: The breakdown coincides with macroeconomic tightening—driven by elevated U.S. 10-year Treasury yields reaching 5.125%, the DXY breaking above 103, and persistent spot Bitcoin ETF outflows totaling $1.44B to $2.57B over recent weeks.Leverage Wipeout: Over $1.3B in total futures liquidations hit the market across 24 hours, with more than $677M in Bitcoin positions liquidated.
What History Teaches About 200WMA Breaches
Historically, a 200WMA breakdown marks a transition into deep structural value zones or prolonged macro accumulation periods:
Cycle Bottom Proximity: In previous major crypto cycles (such as 2018–2019 and 2022–2023), trading below the 200WMA signaled the terminal structural phase of a bear trend.The Liquidity Sweep Risk: Historically, wicks below the 200-week line act as high-volume liquidity clearouts designed to trigger mass stop-losses before structural bottoms form.Indicator Confluence: When the weekly Relative Strength Index (RSI) drops alongside a 200WMA breach, failure to hold immediate horizontal floors (e.g., around $57,700) leaves open potential retests of prior cycle demand blocks.
Key Technical Levels to Track
#Ethereum #BTC #solana
Bitcoin has broken below its 200-week simple moving average (200WMA).
Historically, the 200WMA has served as the ultimate structural baseline support across major multi-year cycles. When price action drops below this boundary, it reshapes both macro sentiment and tactical trading strategies.
Current Market Breakdown Context
Key Support Breach: Bitcoin traded as low as $67,500 – $67,652, penetrating the critical 200WMA boundary near $68,000.Macro Pressure: The breakdown coincides with macroeconomic tightening—driven by elevated U.S. 10-year Treasury yields reaching 5.125%, the DXY breaking above 103, and persistent spot Bitcoin ETF outflows totaling $1.44B to $2.57B over recent weeks.Leverage Wipeout: Over $1.3B in total futures liquidations hit the market across 24 hours, with more than $677M in Bitcoin positions liquidated.
What History Teaches About 200WMA Breaches
Historically, a 200WMA breakdown marks a transition into deep structural value zones or prolonged macro accumulation periods:
Cycle Bottom Proximity: In previous major crypto cycles (such as 2018–2019 and 2022–2023), trading below the 200WMA signaled the terminal structural phase of a bear trend.The Liquidity Sweep Risk: Historically, wicks below the 200-week line act as high-volume liquidity clearouts designed to trigger mass stop-losses before structural bottoms form.Indicator Confluence: When the weekly Relative Strength Index (RSI) drops alongside a 200WMA breach, failure to hold immediate horizontal floors (e.g., around $57,700) leaves open potential retests of prior cycle demand blocks.
Key Technical Levels to Track
#Ethereum #BTC #solana
59

·
--
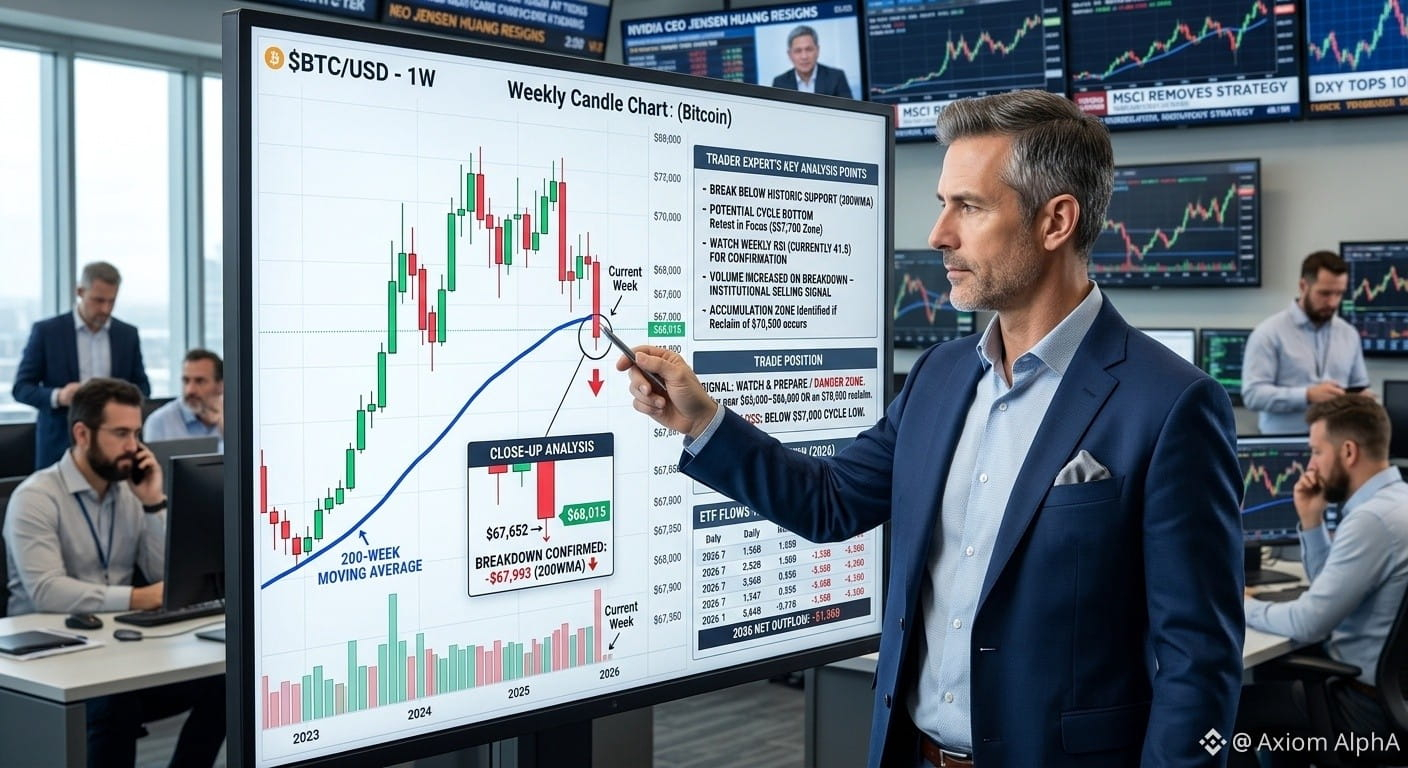
Bitcoin Breaks and Sustains Below Its 200-Week Moving Average, Opening a New Phase of Price Discovery
Historically, Bitcoin (BTC) dropping below its 200-week moving average (WMA)—currently hovering near $70,110—has signaled extreme structural weakness and a shift from a bull cycle to deep, long-term capitulation. For the first time, however, Bitcoin has not just dipped, but has spent four consecutive weeks decisively below this historic level, consolidating near $67,652 by the end of May. This is a critical technical invalidation. When this support breaks, volatility and negative momentum tend to cascade.
Here is the tactical trade plan for the top three coins on watch during this historic breakdown:
$BTC (The Benchmark Breakdown)
Entry: Short on rejection near the $69,500–$70,110 reclaim zone, OR add to existing shorts on a break below current $67,200 support. Buy dips only on clear, high-volume reclaims.
Targets: $64,000–$66,000 | $57,700–$59,500 | Stop-Loss: $70,800 (above the 200WMA and recent lower high).
$ZEC (Zcash — The High-Beta Privacy Divergence)
Entry: Buy a sustained close above recent range resistance at $960 with heavy volume, or accumulate near historic support at $840–$880.
Targets: $1,050–$1,120 | $1,250–$1,350 | Stop-Loss: $780 (below the structure low).
$ETH (Ethereum — The Spot ETF Flow Divergence)
Entry: Buy the $1,850–$1,920 demand zone, or wait for a confirmed 4H close above current technical resistance at $1,985.
Targets: $2,080–$2,180 | $2,280–$2,380 | Stop-Loss: $1,780 (below the recent lower high structure).
Disclaimer: Market analysis only, not financial advice. Major moving average breakdowns and macro news create heightened volatility—manage position size carefully and always use stop-losses. DYOR.
{spot}(BTCUSDT)
{spot}(ZECUSDT)
{spot}(ETHUSDT)
#BitcoinBreaksBelow200WeekMovingAverage #BinanceSquare2026 #BitcoinETF #Write2Earn
Bitcoin Breaks and Sustains Below Its 200-Week Moving Average, Opening a New Phase of Price Discovery
Historically, Bitcoin (BTC) dropping below its 200-week moving average (WMA)—currently hovering near $70,110—has signaled extreme structural weakness and a shift from a bull cycle to deep, long-term capitulation. For the first time, however, Bitcoin has not just dipped, but has spent four consecutive weeks decisively below this historic level, consolidating near $67,652 by the end of May. This is a critical technical invalidation. When this support breaks, volatility and negative momentum tend to cascade.
Here is the tactical trade plan for the top three coins on watch during this historic breakdown:
$BTC (The Benchmark Breakdown)
Entry: Short on rejection near the $69,500–$70,110 reclaim zone, OR add to existing shorts on a break below current $67,200 support. Buy dips only on clear, high-volume reclaims.
Targets: $64,000–$66,000 | $57,700–$59,500 | Stop-Loss: $70,800 (above the 200WMA and recent lower high).
$ZEC (Zcash — The High-Beta Privacy Divergence)
Entry: Buy a sustained close above recent range resistance at $960 with heavy volume, or accumulate near historic support at $840–$880.
Targets: $1,050–$1,120 | $1,250–$1,350 | Stop-Loss: $780 (below the structure low).
$ETH (Ethereum — The Spot ETF Flow Divergence)
Entry: Buy the $1,850–$1,920 demand zone, or wait for a confirmed 4H close above current technical resistance at $1,985.
Targets: $2,080–$2,180 | $2,280–$2,380 | Stop-Loss: $1,780 (below the recent lower high structure).
Disclaimer: Market analysis only, not financial advice. Major moving average breakdowns and macro news create heightened volatility—manage position size carefully and always use stop-losses. DYOR.
#BitcoinBreaksBelow200WeekMovingAverage #BinanceSquare2026 #BitcoinETF #Write2Earn
Historically, Bitcoin (BTC) dropping below its 200-week moving average (WMA)—currently hovering near $70,110—has signaled extreme structural weakness and a shift from a bull cycle to deep, long-term capitulation. For the first time, however, Bitcoin has not just dipped, but has spent four consecutive weeks decisively below this historic level, consolidating near $67,652 by the end of May. This is a critical technical invalidation. When this support breaks, volatility and negative momentum tend to cascade.
Here is the tactical trade plan for the top three coins on watch during this historic breakdown:
$BTC (The Benchmark Breakdown)
Entry: Short on rejection near the $69,500–$70,110 reclaim zone, OR add to existing shorts on a break below current $67,200 support. Buy dips only on clear, high-volume reclaims.
Targets: $64,000–$66,000 | $57,700–$59,500 | Stop-Loss: $70,800 (above the 200WMA and recent lower high).
$ZEC (Zcash — The High-Beta Privacy Divergence)
Entry: Buy a sustained close above recent range resistance at $960 with heavy volume, or accumulate near historic support at $840–$880.
Targets: $1,050–$1,120 | $1,250–$1,350 | Stop-Loss: $780 (below the structure low).
$ETH (Ethereum — The Spot ETF Flow Divergence)
Entry: Buy the $1,850–$1,920 demand zone, or wait for a confirmed 4H close above current technical resistance at $1,985.
Targets: $2,080–$2,180 | $2,280–$2,380 | Stop-Loss: $1,780 (below the recent lower high structure).
Disclaimer: Market analysis only, not financial advice. Major moving average breakdowns and macro news create heightened volatility—manage position size carefully and always use stop-losses. DYOR.
#BitcoinBreaksBelow200WeekMovingAverage #BinanceSquare2026 #BitcoinETF #Write2Earn
1
276

·
--
Bullish
#BitcoinBreaksBelow200WeekMovingAverage Bitcoin Breaks Below the 200-Week Moving Average: Is the Long-Term Trend at Risk?
Bitcoin is facing an important technical challenge after falling below its 200-week moving average, a level that has historically attracted significant attention from long-term investors. On November 14, BTC traded around $67,200, while the 200-week moving average stood near $67,992.
This development deserves attention because the 200-week moving average has often acted as a major long-term support zone during previous market cycles. A sustained move below this level could indicate that selling pressure is becoming stronger and that market confidence is weakening.
Several factors are contributing to the current pressure, including continued ETF outflows, broader risk aversion, and uncertainty surrounding future Federal Reserve policy. Technical indicators are also showing weakness, with Bitcoin's daily RSI entering deeply oversold territory.
However, traders should avoid treating one temporary breakdown as confirmation of a prolonged bear market. The weekly candle has not closed yet, making the upcoming weekly close particularly important.
The key levels to monitor are the $68,000 region for a potential recovery and $66,000 for nearby downside support. A sustained recovery above the long-term average could improve sentiment, while continued weakness may expose lower support zones.
For now, patience and confirmation matter more than predictions. Bitcoin's next weekly close could provide an important signal about the strength of its broader market structure.
$AKE
{future}(AKEUSDT)
$SHELL
{future}(SHELLUSDT)
$TAC
{future}(TACUSDT)
#BitcoinBreaksBelow200WeekMovingAverage Bitcoin Breaks Below the 200-Week Moving Average: Is the Long-Term Trend at Risk?
Bitcoin is facing an important technical challenge after falling below its 200-week moving average, a level that has historically attracted significant attention from long-term investors. On November 14, BTC traded around $67,200, while the 200-week moving average stood near $67,992.
This development deserves attention because the 200-week moving average has often acted as a major long-term support zone during previous market cycles. A sustained move below this level could indicate that selling pressure is becoming stronger and that market confidence is weakening.
Several factors are contributing to the current pressure, including continued ETF outflows, broader risk aversion, and uncertainty surrounding future Federal Reserve policy. Technical indicators are also showing weakness, with Bitcoin's daily RSI entering deeply oversold territory.
However, traders should avoid treating one temporary breakdown as confirmation of a prolonged bear market. The weekly candle has not closed yet, making the upcoming weekly close particularly important.
The key levels to monitor are the $68,000 region for a potential recovery and $66,000 for nearby downside support. A sustained recovery above the long-term average could improve sentiment, while continued weakness may expose lower support zones.
For now, patience and confirmation matter more than predictions. Bitcoin's next weekly close could provide an important signal about the strength of its broader market structure.
$AKE
$SHELL
$TAC
Bitcoin is facing an important technical challenge after falling below its 200-week moving average, a level that has historically attracted significant attention from long-term investors. On November 14, BTC traded around $67,200, while the 200-week moving average stood near $67,992.
This development deserves attention because the 200-week moving average has often acted as a major long-term support zone during previous market cycles. A sustained move below this level could indicate that selling pressure is becoming stronger and that market confidence is weakening.
Several factors are contributing to the current pressure, including continued ETF outflows, broader risk aversion, and uncertainty surrounding future Federal Reserve policy. Technical indicators are also showing weakness, with Bitcoin's daily RSI entering deeply oversold territory.
However, traders should avoid treating one temporary breakdown as confirmation of a prolonged bear market. The weekly candle has not closed yet, making the upcoming weekly close particularly important.
The key levels to monitor are the $68,000 region for a potential recovery and $66,000 for nearby downside support. A sustained recovery above the long-term average could improve sentiment, while continued weakness may expose lower support zones.
For now, patience and confirmation matter more than predictions. Bitcoin's next weekly close could provide an important signal about the strength of its broader market structure.
$AKE
$SHELL
$TAC

89

Article
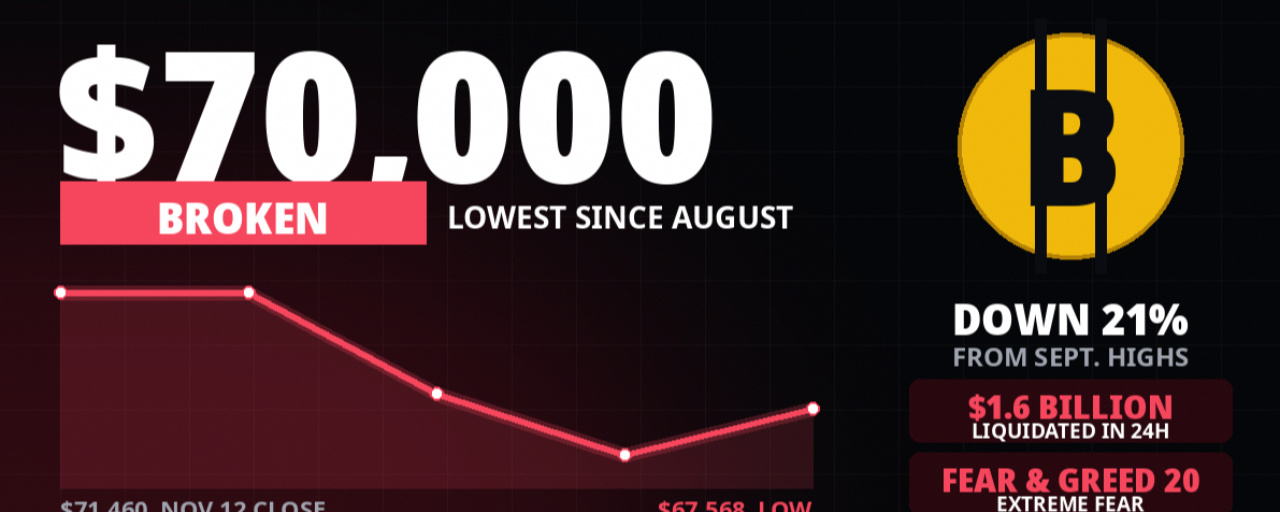
BITCOIN BREAKS $70,000 — $1.6 BILLION LIQUIDATED. WHAT SHOULD TRADERS WATCH?Let's be honest. Bitcoin just broke the level everyone was watching — and it did it fast.
$70,000 is gone. Bitcoin fell through it on Friday morning, dipping to about $67,500 — its lowest since August — and slid further on Saturday morning, now probing $66,600, sitting under the 200-week average near $67,993, a line it had not tested since August 19. Over $1.6 billion in leveraged positions were liquidated in 24 hours. The Fear & Greed Index sits at 20 — extreme fear.
1. WHY DID IT BREAK?
October producer prices rose 0.3% on the month and 6.5% on the year — the highest annual reading since November 2022. The 10-year Treasury yield climbed to 5.15%. Traders are now pricing a roughly 90% chance of a December rate hike. Bitcoin is trading with rates right now, not with tech stocks.
2. THE ETF BLEED
US spot Bitcoin ETFs have now seen five straight sessions of outflows — about $1.44 billion withdrawn — and flows for 2026 have turned negative. When the ETFs bleed for a week straight, the bid under the market thins out. Order-book depth is already about a third below normal.
3. WHAT ACTUALLY MATTERS NEXT
That $67,500–$68,000 zone did NOT hold. Bitcoin slid through it on Saturday morning and is now probing $66,600. The next question is whether $66,600 holds — lose it, and the market starts talking about $57,700. October retail sales land Tuesday, FOMC minutes Wednesday — both feed straight into the December rate decision.
NOW, LET'S TALK ABOUT THE OTHER SIDE
Every crash has its buyers, and the other side of this story is simple: nothing about Bitcoin's supply changed this week. The same 21 million cap, the same fixed issuance. Panic reprices the asset — it does not rewrite the code. But "cheap" is not a plan when the trend is down and the Fed is hiking.
MY TAKE
I am not catching this knife. A reclaim of $70,000 with ETF flows turning positive again is the first honest sign the bleeding has stopped — until then, this is a market to watch, not chase.
One practical line: if you trade this, size for a market that just wiped $1.6 billion in a day — because it can do it again tomorrow.
What matters most to you right now — $66,600 holding, or the Fed's December decision?
$BTC
#BitcoinBreaksBelow200WeekMovingAverage
BITCOIN BREAKS $70,000 — $1.6 BILLION LIQUIDATED. WHAT SHOULD TRADERS WATCH?
Let's be honest. Bitcoin just broke the level everyone was watching — and it did it fast.
$70,000 is gone. Bitcoin fell through it on Friday morning, dipping to about $67,500 — its lowest since August — and slid further on Saturday morning, now probing $66,600, sitting under the 200-week average near $67,993, a line it had not tested since August 19. Over $1.6 billion in leveraged positions were liquidated in 24 hours. The Fear & Greed Index sits at 20 — extreme fear.
1. WHY DID IT BREAK?
October producer prices rose 0.3% on the month and 6.5% on the year — the highest annual reading since November 2022. The 10-year Treasury yield climbed to 5.15%. Traders are now pricing a roughly 90% chance of a December rate hike. Bitcoin is trading with rates right now, not with tech stocks.
2. THE ETF BLEED
US spot Bitcoin ETFs have now seen five straight sessions of outflows — about $1.44 billion withdrawn — and flows for 2026 have turned negative. When the ETFs bleed for a week straight, the bid under the market thins out. Order-book depth is already about a third below normal.
3. WHAT ACTUALLY MATTERS NEXT
That $67,500–$68,000 zone did NOT hold. Bitcoin slid through it on Saturday morning and is now probing $66,600. The next question is whether $66,600 holds — lose it, and the market starts talking about $57,700. October retail sales land Tuesday, FOMC minutes Wednesday — both feed straight into the December rate decision.
NOW, LET'S TALK ABOUT THE OTHER SIDE
Every crash has its buyers, and the other side of this story is simple: nothing about Bitcoin's supply changed this week. The same 21 million cap, the same fixed issuance. Panic reprices the asset — it does not rewrite the code. But "cheap" is not a plan when the trend is down and the Fed is hiking.
MY TAKE
I am not catching this knife. A reclaim of $70,000 with ETF flows turning positive again is the first honest sign the bleeding has stopped — until then, this is a market to watch, not chase.
One practical line: if you trade this, size for a market that just wiped $1.6 billion in a day — because it can do it again tomorrow.
What matters most to you right now — $66,600 holding, or the Fed's December decision?
$BTC
#BitcoinBreaksBelow200WeekMovingAverage
$70,000 is gone. Bitcoin fell through it on Friday morning, dipping to about $67,500 — its lowest since August — and slid further on Saturday morning, now probing $66,600, sitting under the 200-week average near $67,993, a line it had not tested since August 19. Over $1.6 billion in leveraged positions were liquidated in 24 hours. The Fear & Greed Index sits at 20 — extreme fear.
1. WHY DID IT BREAK?
October producer prices rose 0.3% on the month and 6.5% on the year — the highest annual reading since November 2022. The 10-year Treasury yield climbed to 5.15%. Traders are now pricing a roughly 90% chance of a December rate hike. Bitcoin is trading with rates right now, not with tech stocks.
2. THE ETF BLEED
US spot Bitcoin ETFs have now seen five straight sessions of outflows — about $1.44 billion withdrawn — and flows for 2026 have turned negative. When the ETFs bleed for a week straight, the bid under the market thins out. Order-book depth is already about a third below normal.
3. WHAT ACTUALLY MATTERS NEXT
That $67,500–$68,000 zone did NOT hold. Bitcoin slid through it on Saturday morning and is now probing $66,600. The next question is whether $66,600 holds — lose it, and the market starts talking about $57,700. October retail sales land Tuesday, FOMC minutes Wednesday — both feed straight into the December rate decision.
NOW, LET'S TALK ABOUT THE OTHER SIDE
Every crash has its buyers, and the other side of this story is simple: nothing about Bitcoin's supply changed this week. The same 21 million cap, the same fixed issuance. Panic reprices the asset — it does not rewrite the code. But "cheap" is not a plan when the trend is down and the Fed is hiking.
MY TAKE
I am not catching this knife. A reclaim of $70,000 with ETF flows turning positive again is the first honest sign the bleeding has stopped — until then, this is a market to watch, not chase.
One practical line: if you trade this, size for a market that just wiped $1.6 billion in a day — because it can do it again tomorrow.
What matters most to you right now — $66,600 holding, or the Fed's December decision?
$BTC
#BitcoinBreaksBelow200WeekMovingAverage
86
Log in to explore more content
Join global crypto users on Binance Square
⚡️ Get latest and useful information about crypto.
💬 Trusted by the world’s largest crypto exchange.
👍 Discover real insights from verified creators.
Email / Phone number
Trending Topics
1
#WhoWillSucceedJensenHuangatNvidia?
81,433 views
1,108 Discussing
2
#WhatWillDriveCryptoandStocks’NextRebound?
431,655 views
3,003 Discussing
3
#BitcoinActiveSupplyInProfitDropsBelow45%
21,738 views
330 Discussing
4
#KavaSaysAbnormalActivityLimitedToKavaLend
8,507 views
166 Discussing
5
#USSpotXRPETFsSeeLargestWeeklyOutflowIn8Months
7,720 views
159 Discussing
6
#USPPIMissMayEaseBTCPressure
206,752 views
2,041 Discussing
7
#WORPTLetsTouristsConvertCryptoToThaiBaht
2,550 views
49 Discussing
8
#TONStrategyReports$23.97MQ3NetLoss
3,193 views
41 Discussing
9
#PolkadotCommunityApprovesNewStrategyWith97%Vote
18,626 views
242 Discussing
10
#dYdXPlansV9.9UpgradeToShiftUSDCToInjective
11,380 views
195 Discussing