
#technicalanalysis
technicalanalysis
28.4M views
198,625 Discussing
Hot
Latest

·
--
Bearish
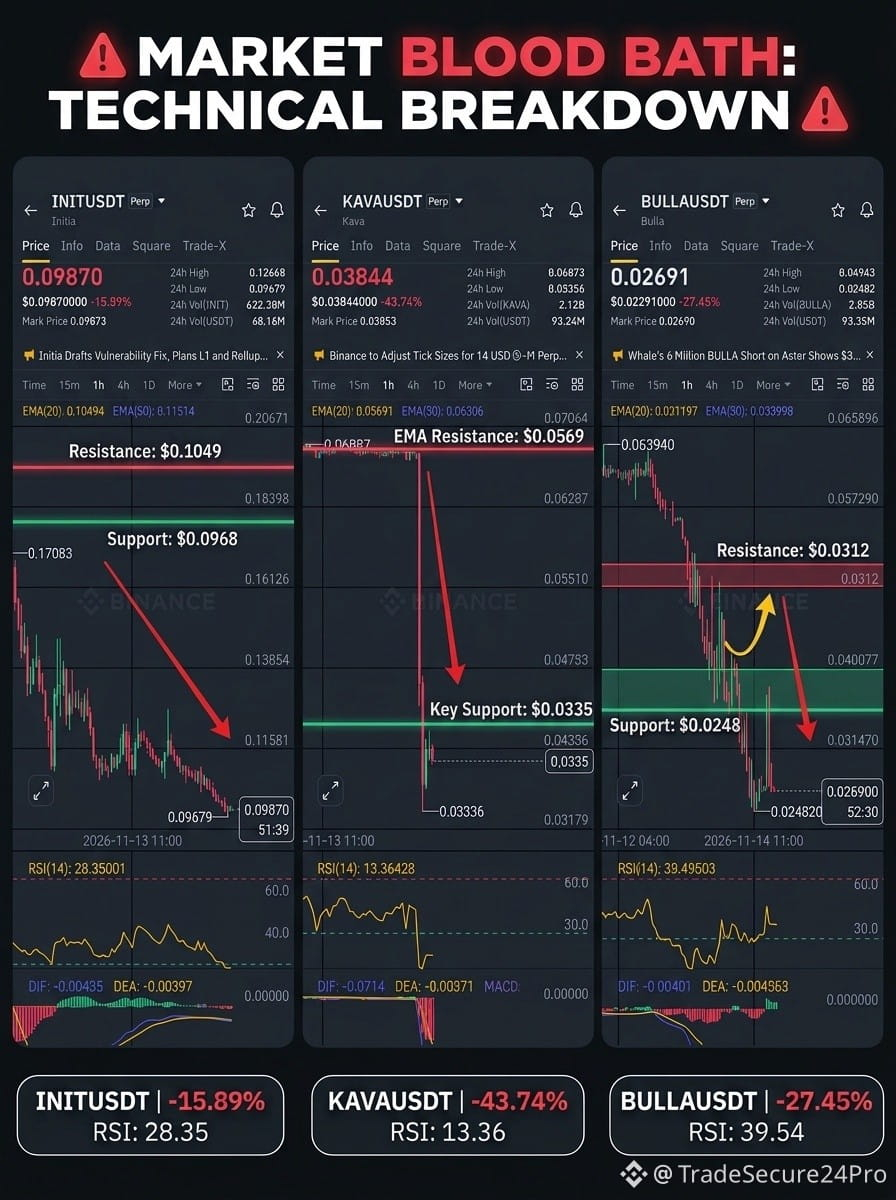
🚨 MARKET BLOOD BATH: 3 Coins Facing Massive Sell-Offs Right Now! 📉🔥
The bears have taken total control! With security exploits, whale shorts, and network halts triggering panic selling, here is the technical breakdown:
1️⃣ $KAVA (KAVAUSDT) — The 43% Vertical Crash 🔻
Price & Tech: Plummeted -43.74% to $0.03844. Trading far below EMA(20) ($0.05691) with RSI(14) at an extreme 13.36 (deeply oversold).
Catalyst & Watch: Security concerns and exchange halts sparked panic selling. Watch the $0.0335 support—a break brings more downside, while bounces could trap late shorters!
2️⃣ $INIT (INITUSDT) — Bleed Continues Amid Network Halt ⚠️
Price & Tech: Down -15.89% at $0.09870, rejected by EMA(20) ($0.10494) with RSI(14) at 28.35 and bearish MACD.
Catalyst & Watch: Traders are dumping due to the recent exploit and network halt. If $0.0968 support fails, expect another leg down.
3️⃣ $BULLA (BULLAUSDT) — Whales Are Shorting Heavy 🐋
Price & Tech: Dropped -27.45% to $0.02691 under EMA(20) ($0.03119). RSI(14) is at 39.54, hinting at a temporary relief bounce.
Catalyst & Watch: A massive 6M BULLA whale short is fueling bearish pressure. Watch for a rejection at the $0.0312 resistance zone.
💡 Trader’s Takeaway: When RSI hits 13–28, do not blindly FOMO short at the bottom! Extreme oversold levels often trigger violent short squeezes. Manage your risk with strict Stop-Losses. 🛡️
Are you shorting the trend or catching the bounce? Comment below! 👇💬
#BİNANCEFUTURES #KAVA #INIT #BULLA #TechnicalAnalysis
🚨 MARKET BLOOD BATH: 3 Coins Facing Massive Sell-Offs Right Now! 📉🔥
The bears have taken total control! With security exploits, whale shorts, and network halts triggering panic selling, here is the technical breakdown:
1️⃣ $KAVA (KAVAUSDT) — The 43% Vertical Crash 🔻
Price & Tech: Plummeted -43.74% to $0.03844. Trading far below EMA(20) ($0.05691) with RSI(14) at an extreme 13.36 (deeply oversold).
Catalyst & Watch: Security concerns and exchange halts sparked panic selling. Watch the $0.0335 support—a break brings more downside, while bounces could trap late shorters!
2️⃣ $INIT (INITUSDT) — Bleed Continues Amid Network Halt ⚠️
Price & Tech: Down -15.89% at $0.09870, rejected by EMA(20) ($0.10494) with RSI(14) at 28.35 and bearish MACD.
Catalyst & Watch: Traders are dumping due to the recent exploit and network halt. If $0.0968 support fails, expect another leg down.
3️⃣ $BULLA (BULLAUSDT) — Whales Are Shorting Heavy 🐋
Price & Tech: Dropped -27.45% to $0.02691 under EMA(20) ($0.03119). RSI(14) is at 39.54, hinting at a temporary relief bounce.
Catalyst & Watch: A massive 6M BULLA whale short is fueling bearish pressure. Watch for a rejection at the $0.0312 resistance zone.
💡 Trader’s Takeaway: When RSI hits 13–28, do not blindly FOMO short at the bottom! Extreme oversold levels often trigger violent short squeezes. Manage your risk with strict Stop-Losses. 🛡️
Are you shorting the trend or catching the bounce? Comment below! 👇💬
#BİNANCEFUTURES #KAVA #INIT #BULLA #TechnicalAnalysis
The bears have taken total control! With security exploits, whale shorts, and network halts triggering panic selling, here is the technical breakdown:
1️⃣ $KAVA (KAVAUSDT) — The 43% Vertical Crash 🔻
Price & Tech: Plummeted -43.74% to $0.03844. Trading far below EMA(20) ($0.05691) with RSI(14) at an extreme 13.36 (deeply oversold).
Catalyst & Watch: Security concerns and exchange halts sparked panic selling. Watch the $0.0335 support—a break brings more downside, while bounces could trap late shorters!
2️⃣ $INIT (INITUSDT) — Bleed Continues Amid Network Halt ⚠️
Price & Tech: Down -15.89% at $0.09870, rejected by EMA(20) ($0.10494) with RSI(14) at 28.35 and bearish MACD.
Catalyst & Watch: Traders are dumping due to the recent exploit and network halt. If $0.0968 support fails, expect another leg down.
3️⃣ $BULLA (BULLAUSDT) — Whales Are Shorting Heavy 🐋
Price & Tech: Dropped -27.45% to $0.02691 under EMA(20) ($0.03119). RSI(14) is at 39.54, hinting at a temporary relief bounce.
Catalyst & Watch: A massive 6M BULLA whale short is fueling bearish pressure. Watch for a rejection at the $0.0312 resistance zone.
💡 Trader’s Takeaway: When RSI hits 13–28, do not blindly FOMO short at the bottom! Extreme oversold levels often trigger violent short squeezes. Manage your risk with strict Stop-Losses. 🛡️
Are you shorting the trend or catching the bounce? Comment below! 👇💬
#BİNANCEFUTURES #KAVA #INIT #BULLA #TechnicalAnalysis
CipherX 零号:
1
1
2
1
1k

·
--
Bearish
$AKE
Following extreme intraday volatility between $0.009067 and $0.018115, $AKE has cooled down into a steady accumulation phase, currently trading at $0.012373.
Bullish MA Alignment: Price has reclaimed and is holding above all three key moving averages—MA(7) at $0.012273, MA(25) at $0.012180, and MA(99) at $0.012054—signaling a gradual shift back to short-term bullish momentum.
Key Support: $0.01205 – $0.01218 (MA99 & MA25 confluence zone).
Key Resistance: $0.01300 – $0.01350 (previous breakdown area).
As long as bulls defend the $0.01205 support level, a breakout backed by rising volume could trigger a retest of the $0.01300+ zone.
Not financial advice. Always manage your risk.
$AKE #AKE #USDT #CryptoTrading #TechnicalAnalysis
$AKE
Following extreme intraday volatility between $0.009067 and $0.018115, $AKE has cooled down into a steady accumulation phase, currently trading at $0.012373.
Bullish MA Alignment: Price has reclaimed and is holding above all three key moving averages—MA(7) at $0.012273, MA(25) at $0.012180, and MA(99) at $0.012054—signaling a gradual shift back to short-term bullish momentum.
Key Support: $0.01205 – $0.01218 (MA99 & MA25 confluence zone).
Key Resistance: $0.01300 – $0.01350 (previous breakdown area).
As long as bulls defend the $0.01205 support level, a breakout backed by rising volume could trigger a retest of the $0.01300+ zone.
Not financial advice. Always manage your risk.
$AKE #AKE #USDT #CryptoTrading #TechnicalAnalysis
Following extreme intraday volatility between $0.009067 and $0.018115, $AKE has cooled down into a steady accumulation phase, currently trading at $0.012373.
Bullish MA Alignment: Price has reclaimed and is holding above all three key moving averages—MA(7) at $0.012273, MA(25) at $0.012180, and MA(99) at $0.012054—signaling a gradual shift back to short-term bullish momentum.
Key Support: $0.01205 – $0.01218 (MA99 & MA25 confluence zone).
Key Resistance: $0.01300 – $0.01350 (previous breakdown area).
As long as bulls defend the $0.01205 support level, a breakout backed by rising volume could trigger a retest of the $0.01300+ zone.
Not financial advice. Always manage your risk.
$AKE #AKE #USDT #CryptoTrading #TechnicalAnalysis
2
509


·
--
$SUI
🔴 SUI/USDT: Bears Are Taking Control!
SUI is showing significant weakness on the 4H timeframe.
Price is trading around $0.7457, sitting below EMA 7, EMA 25 and EMA 99. This bearish alignment suggests sellers still have control of the market.
Key levels I'm watching:
🔻 Support: $0.7412 – $0.7355
🔺 Resistance: $0.7666 – $0.7752
The Williams %R is deeply oversold, so a temporary bounce is possible. I would rather wait for a weak retest before considering another short.
My bias remains bearish until buyers reclaim important resistance levels.
Would you buy this dip, or wait for another leg down?
#SUI #CryptoTrading #TechnicalAnalysis
{future}(SUIUSDT)
$SUI
🔴 SUI/USDT: Bears Are Taking Control!
SUI is showing significant weakness on the 4H timeframe.
Price is trading around $0.7457, sitting below EMA 7, EMA 25 and EMA 99. This bearish alignment suggests sellers still have control of the market.
Key levels I'm watching:
🔻 Support: $0.7412 – $0.7355
🔺 Resistance: $0.7666 – $0.7752
The Williams %R is deeply oversold, so a temporary bounce is possible. I would rather wait for a weak retest before considering another short.
My bias remains bearish until buyers reclaim important resistance levels.
Would you buy this dip, or wait for another leg down?
#SUI #CryptoTrading #TechnicalAnalysis
🔴 SUI/USDT: Bears Are Taking Control!
SUI is showing significant weakness on the 4H timeframe.
Price is trading around $0.7457, sitting below EMA 7, EMA 25 and EMA 99. This bearish alignment suggests sellers still have control of the market.
Key levels I'm watching:
🔻 Support: $0.7412 – $0.7355
🔺 Resistance: $0.7666 – $0.7752
The Williams %R is deeply oversold, so a temporary bounce is possible. I would rather wait for a weak retest before considering another short.
My bias remains bearish until buyers reclaim important resistance levels.
Would you buy this dip, or wait for another leg down?
#SUI #CryptoTrading #TechnicalAnalysis
1
382

·
--
🟢 $LTC · 1H
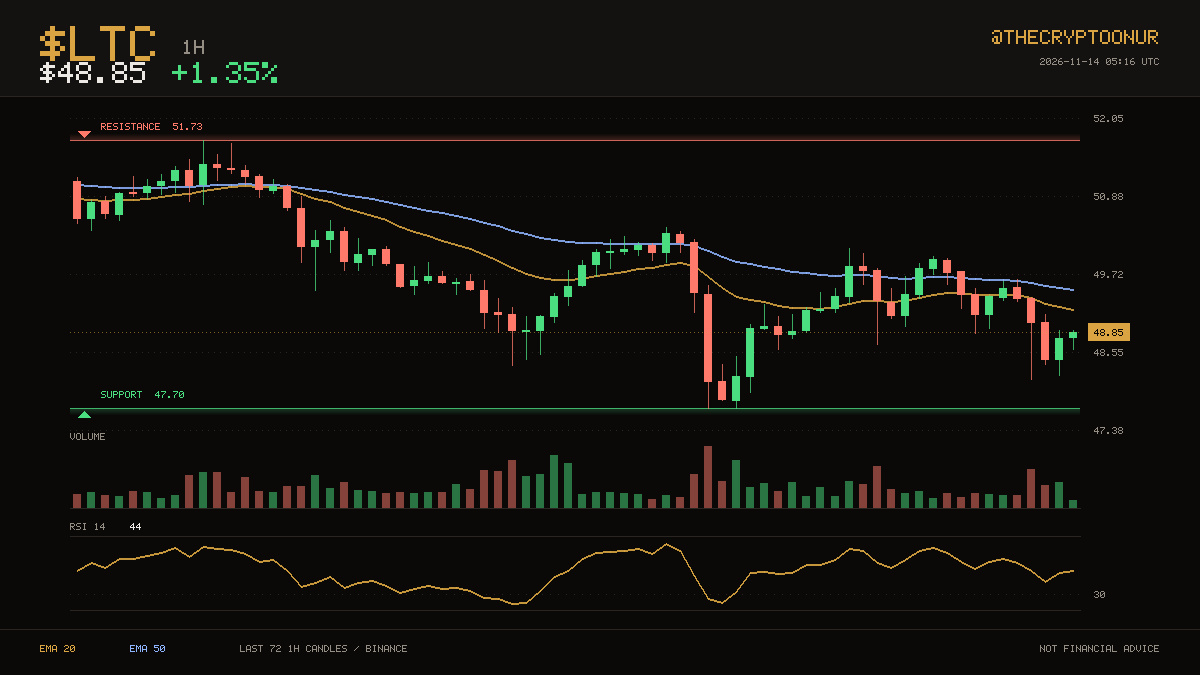
Price is $48.85 and $LTC remains below the averages that capped it earlier. $47.70 on the low side and $51.73 on the high side have contained the last three days. Price is down in the lower third of that range. That is 5.9% to the ceiling and 2.4% to the floor. The 20 has stayed below the 50 for a long stretch now. RSI at 44 is neutral, so momentum is not blocking a move either way. Over the past day it has traded between $47.86 and $50.11, sitting around the middle of it now. Turnover is unremarkable, running 1.0x the recent average. Up 1.3% over 24 hours.
DYOR
$LTC #TechnicalAnalysis
🟢 $LTC · 1H
Price is $48.85 and $LTC remains below the averages that capped it earlier. $47.70 on the low side and $51.73 on the high side have contained the last three days. Price is down in the lower third of that range. That is 5.9% to the ceiling and 2.4% to the floor. The 20 has stayed below the 50 for a long stretch now. RSI at 44 is neutral, so momentum is not blocking a move either way. Over the past day it has traded between $47.86 and $50.11, sitting around the middle of it now. Turnover is unremarkable, running 1.0x the recent average. Up 1.3% over 24 hours.
DYOR
$LTC #TechnicalAnalysis
Price is $48.85 and $LTC remains below the averages that capped it earlier. $47.70 on the low side and $51.73 on the high side have contained the last three days. Price is down in the lower third of that range. That is 5.9% to the ceiling and 2.4% to the floor. The 20 has stayed below the 50 for a long stretch now. RSI at 44 is neutral, so momentum is not blocking a move either way. Over the past day it has traded between $47.86 and $50.11, sitting around the middle of it now. Turnover is unremarkable, running 1.0x the recent average. Up 1.3% over 24 hours.
DYOR
$LTC #TechnicalAnalysis
1
651

·
--
Bearish
⚠️ $ZEC — DON'T TRY TO CATCH THE FALLING KNIFE!
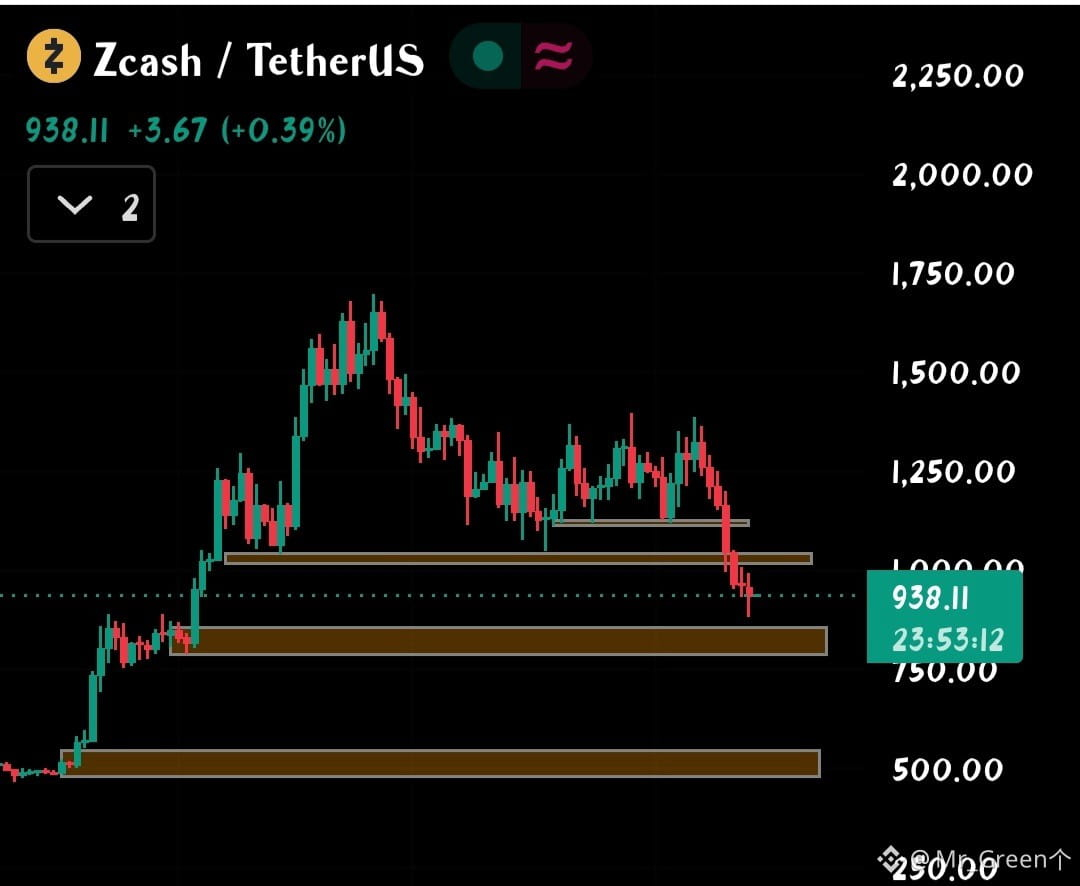
I'm still bearish on Zcash. The chart is showing more than just a normal pullback; the market structure has weakened significantly.
Let's look at the technical picture:
📉 1. Market Structure
ZEC has lost multiple support zones and continues to print lower highs and lower lows. Until we see a clear Market Structure Shift (MSS) and a higher low, I don't see a convincing reason to turn bullish.
📊 2. Momentum Indicators
Daily RSI is around 32.8 — approaching oversold territory.
MACD remains negative, showing bearish momentum.
Price is below the major daily moving averages.
The 4H technical outlook also shows strong bearish pressure.
Oversold conditions can produce a bounce, but they don't automatically signal a trend reversal.
🎯 3. Key Price Zones
$916: Immediate support to watch.
$800–$860: My preferred zone for potential sideways consolidation.
$1,000–$1,050: Important resistance area to reclaim.
Below $800: Further downside risk increases.
My strategy?
I'm not interested in blindly buying ZEC here. I'd rather wait for price to stabilize around $800–$860, build a proper base, and show a bullish structure.
If you really want to trade against the trend, the risk is yours. But don't confuse a temporary bounce with a confirmed reversal.
Patience is a position too. Let ZEC prove that buyers are back before thinking about a long.
#ZEC #Zcash #CryptoAnalysis #TechnicalAnalysis
{future}(ZECUSDT)
⚠️ $ZEC — DON'T TRY TO CATCH THE FALLING KNIFE!
I'm still bearish on Zcash. The chart is showing more than just a normal pullback; the market structure has weakened significantly.
Let's look at the technical picture:
📉 1. Market Structure
ZEC has lost multiple support zones and continues to print lower highs and lower lows. Until we see a clear Market Structure Shift (MSS) and a higher low, I don't see a convincing reason to turn bullish.
📊 2. Momentum Indicators
Daily RSI is around 32.8 — approaching oversold territory.
MACD remains negative, showing bearish momentum.
Price is below the major daily moving averages.
The 4H technical outlook also shows strong bearish pressure.
Oversold conditions can produce a bounce, but they don't automatically signal a trend reversal.
🎯 3. Key Price Zones
$916: Immediate support to watch.
$800–$860: My preferred zone for potential sideways consolidation.
$1,000–$1,050: Important resistance area to reclaim.
Below $800: Further downside risk increases.
My strategy?
I'm not interested in blindly buying ZEC here. I'd rather wait for price to stabilize around $800–$860, build a proper base, and show a bullish structure.
If you really want to trade against the trend, the risk is yours. But don't confuse a temporary bounce with a confirmed reversal.
Patience is a position too. Let ZEC prove that buyers are back before thinking about a long.
#ZEC #Zcash #CryptoAnalysis #TechnicalAnalysis
I'm still bearish on Zcash. The chart is showing more than just a normal pullback; the market structure has weakened significantly.
Let's look at the technical picture:
📉 1. Market Structure
ZEC has lost multiple support zones and continues to print lower highs and lower lows. Until we see a clear Market Structure Shift (MSS) and a higher low, I don't see a convincing reason to turn bullish.
📊 2. Momentum Indicators
Daily RSI is around 32.8 — approaching oversold territory.
MACD remains negative, showing bearish momentum.
Price is below the major daily moving averages.
The 4H technical outlook also shows strong bearish pressure.
Oversold conditions can produce a bounce, but they don't automatically signal a trend reversal.
🎯 3. Key Price Zones
$916: Immediate support to watch.
$800–$860: My preferred zone for potential sideways consolidation.
$1,000–$1,050: Important resistance area to reclaim.
Below $800: Further downside risk increases.
My strategy?
I'm not interested in blindly buying ZEC here. I'd rather wait for price to stabilize around $800–$860, build a proper base, and show a bullish structure.
If you really want to trade against the trend, the risk is yours. But don't confuse a temporary bounce with a confirmed reversal.
Patience is a position too. Let ZEC prove that buyers are back before thinking about a long.
#ZEC #Zcash #CryptoAnalysis #TechnicalAnalysis
743

·
--
BTC/USDT — Deeply Oversold, but the Short-Term Trend Remains Bearish
Binance Spot Price: $67,180.01
24H Change: -1.425%
24H Range: $66,456.00 – $70,214.31
Key Technical Levels
Support: $66,613–$66,456, followed by the psychological $66,000 level.
Resistance: $67,568, $68,446, then the 4H EMA20 at $70,978.
Trend & Momentum: BTC remains firmly below its 4H EMA20, confirming a bearish short-term structure. RSI14 is 18.2, indicating deeply oversold momentum. A relief bounce is possible, but oversold conditions do not independently confirm a reversal.
Bullish Scenario: Holding the $66,456–$66,613 support zone and reclaiming $67,568 could open a recovery toward $68,446. A stronger trend improvement would require a sustained move toward and above the EMA20.
Bearish Scenario: A decisive breakdown below $66,456 would expose the $66,000 psychological level and extend the current downside structure.
Conclusion: BTC is deeply oversold and trading near its 24H low. Support preservation is critical, while $67,568 is the first resistance buyers need to reclaim.
{spot}(BTCUSDT)
{spot}(ETHUSDT)
{spot}(NEARUSDT)
$BTC $NEAR $ETH
#TripsSam #BTC #Bitcoin #CryptoMarket #TechnicalAnalysis
Market analysis only — not financial advice.
BTC/USDT — Deeply Oversold, but the Short-Term Trend Remains Bearish
Binance Spot Price: $67,180.01
24H Change: -1.425%
24H Range: $66,456.00 – $70,214.31
Key Technical Levels
Support: $66,613–$66,456, followed by the psychological $66,000 level.
Resistance: $67,568, $68,446, then the 4H EMA20 at $70,978.
Trend & Momentum: BTC remains firmly below its 4H EMA20, confirming a bearish short-term structure. RSI14 is 18.2, indicating deeply oversold momentum. A relief bounce is possible, but oversold conditions do not independently confirm a reversal.
Bullish Scenario: Holding the $66,456–$66,613 support zone and reclaiming $67,568 could open a recovery toward $68,446. A stronger trend improvement would require a sustained move toward and above the EMA20.
Bearish Scenario: A decisive breakdown below $66,456 would expose the $66,000 psychological level and extend the current downside structure.
Conclusion: BTC is deeply oversold and trading near its 24H low. Support preservation is critical, while $67,568 is the first resistance buyers need to reclaim.
$BTC $NEAR $ETH
#TripsSam #BTC #Bitcoin #CryptoMarket #TechnicalAnalysis
Market analysis only — not financial advice.
Binance Spot Price: $67,180.01
24H Change: -1.425%
24H Range: $66,456.00 – $70,214.31
Key Technical Levels
Support: $66,613–$66,456, followed by the psychological $66,000 level.
Resistance: $67,568, $68,446, then the 4H EMA20 at $70,978.
Trend & Momentum: BTC remains firmly below its 4H EMA20, confirming a bearish short-term structure. RSI14 is 18.2, indicating deeply oversold momentum. A relief bounce is possible, but oversold conditions do not independently confirm a reversal.
Bullish Scenario: Holding the $66,456–$66,613 support zone and reclaiming $67,568 could open a recovery toward $68,446. A stronger trend improvement would require a sustained move toward and above the EMA20.
Bearish Scenario: A decisive breakdown below $66,456 would expose the $66,000 psychological level and extend the current downside structure.
Conclusion: BTC is deeply oversold and trading near its 24H low. Support preservation is critical, while $67,568 is the first resistance buyers need to reclaim.
$BTC $NEAR $ETH
#TripsSam #BTC #Bitcoin #CryptoMarket #TechnicalAnalysis
Market analysis only — not financial advice.
2
377

·
--
🔥 $SUI
{future}(SUIUSDT)
– Short Setup (Nov 14)
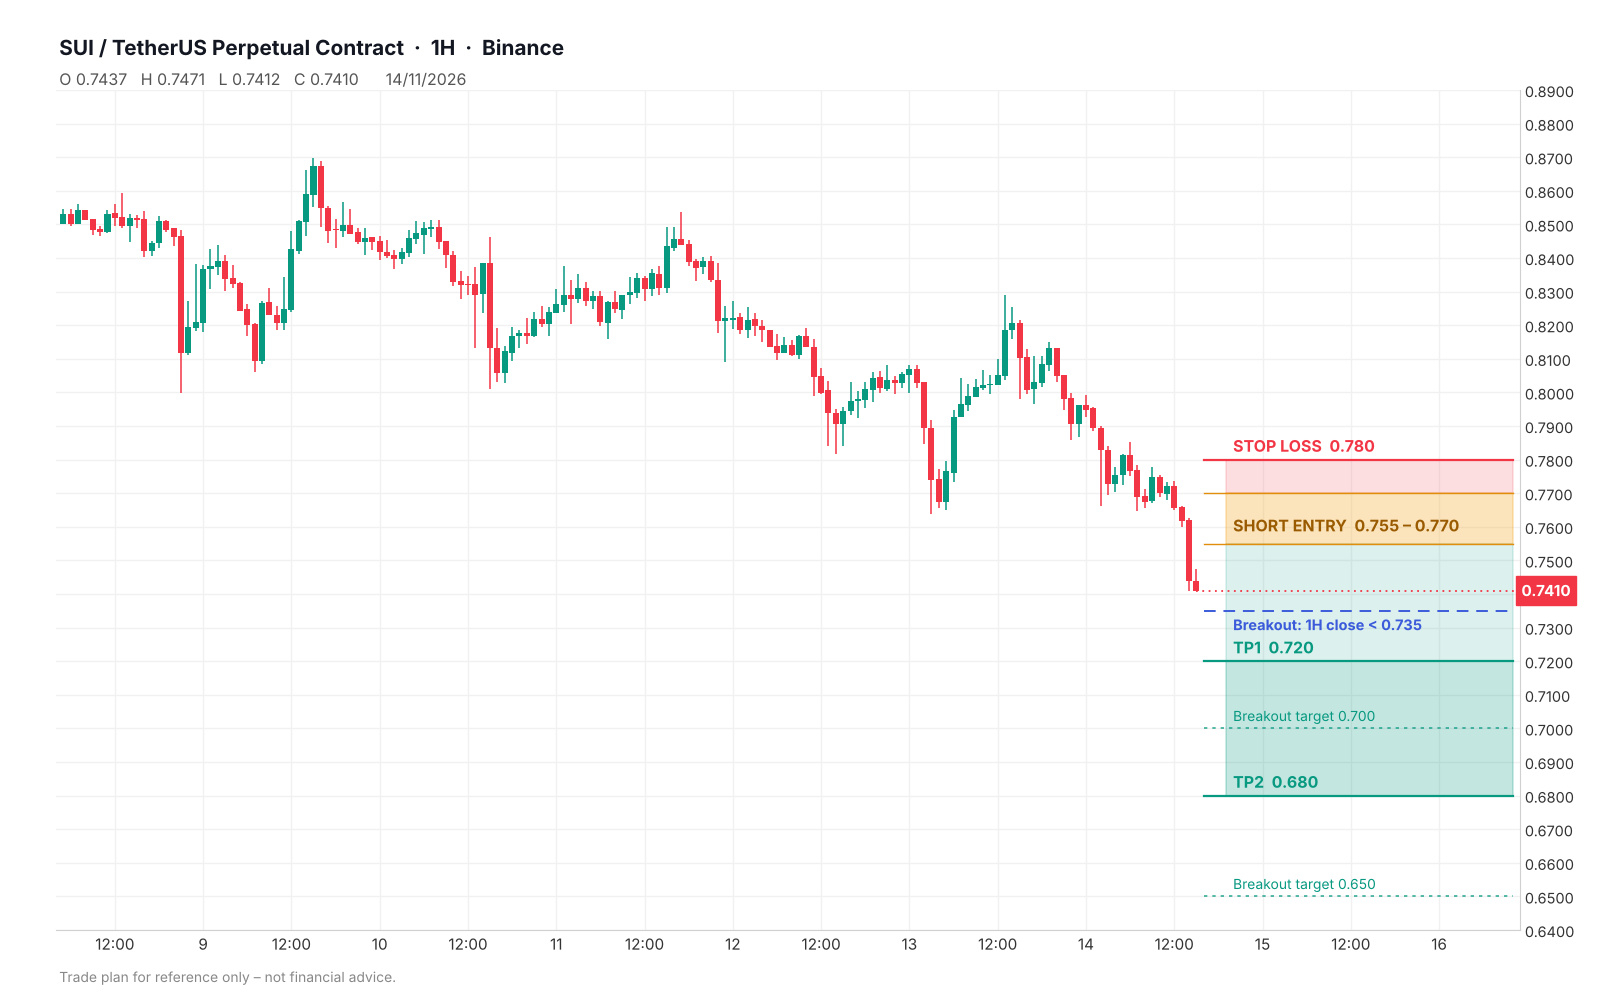
SUI is bearish on every timeframe (1W–5m): lower highs, repeated BOS down, price sliding into Discount near 0.74. Cheap isn't a buy signal in a downtrend, so don't catch the falling knife.
📉 Entry: short on a pullback to 0.755–0.770 after a rejection candle
🛑 Stop loss: 0.780
🎯 TP1: 0.720
🎯 TP2: 0.680
Breakout play: a 1H close below 0.735 opens 0.70 → 0.65. Longs only after a bullish CHoCH on 15m/1H.
Context: Suiet wallet is ending support, DeFi TVL is down ~22% in a month, Fear & Greed at 18. Weekend liquidity is thin, so keep risk at 1–2% per trade.
⚠️ Not financial advice. DYOR.
#SUI #Crypto #Trading #TechnicalAnalysis
🔥 $SUI
– Short Setup (Nov 14)
SUI is bearish on every timeframe (1W–5m): lower highs, repeated BOS down, price sliding into Discount near 0.74. Cheap isn't a buy signal in a downtrend, so don't catch the falling knife.
📉 Entry: short on a pullback to 0.755–0.770 after a rejection candle
🛑 Stop loss: 0.780
🎯 TP1: 0.720
🎯 TP2: 0.680
Breakout play: a 1H close below 0.735 opens 0.70 → 0.65. Longs only after a bullish CHoCH on 15m/1H.
Context: Suiet wallet is ending support, DeFi TVL is down ~22% in a month, Fear & Greed at 18. Weekend liquidity is thin, so keep risk at 1–2% per trade.
⚠️ Not financial advice. DYOR.
#SUI #Crypto #Trading #TechnicalAnalysis
– Short Setup (Nov 14)
SUI is bearish on every timeframe (1W–5m): lower highs, repeated BOS down, price sliding into Discount near 0.74. Cheap isn't a buy signal in a downtrend, so don't catch the falling knife.
📉 Entry: short on a pullback to 0.755–0.770 after a rejection candle
🛑 Stop loss: 0.780
🎯 TP1: 0.720
🎯 TP2: 0.680
Breakout play: a 1H close below 0.735 opens 0.70 → 0.65. Longs only after a bullish CHoCH on 15m/1H.
Context: Suiet wallet is ending support, DeFi TVL is down ~22% in a month, Fear & Greed at 18. Weekend liquidity is thin, so keep risk at 1–2% per trade.
⚠️ Not financial advice. DYOR.
#SUI #Crypto #Trading #TechnicalAnalysis
108

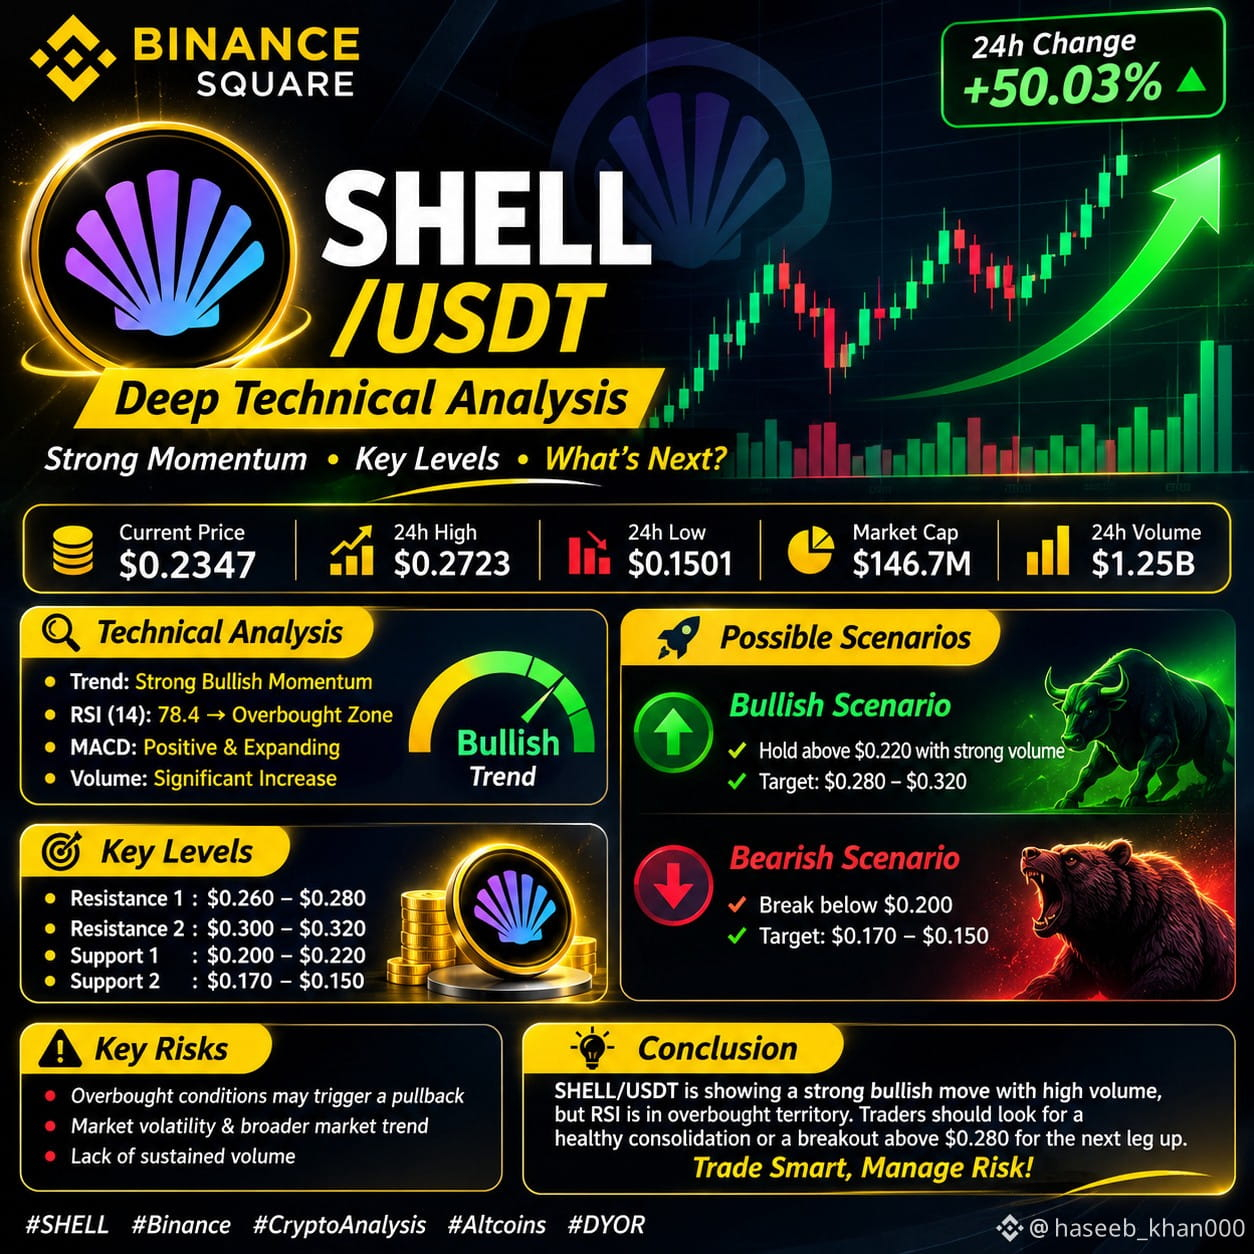
$SHELL
SHELL/USDT: Explosive Momentum or a Potential Reversal? 🔍
MyShell ($SHELL) | Deep Technical Market Analysis
SHELL has attracted significant market attention following an aggressive upward move accompanied by a substantial increase in trading activity. However, after such a sharp rally, the key question is whether buyers can sustain momentum or whether profit-taking will trigger a deeper correction.
📊 1. Market Structure
Recent Binance market data shows:
- Strong short-term price expansion.
- Significant increase in spot and futures trading activity.
- Elevated open interest, indicating growing derivatives participation.
- Sharp intraday fluctuations, reflecting increased volatility.
The recent rally is notable, but volume expansion alone does not confirm a sustainable uptrend.
📈 2. Key Technical Levels
Based on recent observed trading ranges:
- Immediate Support: $0.0285–$0.0300
- Resistance 1: $0.0367
- Major Resistance: $0.0516
- Major Historical Swing Low: $0.0186
These are reference zones from recent market activity, not guaranteed turning points.
🐂 3. Bullish Scenario
If SHELL maintains its near-term support zone and buying volume continues to strengthen, a recovery toward $0.0367 could become possible.
A sustained breakout above this resistance, supported by strong spot volume and a successful retest, would strengthen the bullish structure.
🐻 4. Bearish Scenario
If buyers fail to defend the $0.0285–$0.0300 area, downside pressure could increase.
A breakdown accompanied by expanding selling volume would weaken the short-term structure and could expose lower support areas.
⚠️ 5. Important Risks
- Rapid price appreciation increases correction risk.
- Elevated open interest can amplify volatility.
- Profit-taking may reverse short-term momentum.
- Token supply emissions and broader market sentiment deserve attention.
What is your view on $SHELL?
#shellusdt #MyShell #BinanceSquare #TechnicalAnalysis
{future}(SHELLUSDT)
$SHELL
SHELL/USDT: Explosive Momentum or a Potential Reversal? 🔍
MyShell ($SHELL ) | Deep Technical Market Analysis
SHELL has attracted significant market attention following an aggressive upward move accompanied by a substantial increase in trading activity. However, after such a sharp rally, the key question is whether buyers can sustain momentum or whether profit-taking will trigger a deeper correction.
📊 1. Market Structure
Recent Binance market data shows:
- Strong short-term price expansion.
- Significant increase in spot and futures trading activity.
- Elevated open interest, indicating growing derivatives participation.
- Sharp intraday fluctuations, reflecting increased volatility.
The recent rally is notable, but volume expansion alone does not confirm a sustainable uptrend.
📈 2. Key Technical Levels
Based on recent observed trading ranges:
- Immediate Support: $0.0285–$0.0300
- Resistance 1: $0.0367
- Major Resistance: $0.0516
- Major Historical Swing Low: $0.0186
These are reference zones from recent market activity, not guaranteed turning points.
🐂 3. Bullish Scenario
If SHELL maintains its near-term support zone and buying volume continues to strengthen, a recovery toward $0.0367 could become possible.
A sustained breakout above this resistance, supported by strong spot volume and a successful retest, would strengthen the bullish structure.
🐻 4. Bearish Scenario
If buyers fail to defend the $0.0285–$0.0300 area, downside pressure could increase.
A breakdown accompanied by expanding selling volume would weaken the short-term structure and could expose lower support areas.
⚠️ 5. Important Risks
- Rapid price appreciation increases correction risk.
- Elevated open interest can amplify volatility.
- Profit-taking may reverse short-term momentum.
- Token supply emissions and broader market sentiment deserve attention.
What is your view on $SHELL ?
#shellusdt #MyShell #BinanceSquare #TechnicalAnalysis
SHELL/USDT: Explosive Momentum or a Potential Reversal? 🔍
MyShell ($SHELL ) | Deep Technical Market Analysis
SHELL has attracted significant market attention following an aggressive upward move accompanied by a substantial increase in trading activity. However, after such a sharp rally, the key question is whether buyers can sustain momentum or whether profit-taking will trigger a deeper correction.
📊 1. Market Structure
Recent Binance market data shows:
- Strong short-term price expansion.
- Significant increase in spot and futures trading activity.
- Elevated open interest, indicating growing derivatives participation.
- Sharp intraday fluctuations, reflecting increased volatility.
The recent rally is notable, but volume expansion alone does not confirm a sustainable uptrend.
📈 2. Key Technical Levels
Based on recent observed trading ranges:
- Immediate Support: $0.0285–$0.0300
- Resistance 1: $0.0367
- Major Resistance: $0.0516
- Major Historical Swing Low: $0.0186
These are reference zones from recent market activity, not guaranteed turning points.
🐂 3. Bullish Scenario
If SHELL maintains its near-term support zone and buying volume continues to strengthen, a recovery toward $0.0367 could become possible.
A sustained breakout above this resistance, supported by strong spot volume and a successful retest, would strengthen the bullish structure.
🐻 4. Bearish Scenario
If buyers fail to defend the $0.0285–$0.0300 area, downside pressure could increase.
A breakdown accompanied by expanding selling volume would weaken the short-term structure and could expose lower support areas.
⚠️ 5. Important Risks
- Rapid price appreciation increases correction risk.
- Elevated open interest can amplify volatility.
- Profit-taking may reverse short-term momentum.
- Token supply emissions and broader market sentiment deserve attention.
What is your view on $SHELL ?
#shellusdt #MyShell #BinanceSquare #TechnicalAnalysis
169

🚨 $XRP / USDT: Psychological $1.00 Breakdown Test & Deep Oversold RSI!
XRP is currently trading under intense near-term pressure around the $0.985 - $1.01 demand zone, dipping just below the critical $1.00 psychological threshold. With the 14-day RSI plunged deep into oversold territory (around 21–24) and MACD remaining negative, price action is sitting at a major high-timeframe inflection point. Here is the technical breakdown:
📊 Key Technical Levels to Watch:
Major Support Zone: $0.92 - $0.98 (Immediate structural demand base below the $1.00 psychological handle. Bulls must quickly reclaim $1.00 and defend this floor to prevent deeper structural capitulation.)
Immediate Resistance & SuperTrend: $1.21 - $1.22 (First key technical hurdle marked by the SuperTrend indicator, which bulls must reclaim to ease immediate downside pressure.)
Macro EMA Resistance Cluster: $1.26 - $1.35 (Dense overhead supply zone formed by the 50-day EMA at $1.26–$1.28, the 100-day EMA at $1.29–$1.30, and the 200-day EMA at $1.34–$1.35.)
🔍 Market Dynamics & Strategy:
Order Flow & Sentiment: Selling pressure remains dominant across short- and medium-term timeframes, keeping price suppressed beneath all major daily and weekly exponential moving averages. However, extreme oversold oscillator readings indicate that short-term bearish momentum is heavily stretched, raising the probability of a technical relief bounce if buyers step in.
Execution Plan: Avoid catching falling knives in unconfirmed territory. Wait for a decisive high-timeframe reclaim and hold above the $1.00 psychological level or a volume-backed breakout toward the $1.21 SuperTrend pivot. Strict risk management is mandatory!
#XRP #Ripple #cryptotrading #TechnicalAnalysis #coinstrategist_
🚨 $XRP / USDT: Psychological $1.00 Breakdown Test & Deep Oversold RSI!
XRP is currently trading under intense near-term pressure around the $0.985 - $1.01 demand zone, dipping just below the critical $1.00 psychological threshold. With the 14-day RSI plunged deep into oversold territory (around 21–24) and MACD remaining negative, price action is sitting at a major high-timeframe inflection point. Here is the technical breakdown:
📊 Key Technical Levels to Watch:
Major Support Zone: $0.92 - $0.98 (Immediate structural demand base below the $1.00 psychological handle. Bulls must quickly reclaim $1.00 and defend this floor to prevent deeper structural capitulation.)
Immediate Resistance & SuperTrend: $1.21 - $1.22 (First key technical hurdle marked by the SuperTrend indicator, which bulls must reclaim to ease immediate downside pressure.)
Macro EMA Resistance Cluster: $1.26 - $1.35 (Dense overhead supply zone formed by the 50-day EMA at $1.26–$1.28, the 100-day EMA at $1.29–$1.30, and the 200-day EMA at $1.34–$1.35.)
🔍 Market Dynamics & Strategy:
Order Flow & Sentiment: Selling pressure remains dominant across short- and medium-term timeframes, keeping price suppressed beneath all major daily and weekly exponential moving averages. However, extreme oversold oscillator readings indicate that short-term bearish momentum is heavily stretched, raising the probability of a technical relief bounce if buyers step in.
Execution Plan: Avoid catching falling knives in unconfirmed territory. Wait for a decisive high-timeframe reclaim and hold above the $1.00 psychological level or a volume-backed breakout toward the $1.21 SuperTrend pivot. Strict risk management is mandatory!
#XRP #Ripple #cryptotrading #TechnicalAnalysis #coinstrategist_
XRP is currently trading under intense near-term pressure around the $0.985 - $1.01 demand zone, dipping just below the critical $1.00 psychological threshold. With the 14-day RSI plunged deep into oversold territory (around 21–24) and MACD remaining negative, price action is sitting at a major high-timeframe inflection point. Here is the technical breakdown:
📊 Key Technical Levels to Watch:
Major Support Zone: $0.92 - $0.98 (Immediate structural demand base below the $1.00 psychological handle. Bulls must quickly reclaim $1.00 and defend this floor to prevent deeper structural capitulation.)
Immediate Resistance & SuperTrend: $1.21 - $1.22 (First key technical hurdle marked by the SuperTrend indicator, which bulls must reclaim to ease immediate downside pressure.)
Macro EMA Resistance Cluster: $1.26 - $1.35 (Dense overhead supply zone formed by the 50-day EMA at $1.26–$1.28, the 100-day EMA at $1.29–$1.30, and the 200-day EMA at $1.34–$1.35.)
🔍 Market Dynamics & Strategy:
Order Flow & Sentiment: Selling pressure remains dominant across short- and medium-term timeframes, keeping price suppressed beneath all major daily and weekly exponential moving averages. However, extreme oversold oscillator readings indicate that short-term bearish momentum is heavily stretched, raising the probability of a technical relief bounce if buyers step in.
Execution Plan: Avoid catching falling knives in unconfirmed territory. Wait for a decisive high-timeframe reclaim and hold above the $1.00 psychological level or a volume-backed breakout toward the $1.21 SuperTrend pivot. Strict risk management is mandatory!
#XRP #Ripple #cryptotrading #TechnicalAnalysis #coinstrategist_
121

·
--
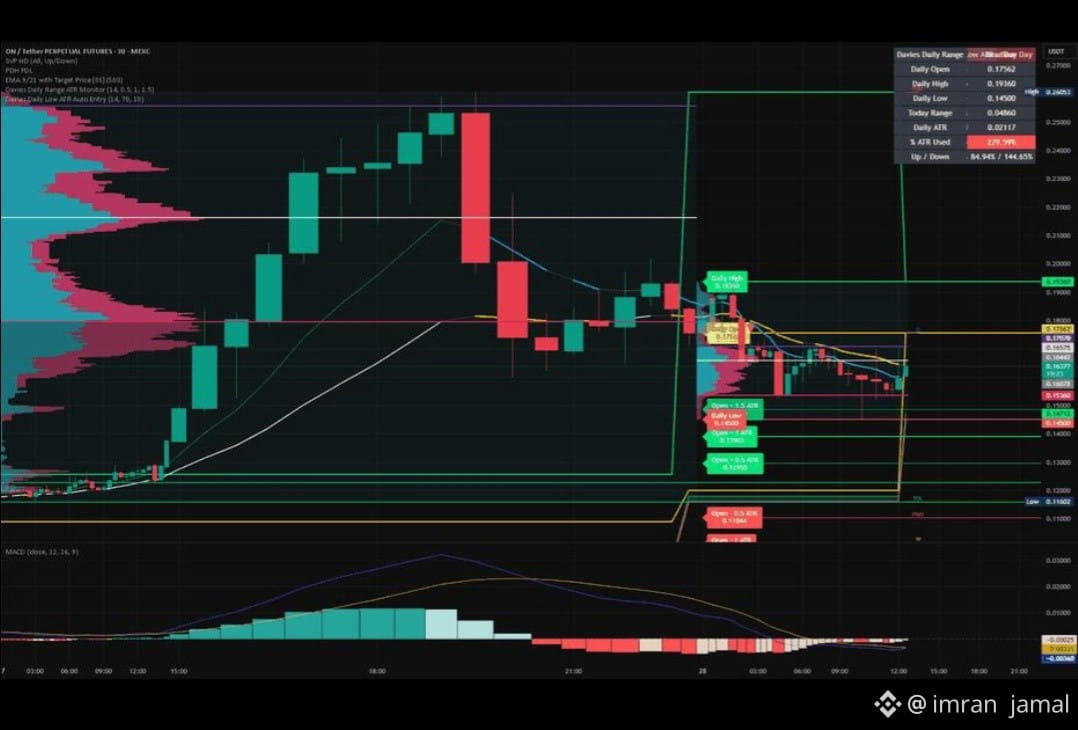
$UVXY
🚀 UVXYUSDT Market Update | November 14, 2026
📈 Current Price: $18.73 🔥 24H Change: +9.09%
UVXY is showing a strong recovery with increased buying activity. Bulls are attempting to maintain momentum, but volatility remains extremely high.
Key Levels
Support: $18.10
Resistance: $19.73
Next Resistance: $21.03
Bullish Scenario: A confirmed breakout above $19.73 could open the way toward $21.03.
Bearish Scenario: Losing $18.10 may increase downside pressure.
🎯 Strategy: Wait for breakout confirmation. Avoid excessive leverage and use strict risk management.
#UVXYUSDT #CryptoTrading. #MarketUpdate #Binance #TechnicalAnalysis
{future}(UVXYUSDT)
$UVXY
🚀 UVXYUSDT Market Update | November 14, 2026
📈 Current Price: $18.73 🔥 24H Change: +9.09%
UVXY is showing a strong recovery with increased buying activity. Bulls are attempting to maintain momentum, but volatility remains extremely high.
Key Levels
Support: $18.10
Resistance: $19.73
Next Resistance: $21.03
Bullish Scenario: A confirmed breakout above $19.73 could open the way toward $21.03.
Bearish Scenario: Losing $18.10 may increase downside pressure.
🎯 Strategy: Wait for breakout confirmation. Avoid excessive leverage and use strict risk management.
#UVXYUSDT #CryptoTrading. #MarketUpdate #Binance #TechnicalAnalysis
🚀 UVXYUSDT Market Update | November 14, 2026
📈 Current Price: $18.73 🔥 24H Change: +9.09%
UVXY is showing a strong recovery with increased buying activity. Bulls are attempting to maintain momentum, but volatility remains extremely high.
Key Levels
Support: $18.10
Resistance: $19.73
Next Resistance: $21.03
Bullish Scenario: A confirmed breakout above $19.73 could open the way toward $21.03.
Bearish Scenario: Losing $18.10 may increase downside pressure.
🎯 Strategy: Wait for breakout confirmation. Avoid excessive leverage and use strict risk management.
#UVXYUSDT #CryptoTrading. #MarketUpdate #Binance #TechnicalAnalysis
63
·
--
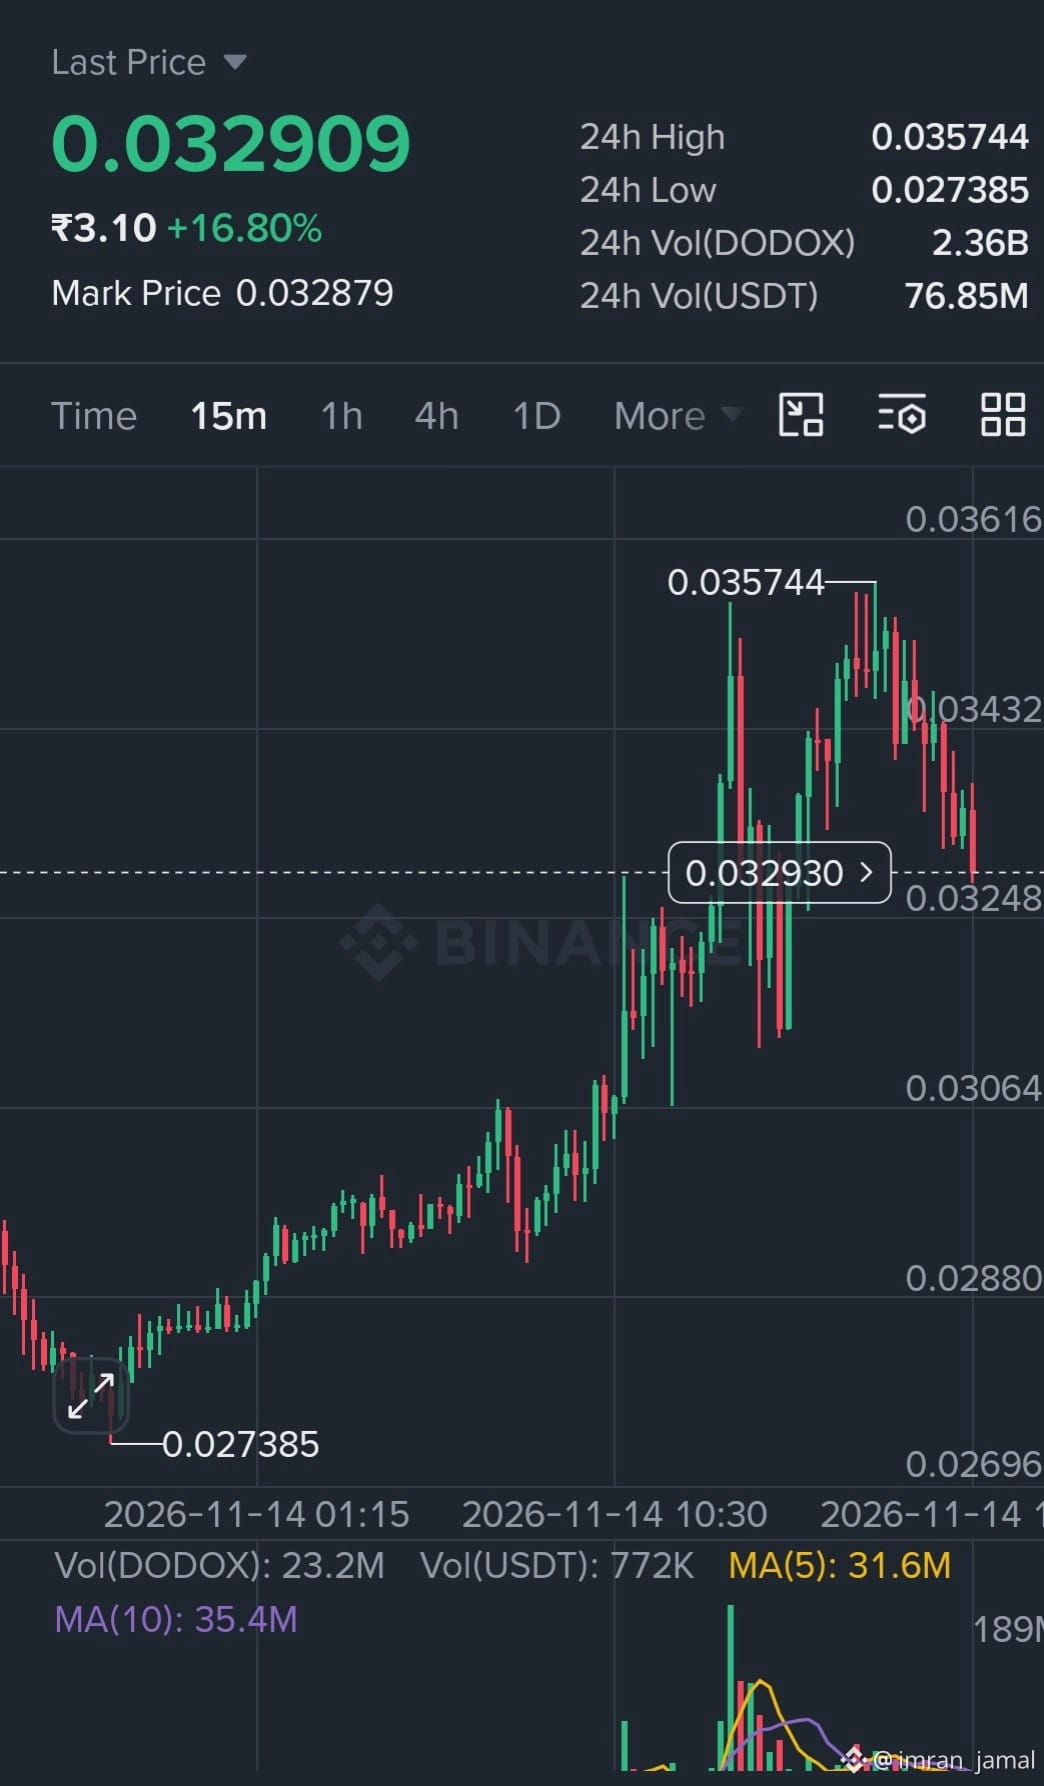
$DODOX
🚀 DODOXUSDT Market Update | November 14, 2026
📊 DODOX is showing strong volatility with significant trading activity. Recent price action indicates a sharp move followed by selling pressure.
📈 Bullish: A breakout above $0.0360 could open the way toward $0.0400.
📉 Bearish: Losing the $0.0320 support zone could trigger further downside.
🎯 Strategy: Wait for volume confirmation before entering. Use proper stop-loss and risk management.
#DODOXUSDT #BİNANCE #CryptoUpdate #TechnicalAnalysis
{future}(DODOXUSDT)
$DODOX
🚀 DODOXUSDT Market Update | November 14, 2026
📊 DODOX is showing strong volatility with significant trading activity. Recent price action indicates a sharp move followed by selling pressure.
📈 Bullish: A breakout above $0.0360 could open the way toward $0.0400.
📉 Bearish: Losing the $0.0320 support zone could trigger further downside.
🎯 Strategy: Wait for volume confirmation before entering. Use proper stop-loss and risk management.
#DODOXUSDT #BİNANCE #CryptoUpdate #TechnicalAnalysis
🚀 DODOXUSDT Market Update | November 14, 2026
📊 DODOX is showing strong volatility with significant trading activity. Recent price action indicates a sharp move followed by selling pressure.
📈 Bullish: A breakout above $0.0360 could open the way toward $0.0400.
📉 Bearish: Losing the $0.0320 support zone could trigger further downside.
🎯 Strategy: Wait for volume confirmation before entering. Use proper stop-loss and risk management.
#DODOXUSDT #BİNANCE #CryptoUpdate #TechnicalAnalysis
182

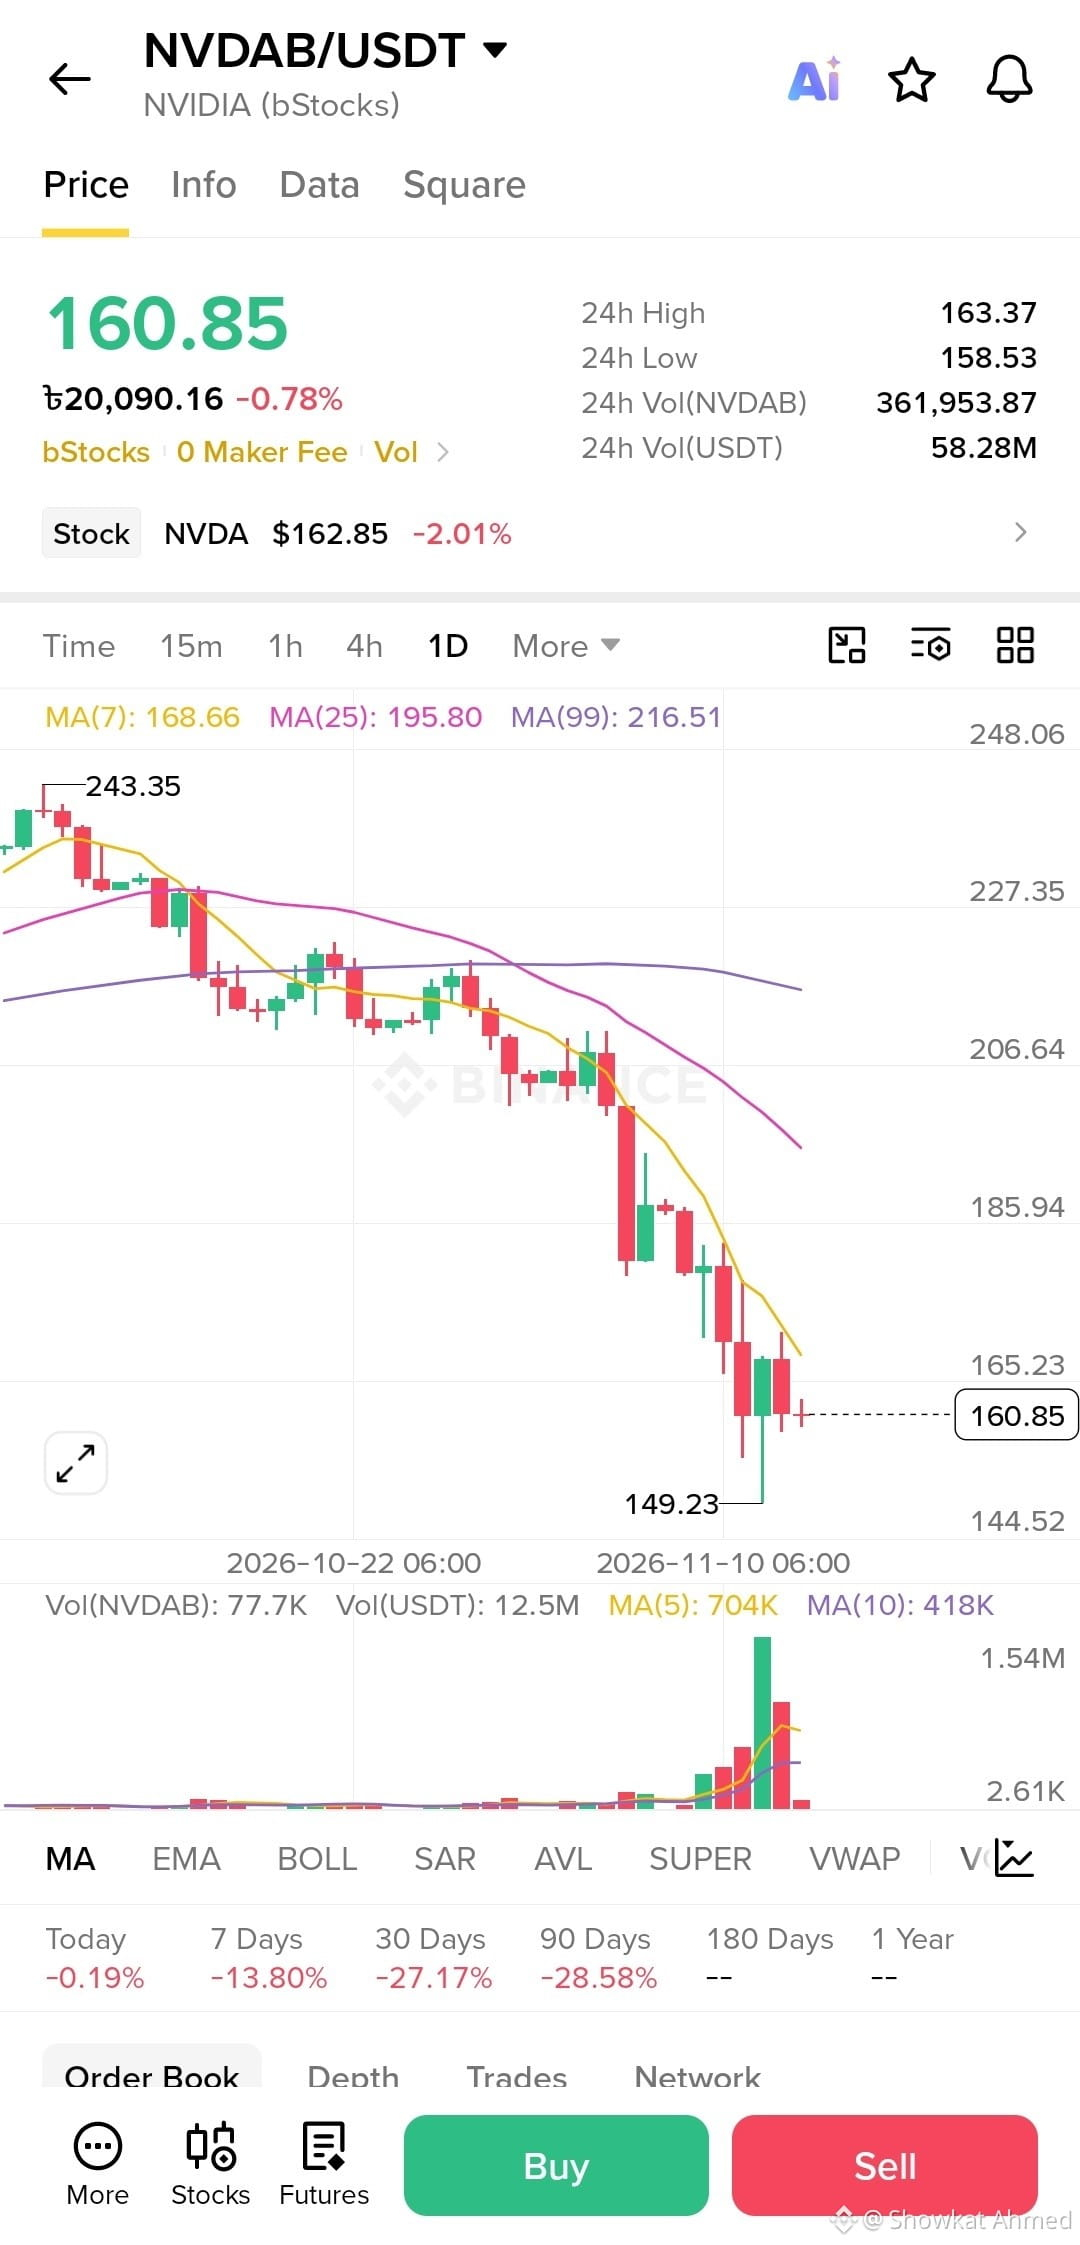
📉 NVIDIA (NVDA) – Is the Downtrend Getting Stronger?
NVIDIA is currently facing significant selling pressure. Let's take a look at the daily chart.
📊 Current Market Overview:
- Current Price: $160.85
- 24H Change: -0.78%
- 7D Performance: -13.80%
- 30D Performance: -27.17%
- 90D Performance: -28.58%
- Recent Low: $149.23
📉 Technical Analysis:
NVDA is trading below all three major moving averages:
- MA(7): $168.66
- MA(25): $195.80
- MA(99): $216.51
This indicates that the overall trend remains bearish.
Key Levels to Watch:
- Support: $149.23
- Resistance: $165.23
- Next Resistance: $185.94
A strong recovery above the short-term moving average could be an early sign of momentum improvement. However, buyers still need to show strength before any trend reversal can be confirmed.
💭 What's Next for NVIDIA?
Will NVDA recover from this correction, or could we see further downside?
Share your thoughts in the comments!
⚠️ This post is for educational purposes only, not financial advice.
# #Crypto #BinanceSquare #Stockmarket #TechnicalAnalysis #trading #MarketAnalysis $NVDAB
📉 NVIDIA (NVDA) – Is the Downtrend Getting Stronger?
NVIDIA is currently facing significant selling pressure. Let's take a look at the daily chart.
📊 Current Market Overview:
- Current Price: $160.85
- 24H Change: -0.78%
- 7D Performance: -13.80%
- 30D Performance: -27.17%
- 90D Performance: -28.58%
- Recent Low: $149.23
📉 Technical Analysis:
NVDA is trading below all three major moving averages:
- MA(7): $168.66
- MA(25): $195.80
- MA(99): $216.51
This indicates that the overall trend remains bearish.
Key Levels to Watch:
- Support: $149.23
- Resistance: $165.23
- Next Resistance: $185.94
A strong recovery above the short-term moving average could be an early sign of momentum improvement. However, buyers still need to show strength before any trend reversal can be confirmed.
💭 What's Next for NVIDIA?
Will NVDA recover from this correction, or could we see further downside?
Share your thoughts in the comments!
⚠️ This post is for educational purposes only, not financial advice.
# #Crypto #BinanceSquare #Stockmarket #TechnicalAnalysis #trading #MarketAnalysis $NVDAB
NVIDIA is currently facing significant selling pressure. Let's take a look at the daily chart.
📊 Current Market Overview:
- Current Price: $160.85
- 24H Change: -0.78%
- 7D Performance: -13.80%
- 30D Performance: -27.17%
- 90D Performance: -28.58%
- Recent Low: $149.23
📉 Technical Analysis:
NVDA is trading below all three major moving averages:
- MA(7): $168.66
- MA(25): $195.80
- MA(99): $216.51
This indicates that the overall trend remains bearish.
Key Levels to Watch:
- Support: $149.23
- Resistance: $165.23
- Next Resistance: $185.94
A strong recovery above the short-term moving average could be an early sign of momentum improvement. However, buyers still need to show strength before any trend reversal can be confirmed.
💭 What's Next for NVIDIA?
Will NVDA recover from this correction, or could we see further downside?
Share your thoughts in the comments!
⚠️ This post is for educational purposes only, not financial advice.
# #Crypto #BinanceSquare #Stockmarket #TechnicalAnalysis #trading #MarketAnalysis $NVDAB
145

·
--
$ADA SHORT TRADE SIGNAL 📉
TRADE SETUP:
🔴 Direction: SHORT
📍 Entry Zone: 0.1555 – 0.1562
🎯 TP1: 0.1545
🎯 TP2: 0.1535
🎯 TP3: 0.1525
🛑 Stop Loss: 0.1578
MARKET OUTLOOK:
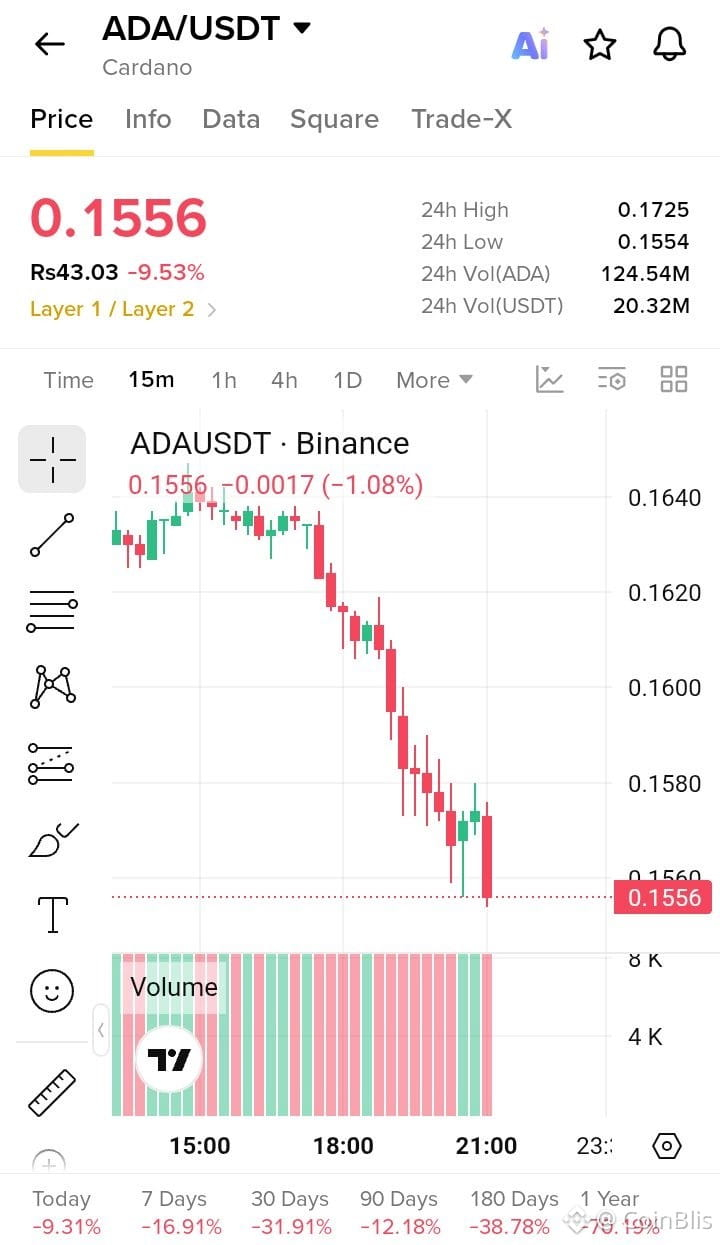
ADA is showing persistent bearish pressure on the 15-minute chart, with consecutive lower highs and lower lows. Sellers remain in control, while recent minor rebounds have failed to reclaim higher resistance. Price is testing the 0.1555 support area, and a confirmed breakdown could accelerate the move toward lower targets. A recovery above 0.1578 would invalidate this short setup.
$AAPLB $MSFTB
#ADA #Cardano #cryptotrading #ShortSignal #TechnicalAnalysis
$ADA SHORT TRADE SIGNAL 📉
TRADE SETUP:
🔴 Direction: SHORT
📍 Entry Zone: 0.1555 – 0.1562
🎯 TP1: 0.1545
🎯 TP2: 0.1535
🎯 TP3: 0.1525
🛑 Stop Loss: 0.1578
MARKET OUTLOOK:
ADA is showing persistent bearish pressure on the 15-minute chart, with consecutive lower highs and lower lows. Sellers remain in control, while recent minor rebounds have failed to reclaim higher resistance. Price is testing the 0.1555 support area, and a confirmed breakdown could accelerate the move toward lower targets. A recovery above 0.1578 would invalidate this short setup.
$AAPLB $MSFTB
#ADA #Cardano #cryptotrading #ShortSignal #TechnicalAnalysis
TRADE SETUP:
🔴 Direction: SHORT
📍 Entry Zone: 0.1555 – 0.1562
🎯 TP1: 0.1545
🎯 TP2: 0.1535
🎯 TP3: 0.1525
🛑 Stop Loss: 0.1578
MARKET OUTLOOK:
ADA is showing persistent bearish pressure on the 15-minute chart, with consecutive lower highs and lower lows. Sellers remain in control, while recent minor rebounds have failed to reclaim higher resistance. Price is testing the 0.1555 support area, and a confirmed breakdown could accelerate the move toward lower targets. A recovery above 0.1578 would invalidate this short setup.
$AAPLB $MSFTB
#ADA #Cardano #cryptotrading #ShortSignal #TechnicalAnalysis
121

$BTC
{spot}(BTCUSDT)
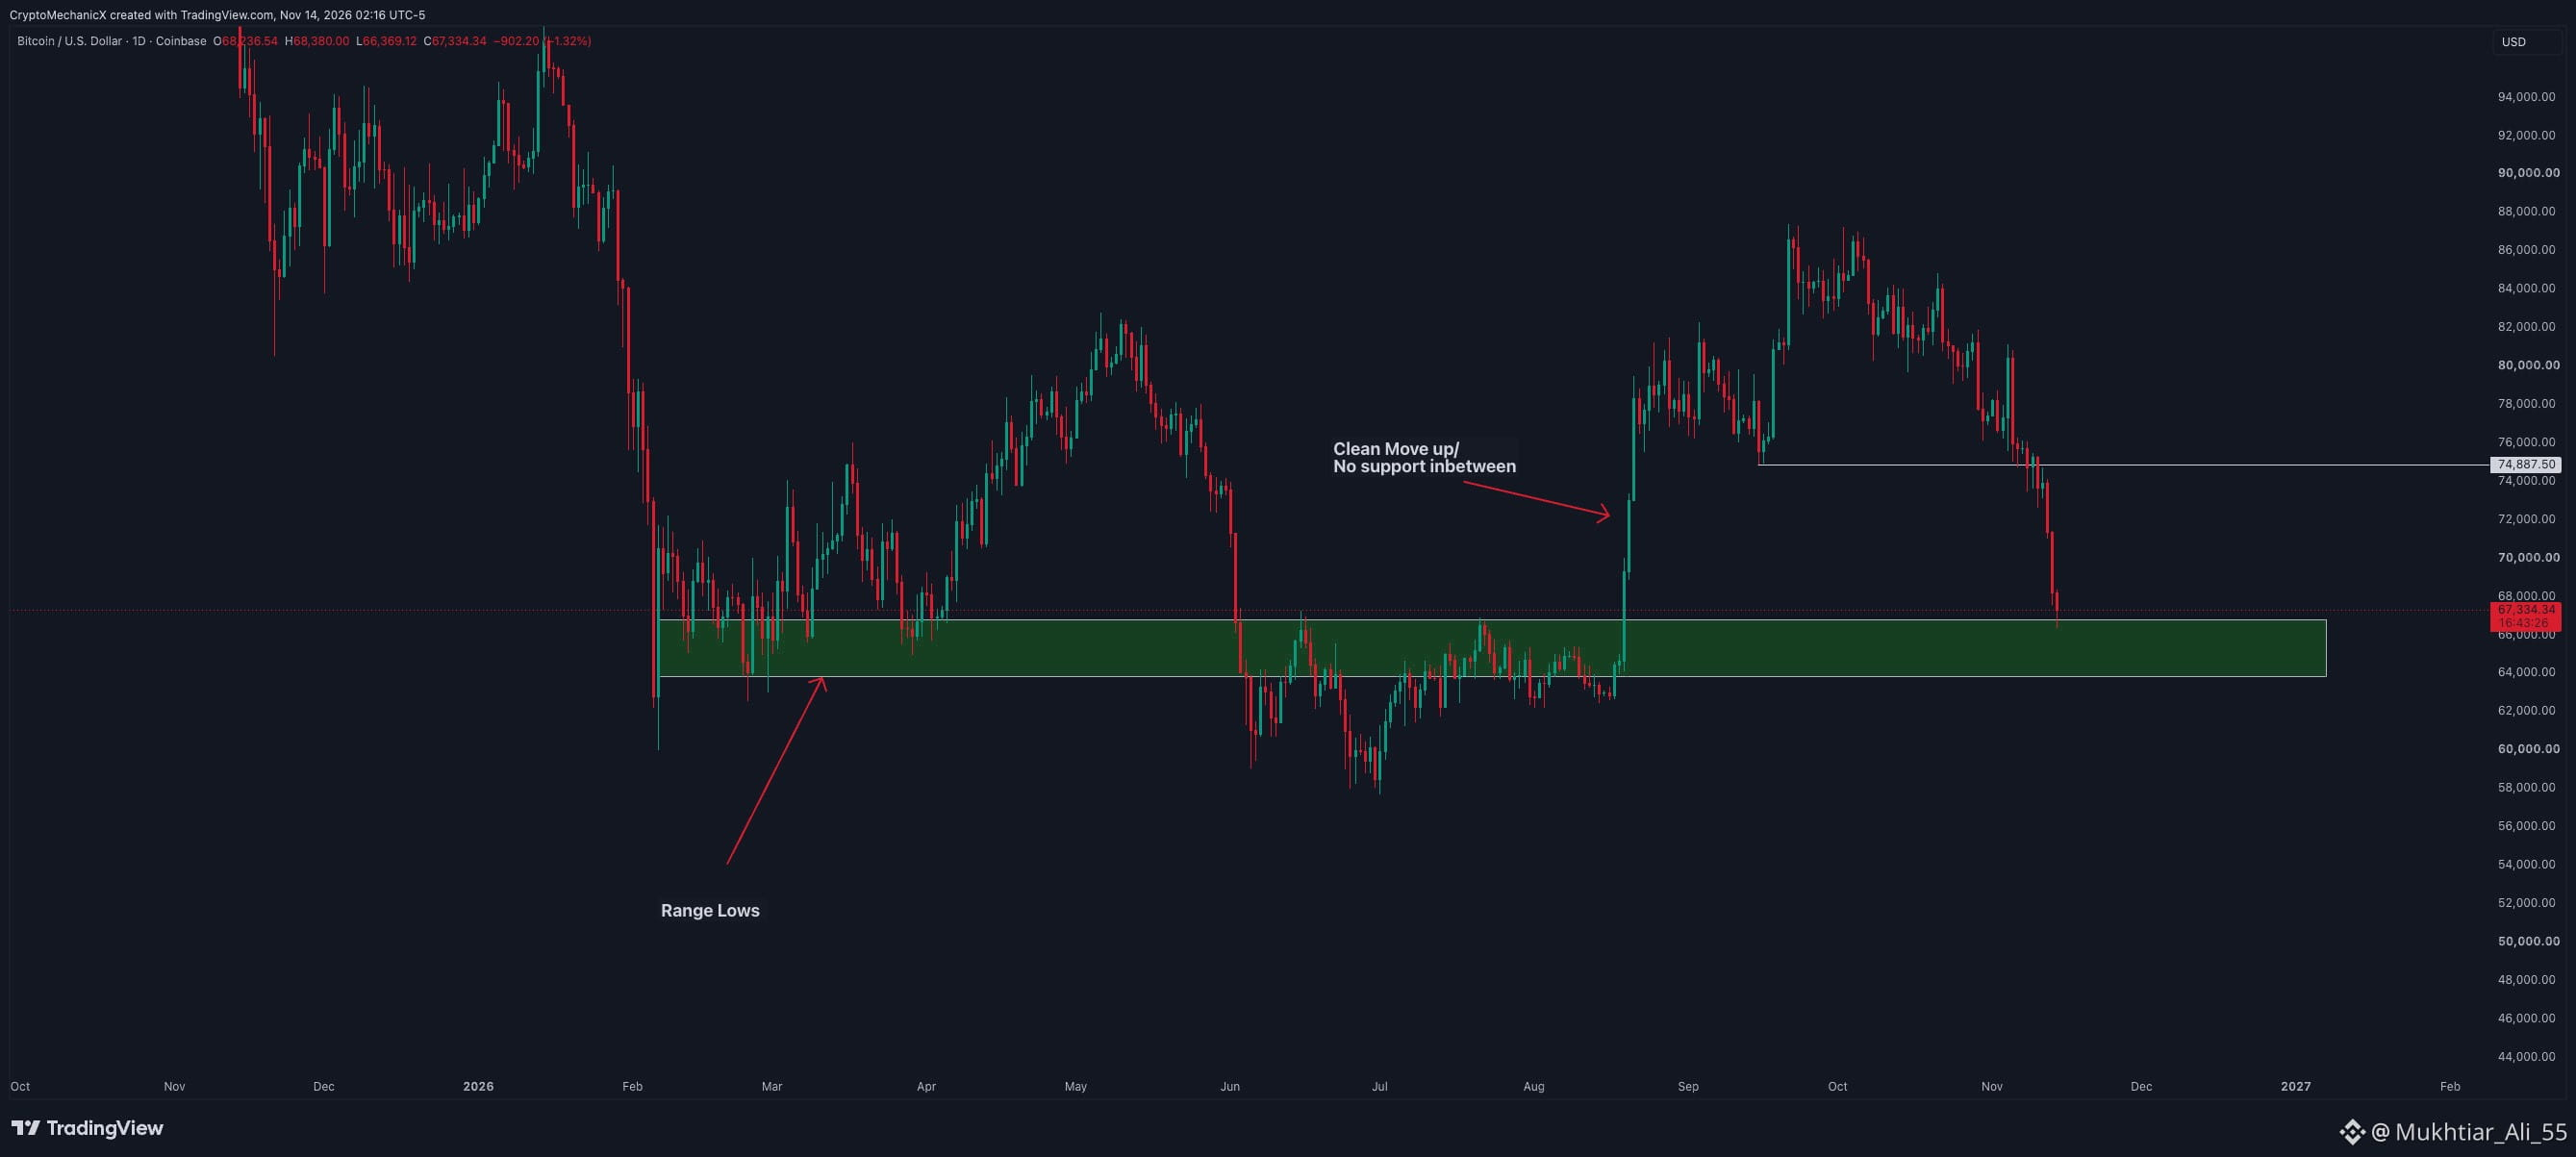
When BTC lost the $75K level, I pointed out that there wasn’t much support beneath it. The only setup that looked good to me was a reclaim of $75,000, and for as long as price stays under that mark, the bears hold control.
Looking at the chart on the left, I noted that the move up had been clean, with no real consolidation or support zones along the way. Everyone saw how things played out from there.
Now, though, price is closing in on a key area on the daily chart. It’s a daily demand zone, the very spot where the whole rally toward the $87K region began. The $63K - $67K area also marks the lows of the previous range.
That gives us a few solid reasons to think BTC might find some support here.
Whether this turns out to be a brief bounce or a more meaningful floor, I honestly can’t say. The selling has been relentless, far heavier than I anticipated. We’ll need to watch how price reacts.
Bottom line: there wasn’t any meaningful support below $75K, but BTC is now nearing a zone where it’s reasonable to expect buyers to show up and offer some support.
#Bitcoin #BTC #Crypto #TechnicalAnalysis #CryptoTrading
$BTC
When BTC lost the $75K level, I pointed out that there wasn’t much support beneath it. The only setup that looked good to me was a reclaim of $75,000, and for as long as price stays under that mark, the bears hold control.
Looking at the chart on the left, I noted that the move up had been clean, with no real consolidation or support zones along the way. Everyone saw how things played out from there.
Now, though, price is closing in on a key area on the daily chart. It’s a daily demand zone, the very spot where the whole rally toward the $87K region began. The $63K - $67K area also marks the lows of the previous range.
That gives us a few solid reasons to think BTC might find some support here.
Whether this turns out to be a brief bounce or a more meaningful floor, I honestly can’t say. The selling has been relentless, far heavier than I anticipated. We’ll need to watch how price reacts.
Bottom line: there wasn’t any meaningful support below $75K, but BTC is now nearing a zone where it’s reasonable to expect buyers to show up and offer some support.
#Bitcoin #BTC #Crypto #TechnicalAnalysis #CryptoTrading
When BTC lost the $75K level, I pointed out that there wasn’t much support beneath it. The only setup that looked good to me was a reclaim of $75,000, and for as long as price stays under that mark, the bears hold control.
Looking at the chart on the left, I noted that the move up had been clean, with no real consolidation or support zones along the way. Everyone saw how things played out from there.
Now, though, price is closing in on a key area on the daily chart. It’s a daily demand zone, the very spot where the whole rally toward the $87K region began. The $63K - $67K area also marks the lows of the previous range.
That gives us a few solid reasons to think BTC might find some support here.
Whether this turns out to be a brief bounce or a more meaningful floor, I honestly can’t say. The selling has been relentless, far heavier than I anticipated. We’ll need to watch how price reacts.
Bottom line: there wasn’t any meaningful support below $75K, but BTC is now nearing a zone where it’s reasonable to expect buyers to show up and offer some support.
#Bitcoin #BTC #Crypto #TechnicalAnalysis #CryptoTrading
1
5

·
--
🚨 **$BTC /USDT — BEARISH SHORT SETUP!** 🔴🐻
Bitcoin is showing bearish momentum on the 1H chart, trading below the stacked EMAs. Sellers remain in control, but oversold conditions could trigger a temporary bounce. 📉
{future}(BTCUSDT)
📍 **SHORT ENTRY:** $67,198.92 – $67,323.28
🎯 **TAKE PROFIT TARGETS:**
- TP1: $66,210.07 (-1.6%)
- TP2: $65,509.38 (-2.6%)
- TP3: $64,458.34 (-4.2%)
🛑 **STOP LOSS:** $68,662.48 (+2.1%)
📊 **TRADE MANAGEMENT:**
- Close 50% at TP1.
- Close 25% at TP2.
- Close remaining 25% at TP3.
- Move SL to entry after TP1.
🔎 **WHY I'M WATCHING SHORT:**
- Bearish 1H EMA structure.
- Price trading below key EMAs.
- 4H RSI at 22.4 indicates oversold conditions.
- Potential continuation of downside momentum.
⚠️ **Risk Management:** Moderate conviction only. Keep position size light and watch for sudden relief rallies.
💬 Where do you see BTC's next downside target? 👇
DYOR | NFA. Educational market analysis only, not financial advice.
#BTC #Bitcoin #BTCUSDT #Binance #ShortSignal #CryptoTrading #TechnicalAnalysis
🚨 **$BTC /USDT — BEARISH SHORT SETUP!** 🔴🐻
Bitcoin is showing bearish momentum on the 1H chart, trading below the stacked EMAs. Sellers remain in control, but oversold conditions could trigger a temporary bounce. 📉
📍 **SHORT ENTRY:** $67,198.92 – $67,323.28
🎯 **TAKE PROFIT TARGETS:**
- TP1: $66,210.07 (-1.6%)
- TP2: $65,509.38 (-2.6%)
- TP3: $64,458.34 (-4.2%)
🛑 **STOP LOSS:** $68,662.48 (+2.1%)
📊 **TRADE MANAGEMENT:**
- Close 50% at TP1.
- Close 25% at TP2.
- Close remaining 25% at TP3.
- Move SL to entry after TP1.
🔎 **WHY I'M WATCHING SHORT:**
- Bearish 1H EMA structure.
- Price trading below key EMAs.
- 4H RSI at 22.4 indicates oversold conditions.
- Potential continuation of downside momentum.
⚠️ **Risk Management:** Moderate conviction only. Keep position size light and watch for sudden relief rallies.
💬 Where do you see BTC's next downside target? 👇
DYOR | NFA. Educational market analysis only, not financial advice.
#BTC #Bitcoin #BTCUSDT #Binance #ShortSignal #CryptoTrading #TechnicalAnalysis
Bitcoin is showing bearish momentum on the 1H chart, trading below the stacked EMAs. Sellers remain in control, but oversold conditions could trigger a temporary bounce. 📉
📍 **SHORT ENTRY:** $67,198.92 – $67,323.28
🎯 **TAKE PROFIT TARGETS:**
- TP1: $66,210.07 (-1.6%)
- TP2: $65,509.38 (-2.6%)
- TP3: $64,458.34 (-4.2%)
🛑 **STOP LOSS:** $68,662.48 (+2.1%)
📊 **TRADE MANAGEMENT:**
- Close 50% at TP1.
- Close 25% at TP2.
- Close remaining 25% at TP3.
- Move SL to entry after TP1.
🔎 **WHY I'M WATCHING SHORT:**
- Bearish 1H EMA structure.
- Price trading below key EMAs.
- 4H RSI at 22.4 indicates oversold conditions.
- Potential continuation of downside momentum.
⚠️ **Risk Management:** Moderate conviction only. Keep position size light and watch for sudden relief rallies.
💬 Where do you see BTC's next downside target? 👇
DYOR | NFA. Educational market analysis only, not financial advice.
#BTC #Bitcoin #BTCUSDT #Binance #ShortSignal #CryptoTrading #TechnicalAnalysis
62

Is $SOPH about to make a major move past its ceiling? 🚀
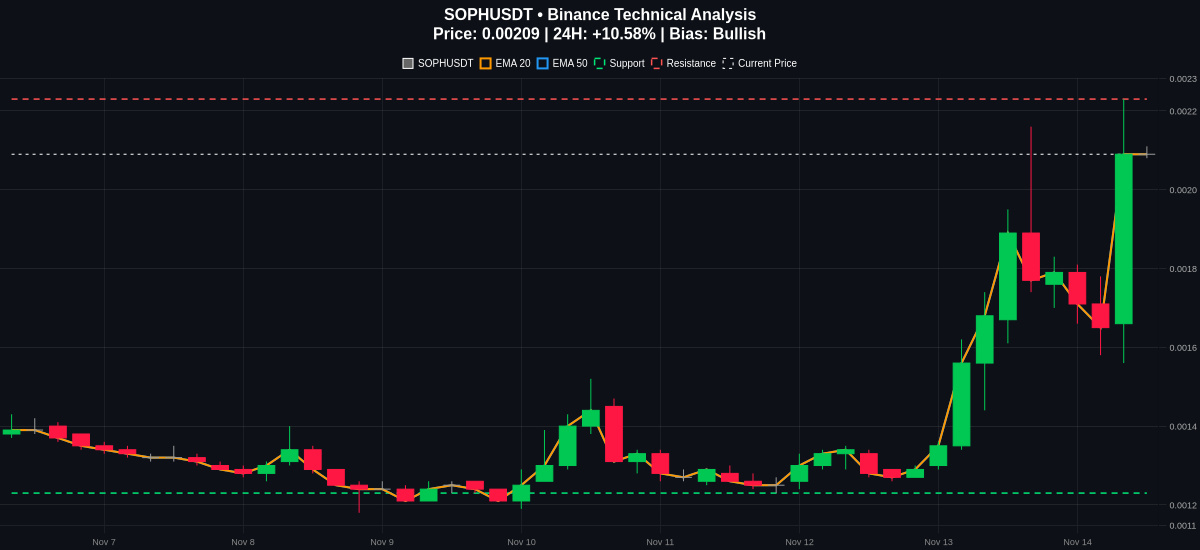
SOPHUSDT is currently trading at 0.00209, marking a solid 24-hour gain of over 10 percent. Price is pressing right up against a key resistance level at 0.00223, and the bullish trend structure suggests buyers are attempting to build pressure.
Looking at the technical indicators, the setup shows strong upward momentum. The MACD line at 0.000168 sits above its signal line at 0.000104, while the price holds well above both the EMA20 at 0.00161 and EMA50 at 0.00148.
At the same time, the RSI is reading at 74.36. While this indicates elevated conditions, it is not an automatic sell signal, though the distance from the EMA20 does introduce some potential pullback risk if momentum cools down.
On the downside, support is established at 0.00123, which serves as a key invalidation area to monitor if the market reverses. Watch for a confirmed break above resistance or a retest of support before making any moves.
How are you managing your risk on SOPH right now?
#SOPH #CryptoTrading #TechnicalAnalysis
Follow me for more update 📈
Is $SOPH about to make a major move past its ceiling? 🚀
SOPHUSDT is currently trading at 0.00209, marking a solid 24-hour gain of over 10 percent. Price is pressing right up against a key resistance level at 0.00223, and the bullish trend structure suggests buyers are attempting to build pressure.
Looking at the technical indicators, the setup shows strong upward momentum. The MACD line at 0.000168 sits above its signal line at 0.000104, while the price holds well above both the EMA20 at 0.00161 and EMA50 at 0.00148.
At the same time, the RSI is reading at 74.36. While this indicates elevated conditions, it is not an automatic sell signal, though the distance from the EMA20 does introduce some potential pullback risk if momentum cools down.
On the downside, support is established at 0.00123, which serves as a key invalidation area to monitor if the market reverses. Watch for a confirmed break above resistance or a retest of support before making any moves.
How are you managing your risk on SOPH right now?
#SOPH #CryptoTrading #TechnicalAnalysis
Follow me for more update 📈
SOPHUSDT is currently trading at 0.00209, marking a solid 24-hour gain of over 10 percent. Price is pressing right up against a key resistance level at 0.00223, and the bullish trend structure suggests buyers are attempting to build pressure.
Looking at the technical indicators, the setup shows strong upward momentum. The MACD line at 0.000168 sits above its signal line at 0.000104, while the price holds well above both the EMA20 at 0.00161 and EMA50 at 0.00148.
At the same time, the RSI is reading at 74.36. While this indicates elevated conditions, it is not an automatic sell signal, though the distance from the EMA20 does introduce some potential pullback risk if momentum cools down.
On the downside, support is established at 0.00123, which serves as a key invalidation area to monitor if the market reverses. Watch for a confirmed break above resistance or a retest of support before making any moves.
How are you managing your risk on SOPH right now?
#SOPH #CryptoTrading #TechnicalAnalysis
Follow me for more update 📈
181

·
--
Anatomy of the Arbitrum Tape: Weekend Chart Mechanics
Sunday evening usually brings the wick hunters out to play as we watch the weekly candle close approach. While the broader market is often distracted by noise, we need to look at how $ARB is actually printing its structural foundation. If you look at the recent price action hovering near the 0.64 region, you will notice the wick rejections are telling a much deeper story than the candle bodies themselves. A long lower shadow in this zone isn't just a line on a screen; it represents a specific pocket where liquidity was grabbed and spot absorption prevented a deeper slide toward previous lows.
When we apply Smart Money Concepts to the ARB chart, we are essentially hunting for Fair Value Gaps where price moved too fast for orders to be filled efficiently. These gaps often act as magnets during the Monday volatility shift. We also have to keep the macro tokenomics in mind. With a circulating float of approximately 3.9 billion tokens and a total supply of 10 billion, the Wyckoff accumulation phase here is notably prolonged. We are seeing classic signs of a preliminary support followed by a test, but the overhead supply from scheduled unlocks means the distribution phase is never far from a trader's mind.
Mastering the Market Structure Shift is the final piece of the puzzle. A true shift occurs when the sequence of lower highs is finally interrupted by a clean break of a recent swing high. For ARB, this involves neutralizing the localized order blocks that formed during previous sell-side imbalances. These blocks represent where institutional sell orders are clustered. I am paying close attention to how the candles react to these institutional footprints as the liquidity thinness of the weekend fades. Are you seeing signs of a genuine Wyckoff spring here, or is this just another liquidity trap before the weekly open?
_
#TechnicalAnalysis #CandlestickPatterns
Anatomy of the Arbitrum Tape: Weekend Chart Mechanics
Sunday evening usually brings the wick hunters out to play as we watch the weekly candle close approach. While the broader market is often distracted by noise, we need to look at how $ARB is actually printing its structural foundation. If you look at the recent price action hovering near the 0.64 region, you will notice the wick rejections are telling a much deeper story than the candle bodies themselves. A long lower shadow in this zone isn't just a line on a screen; it represents a specific pocket where liquidity was grabbed and spot absorption prevented a deeper slide toward previous lows.
When we apply Smart Money Concepts to the ARB chart, we are essentially hunting for Fair Value Gaps where price moved too fast for orders to be filled efficiently. These gaps often act as magnets during the Monday volatility shift. We also have to keep the macro tokenomics in mind. With a circulating float of approximately 3.9 billion tokens and a total supply of 10 billion, the Wyckoff accumulation phase here is notably prolonged. We are seeing classic signs of a preliminary support followed by a test, but the overhead supply from scheduled unlocks means the distribution phase is never far from a trader's mind.
Mastering the Market Structure Shift is the final piece of the puzzle. A true shift occurs when the sequence of lower highs is finally interrupted by a clean break of a recent swing high. For ARB, this involves neutralizing the localized order blocks that formed during previous sell-side imbalances. These blocks represent where institutional sell orders are clustered. I am paying close attention to how the candles react to these institutional footprints as the liquidity thinness of the weekend fades. Are you seeing signs of a genuine Wyckoff spring here, or is this just another liquidity trap before the weekly open?
_
#TechnicalAnalysis #CandlestickPatterns
Sunday evening usually brings the wick hunters out to play as we watch the weekly candle close approach. While the broader market is often distracted by noise, we need to look at how $ARB is actually printing its structural foundation. If you look at the recent price action hovering near the 0.64 region, you will notice the wick rejections are telling a much deeper story than the candle bodies themselves. A long lower shadow in this zone isn't just a line on a screen; it represents a specific pocket where liquidity was grabbed and spot absorption prevented a deeper slide toward previous lows.
When we apply Smart Money Concepts to the ARB chart, we are essentially hunting for Fair Value Gaps where price moved too fast for orders to be filled efficiently. These gaps often act as magnets during the Monday volatility shift. We also have to keep the macro tokenomics in mind. With a circulating float of approximately 3.9 billion tokens and a total supply of 10 billion, the Wyckoff accumulation phase here is notably prolonged. We are seeing classic signs of a preliminary support followed by a test, but the overhead supply from scheduled unlocks means the distribution phase is never far from a trader's mind.
Mastering the Market Structure Shift is the final piece of the puzzle. A true shift occurs when the sequence of lower highs is finally interrupted by a clean break of a recent swing high. For ARB, this involves neutralizing the localized order blocks that formed during previous sell-side imbalances. These blocks represent where institutional sell orders are clustered. I am paying close attention to how the candles react to these institutional footprints as the liquidity thinness of the weekend fades. Are you seeing signs of a genuine Wyckoff spring here, or is this just another liquidity trap before the weekly open?
_
#TechnicalAnalysis #CandlestickPatterns
1
130
🚨 LUNC MARKET UPDATE – NOVEMBER 14, 2026 🚨
🔥 Can Terra Classic (LUNC) make a comeback?
$LUNC is currently showing bearish momentum, but an important support zone is approaching.
📊 MARKET SNAPSHOT
- Current price: $0.00003638
- Daily RSI: 24 (oversold)
- Market trend: Bearish
🎯 KEY PRICE LEVELS
🟢 Resistance 1: $0.00003749
🟢 Resistance 2: $0.00003857
🔴 Support 1: $0.00003628
🔴 Support 2: $0.00003520
📈 WHAT TO WATCH
If LUNC moves above $0.00003749 and holds, market sentiment could improve.
However, a breakdown below $0.00003628 could bring further downside pressure.
RSI is in oversold territory, but that alone does not confirm a reversal.
💬 COMMUNITY QUESTION
Do you think LUNC will recover, or will bearish pressure continue?
Share your thoughts below! 👇
#LUNC #TerraClassic #CryptoAnalysis #BinanceSquare #CryptoMarket #TechnicalAnalysis #WhoWillSucceedJensenHuangatNvidia? #WhatWillDriveCryptoandStocks’NextRebound? #USPPIMissMayEaseBTCPressure
Educational market analysis only. Not financial advice. No guaranteed returns.
{spot}(LUNCUSDT)
🚨 LUNC MARKET UPDATE – NOVEMBER 14, 2026 🚨
🔥 Can Terra Classic (LUNC) make a comeback?
$LUNC is currently showing bearish momentum, but an important support zone is approaching.
📊 MARKET SNAPSHOT
- Current price: $0.00003638
- Daily RSI: 24 (oversold)
- Market trend: Bearish
🎯 KEY PRICE LEVELS
🟢 Resistance 1: $0.00003749
🟢 Resistance 2: $0.00003857
🔴 Support 1: $0.00003628
🔴 Support 2: $0.00003520
📈 WHAT TO WATCH
If LUNC moves above $0.00003749 and holds, market sentiment could improve.
However, a breakdown below $0.00003628 could bring further downside pressure.
RSI is in oversold territory, but that alone does not confirm a reversal.
💬 COMMUNITY QUESTION
Do you think LUNC will recover, or will bearish pressure continue?
Share your thoughts below! 👇
#LUNC #TerraClassic #CryptoAnalysis #BinanceSquare #CryptoMarket #TechnicalAnalysis #WhoWillSucceedJensenHuangatNvidia? #WhatWillDriveCryptoandStocks’NextRebound? #USPPIMissMayEaseBTCPressure
Educational market analysis only. Not financial advice. No guaranteed returns.
🔥 Can Terra Classic (LUNC) make a comeback?
$LUNC is currently showing bearish momentum, but an important support zone is approaching.
📊 MARKET SNAPSHOT
- Current price: $0.00003638
- Daily RSI: 24 (oversold)
- Market trend: Bearish
🎯 KEY PRICE LEVELS
🟢 Resistance 1: $0.00003749
🟢 Resistance 2: $0.00003857
🔴 Support 1: $0.00003628
🔴 Support 2: $0.00003520
📈 WHAT TO WATCH
If LUNC moves above $0.00003749 and holds, market sentiment could improve.
However, a breakdown below $0.00003628 could bring further downside pressure.
RSI is in oversold territory, but that alone does not confirm a reversal.
💬 COMMUNITY QUESTION
Do you think LUNC will recover, or will bearish pressure continue?
Share your thoughts below! 👇
#LUNC #TerraClassic #CryptoAnalysis #BinanceSquare #CryptoMarket #TechnicalAnalysis #WhoWillSucceedJensenHuangatNvidia? #WhatWillDriveCryptoandStocks’NextRebound? #USPPIMissMayEaseBTCPressure
Educational market analysis only. Not financial advice. No guaranteed returns.

2
200
·
--
Bullish
NEAR/USDT — Positive 24H Performance, but 4H Momentum Remains Weak
Binance Spot Price: $3.363
24H Change: +0.900%
24H Range: $3.313 – $3.639
Key Technical Levels
Support: $3.340–$3.313, followed by $3.265.
Resistance: $3.478, the 4H EMA20 near $3.514, then $3.639.
Trend & Momentum: NEAR is showing a positive 24H change, but its short-term technical structure remains weak. Price is below the 4H EMA20, while RSI14 at 38.0 indicates negative momentum without deeply oversold conditions.
Bullish Scenario: Holding above $3.313 and reclaiming $3.478 could create room for a test of the EMA20 around $3.514. A sustained breakout above that level would bring $3.639 back into focus.
Bearish Scenario: A decisive break below $3.313 would expose the recent swing low at $3.265. Failure to reclaim $3.478 would leave the recovery attempt vulnerable.
Conclusion: NEAR's positive 24H change has not yet translated into a confirmed 4H recovery. The key test is whether buyers can reclaim $3.514 and restore short-term momentum.
{spot}(NEARUSDT)
{spot}(BTCUSDT)
{spot}(ETHUSDT)
$NEAR $BTC $ETH
#TripsSam #NEAR #NEARProtocol #Altcoins #TechnicalAnalysis
Market analysis only — not financial advice.
NEAR/USDT — Positive 24H Performance, but 4H Momentum Remains Weak
Binance Spot Price: $3.363
24H Change: +0.900%
24H Range: $3.313 – $3.639
Key Technical Levels
Support: $3.340–$3.313, followed by $3.265.
Resistance: $3.478, the 4H EMA20 near $3.514, then $3.639.
Trend & Momentum: NEAR is showing a positive 24H change, but its short-term technical structure remains weak. Price is below the 4H EMA20, while RSI14 at 38.0 indicates negative momentum without deeply oversold conditions.
Bullish Scenario: Holding above $3.313 and reclaiming $3.478 could create room for a test of the EMA20 around $3.514. A sustained breakout above that level would bring $3.639 back into focus.
Bearish Scenario: A decisive break below $3.313 would expose the recent swing low at $3.265. Failure to reclaim $3.478 would leave the recovery attempt vulnerable.
Conclusion: NEAR's positive 24H change has not yet translated into a confirmed 4H recovery. The key test is whether buyers can reclaim $3.514 and restore short-term momentum.
$NEAR $BTC $ETH
#TripsSam #NEAR #NEARProtocol #Altcoins #TechnicalAnalysis
Market analysis only — not financial advice.
Binance Spot Price: $3.363
24H Change: +0.900%
24H Range: $3.313 – $3.639
Key Technical Levels
Support: $3.340–$3.313, followed by $3.265.
Resistance: $3.478, the 4H EMA20 near $3.514, then $3.639.
Trend & Momentum: NEAR is showing a positive 24H change, but its short-term technical structure remains weak. Price is below the 4H EMA20, while RSI14 at 38.0 indicates negative momentum without deeply oversold conditions.
Bullish Scenario: Holding above $3.313 and reclaiming $3.478 could create room for a test of the EMA20 around $3.514. A sustained breakout above that level would bring $3.639 back into focus.
Bearish Scenario: A decisive break below $3.313 would expose the recent swing low at $3.265. Failure to reclaim $3.478 would leave the recovery attempt vulnerable.
Conclusion: NEAR's positive 24H change has not yet translated into a confirmed 4H recovery. The key test is whether buyers can reclaim $3.514 and restore short-term momentum.
$NEAR $BTC $ETH
#TripsSam #NEAR #NEARProtocol #Altcoins #TechnicalAnalysis
Market analysis only — not financial advice.
137

·
--
Bearish
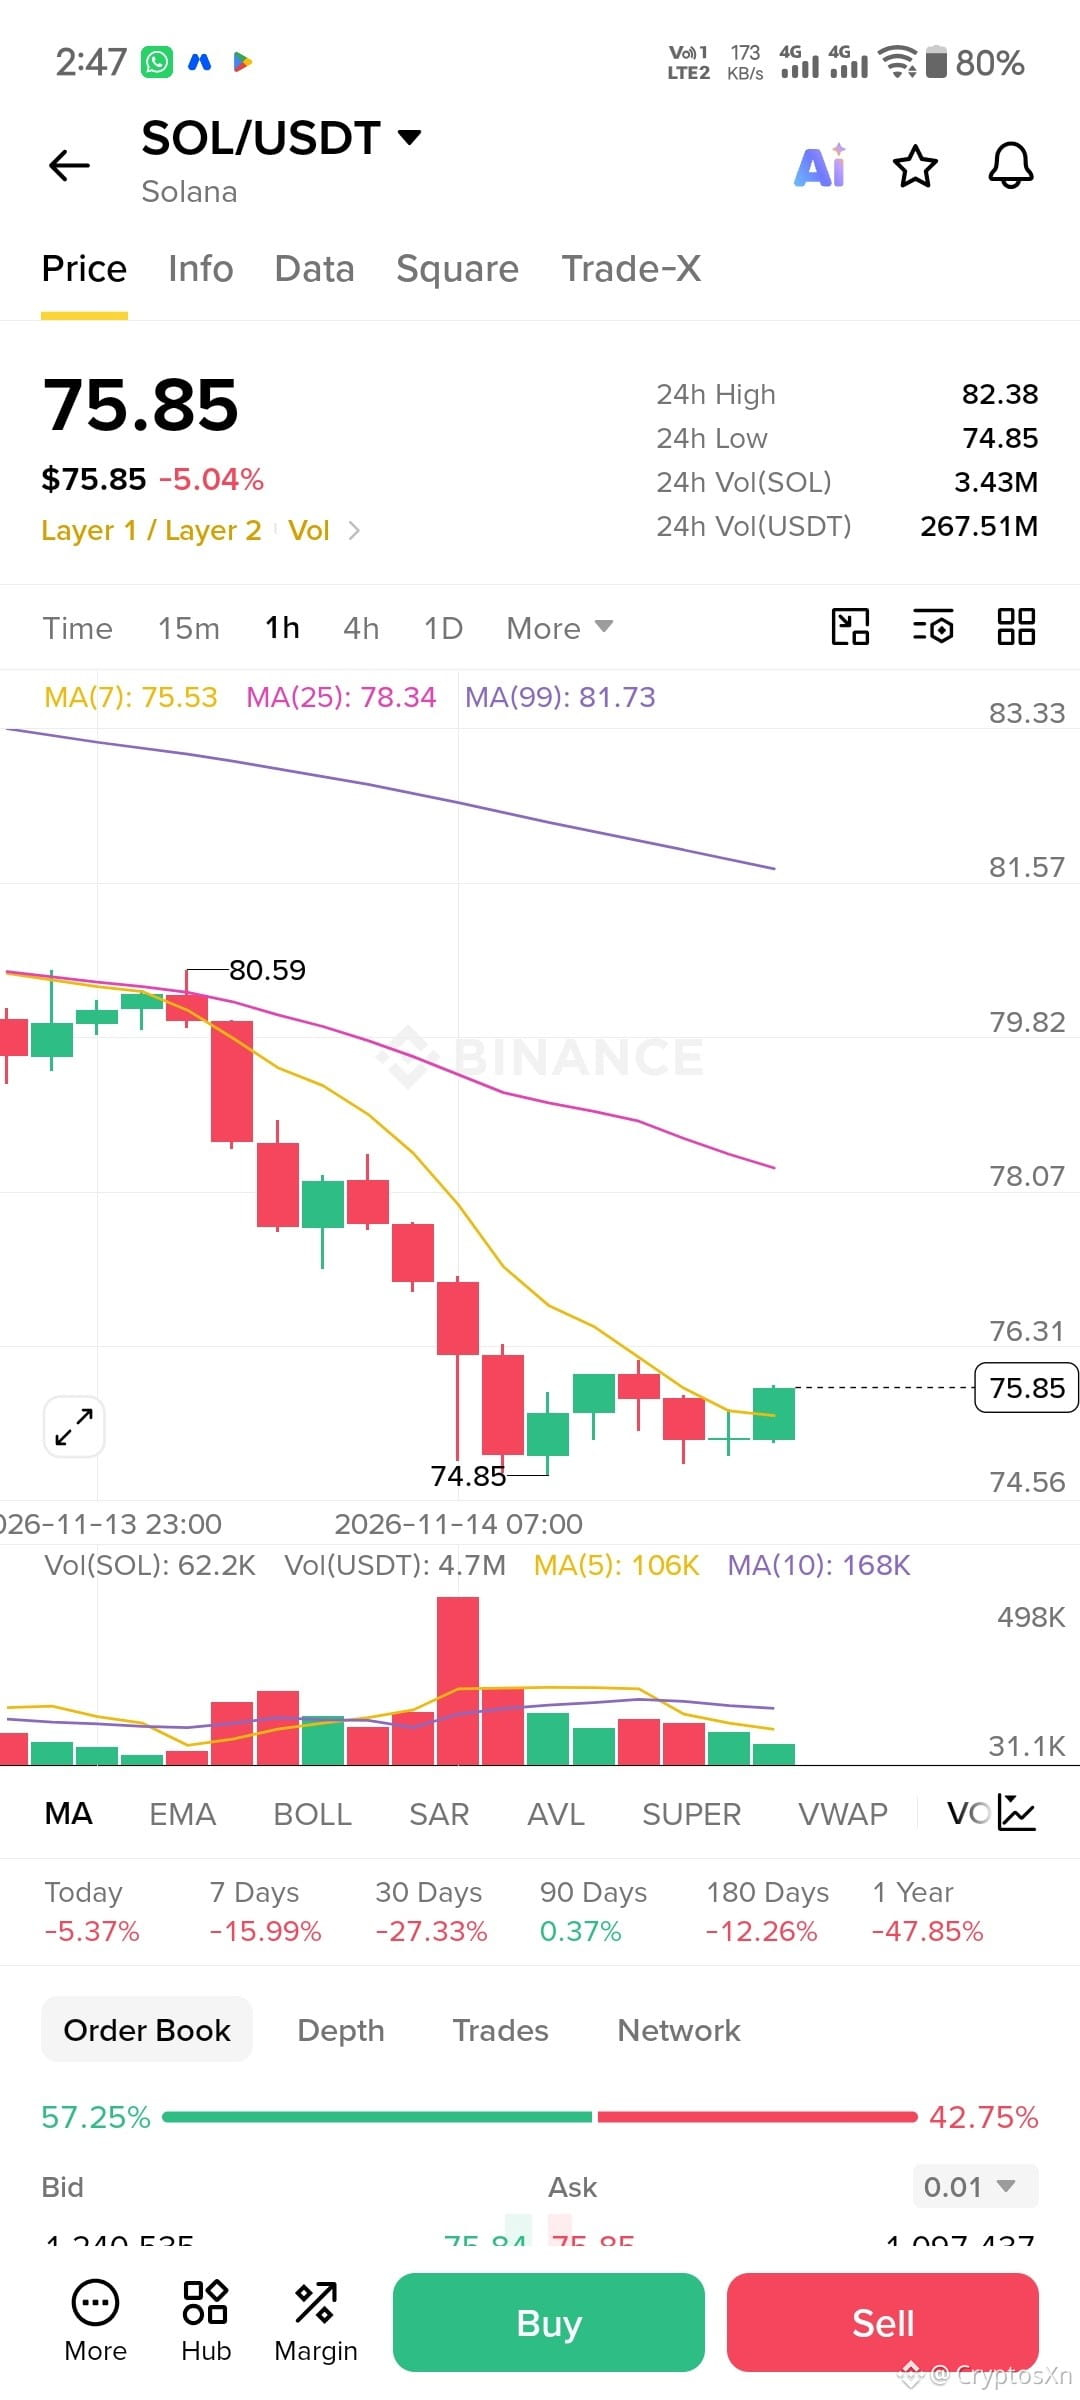
$SOL | SOLANA PRICE ACTION 📉
{future}(SOLUSDT)
Solana is showing a clear bearish structure on the 1H chart, with price around $75.85 in the screenshot.
A strong downward move was followed by a small bounce. The next candles and trading volume will help show whether buyers are gaining strength.
Key Observation: Recovery attempt after strong selling pressure.
Can SOL build a stronger recovery?
#Solana #sol #TechnicalAnalysis #BİNANCESQUARE
$SOL | SOLANA PRICE ACTION 📉
Solana is showing a clear bearish structure on the 1H chart, with price around $75.85 in the screenshot.
A strong downward move was followed by a small bounce. The next candles and trading volume will help show whether buyers are gaining strength.
Key Observation: Recovery attempt after strong selling pressure.
Can SOL build a stronger recovery?
#Solana #sol #TechnicalAnalysis #BİNANCESQUARE
Solana is showing a clear bearish structure on the 1H chart, with price around $75.85 in the screenshot.
A strong downward move was followed by a small bounce. The next candles and trading volume will help show whether buyers are gaining strength.
Key Observation: Recovery attempt after strong selling pressure.
Can SOL build a stronger recovery?
#Solana #sol #TechnicalAnalysis #BİNANCESQUARE
91
Log in to explore more content
Join global crypto users on Binance Square
⚡️ Get latest and useful information about crypto.
💬 Trusted by the world’s largest crypto exchange.
👍 Discover real insights from verified creators.
Email / Phone number
Trending Topics
1
#WhoWillSucceedJensenHuangatNvidia?
83,519 views
1,134 Discussing
2
#WhatWillDriveCryptoandStocks’NextRebound?
435,324 views
3,032 Discussing
3
#BitcoinActiveSupplyInProfitDropsBelow45%
23,113 views
354 Discussing
4
#KavaSaysAbnormalActivityLimitedToKavaLend
9,225 views
177 Discussing
5
#USSpotXRPETFsSeeLargestWeeklyOutflowIn8Months
8,394 views
168 Discussing
6
#USPPIMissMayEaseBTCPressure
208,961 views
2,050 Discussing
7
#WORPTLetsTouristsConvertCryptoToThaiBaht
2,645 views
52 Discussing
8
#TONStrategyReports$23.97MQ3NetLoss
3,345 views
41 Discussing
9
#PolkadotCommunityApprovesNewStrategyWith97%Vote
18,903 views
248 Discussing
10
#dYdXPlansV9.9UpgradeToShiftUSDCToInjective
11,684 views
199 Discussing