
#candlestickpatterns
candlestickpatterns
1.6M views
834 Discussing
Hot
Latest

·
--
Anatomy of the Arbitrum Tape: Weekend Chart Mechanics
Sunday evening usually brings the wick hunters out to play as we watch the weekly candle close approach. While the broader market is often distracted by noise, we need to look at how $ARB is actually printing its structural foundation. If you look at the recent price action hovering near the 0.64 region, you will notice the wick rejections are telling a much deeper story than the candle bodies themselves. A long lower shadow in this zone isn't just a line on a screen; it represents a specific pocket where liquidity was grabbed and spot absorption prevented a deeper slide toward previous lows.
When we apply Smart Money Concepts to the ARB chart, we are essentially hunting for Fair Value Gaps where price moved too fast for orders to be filled efficiently. These gaps often act as magnets during the Monday volatility shift. We also have to keep the macro tokenomics in mind. With a circulating float of approximately 3.9 billion tokens and a total supply of 10 billion, the Wyckoff accumulation phase here is notably prolonged. We are seeing classic signs of a preliminary support followed by a test, but the overhead supply from scheduled unlocks means the distribution phase is never far from a trader's mind.
Mastering the Market Structure Shift is the final piece of the puzzle. A true shift occurs when the sequence of lower highs is finally interrupted by a clean break of a recent swing high. For ARB, this involves neutralizing the localized order blocks that formed during previous sell-side imbalances. These blocks represent where institutional sell orders are clustered. I am paying close attention to how the candles react to these institutional footprints as the liquidity thinness of the weekend fades. Are you seeing signs of a genuine Wyckoff spring here, or is this just another liquidity trap before the weekly open?
_
#TechnicalAnalysis #CandlestickPatterns
Anatomy of the Arbitrum Tape: Weekend Chart Mechanics
Sunday evening usually brings the wick hunters out to play as we watch the weekly candle close approach. While the broader market is often distracted by noise, we need to look at how $ARB is actually printing its structural foundation. If you look at the recent price action hovering near the 0.64 region, you will notice the wick rejections are telling a much deeper story than the candle bodies themselves. A long lower shadow in this zone isn't just a line on a screen; it represents a specific pocket where liquidity was grabbed and spot absorption prevented a deeper slide toward previous lows.
When we apply Smart Money Concepts to the ARB chart, we are essentially hunting for Fair Value Gaps where price moved too fast for orders to be filled efficiently. These gaps often act as magnets during the Monday volatility shift. We also have to keep the macro tokenomics in mind. With a circulating float of approximately 3.9 billion tokens and a total supply of 10 billion, the Wyckoff accumulation phase here is notably prolonged. We are seeing classic signs of a preliminary support followed by a test, but the overhead supply from scheduled unlocks means the distribution phase is never far from a trader's mind.
Mastering the Market Structure Shift is the final piece of the puzzle. A true shift occurs when the sequence of lower highs is finally interrupted by a clean break of a recent swing high. For ARB, this involves neutralizing the localized order blocks that formed during previous sell-side imbalances. These blocks represent where institutional sell orders are clustered. I am paying close attention to how the candles react to these institutional footprints as the liquidity thinness of the weekend fades. Are you seeing signs of a genuine Wyckoff spring here, or is this just another liquidity trap before the weekly open?
_
#TechnicalAnalysis #CandlestickPatterns
Sunday evening usually brings the wick hunters out to play as we watch the weekly candle close approach. While the broader market is often distracted by noise, we need to look at how $ARB is actually printing its structural foundation. If you look at the recent price action hovering near the 0.64 region, you will notice the wick rejections are telling a much deeper story than the candle bodies themselves. A long lower shadow in this zone isn't just a line on a screen; it represents a specific pocket where liquidity was grabbed and spot absorption prevented a deeper slide toward previous lows.
When we apply Smart Money Concepts to the ARB chart, we are essentially hunting for Fair Value Gaps where price moved too fast for orders to be filled efficiently. These gaps often act as magnets during the Monday volatility shift. We also have to keep the macro tokenomics in mind. With a circulating float of approximately 3.9 billion tokens and a total supply of 10 billion, the Wyckoff accumulation phase here is notably prolonged. We are seeing classic signs of a preliminary support followed by a test, but the overhead supply from scheduled unlocks means the distribution phase is never far from a trader's mind.
Mastering the Market Structure Shift is the final piece of the puzzle. A true shift occurs when the sequence of lower highs is finally interrupted by a clean break of a recent swing high. For ARB, this involves neutralizing the localized order blocks that formed during previous sell-side imbalances. These blocks represent where institutional sell orders are clustered. I am paying close attention to how the candles react to these institutional footprints as the liquidity thinness of the weekend fades. Are you seeing signs of a genuine Wyckoff spring here, or is this just another liquidity trap before the weekly open?
_
#TechnicalAnalysis #CandlestickPatterns
1
187
·
--
The Sunday Tape: Deconstructing SUI Price Mechanics and Liquidity Structures
Sitting here at midday watching the weekend chop, it is clear that price action is more than just green and red bars. For those tracking $SUI lately, understanding the difference between a trend continuation and a trap comes down to reading the footprint left by large participants. When we look at candlestick anatomy, specifically on the higher timeframes, long upper wicks at the top of a range signify aggressive selling absorption, while a hammer or pin bar at the bottom suggests the float is being hoovered up by limit orders rather than market selling.
One of the most effective ways to filter noise is through Smart Money Concepts. On the SUI chart, we often see Fair Value Gaps (FVG) or imbalances where the price moved so fast that it skipped over orders. These gaps act like magnets. When price returns to these zones and coincides with a bullish Order Block—a specific candle where institutional buying originated—the probability of a bounce increases. Watch for a Market Structure Shift (MSS) where the previous lower high is taken out, confirming a Break of Structure (BOS) to the upside.
Currently, with a circulating supply of roughly 2.8 billion tokens and periodic unlocks adding to the float, the Wyckoff cycle is essential to monitor. We have moved significantly from the previous macro pivot near 0.781, and the current tape shows how liquidity reacts when spot absorption thins out. We are looking for signs of accumulation versus distribution where high volume at peaks without price progress often signals a shift in hands.
The goal of this weekend study session is to build a framework so you can identify when the trend is actually shifting. Do you prioritize raw candlestick patterns or do you find more clarity in identifying liquidity gaps and order blocks?
_
#TechnicalAnalysis #CandlestickPatterns
The Sunday Tape: Deconstructing SUI Price Mechanics and Liquidity Structures
Sitting here at midday watching the weekend chop, it is clear that price action is more than just green and red bars. For those tracking $SUI lately, understanding the difference between a trend continuation and a trap comes down to reading the footprint left by large participants. When we look at candlestick anatomy, specifically on the higher timeframes, long upper wicks at the top of a range signify aggressive selling absorption, while a hammer or pin bar at the bottom suggests the float is being hoovered up by limit orders rather than market selling.
One of the most effective ways to filter noise is through Smart Money Concepts. On the SUI chart, we often see Fair Value Gaps (FVG) or imbalances where the price moved so fast that it skipped over orders. These gaps act like magnets. When price returns to these zones and coincides with a bullish Order Block—a specific candle where institutional buying originated—the probability of a bounce increases. Watch for a Market Structure Shift (MSS) where the previous lower high is taken out, confirming a Break of Structure (BOS) to the upside.
Currently, with a circulating supply of roughly 2.8 billion tokens and periodic unlocks adding to the float, the Wyckoff cycle is essential to monitor. We have moved significantly from the previous macro pivot near 0.781, and the current tape shows how liquidity reacts when spot absorption thins out. We are looking for signs of accumulation versus distribution where high volume at peaks without price progress often signals a shift in hands.
The goal of this weekend study session is to build a framework so you can identify when the trend is actually shifting. Do you prioritize raw candlestick patterns or do you find more clarity in identifying liquidity gaps and order blocks?
_
#TechnicalAnalysis #CandlestickPatterns
Sitting here at midday watching the weekend chop, it is clear that price action is more than just green and red bars. For those tracking $SUI lately, understanding the difference between a trend continuation and a trap comes down to reading the footprint left by large participants. When we look at candlestick anatomy, specifically on the higher timeframes, long upper wicks at the top of a range signify aggressive selling absorption, while a hammer or pin bar at the bottom suggests the float is being hoovered up by limit orders rather than market selling.
One of the most effective ways to filter noise is through Smart Money Concepts. On the SUI chart, we often see Fair Value Gaps (FVG) or imbalances where the price moved so fast that it skipped over orders. These gaps act like magnets. When price returns to these zones and coincides with a bullish Order Block—a specific candle where institutional buying originated—the probability of a bounce increases. Watch for a Market Structure Shift (MSS) where the previous lower high is taken out, confirming a Break of Structure (BOS) to the upside.
Currently, with a circulating supply of roughly 2.8 billion tokens and periodic unlocks adding to the float, the Wyckoff cycle is essential to monitor. We have moved significantly from the previous macro pivot near 0.781, and the current tape shows how liquidity reacts when spot absorption thins out. We are looking for signs of accumulation versus distribution where high volume at peaks without price progress often signals a shift in hands.
The goal of this weekend study session is to build a framework so you can identify when the trend is actually shifting. Do you prioritize raw candlestick patterns or do you find more clarity in identifying liquidity gaps and order blocks?
_
#TechnicalAnalysis #CandlestickPatterns

2
48

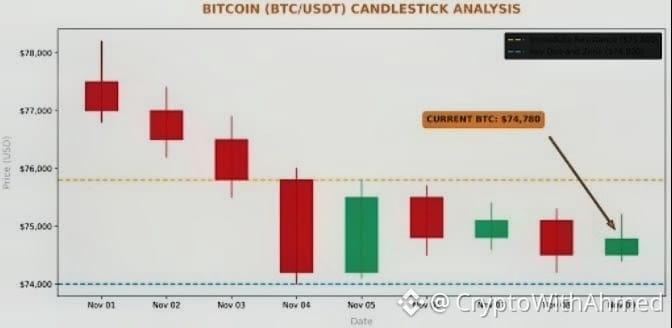
$BTC /USDT CANDLESTICK ANALYSIS & NEXT TARGETS
Bitcoin is currently consolidating around $74,780 inside a critical accumulation range. Here is what the technical chart indicates:
📊 Key Technical Levels:
• Current Trading Zone: ~$74,780
• Immediate Resistance: $75,800
• Major Demand / Support Zone: $74,000
🔍 Market Scenario:
• Bullish Case: A clean 4-hour can
{spot}(BTCUSDT)
dle breakout above $75,800 opens the pathway for a retest of $76,500 – $77,500.
• Bearish Case: Failure to hold $74,000 support could trigger a liquidity sweep down towards $72,600.
⚠️ Trader's Tip: Avoid FOMO entries within the consolidation zone. Wait for confirmation above resistance or around the demand zone before placing orders. Always trade with proper risk management!
#Bitcoin #BinanceSquare #CryptoAnalysis #cryptotrading #CandlestickPatterns
$BTC /USDT CANDLESTICK ANALYSIS & NEXT TARGETS
Bitcoin is currently consolidating around $74,780 inside a critical accumulation range. Here is what the technical chart indicates:
📊 Key Technical Levels:
• Current Trading Zone: ~$74,780
• Immediate Resistance: $75,800
• Major Demand / Support Zone: $74,000
🔍 Market Scenario:
• Bullish Case: A clean 4-hour can
dle breakout above $75,800 opens the pathway for a retest of $76,500 – $77,500.
• Bearish Case: Failure to hold $74,000 support could trigger a liquidity sweep down towards $72,600.
⚠️ Trader's Tip: Avoid FOMO entries within the consolidation zone. Wait for confirmation above resistance or around the demand zone before placing orders. Always trade with proper risk management!
#Bitcoin #BinanceSquare #CryptoAnalysis #cryptotrading #CandlestickPatterns
Bitcoin is currently consolidating around $74,780 inside a critical accumulation range. Here is what the technical chart indicates:
📊 Key Technical Levels:
• Current Trading Zone: ~$74,780
• Immediate Resistance: $75,800
• Major Demand / Support Zone: $74,000
🔍 Market Scenario:
• Bullish Case: A clean 4-hour can
dle breakout above $75,800 opens the pathway for a retest of $76,500 – $77,500.
• Bearish Case: Failure to hold $74,000 support could trigger a liquidity sweep down towards $72,600.
⚠️ Trader's Tip: Avoid FOMO entries within the consolidation zone. Wait for confirmation above resistance or around the demand zone before placing orders. Always trade with proper risk management!
#Bitcoin #BinanceSquare #CryptoAnalysis #cryptotrading #CandlestickPatterns
1
60

·
--
Article
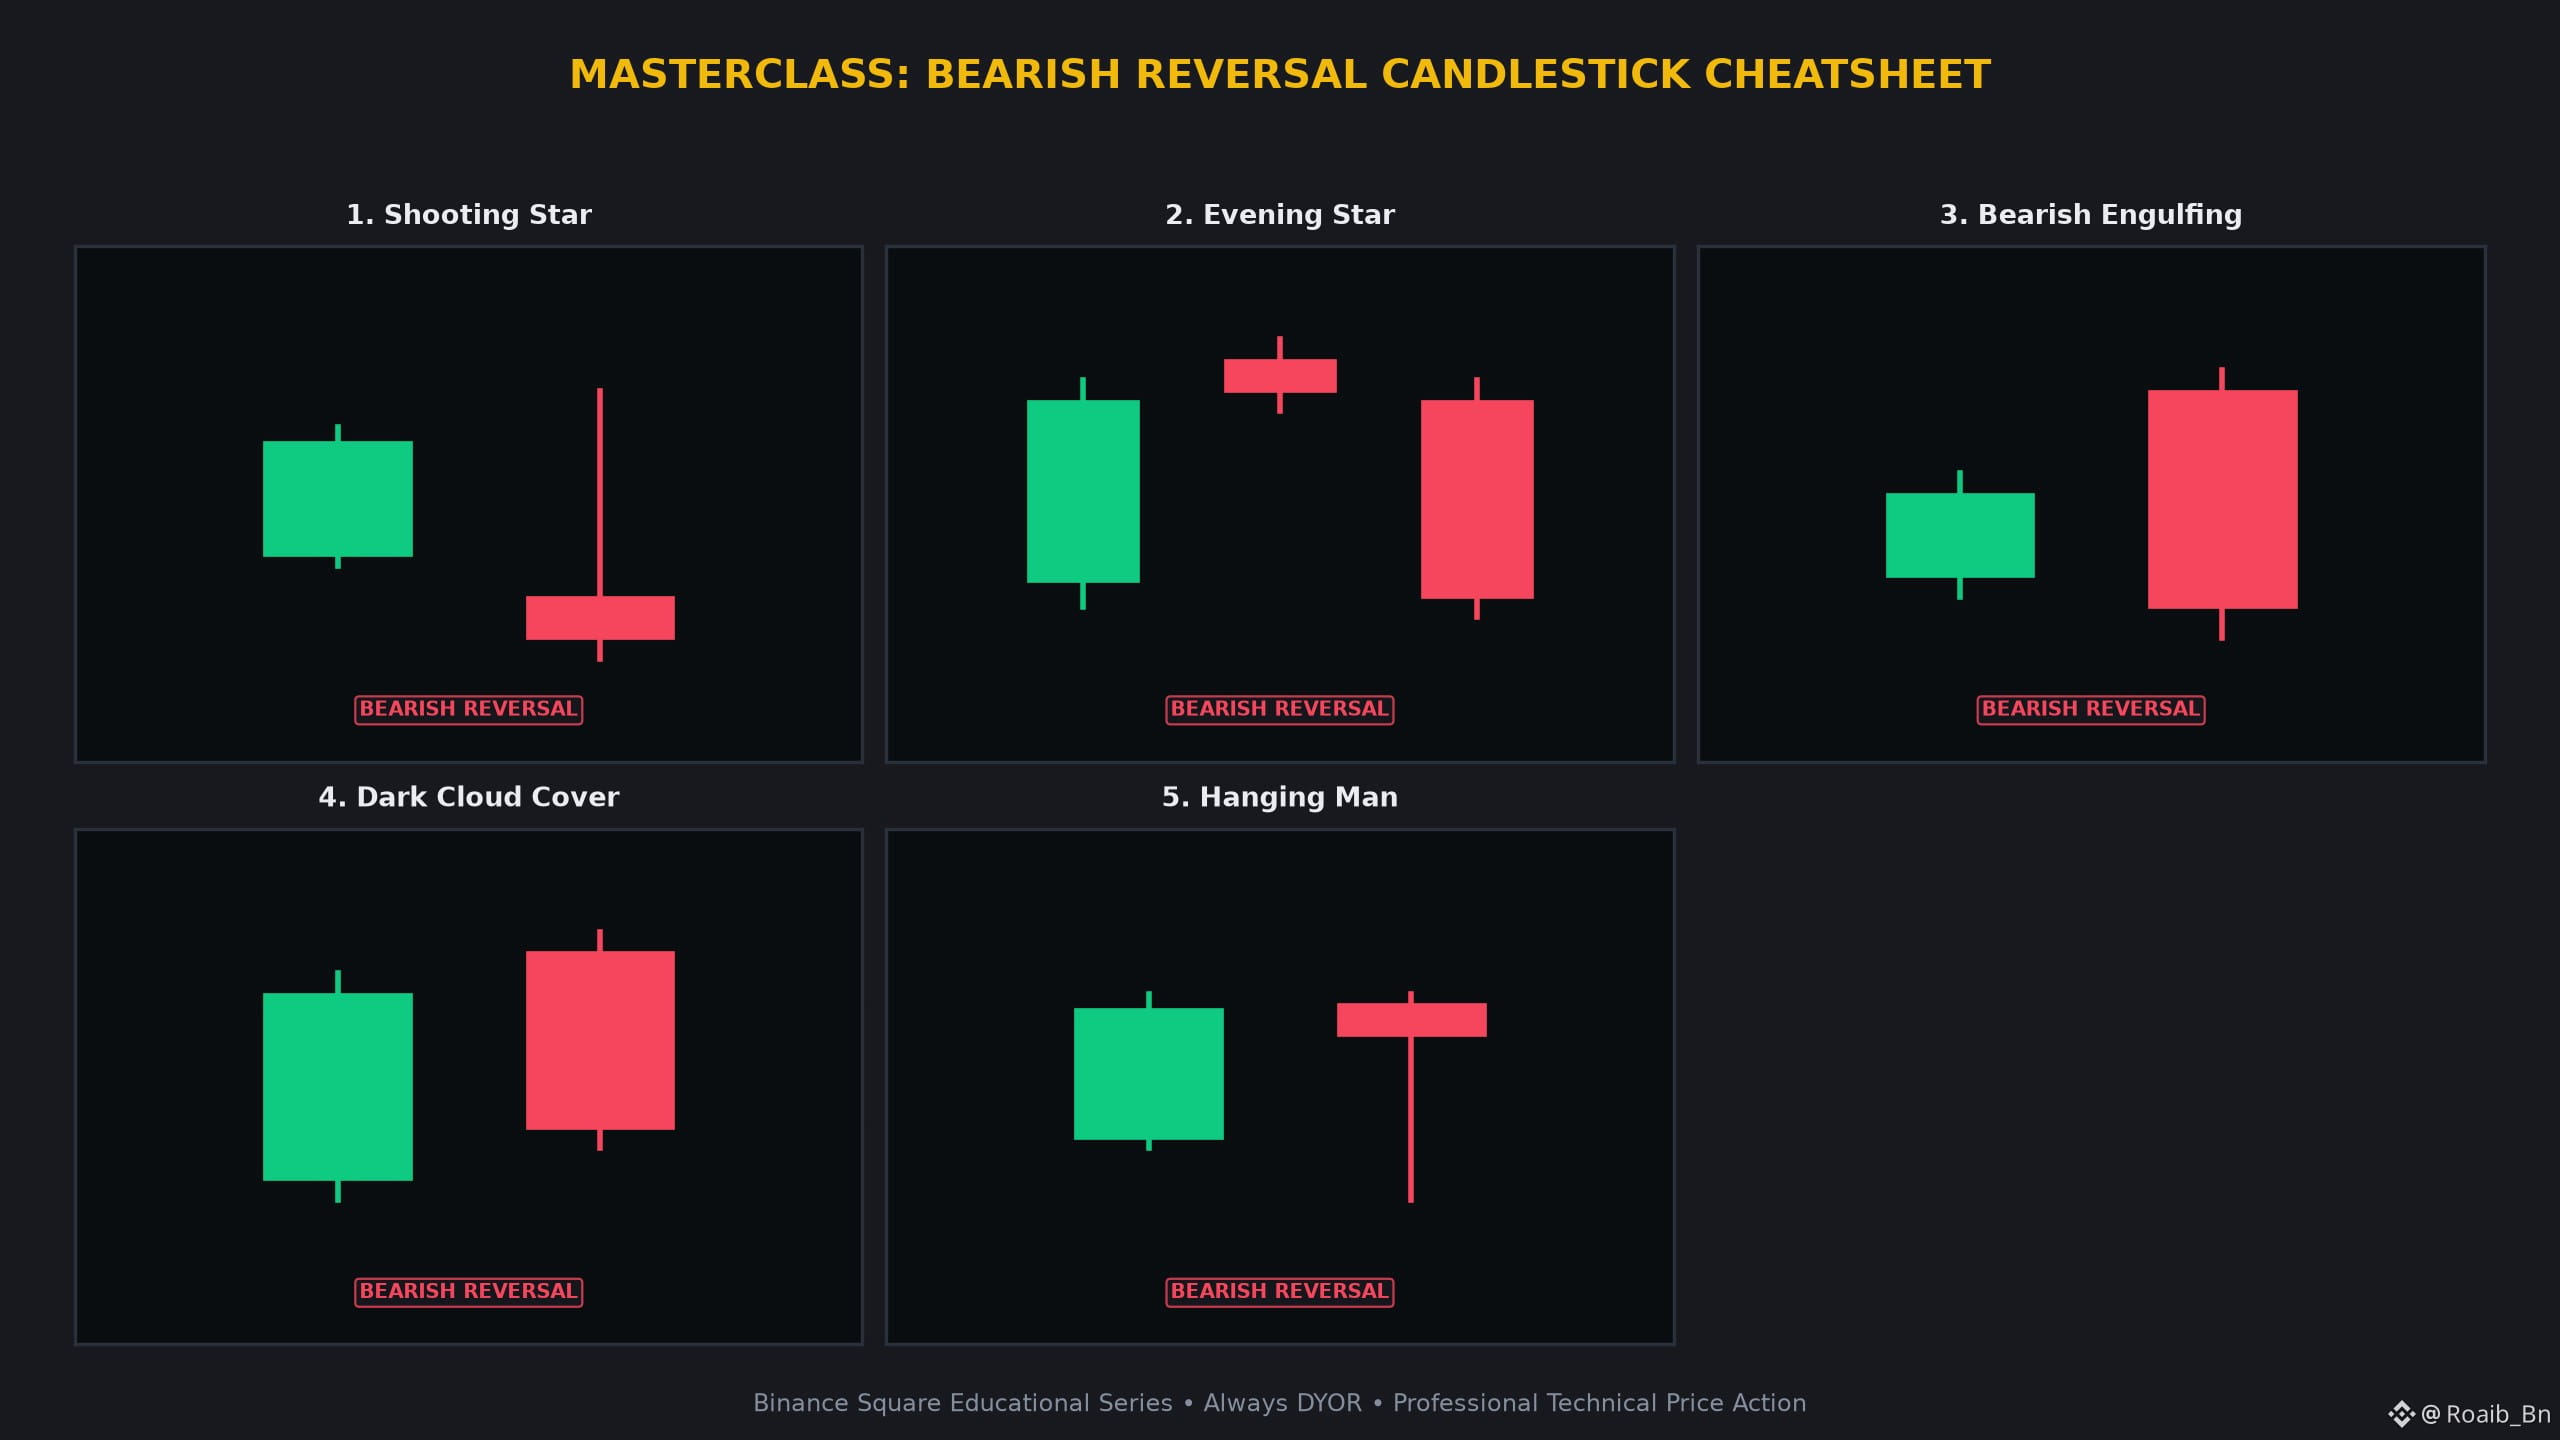
🚨 SPOT THE TOP: 5 CRITICAL BEARISH CANDLESTICK PATTERNS EVERY TRADER MUST KNOW 👇🚨 SPOT THE TOP: 5 CRITICAL BEARISH CANDLESTICK PATTERNS EVERY TRADER MUST KNOW 👇
Mastering candlestick price action allows traders to decode market psychology and institutional order flow. Below is your comprehensive breakdown of these high-probability candlestick setups.
1️⃣ Shooting Star 🌠
• Structure: Small body at the bottom with a long upper wick testing overhead resistance.
• Psychology: Bulls drove price up, but encountered massive sell wall and got trapped.
• Confluence Trigger: Watch for volume expansion on the confirmation candle. Setup is invalidated if price breaches the opposing wick boundary.
---
2️⃣ Evening Star 🌙
• Structure: Tall green candle, small hesitation star at top, then a steep red plunge.
• Psychology: Buyer exhaustion at peak valuation followed by sudden wave of take-profit orders.
• Confluence Trigger: Watch for volume expansion on the confirmation candle. Setup is invalidated if price breaches the opposing wick boundary.
---
3️⃣ Bearish Engulfing 🐻
• Structure: A small green candle completely engulfed by a large red candle body.
• Psychology: Bulls attempted higher prices but aggressive sellers wiped out all prior gains.
• Confluence Trigger: Watch for volume expansion on the confirmation candle. Setup is invalidated if price breaches the opposing wick boundary.
---
4️⃣ Dark Cloud Cover ☁️
• Structure: Green candle followed by red opening higher but closing below the 50% midpoint.
• Psychology: Gap-up was sold into heavily, showing strong overhead supply.
• Confluence Trigger: Watch for volume expansion on the confirmation candle. Setup is invalidated if price breaches the opposing wick boundary.
---
5️⃣ Hanging Man ⚠️
• Structure: Small body at top with long lower shadow appearing at the peak of an uptrend.
• Psychology: First sign of sharp intraday liquidation; warning that trend momentum is fragile.
• Confluence Trigger: Watch for volume expansion on the confirmation candle. Setup is invalidated if price breaches the opposing wick boundary.
---
💡 Core Trader Takeaways:
• Candlestick patterns gain highest predictive accuracy when aligning with macro support/resistance floors and EMA dynamic trend lines.
• Avoid trading isolated candles in low-volume consolidation—always wait for the confirmation bar close.
• Maintain strict stop-loss discipline to protect capital.
💬 Community Discussion:
Which of these 5 candlestick formations do you rely on the most when analyzing Bitcoin or altcoins? Drop your thoughts below! 👇
⚠️ Educational Disclaimer:
This breakdown is for educational purposes only and does not constitute financial advice (NFA). Crypto trading carries substantial risk. Always do your own research (DYOR).
$BTC $ETH #CryptoTrading #CandlestickPatterns #BinanceSquare #TechnicalAnalysis
🚨 SPOT THE TOP: 5 CRITICAL BEARISH CANDLESTICK PATTERNS EVERY TRADER MUST KNOW 👇
🚨 SPOT THE TOP: 5 CRITICAL BEARISH CANDLESTICK PATTERNS EVERY TRADER MUST KNOW 👇
Mastering candlestick price action allows traders to decode market psychology and institutional order flow. Below is your comprehensive breakdown of these high-probability candlestick setups.
1️⃣ Shooting Star 🌠
• Structure: Small body at the bottom with a long upper wick testing overhead resistance.
• Psychology: Bulls drove price up, but encountered massive sell wall and got trapped.
• Confluence Trigger: Watch for volume expansion on the confirmation candle. Setup is invalidated if price breaches the opposing wick boundary.
---
2️⃣ Evening Star 🌙
• Structure: Tall green candle, small hesitation star at top, then a steep red plunge.
• Psychology: Buyer exhaustion at peak valuation followed by sudden wave of take-profit orders.
• Confluence Trigger: Watch for volume expansion on the confirmation candle. Setup is invalidated if price breaches the opposing wick boundary.
---
3️⃣ Bearish Engulfing 🐻
• Structure: A small green candle completely engulfed by a large red candle body.
• Psychology: Bulls attempted higher prices but aggressive sellers wiped out all prior gains.
• Confluence Trigger: Watch for volume expansion on the confirmation candle. Setup is invalidated if price breaches the opposing wick boundary.
---
4️⃣ Dark Cloud Cover ☁️
• Structure: Green candle followed by red opening higher but closing below the 50% midpoint.
• Psychology: Gap-up was sold into heavily, showing strong overhead supply.
• Confluence Trigger: Watch for volume expansion on the confirmation candle. Setup is invalidated if price breaches the opposing wick boundary.
---
5️⃣ Hanging Man ⚠️
• Structure: Small body at top with long lower shadow appearing at the peak of an uptrend.
• Psychology: First sign of sharp intraday liquidation; warning that trend momentum is fragile.
• Confluence Trigger: Watch for volume expansion on the confirmation candle. Setup is invalidated if price breaches the opposing wick boundary.
---
💡 Core Trader Takeaways:
• Candlestick patterns gain highest predictive accuracy when aligning with macro support/resistance floors and EMA dynamic trend lines.
• Avoid trading isolated candles in low-volume consolidation—always wait for the confirmation bar close.
• Maintain strict stop-loss discipline to protect capital.
💬 Community Discussion:
Which of these 5 candlestick formations do you rely on the most when analyzing Bitcoin or altcoins? Drop your thoughts below! 👇
⚠️ Educational Disclaimer:
This breakdown is for educational purposes only and does not constitute financial advice (NFA). Crypto trading carries substantial risk. Always do your own research (DYOR).
$BTC $ETH #CryptoTrading #CandlestickPatterns #BinanceSquare #TechnicalAnalysis
Mastering candlestick price action allows traders to decode market psychology and institutional order flow. Below is your comprehensive breakdown of these high-probability candlestick setups.
1️⃣ Shooting Star 🌠
• Structure: Small body at the bottom with a long upper wick testing overhead resistance.
• Psychology: Bulls drove price up, but encountered massive sell wall and got trapped.
• Confluence Trigger: Watch for volume expansion on the confirmation candle. Setup is invalidated if price breaches the opposing wick boundary.
---
2️⃣ Evening Star 🌙
• Structure: Tall green candle, small hesitation star at top, then a steep red plunge.
• Psychology: Buyer exhaustion at peak valuation followed by sudden wave of take-profit orders.
• Confluence Trigger: Watch for volume expansion on the confirmation candle. Setup is invalidated if price breaches the opposing wick boundary.
---
3️⃣ Bearish Engulfing 🐻
• Structure: A small green candle completely engulfed by a large red candle body.
• Psychology: Bulls attempted higher prices but aggressive sellers wiped out all prior gains.
• Confluence Trigger: Watch for volume expansion on the confirmation candle. Setup is invalidated if price breaches the opposing wick boundary.
---
4️⃣ Dark Cloud Cover ☁️
• Structure: Green candle followed by red opening higher but closing below the 50% midpoint.
• Psychology: Gap-up was sold into heavily, showing strong overhead supply.
• Confluence Trigger: Watch for volume expansion on the confirmation candle. Setup is invalidated if price breaches the opposing wick boundary.
---
5️⃣ Hanging Man ⚠️
• Structure: Small body at top with long lower shadow appearing at the peak of an uptrend.
• Psychology: First sign of sharp intraday liquidation; warning that trend momentum is fragile.
• Confluence Trigger: Watch for volume expansion on the confirmation candle. Setup is invalidated if price breaches the opposing wick boundary.
---
💡 Core Trader Takeaways:
• Candlestick patterns gain highest predictive accuracy when aligning with macro support/resistance floors and EMA dynamic trend lines.
• Avoid trading isolated candles in low-volume consolidation—always wait for the confirmation bar close.
• Maintain strict stop-loss discipline to protect capital.
💬 Community Discussion:
Which of these 5 candlestick formations do you rely on the most when analyzing Bitcoin or altcoins? Drop your thoughts below! 👇
⚠️ Educational Disclaimer:
This breakdown is for educational purposes only and does not constitute financial advice (NFA). Crypto trading carries substantial risk. Always do your own research (DYOR).
$BTC $ETH #CryptoTrading #CandlestickPatterns #BinanceSquare #TechnicalAnalysis
113

·
--
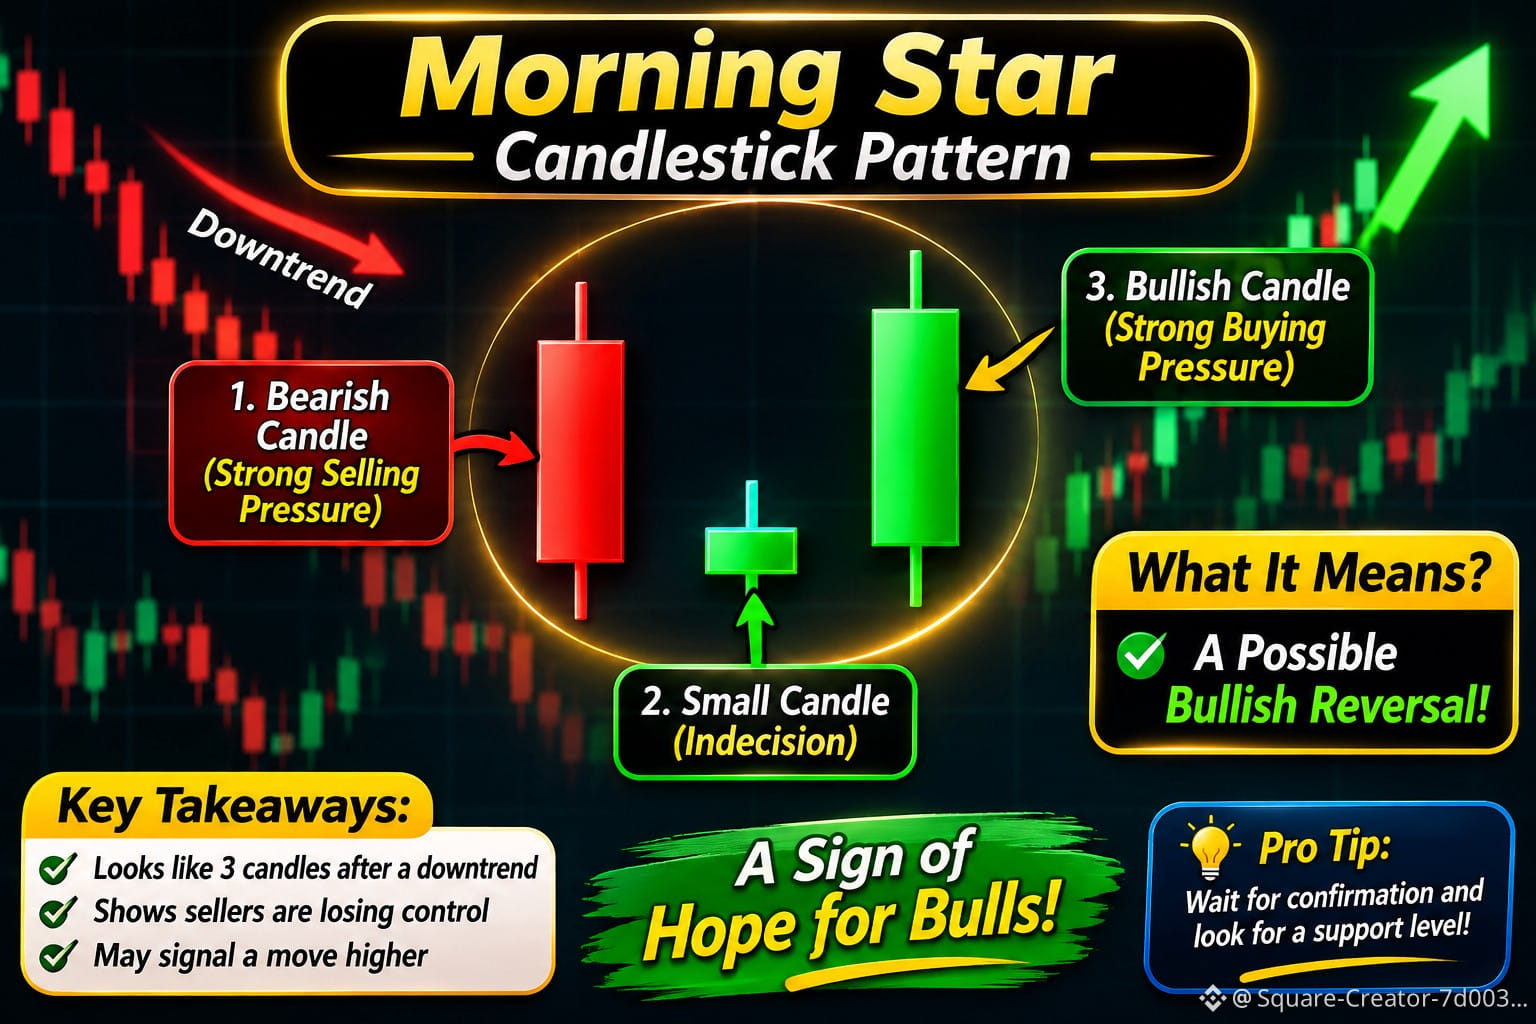
🌅 MORNING STAR CANDLESTICK PATTERN – A Sign of a Possible Bullish Reversal!
Have you ever seen three candles that could signal a change in market direction? Let's learn about the Morning Star! 📈
🔹 What Is the Morning Star?
The Morning Star is a bullish reversal candlestick pattern that usually appears at the end of a downtrend. It may indicate that selling pressure is weakening and buyers are starting to take control.
🔹 How Does It Look?
The pattern consists of THREE candles:
1️⃣ First Candle: A large bearish (red) candle showing strong selling pressure.
2️⃣ Second Candle: A small-bodied candle (green or red) showing market indecision and a possible slowdown in selling pressure.
3️⃣ Third Candle: A strong bullish (green) candle that closes well into the body of the first bearish candle.
🔹 What Does It Tell Us?
The Morning Star may indicate:
Sellers are losing momentum.
Buyers are becoming stronger.
A possible bullish reversal is developing.
Market sentiment may be changing from bearish to bullish.
🔹 How Can Traders Use It?
✅ Look for the pattern near a support level. ✅ Wait for the third candle to close before considering confirmation. ✅ Check trading volume for additional confirmation. ✅ Always use stop-loss and proper risk management.
⚠️ Important: No candlestick pattern guarantees a market reversal. Always combine candlestick analysis with other technical indicators and risk management.
💬 Question: Have you ever used the Morning Star pattern in your trading?
#Crypto #TradingCommunity #CandlestickPatterns #MorningStar #TechnicalAnalysisPost #BinanceSquare $SPCXB
{spot}(SPCXBUSDT)
$BTC
🌅 MORNING STAR CANDLESTICK PATTERN – A Sign of a Possible Bullish Reversal!
Have you ever seen three candles that could signal a change in market direction? Let's learn about the Morning Star! 📈
🔹 What Is the Morning Star?
The Morning Star is a bullish reversal candlestick pattern that usually appears at the end of a downtrend. It may indicate that selling pressure is weakening and buyers are starting to take control.
🔹 How Does It Look?
The pattern consists of THREE candles:
1️⃣ First Candle: A large bearish (red) candle showing strong selling pressure.
2️⃣ Second Candle: A small-bodied candle (green or red) showing market indecision and a possible slowdown in selling pressure.
3️⃣ Third Candle: A strong bullish (green) candle that closes well into the body of the first bearish candle.
🔹 What Does It Tell Us?
The Morning Star may indicate:
Sellers are losing momentum.
Buyers are becoming stronger.
A possible bullish reversal is developing.
Market sentiment may be changing from bearish to bullish.
🔹 How Can Traders Use It?
✅ Look for the pattern near a support level. ✅ Wait for the third candle to close before considering confirmation. ✅ Check trading volume for additional confirmation. ✅ Always use stop-loss and proper risk management.
⚠️ Important: No candlestick pattern guarantees a market reversal. Always combine candlestick analysis with other technical indicators and risk management.
💬 Question: Have you ever used the Morning Star pattern in your trading?
#Crypto #TradingCommunity #CandlestickPatterns #MorningStar #TechnicalAnalysisPost #BinanceSquare $SPCXB
$BTC
Have you ever seen three candles that could signal a change in market direction? Let's learn about the Morning Star! 📈
🔹 What Is the Morning Star?
The Morning Star is a bullish reversal candlestick pattern that usually appears at the end of a downtrend. It may indicate that selling pressure is weakening and buyers are starting to take control.
🔹 How Does It Look?
The pattern consists of THREE candles:
1️⃣ First Candle: A large bearish (red) candle showing strong selling pressure.
2️⃣ Second Candle: A small-bodied candle (green or red) showing market indecision and a possible slowdown in selling pressure.
3️⃣ Third Candle: A strong bullish (green) candle that closes well into the body of the first bearish candle.
🔹 What Does It Tell Us?
The Morning Star may indicate:
Sellers are losing momentum.
Buyers are becoming stronger.
A possible bullish reversal is developing.
Market sentiment may be changing from bearish to bullish.
🔹 How Can Traders Use It?
✅ Look for the pattern near a support level. ✅ Wait for the third candle to close before considering confirmation. ✅ Check trading volume for additional confirmation. ✅ Always use stop-loss and proper risk management.
⚠️ Important: No candlestick pattern guarantees a market reversal. Always combine candlestick analysis with other technical indicators and risk management.
💬 Question: Have you ever used the Morning Star pattern in your trading?
#Crypto #TradingCommunity #CandlestickPatterns #MorningStar #TechnicalAnalysisPost #BinanceSquare $SPCXB
$BTC
1
131

·
--
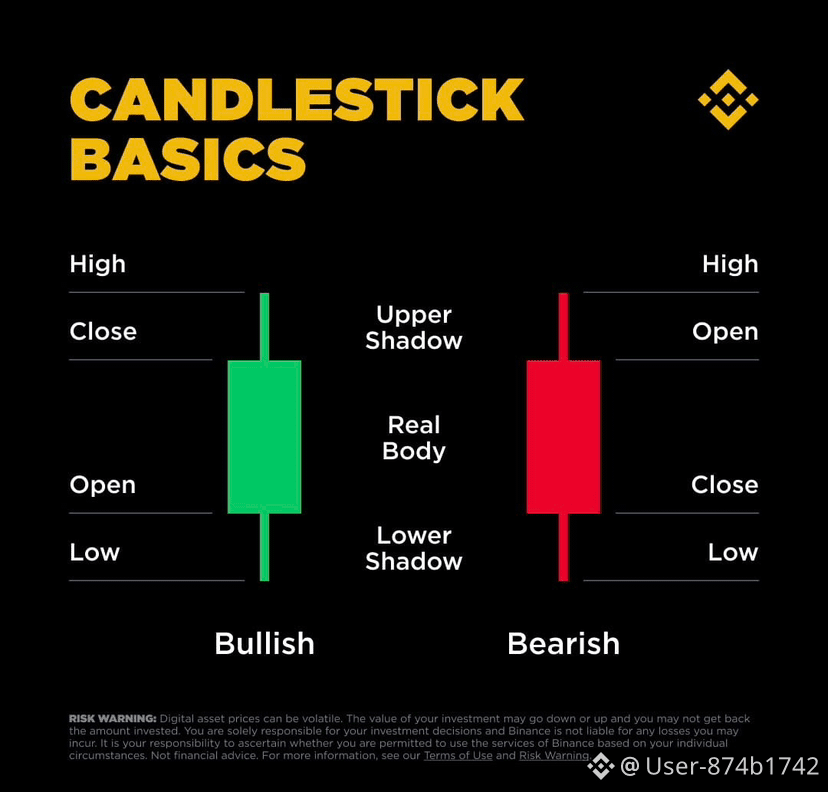
Candlestick anatomy is key to understanding trading charts. A candlestick has four parts: open, high, low and close. The body shows the open and close, while the wicks show the high and low. For example, if $BTC is sitting at 30000, a candlestick with a long upper wick may indicate resistance. Traders use this information to analyze market sentiment. In a bull market, $ETH may be at 2000 with a series of higher highs and higher lows. Advanced traders look for patterns like hammer and engulfing candles to inform their strategies. Understanding candlestick anatomy can help traders make informed decisions. Trading strategies require practice and patience. tradingstrategies #candlestickpatterns #technicalanalysis
Candlestick anatomy is key to understanding trading charts. A candlestick has four parts: open, high, low and close. The body shows the open and close, while the wicks show the high and low. For example, if $BTC is sitting at 30000, a candlestick with a long upper wick may indicate resistance. Traders use this information to analyze market sentiment. In a bull market, $ETH may be at 2000 with a series of higher highs and higher lows. Advanced traders look for patterns like hammer and engulfing candles to inform their strategies. Understanding candlestick anatomy can help traders make informed decisions. Trading strategies require practice and patience. tradingstrategies #candlestickpatterns #technicalanalysis
1
8

Want to Read Crypto Charts Like a Pro? Start With Candlesticks! 🕯️📊
🟢 Bullish candle: Price closes above its opening price.
🔴 Bearish candle: Price closes below its opening price.
📈 The candle body shows the open and close, while the wicks reveal the period’s high and low.
💡 Pro tip: One candle doesn’t tell the whole story. Combine candlestick patterns with market trends and risk management before making trading decisions.
👇 Your turn: Are you Team Bullish 🟢 or Team Bearish 🔴? Comment below!
#cryptoeducation #CandlestickPatterns #CryptoTips #CryptoTradingInsights
$BTC $BEAMX
Want to Read Crypto Charts Like a Pro? Start With Candlesticks! 🕯️📊
🟢 Bullish candle: Price closes above its opening price.
🔴 Bearish candle: Price closes below its opening price.
📈 The candle body shows the open and close, while the wicks reveal the period’s high and low.
💡 Pro tip: One candle doesn’t tell the whole story. Combine candlestick patterns with market trends and risk management before making trading decisions.
👇 Your turn: Are you Team Bullish 🟢 or Team Bearish 🔴? Comment below!
#cryptoeducation #CandlestickPatterns #CryptoTips #CryptoTradingInsights
$BTC $BEAMX
🟢 Bullish candle: Price closes above its opening price.
🔴 Bearish candle: Price closes below its opening price.
📈 The candle body shows the open and close, while the wicks reveal the period’s high and low.
💡 Pro tip: One candle doesn’t tell the whole story. Combine candlestick patterns with market trends and risk management before making trading decisions.
👇 Your turn: Are you Team Bullish 🟢 or Team Bearish 🔴? Comment below!
#cryptoeducation #CandlestickPatterns #CryptoTips #CryptoTradingInsights
$BTC $BEAMX
1
297
·
--
The Sunday Blueprint: Mastering BNB Price Action Anatomy
While the rest of the market is chasing noise on the lower timeframes, I am spending my Saturday evening looking at the structural integrity of $BNB. With the spot price hovering around 713.5, the weekend thinness acts as a magnifying glass for institutional footprints. When you look at a candle, you aren't just looking at a price; you are looking at a battle between supply and demand.
A long wick rejection on the 4H timeframe tells us that whales are stepping in to absorb sell-side liquidity, whereas a full-bodied candle indicates high conviction. This leads us directly into Smart Money Concepts. For BNB, I often look for Fair Value Gaps—those literal holes in the price action where the market moved too fast for orders to be filled. These gaps often act like magnets during the weekend lull as the algorithm seeks to balance the books before the Monday open.
Understanding the difference between a Break of Structure (BOS) and a Market Structure Shift (MSS) is what separates a professional from a retail hobbyist. A BOS confirms the trend is healthy, while an MSS is the first warning sign that the macro trend is exhausting. This ties into the Wyckoff cycle. Are we in a phase of accumulation where BNB is being quietly scooped up by large holders, or is this a distribution phase where tokens are being offloaded to late buyers?
With a circulating supply around 145 million and the deflationary burn mechanism always in play, tokenomics provide a unique floor, but the price action is where the real story is told. Instead of guessing where the price goes next, start studying how the candles interact with historical Order Blocks. These are the zones where the last sell-move happened before a massive buy-up, and they usually hold the most significant buy-side interest.
When you look at the current 4H chart, are you seeing signs of accumulation or distribution?
#TechnicalAnalysis #CandlestickPatterns
The Sunday Blueprint: Mastering BNB Price Action Anatomy
While the rest of the market is chasing noise on the lower timeframes, I am spending my Saturday evening looking at the structural integrity of $BNB . With the spot price hovering around 713.5, the weekend thinness acts as a magnifying glass for institutional footprints. When you look at a candle, you aren't just looking at a price; you are looking at a battle between supply and demand.
A long wick rejection on the 4H timeframe tells us that whales are stepping in to absorb sell-side liquidity, whereas a full-bodied candle indicates high conviction. This leads us directly into Smart Money Concepts. For BNB, I often look for Fair Value Gaps—those literal holes in the price action where the market moved too fast for orders to be filled. These gaps often act like magnets during the weekend lull as the algorithm seeks to balance the books before the Monday open.
Understanding the difference between a Break of Structure (BOS) and a Market Structure Shift (MSS) is what separates a professional from a retail hobbyist. A BOS confirms the trend is healthy, while an MSS is the first warning sign that the macro trend is exhausting. This ties into the Wyckoff cycle. Are we in a phase of accumulation where BNB is being quietly scooped up by large holders, or is this a distribution phase where tokens are being offloaded to late buyers?
With a circulating supply around 145 million and the deflationary burn mechanism always in play, tokenomics provide a unique floor, but the price action is where the real story is told. Instead of guessing where the price goes next, start studying how the candles interact with historical Order Blocks. These are the zones where the last sell-move happened before a massive buy-up, and they usually hold the most significant buy-side interest.
When you look at the current 4H chart, are you seeing signs of accumulation or distribution?
#TechnicalAnalysis #CandlestickPatterns
While the rest of the market is chasing noise on the lower timeframes, I am spending my Saturday evening looking at the structural integrity of $BNB . With the spot price hovering around 713.5, the weekend thinness acts as a magnifying glass for institutional footprints. When you look at a candle, you aren't just looking at a price; you are looking at a battle between supply and demand.
A long wick rejection on the 4H timeframe tells us that whales are stepping in to absorb sell-side liquidity, whereas a full-bodied candle indicates high conviction. This leads us directly into Smart Money Concepts. For BNB, I often look for Fair Value Gaps—those literal holes in the price action where the market moved too fast for orders to be filled. These gaps often act like magnets during the weekend lull as the algorithm seeks to balance the books before the Monday open.
Understanding the difference between a Break of Structure (BOS) and a Market Structure Shift (MSS) is what separates a professional from a retail hobbyist. A BOS confirms the trend is healthy, while an MSS is the first warning sign that the macro trend is exhausting. This ties into the Wyckoff cycle. Are we in a phase of accumulation where BNB is being quietly scooped up by large holders, or is this a distribution phase where tokens are being offloaded to late buyers?
With a circulating supply around 145 million and the deflationary burn mechanism always in play, tokenomics provide a unique floor, but the price action is where the real story is told. Instead of guessing where the price goes next, start studying how the candles interact with historical Order Blocks. These are the zones where the last sell-move happened before a massive buy-up, and they usually hold the most significant buy-side interest.
When you look at the current 4H chart, are you seeing signs of accumulation or distribution?
#TechnicalAnalysis #CandlestickPatterns
1
4
·
--
Sunday is for sharpening the tools, not chasing random chart noise while spot liquidity stays tight and BTC dominance keeps altcoins compressed. With $SOL hovering near 101.93 against a circulating float of roughly 474 million tokens, it is a textbook asset for dissecting how institutional footprints actually look on a chart before the Monday open.
Let us break down the mechanics of price action without any noise. When mapping market structure, a clean Break of Structure confirms a shift in momentum when price invalidates a previous pivot. Smart money leaves distinct architectural clues behind, and spotting them separates reactive retail traders from proactive researchers.
Candlestick anatomy tells the real story of supply and demand absorption. A long wick on a pin bar shows aggressive rejection of lower prices, especially when it taps directly into a validated order block. Combine that with fair value gaps, those efficiency imbalances left behind during rapid impulse moves where institutional capital often returns to mitigate risk, and your charting starts to look less like guessing and more like reading a ledger.
Wyckoff accumulation and distribution schemes are currently playing out across multiple timeframes. Spotting how institutional hands absorb retail panic supply tells you everything about who is actually holding the heavy float. It is all about mapping the battlefield where big capital operates rather than staring blindly at the next candle close.
How are you approaching your technical study sessions this weekend while the broader market stays range-bound?
#TechnicalAnalysis #CandlestickPatterns
Sunday is for sharpening the tools, not chasing random chart noise while spot liquidity stays tight and BTC dominance keeps altcoins compressed. With $SOL hovering near 101.93 against a circulating float of roughly 474 million tokens, it is a textbook asset for dissecting how institutional footprints actually look on a chart before the Monday open.
Let us break down the mechanics of price action without any noise. When mapping market structure, a clean Break of Structure confirms a shift in momentum when price invalidates a previous pivot. Smart money leaves distinct architectural clues behind, and spotting them separates reactive retail traders from proactive researchers.
Candlestick anatomy tells the real story of supply and demand absorption. A long wick on a pin bar shows aggressive rejection of lower prices, especially when it taps directly into a validated order block. Combine that with fair value gaps, those efficiency imbalances left behind during rapid impulse moves where institutional capital often returns to mitigate risk, and your charting starts to look less like guessing and more like reading a ledger.
Wyckoff accumulation and distribution schemes are currently playing out across multiple timeframes. Spotting how institutional hands absorb retail panic supply tells you everything about who is actually holding the heavy float. It is all about mapping the battlefield where big capital operates rather than staring blindly at the next candle close.
How are you approaching your technical study sessions this weekend while the broader market stays range-bound?
#TechnicalAnalysis #CandlestickPatterns
Let us break down the mechanics of price action without any noise. When mapping market structure, a clean Break of Structure confirms a shift in momentum when price invalidates a previous pivot. Smart money leaves distinct architectural clues behind, and spotting them separates reactive retail traders from proactive researchers.
Candlestick anatomy tells the real story of supply and demand absorption. A long wick on a pin bar shows aggressive rejection of lower prices, especially when it taps directly into a validated order block. Combine that with fair value gaps, those efficiency imbalances left behind during rapid impulse moves where institutional capital often returns to mitigate risk, and your charting starts to look less like guessing and more like reading a ledger.
Wyckoff accumulation and distribution schemes are currently playing out across multiple timeframes. Spotting how institutional hands absorb retail panic supply tells you everything about who is actually holding the heavy float. It is all about mapping the battlefield where big capital operates rather than staring blindly at the next candle close.
How are you approaching your technical study sessions this weekend while the broader market stays range-bound?
#TechnicalAnalysis #CandlestickPatterns
1
5
·
--
Decoding Ethereum Market Footprints: The Weekend Structural Playbook
Weekend trading across crypto markets is notoriously thin, but the quiet price action hovering near 2387.49 for $ETH offers a clean canvas to study structural footprints before Monday volatility kicks in. When liquidity drops, institutional signatures become far more visible on higher timeframes. Instead of getting caught up in minor fluctuations, focus on candlestick anatomy. A long lower wick paired with a small upper body indicates aggressive supply absorption by larger participants. Patterns like bullish engulfing candles or morning stars lose their retail randomness when they form directly inside an established demand area, signaling a legitimate momentum shift rather than a temporary bounce.
Under Smart Money Concepts, we focus on Fair Value Gaps and institutional order blocks. A Fair Value Gap represents an efficiency imbalance created during rapid market expansion. Price regularly revisits these imbalances to sweep resting liquidity before initiating the next major move. When an efficiency gap aligns perfectly with an unmitigated order block, algorithmic execution points become clearly visible.
Structure is ultimate context. A Break of Structure confirms ongoing trend continuation, while a Market Structure Shift warns that a prior high or low has failed to hold, marking a potential trend reversal. Mapping these structural pivots against Wyckoff accumulation or distribution models helps clarify whether ETH is undergoing institutional re-accumulation or quietly distributing before a deeper macroeconomic reset. Watching tokenomics and circulating float behavior during quiet hours sets up your week far better than chasing Sunday noise.
Are you spotting any distinct order block retests or fair value gap fills on your higher timeframe ETH charts this weekend?
#TechnicalAnalysis #CandlestickPatterns
Decoding Ethereum Market Footprints: The Weekend Structural Playbook
Weekend trading across crypto markets is notoriously thin, but the quiet price action hovering near 2387.49 for $ETH offers a clean canvas to study structural footprints before Monday volatility kicks in. When liquidity drops, institutional signatures become far more visible on higher timeframes. Instead of getting caught up in minor fluctuations, focus on candlestick anatomy. A long lower wick paired with a small upper body indicates aggressive supply absorption by larger participants. Patterns like bullish engulfing candles or morning stars lose their retail randomness when they form directly inside an established demand area, signaling a legitimate momentum shift rather than a temporary bounce.
Under Smart Money Concepts, we focus on Fair Value Gaps and institutional order blocks. A Fair Value Gap represents an efficiency imbalance created during rapid market expansion. Price regularly revisits these imbalances to sweep resting liquidity before initiating the next major move. When an efficiency gap aligns perfectly with an unmitigated order block, algorithmic execution points become clearly visible.
Structure is ultimate context. A Break of Structure confirms ongoing trend continuation, while a Market Structure Shift warns that a prior high or low has failed to hold, marking a potential trend reversal. Mapping these structural pivots against Wyckoff accumulation or distribution models helps clarify whether ETH is undergoing institutional re-accumulation or quietly distributing before a deeper macroeconomic reset. Watching tokenomics and circulating float behavior during quiet hours sets up your week far better than chasing Sunday noise.
Are you spotting any distinct order block retests or fair value gap fills on your higher timeframe ETH charts this weekend?
#TechnicalAnalysis #CandlestickPatterns
Weekend trading across crypto markets is notoriously thin, but the quiet price action hovering near 2387.49 for $ETH offers a clean canvas to study structural footprints before Monday volatility kicks in. When liquidity drops, institutional signatures become far more visible on higher timeframes. Instead of getting caught up in minor fluctuations, focus on candlestick anatomy. A long lower wick paired with a small upper body indicates aggressive supply absorption by larger participants. Patterns like bullish engulfing candles or morning stars lose their retail randomness when they form directly inside an established demand area, signaling a legitimate momentum shift rather than a temporary bounce.
Under Smart Money Concepts, we focus on Fair Value Gaps and institutional order blocks. A Fair Value Gap represents an efficiency imbalance created during rapid market expansion. Price regularly revisits these imbalances to sweep resting liquidity before initiating the next major move. When an efficiency gap aligns perfectly with an unmitigated order block, algorithmic execution points become clearly visible.
Structure is ultimate context. A Break of Structure confirms ongoing trend continuation, while a Market Structure Shift warns that a prior high or low has failed to hold, marking a potential trend reversal. Mapping these structural pivots against Wyckoff accumulation or distribution models helps clarify whether ETH is undergoing institutional re-accumulation or quietly distributing before a deeper macroeconomic reset. Watching tokenomics and circulating float behavior during quiet hours sets up your week far better than chasing Sunday noise.
Are you spotting any distinct order block retests or fair value gap fills on your higher timeframe ETH charts this weekend?
#TechnicalAnalysis #CandlestickPatterns

1
8

·
--
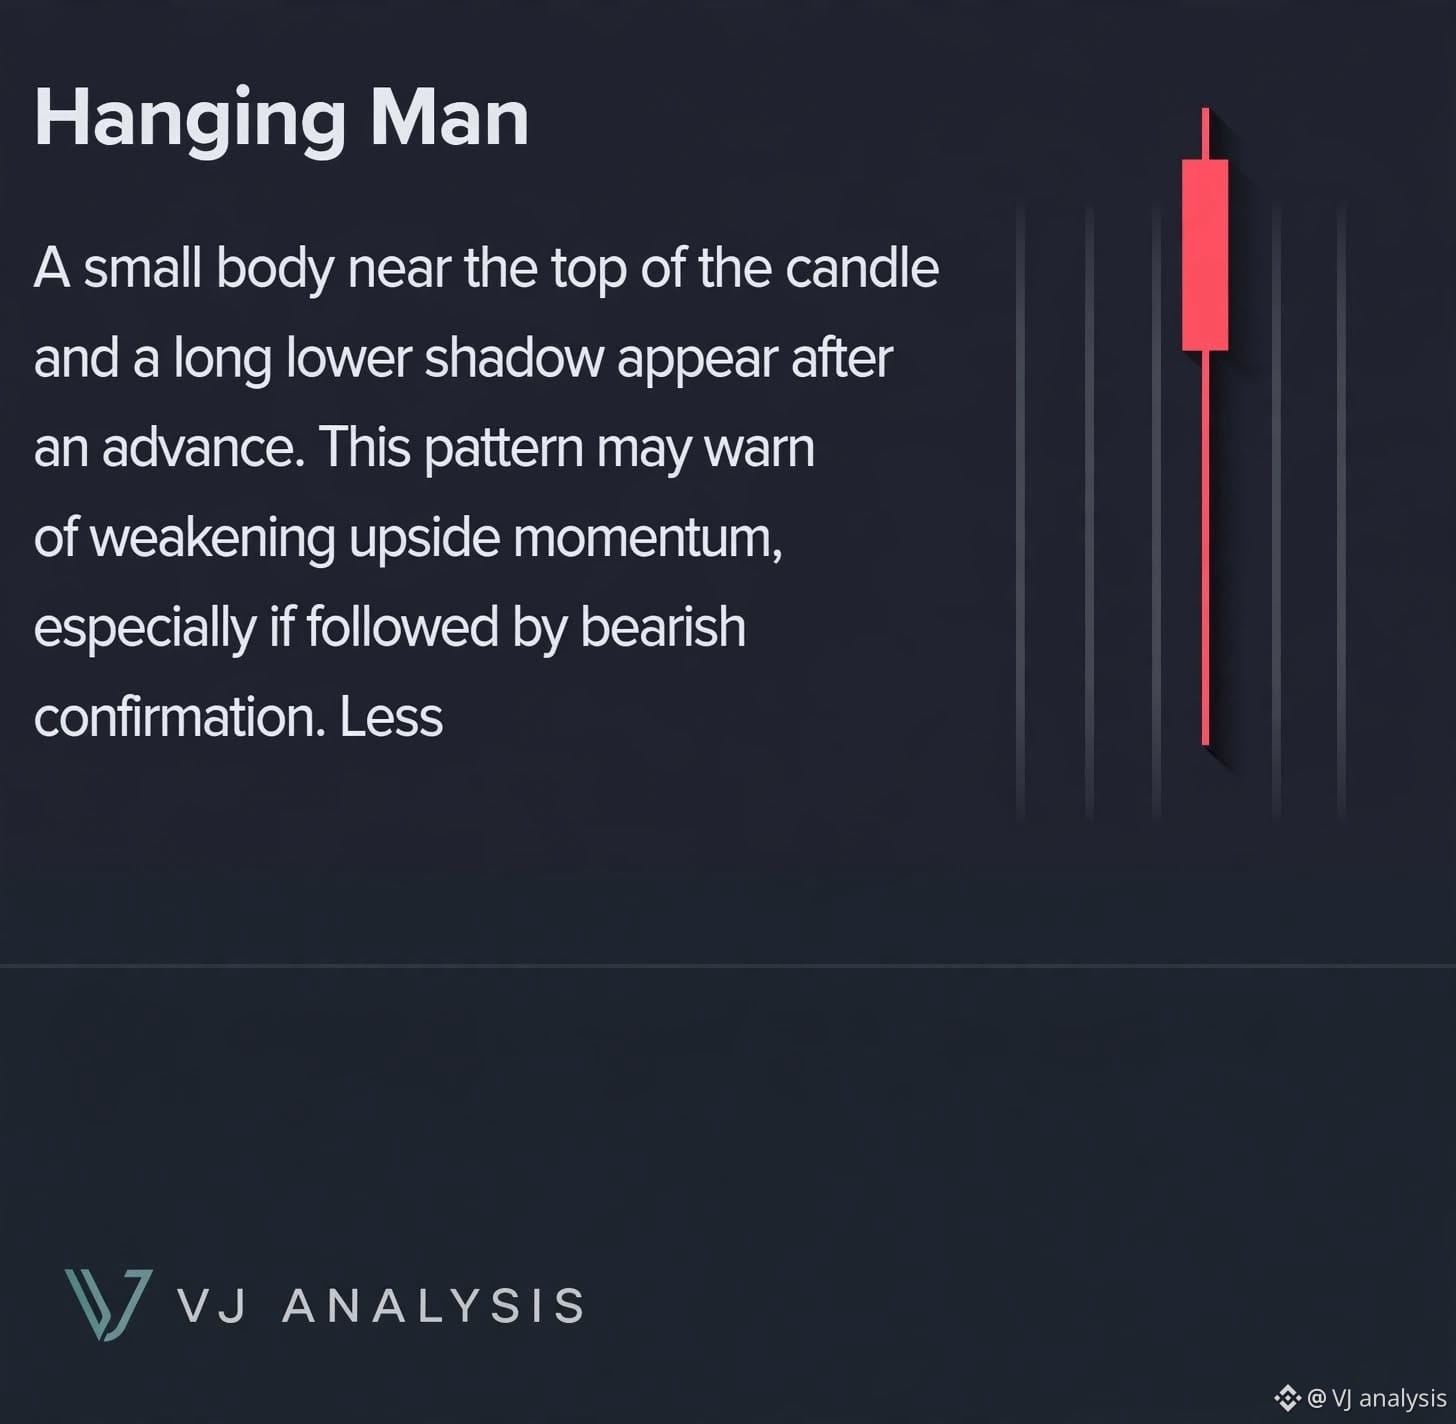
Hanging Man Alert ⚠️
@Square-Creator-905762059
A small body near the top with a long lower shadow appears after an advance. This warns of weakening upside momentum — sellers stepping in.
If followed by bearish confirmation, expect potential reversal. Watch your longs, tighten stops, and wait for confirmation before flipping.
#VJAnalysis #CandlestickPatterns
Hanging Man Alert ⚠️
@VJ analysis
A small body near the top with a long lower shadow appears after an advance. This warns of weakening upside momentum — sellers stepping in.
If followed by bearish confirmation, expect potential reversal. Watch your longs, tighten stops, and wait for confirmation before flipping.
#VJAnalysis #CandlestickPatterns
@VJ analysis
A small body near the top with a long lower shadow appears after an advance. This warns of weakening upside momentum — sellers stepping in.
If followed by bearish confirmation, expect potential reversal. Watch your longs, tighten stops, and wait for confirmation before flipping.
#VJAnalysis #CandlestickPatterns
513

·
--
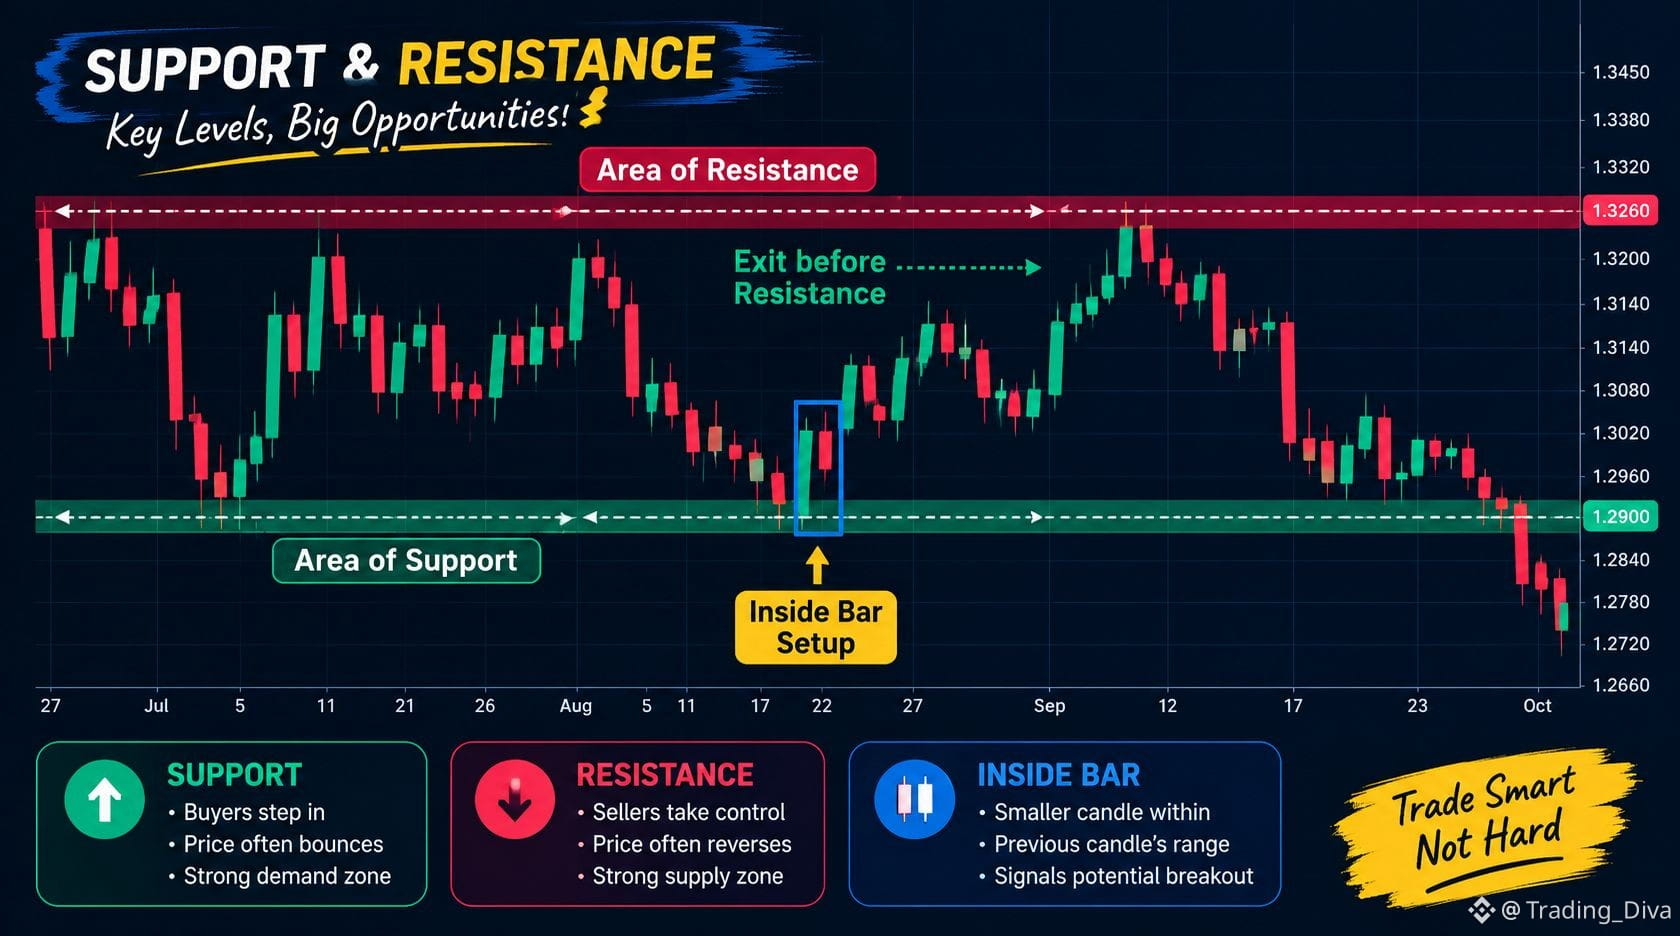
📈 BULLISH INSIDE BAR PATTERN: A POTENTIAL TREND REVERSAL SIGNAL! 🚀
A Bullish Inside Bar is a candlestick pattern that traders watch for signs of a possible shift from bearish momentum to bullish price action.
🔍 How Does It Work?
This setup involves two candlesticks:
🟥 First Candle: A bearish candle that reflects selling pressure.
🟩 Second Candle: A smaller bullish candle that remains within the real body of the previous bearish candle, staying between its opening and closing prices.
📊 What Does It Indicate?
The pattern may suggest that selling pressure is weakening and buyers are beginning to gain strength. However, it does not guarantee a trend reversal.
🎯 Trading Tip:
Wait for price confirmation before entering a trade. Analyze the surrounding market structure, key support and resistance levels, and trading volume where available. Always manage your risk and avoid making decisions based on a single candlestick pattern.
📸 Live Chart Example: Look for a bearish candle followed by a smaller bullish candle forming inside its real body.
💬 Question for Traders: Have you spotted a Bullish Inside Bar on a live chart recently? Share your thoughts below!
#BinanceSquare #CryptoTrading. #CandlestickPatterns #priceaction #TechnicalAnalysis
📈 BULLISH INSIDE BAR PATTERN: A POTENTIAL TREND REVERSAL SIGNAL! 🚀
A Bullish Inside Bar is a candlestick pattern that traders watch for signs of a possible shift from bearish momentum to bullish price action.
🔍 How Does It Work?
This setup involves two candlesticks:
🟥 First Candle: A bearish candle that reflects selling pressure.
🟩 Second Candle: A smaller bullish candle that remains within the real body of the previous bearish candle, staying between its opening and closing prices.
📊 What Does It Indicate?
The pattern may suggest that selling pressure is weakening and buyers are beginning to gain strength. However, it does not guarantee a trend reversal.
🎯 Trading Tip:
Wait for price confirmation before entering a trade. Analyze the surrounding market structure, key support and resistance levels, and trading volume where available. Always manage your risk and avoid making decisions based on a single candlestick pattern.
📸 Live Chart Example: Look for a bearish candle followed by a smaller bullish candle forming inside its real body.
💬 Question for Traders: Have you spotted a Bullish Inside Bar on a live chart recently? Share your thoughts below!
#BinanceSquare #CryptoTrading. #CandlestickPatterns #priceaction #TechnicalAnalysis
A Bullish Inside Bar is a candlestick pattern that traders watch for signs of a possible shift from bearish momentum to bullish price action.
🔍 How Does It Work?
This setup involves two candlesticks:
🟥 First Candle: A bearish candle that reflects selling pressure.
🟩 Second Candle: A smaller bullish candle that remains within the real body of the previous bearish candle, staying between its opening and closing prices.
📊 What Does It Indicate?
The pattern may suggest that selling pressure is weakening and buyers are beginning to gain strength. However, it does not guarantee a trend reversal.
🎯 Trading Tip:
Wait for price confirmation before entering a trade. Analyze the surrounding market structure, key support and resistance levels, and trading volume where available. Always manage your risk and avoid making decisions based on a single candlestick pattern.
📸 Live Chart Example: Look for a bearish candle followed by a smaller bullish candle forming inside its real body.
💬 Question for Traders: Have you spotted a Bullish Inside Bar on a live chart recently? Share your thoughts below!
#BinanceSquare #CryptoTrading. #CandlestickPatterns #priceaction #TechnicalAnalysis
72
·
--
Mastering the Anatomy of $BNB: A Sunday Deep Dive into Market Structure
The weekend provides a rare window to strip away the emotional noise of the weekday charts and focus on the cold, hard mechanics of the ledger. While BNB holds its ground around the 722.44 level, the real story isn't found in the current spot price, but in how the candles interact with the supply zones established by the approximately 147.58 million tokens in circulation. This is the time to analyze the architecture before the Monday volatility returns.
When we look at candle anatomy, the body tells us where the consensus settled, but the wicks reveal where the liquidity was hunted. A long wick rejection on the daily timeframe usually indicates that institutional limit orders are absorbing aggressive selling pressure. I pay close attention to Fair Value Gaps, or FVGs, which act like magnets. These are imbalances where price moved too fast for the market to facilitate two-way trade. Eventually, price tends to return to these zones to seek structural equilibrium.
Moving beyond individual candles, understanding the difference between a Break of Structure and a Market Structure Shift is what separates researchers from gamblers. A clean break confirms the trend, while a shift suggests a reversal is brewing. Right now, the Wyckoff cycle points toward a sophisticated tug-of-war between accumulation and distribution. Large holders are showing a preference for locking assets, likely driven by the consistent deflationary pressure of the quarterly burn mechanics rather than short-term flips.
As we approach the Monday open, I am watching how the price interacts with the most recent order blocks. These zones represent where smart money left its footprint. If the market respects these structural levels, it confirms a solid foundation for the week ahead.
How are you mapping out the liquidity zones on your charts before the weekly close?
_
#TechnicalAnalysis #CandlestickPatterns
Mastering the Anatomy of $BNB : A Sunday Deep Dive into Market Structure
The weekend provides a rare window to strip away the emotional noise of the weekday charts and focus on the cold, hard mechanics of the ledger. While BNB holds its ground around the 722.44 level, the real story isn't found in the current spot price, but in how the candles interact with the supply zones established by the approximately 147.58 million tokens in circulation. This is the time to analyze the architecture before the Monday volatility returns.
When we look at candle anatomy, the body tells us where the consensus settled, but the wicks reveal where the liquidity was hunted. A long wick rejection on the daily timeframe usually indicates that institutional limit orders are absorbing aggressive selling pressure. I pay close attention to Fair Value Gaps, or FVGs, which act like magnets. These are imbalances where price moved too fast for the market to facilitate two-way trade. Eventually, price tends to return to these zones to seek structural equilibrium.
Moving beyond individual candles, understanding the difference between a Break of Structure and a Market Structure Shift is what separates researchers from gamblers. A clean break confirms the trend, while a shift suggests a reversal is brewing. Right now, the Wyckoff cycle points toward a sophisticated tug-of-war between accumulation and distribution. Large holders are showing a preference for locking assets, likely driven by the consistent deflationary pressure of the quarterly burn mechanics rather than short-term flips.
As we approach the Monday open, I am watching how the price interacts with the most recent order blocks. These zones represent where smart money left its footprint. If the market respects these structural levels, it confirms a solid foundation for the week ahead.
How are you mapping out the liquidity zones on your charts before the weekly close?
_
#TechnicalAnalysis #CandlestickPatterns
The weekend provides a rare window to strip away the emotional noise of the weekday charts and focus on the cold, hard mechanics of the ledger. While BNB holds its ground around the 722.44 level, the real story isn't found in the current spot price, but in how the candles interact with the supply zones established by the approximately 147.58 million tokens in circulation. This is the time to analyze the architecture before the Monday volatility returns.
When we look at candle anatomy, the body tells us where the consensus settled, but the wicks reveal where the liquidity was hunted. A long wick rejection on the daily timeframe usually indicates that institutional limit orders are absorbing aggressive selling pressure. I pay close attention to Fair Value Gaps, or FVGs, which act like magnets. These are imbalances where price moved too fast for the market to facilitate two-way trade. Eventually, price tends to return to these zones to seek structural equilibrium.
Moving beyond individual candles, understanding the difference between a Break of Structure and a Market Structure Shift is what separates researchers from gamblers. A clean break confirms the trend, while a shift suggests a reversal is brewing. Right now, the Wyckoff cycle points toward a sophisticated tug-of-war between accumulation and distribution. Large holders are showing a preference for locking assets, likely driven by the consistent deflationary pressure of the quarterly burn mechanics rather than short-term flips.
As we approach the Monday open, I am watching how the price interacts with the most recent order blocks. These zones represent where smart money left its footprint. If the market respects these structural levels, it confirms a solid foundation for the week ahead.
How are you mapping out the liquidity zones on your charts before the weekly close?
_
#TechnicalAnalysis #CandlestickPatterns

1
14
·
--
The Sunday Liquidity Playbook: Decoding BTC Price Action and Smart Money Concepts Before Monday
Sunday morning hours present the ideal window to evaluate raw market structure before institutional algorithms reactivate for the weekly open. With $BTC floating near 81507.32, current price action demonstrates a classic consolidation phase where reading structural intent matters far more than tracking short-term noise.
Understanding price action begins with candlestick anatomy. A small body with an extended lower wick on daily charts signals aggressive seller absorption at key support zones. These wicks frequently sweep liquidity resting beneath high-volume areas, effectively validating historical Order Blocks where institutional order flow resides. When price leaves behind an unfilled Fair Value Gap right above an established Order Block, the market naturally gravitates back toward that inefficient zone to restore balance before continuing its primary trend.
Mapping macro bias requires tracking structural shifts using Wyckoff principles. A Break of Structure confirms trend continuation as price closes past prior swing highs with strong momentum. However, if price fails to form higher highs following a Break of Structure, a Market Structure Shift often signals an impending transition from re-accumulation into a local distribution scheme.
Tokenomics quietly reinforce these technical setups. Despite Bitcoin having nearly its full circulating float active in the market, restricted exchange supply and long-term holder retention dictate how deep those wicks sweep local lows during weekend washouts. Institutions analyze monthly volume profiles and fair value nodes rather than reacting to minor intraday fluctuations.
Mastering these foundational mechanics ensures you remain aligned with smart money positioning when global markets reopen.
Which technical pattern do you find yourself relying on the most when reading messy weekend price action?
#TechnicalAnalysis #CandlestickPatterns
The Sunday Liquidity Playbook: Decoding BTC Price Action and Smart Money Concepts Before Monday
Sunday morning hours present the ideal window to evaluate raw market structure before institutional algorithms reactivate for the weekly open. With $BTC floating near 81507.32, current price action demonstrates a classic consolidation phase where reading structural intent matters far more than tracking short-term noise.
Understanding price action begins with candlestick anatomy. A small body with an extended lower wick on daily charts signals aggressive seller absorption at key support zones. These wicks frequently sweep liquidity resting beneath high-volume areas, effectively validating historical Order Blocks where institutional order flow resides. When price leaves behind an unfilled Fair Value Gap right above an established Order Block, the market naturally gravitates back toward that inefficient zone to restore balance before continuing its primary trend.
Mapping macro bias requires tracking structural shifts using Wyckoff principles. A Break of Structure confirms trend continuation as price closes past prior swing highs with strong momentum. However, if price fails to form higher highs following a Break of Structure, a Market Structure Shift often signals an impending transition from re-accumulation into a local distribution scheme.
Tokenomics quietly reinforce these technical setups. Despite Bitcoin having nearly its full circulating float active in the market, restricted exchange supply and long-term holder retention dictate how deep those wicks sweep local lows during weekend washouts. Institutions analyze monthly volume profiles and fair value nodes rather than reacting to minor intraday fluctuations.
Mastering these foundational mechanics ensures you remain aligned with smart money positioning when global markets reopen.
Which technical pattern do you find yourself relying on the most when reading messy weekend price action?
#TechnicalAnalysis #CandlestickPatterns
Sunday morning hours present the ideal window to evaluate raw market structure before institutional algorithms reactivate for the weekly open. With $BTC floating near 81507.32, current price action demonstrates a classic consolidation phase where reading structural intent matters far more than tracking short-term noise.
Understanding price action begins with candlestick anatomy. A small body with an extended lower wick on daily charts signals aggressive seller absorption at key support zones. These wicks frequently sweep liquidity resting beneath high-volume areas, effectively validating historical Order Blocks where institutional order flow resides. When price leaves behind an unfilled Fair Value Gap right above an established Order Block, the market naturally gravitates back toward that inefficient zone to restore balance before continuing its primary trend.
Mapping macro bias requires tracking structural shifts using Wyckoff principles. A Break of Structure confirms trend continuation as price closes past prior swing highs with strong momentum. However, if price fails to form higher highs following a Break of Structure, a Market Structure Shift often signals an impending transition from re-accumulation into a local distribution scheme.
Tokenomics quietly reinforce these technical setups. Despite Bitcoin having nearly its full circulating float active in the market, restricted exchange supply and long-term holder retention dictate how deep those wicks sweep local lows during weekend washouts. Institutions analyze monthly volume profiles and fair value nodes rather than reacting to minor intraday fluctuations.
Mastering these foundational mechanics ensures you remain aligned with smart money positioning when global markets reopen.
Which technical pattern do you find yourself relying on the most when reading messy weekend price action?
#TechnicalAnalysis #CandlestickPatterns
1
59
·
--
The Sunday Order Book Playbook: Reading BNB's Price Action Before Monday Open
When liquidity thins out over the weekend, chart movements become surprisingly pure. With $BNB floating near 722.74, spot trading volume drops, giving us a clean lens to examine mechanical price action before traditional global markets react on Monday.
Understanding candlestick anatomy is the foundation of institutional tape reading. A long wick rejection is rarely a random event; it reflects a targeted liquidity sweep by market makers filling large counter-party orders. When these rejections align with an established Order Block, you are observing zones where institutional interest previously triggered aggressive moves. Parallel to this, Fair Value Gaps mark sudden structural imbalances where one-sided aggressive buying or selling left inefficient voids. Price naturally gravitates back to these gaps to complete unfinished auctions.
Tracking structural transitions requires separating noise from true shifts. A Break of Structure confirms continuation along the prevailing direction, whereas a Market Structure Shift signals potential exhaustion when price fails to record a new swing high and instead pierces a vital swing low. Applying this to BNB through a Wyckoff framework provides valuable perspective. Given its circulating supply of roughly 147.5 million tokens, moving price requires heavy capital absorption. During low-volume weekend sessions, sideways ranges often reveal whether large float is being steadily absorbed by smart money or quietly distributed into passive bids.
Studying historical structure always beats chasing real-time noise. By mastering these core price action principles, you prepare yourself to read the tape rather than react emotionally when Monday volatility arrives. Which price action setup do you trust the most when mapping out your weekly chart preparation?
#TechnicalAnalysis #CandlestickPatterns
The Sunday Order Book Playbook: Reading BNB's Price Action Before Monday Open
When liquidity thins out over the weekend, chart movements become surprisingly pure. With $BNB floating near 722.74, spot trading volume drops, giving us a clean lens to examine mechanical price action before traditional global markets react on Monday.
Understanding candlestick anatomy is the foundation of institutional tape reading. A long wick rejection is rarely a random event; it reflects a targeted liquidity sweep by market makers filling large counter-party orders. When these rejections align with an established Order Block, you are observing zones where institutional interest previously triggered aggressive moves. Parallel to this, Fair Value Gaps mark sudden structural imbalances where one-sided aggressive buying or selling left inefficient voids. Price naturally gravitates back to these gaps to complete unfinished auctions.
Tracking structural transitions requires separating noise from true shifts. A Break of Structure confirms continuation along the prevailing direction, whereas a Market Structure Shift signals potential exhaustion when price fails to record a new swing high and instead pierces a vital swing low. Applying this to BNB through a Wyckoff framework provides valuable perspective. Given its circulating supply of roughly 147.5 million tokens, moving price requires heavy capital absorption. During low-volume weekend sessions, sideways ranges often reveal whether large float is being steadily absorbed by smart money or quietly distributed into passive bids.
Studying historical structure always beats chasing real-time noise. By mastering these core price action principles, you prepare yourself to read the tape rather than react emotionally when Monday volatility arrives. Which price action setup do you trust the most when mapping out your weekly chart preparation?
#TechnicalAnalysis #CandlestickPatterns
When liquidity thins out over the weekend, chart movements become surprisingly pure. With $BNB floating near 722.74, spot trading volume drops, giving us a clean lens to examine mechanical price action before traditional global markets react on Monday.
Understanding candlestick anatomy is the foundation of institutional tape reading. A long wick rejection is rarely a random event; it reflects a targeted liquidity sweep by market makers filling large counter-party orders. When these rejections align with an established Order Block, you are observing zones where institutional interest previously triggered aggressive moves. Parallel to this, Fair Value Gaps mark sudden structural imbalances where one-sided aggressive buying or selling left inefficient voids. Price naturally gravitates back to these gaps to complete unfinished auctions.
Tracking structural transitions requires separating noise from true shifts. A Break of Structure confirms continuation along the prevailing direction, whereas a Market Structure Shift signals potential exhaustion when price fails to record a new swing high and instead pierces a vital swing low. Applying this to BNB through a Wyckoff framework provides valuable perspective. Given its circulating supply of roughly 147.5 million tokens, moving price requires heavy capital absorption. During low-volume weekend sessions, sideways ranges often reveal whether large float is being steadily absorbed by smart money or quietly distributed into passive bids.
Studying historical structure always beats chasing real-time noise. By mastering these core price action principles, you prepare yourself to read the tape rather than react emotionally when Monday volatility arrives. Which price action setup do you trust the most when mapping out your weekly chart preparation?
#TechnicalAnalysis #CandlestickPatterns
8

SHELLUSDT | October 14, 2026: A Narrow Upper Wick and a Close Near the Low
Using the rounded historical candle values, SHELL opened around $0.0221 and reached a high near $0.0223 before closing around $0.0213.
The difference between the open and high was approximately 0.0002. The close was also only about 0.0002 above the session low of 0.0211.
The candle therefore finished near the bottom of its recorded range, with relatively little distance between the opening price and the high.
This is a descriptive reading of the completed candle. It does not guarantee that the next candle will repeat the same structure.
#SHELL #CandlestickPatterns #PriceStructure BinanceSquare WhaleOnLand
SHELLUSDT | October 14, 2026: A Narrow Upper Wick and a Close Near the Low
Using the rounded historical candle values, SHELL opened around $0.0221 and reached a high near $0.0223 before closing around $0.0213.
The difference between the open and high was approximately 0.0002. The close was also only about 0.0002 above the session low of 0.0211.
The candle therefore finished near the bottom of its recorded range, with relatively little distance between the opening price and the high.
This is a descriptive reading of the completed candle. It does not guarantee that the next candle will repeat the same structure.
#SHELL #CandlestickPatterns #PriceStructure BinanceSquare WhaleOnLand
Using the rounded historical candle values, SHELL opened around $0.0221 and reached a high near $0.0223 before closing around $0.0213.
The difference between the open and high was approximately 0.0002. The close was also only about 0.0002 above the session low of 0.0211.
The candle therefore finished near the bottom of its recorded range, with relatively little distance between the opening price and the high.
This is a descriptive reading of the completed candle. It does not guarantee that the next candle will repeat the same structure.
#SHELL #CandlestickPatterns #PriceStructure BinanceSquare WhaleOnLand

21

{spot}(BTCUSDT)
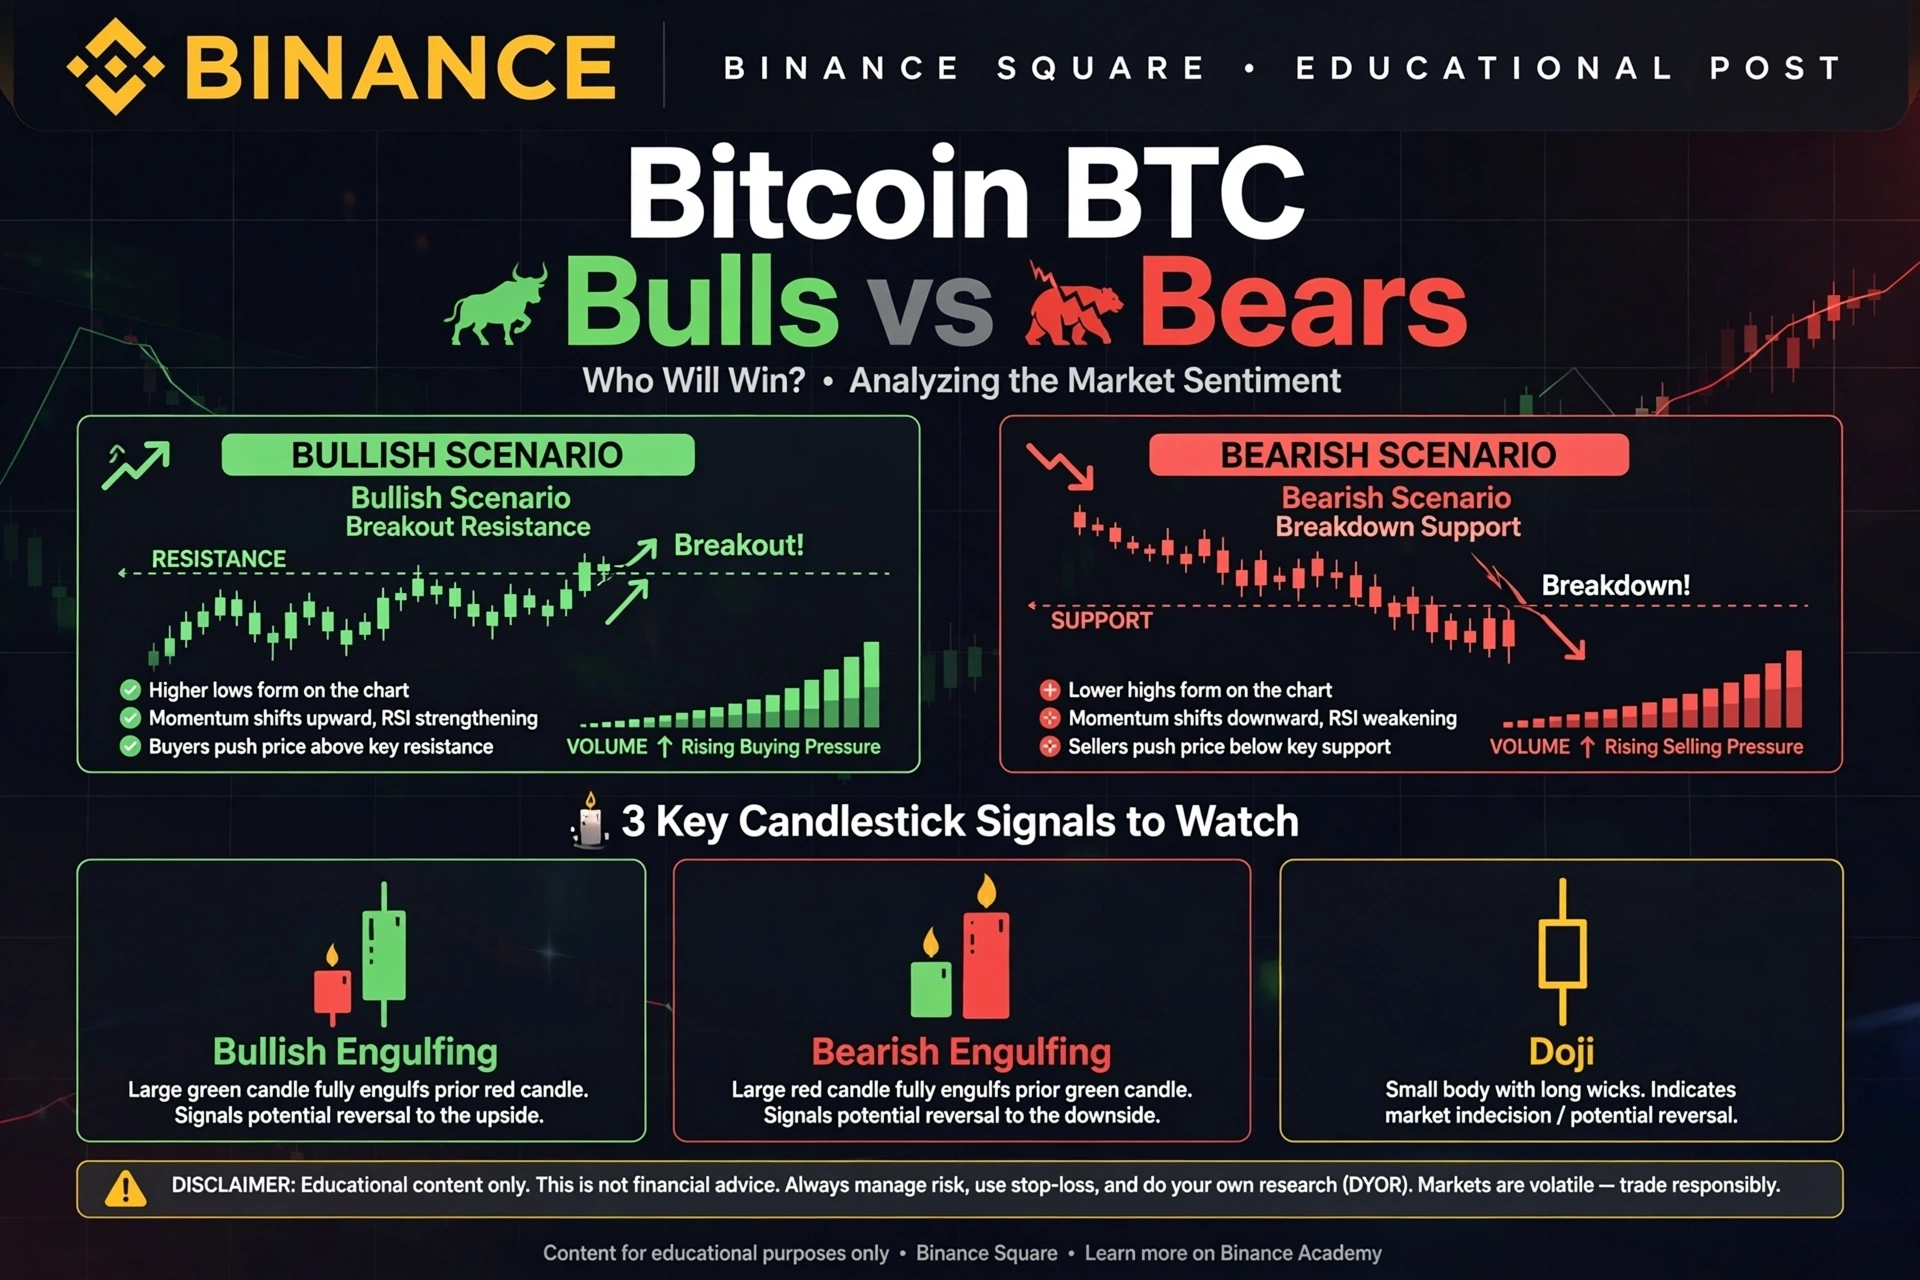
Bitcoin (BTC): Bulls vs Bears — Who Will Win the Next Move? 📊
Bitcoin's price action tells an important story, but the key is to wait for confirmation instead of guessing the next move.
🔍 What Should Traders Watch?
🟢 Bullish Scenario
If BTC breaks above a key resistance level and holds it, buyers may gain strength. Look for a strong candle close and increasing trading volume before considering this scenario.
🔴 Bearish Scenario
If BTC fails to break resistance and falls below support, selling pressure may increase. A confirmed breakdown could signal further weakness.
📈 3 Important Candlestick Signals
1. Bullish Engulfing: May indicate buyers are gaining control.
2. Bearish Engulfing: May indicate increasing selling pressure.
3. Doji Candle: Shows indecision between buyers and sellers.
⚠️ My Trading Rule
Never enter a trade based on one candle alone. Confirm the trend, check volume, manage risk, and always use a stop-loss when appropriate.
💬 Your Opinion Matters!
Are you currently bullish or bearish on Bitcoin?
Comment below: 🟢 BULLISH or 🔴 BEARISH!
#Bitcoin #BTC #BinanceSquare #CryptoAnalysis #CandlestickPatterns #CryptoTrading
Bitcoin (BTC): Bulls vs Bears — Who Will Win the Next Move? 📊
Bitcoin's price action tells an important story, but the key is to wait for confirmation instead of guessing the next move.
🔍 What Should Traders Watch?
🟢 Bullish Scenario
If BTC breaks above a key resistance level and holds it, buyers may gain strength. Look for a strong candle close and increasing trading volume before considering this scenario.
🔴 Bearish Scenario
If BTC fails to break resistance and falls below support, selling pressure may increase. A confirmed breakdown could signal further weakness.
📈 3 Important Candlestick Signals
1. Bullish Engulfing: May indicate buyers are gaining control.
2. Bearish Engulfing: May indicate increasing selling pressure.
3. Doji Candle: Shows indecision between buyers and sellers.
⚠️ My Trading Rule
Never enter a trade based on one candle alone. Confirm the trend, check volume, manage risk, and always use a stop-loss when appropriate.
💬 Your Opinion Matters!
Are you currently bullish or bearish on Bitcoin?
Comment below: 🟢 BULLISH or 🔴 BEARISH!
#Bitcoin #BTC #BinanceSquare #CryptoAnalysis #CandlestickPatterns #CryptoTrading
Bitcoin's price action tells an important story, but the key is to wait for confirmation instead of guessing the next move.
🔍 What Should Traders Watch?
🟢 Bullish Scenario
If BTC breaks above a key resistance level and holds it, buyers may gain strength. Look for a strong candle close and increasing trading volume before considering this scenario.
🔴 Bearish Scenario
If BTC fails to break resistance and falls below support, selling pressure may increase. A confirmed breakdown could signal further weakness.
📈 3 Important Candlestick Signals
1. Bullish Engulfing: May indicate buyers are gaining control.
2. Bearish Engulfing: May indicate increasing selling pressure.
3. Doji Candle: Shows indecision between buyers and sellers.
⚠️ My Trading Rule
Never enter a trade based on one candle alone. Confirm the trend, check volume, manage risk, and always use a stop-loss when appropriate.
💬 Your Opinion Matters!
Are you currently bullish or bearish on Bitcoin?
Comment below: 🟢 BULLISH or 🔴 BEARISH!
#Bitcoin #BTC #BinanceSquare #CryptoAnalysis #CandlestickPatterns #CryptoTrading
1
1
145

·
--
#tradding
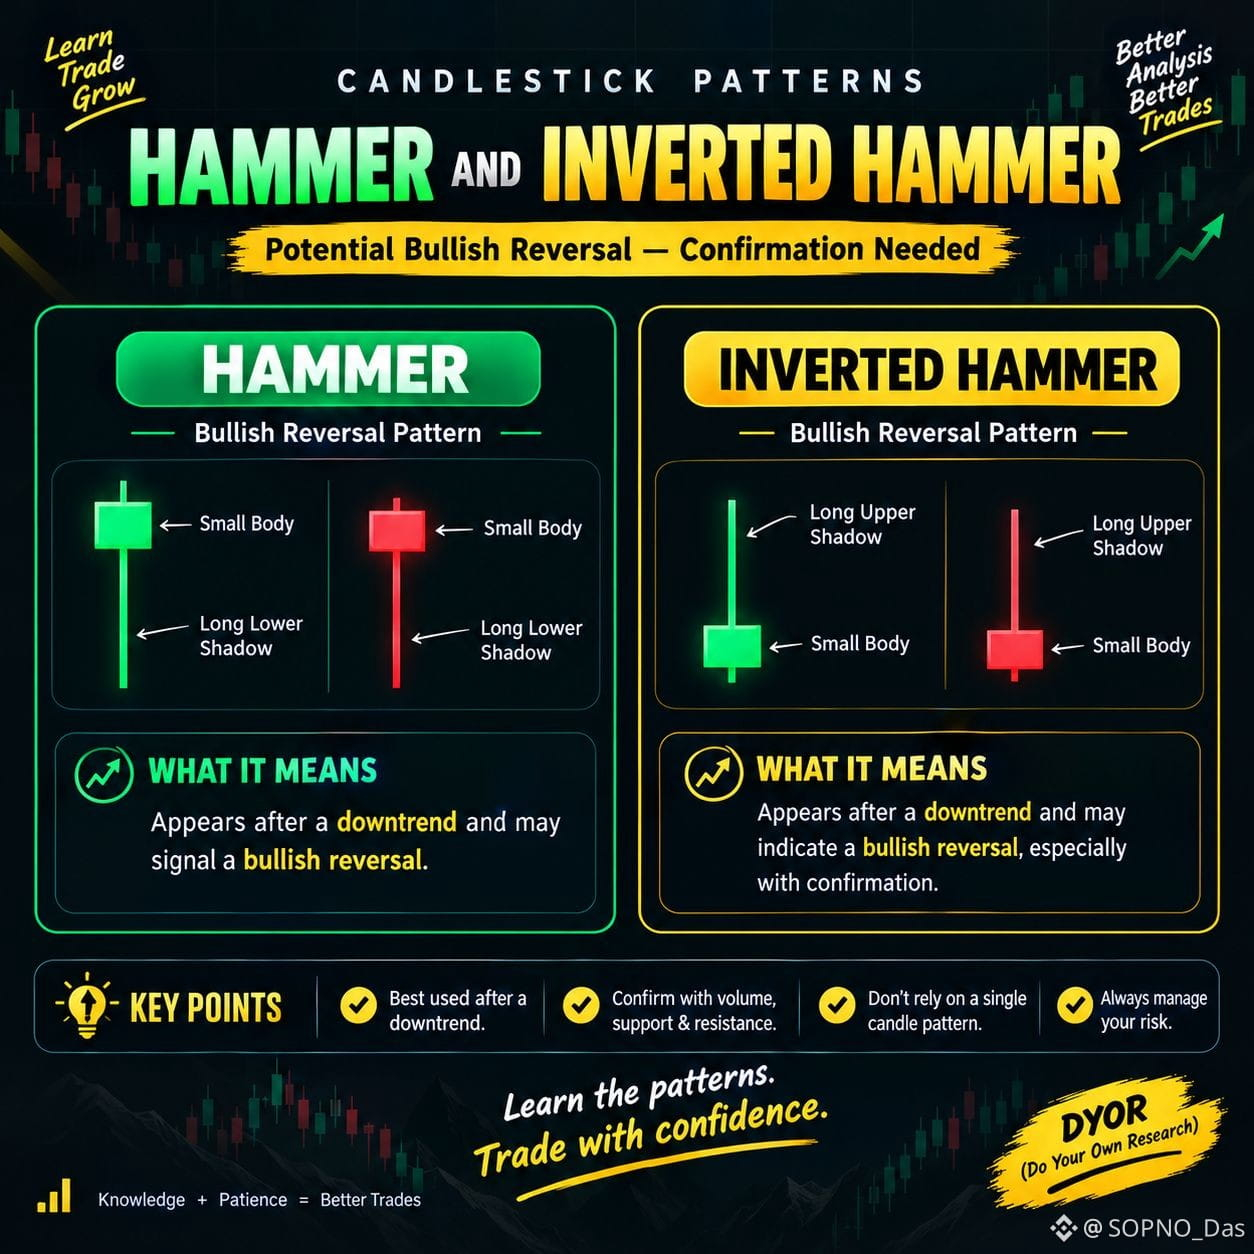
📊 HAMMER vs INVERTED HAMMER 🔨🚀
Do you know how to spot a potential market reversal? 👀
🔨 Hammer Pattern 🟢
A Hammer often appears after a downtrend and may signal a bullish reversal.
🔻 Inverted Hammer 🟡
An Inverted Hammer appears after a downtrend and may indicate a potential bullish reversal, especially with confirmation.
💡 Pro Tips:
✅ Check the overall market trend.
✅ Confirm with volume and support levels.
✅ Never trade based on a single candle pattern.
✅ Always manage your risk.
📈 Learn the patterns. Understand the market. Trade smarter!
What do you think—Hammer or Inverted Hammer? 👇
#BinanceSquare #cryptotrading #CandlestickPatterns #TechnicalAnalysis
#tradding
📊 HAMMER vs INVERTED HAMMER 🔨🚀
Do you know how to spot a potential market reversal? 👀
🔨 Hammer Pattern 🟢
A Hammer often appears after a downtrend and may signal a bullish reversal.
🔻 Inverted Hammer 🟡
An Inverted Hammer appears after a downtrend and may indicate a potential bullish reversal, especially with confirmation.
💡 Pro Tips:
✅ Check the overall market trend.
✅ Confirm with volume and support levels.
✅ Never trade based on a single candle pattern.
✅ Always manage your risk.
📈 Learn the patterns. Understand the market. Trade smarter!
What do you think—Hammer or Inverted Hammer? 👇
#BinanceSquare #cryptotrading #CandlestickPatterns #TechnicalAnalysis
📊 HAMMER vs INVERTED HAMMER 🔨🚀
Do you know how to spot a potential market reversal? 👀
🔨 Hammer Pattern 🟢
A Hammer often appears after a downtrend and may signal a bullish reversal.
🔻 Inverted Hammer 🟡
An Inverted Hammer appears after a downtrend and may indicate a potential bullish reversal, especially with confirmation.
💡 Pro Tips:
✅ Check the overall market trend.
✅ Confirm with volume and support levels.
✅ Never trade based on a single candle pattern.
✅ Always manage your risk.
📈 Learn the patterns. Understand the market. Trade smarter!
What do you think—Hammer or Inverted Hammer? 👇
#BinanceSquare #cryptotrading #CandlestickPatterns #TechnicalAnalysis
48


🚨 🚨 🚨 Educational Post 🚨🚨🚨
This image is a Daily Bias Guide that shows how to determine the likely market direction using the first two candles after a key level or session open.
1. Top Left – Bearish 🟥
First candle is a strong bullish candle.
Second candle is a small bearish candle that rejects higher prices.
Indicates buyers are losing momentum.
Bias: Look for SHORT opportunities.
2. Top Middle – Bullish 🟩
First candle is bearish.
Second candle is a strong bullish candle that engulfs/reclaims the move.
Buyers take control.
Bias: Look for LONG opportunities.
3. Top Right – Avoid ❌
Bullish candle followed by a bearish candle of similar strength.
No clear winner between buyers and sellers.
Bias: Stay out until a breakout.
4. Bottom Left – Avoid ❌
Small bullish candle followed by a strong bearish candle.
Market structure is unclear at this stage.
Bias: Wait for confirmation.
5. Bottom Middle – Bearish 🟥
Small bullish candle is completely overwhelmed by a large bearish candle.
Strong selling pressure.
Bias: Prefer SHORT trades.
6. Bottom Right – Bullish 🟩
Small bullish candle followed by a small bearish pullback.
Buyers still remain in control.
Bias: Look for LONG continuation.
Key takeaway
🟩 Bullish: Buy on pullbacks after confirmation.
🟥 Bearish: Sell on pullbacks after confirmation.
❌ Avoid: No clear edge—wait for a better setup.
This guide is useful as a bias filter, but it should be combined with market structure, support/resistance, volume, and liquidity rather than used as a standalone trading strategy.
#priceaction #CandlestickPatterns #tradingStrategy #cryptotrading #BinanceSquare
🚨 🚨 🚨 Educational Post 🚨🚨🚨
This image is a Daily Bias Guide that shows how to determine the likely market direction using the first two candles after a key level or session open.
1. Top Left – Bearish 🟥
First candle is a strong bullish candle.
Second candle is a small bearish candle that rejects higher prices.
Indicates buyers are losing momentum.
Bias: Look for SHORT opportunities.
2. Top Middle – Bullish 🟩
First candle is bearish.
Second candle is a strong bullish candle that engulfs/reclaims the move.
Buyers take control.
Bias: Look for LONG opportunities.
3. Top Right – Avoid ❌
Bullish candle followed by a bearish candle of similar strength.
No clear winner between buyers and sellers.
Bias: Stay out until a breakout.
4. Bottom Left – Avoid ❌
Small bullish candle followed by a strong bearish candle.
Market structure is unclear at this stage.
Bias: Wait for confirmation.
5. Bottom Middle – Bearish 🟥
Small bullish candle is completely overwhelmed by a large bearish candle.
Strong selling pressure.
Bias: Prefer SHORT trades.
6. Bottom Right – Bullish 🟩
Small bullish candle followed by a small bearish pullback.
Buyers still remain in control.
Bias: Look for LONG continuation.
Key takeaway
🟩 Bullish: Buy on pullbacks after confirmation.
🟥 Bearish: Sell on pullbacks after confirmation.
❌ Avoid: No clear edge—wait for a better setup.
This guide is useful as a bias filter, but it should be combined with market structure, support/resistance, volume, and liquidity rather than used as a standalone trading strategy.
#priceaction #CandlestickPatterns #tradingStrategy #cryptotrading #BinanceSquare
This image is a Daily Bias Guide that shows how to determine the likely market direction using the first two candles after a key level or session open.
1. Top Left – Bearish 🟥
First candle is a strong bullish candle.
Second candle is a small bearish candle that rejects higher prices.
Indicates buyers are losing momentum.
Bias: Look for SHORT opportunities.
2. Top Middle – Bullish 🟩
First candle is bearish.
Second candle is a strong bullish candle that engulfs/reclaims the move.
Buyers take control.
Bias: Look for LONG opportunities.
3. Top Right – Avoid ❌
Bullish candle followed by a bearish candle of similar strength.
No clear winner between buyers and sellers.
Bias: Stay out until a breakout.
4. Bottom Left – Avoid ❌
Small bullish candle followed by a strong bearish candle.
Market structure is unclear at this stage.
Bias: Wait for confirmation.
5. Bottom Middle – Bearish 🟥
Small bullish candle is completely overwhelmed by a large bearish candle.
Strong selling pressure.
Bias: Prefer SHORT trades.
6. Bottom Right – Bullish 🟩
Small bullish candle followed by a small bearish pullback.
Buyers still remain in control.
Bias: Look for LONG continuation.
Key takeaway
🟩 Bullish: Buy on pullbacks after confirmation.
🟥 Bearish: Sell on pullbacks after confirmation.
❌ Avoid: No clear edge—wait for a better setup.
This guide is useful as a bias filter, but it should be combined with market structure, support/resistance, volume, and liquidity rather than used as a standalone trading strategy.
#priceaction #CandlestickPatterns #tradingStrategy #cryptotrading #BinanceSquare
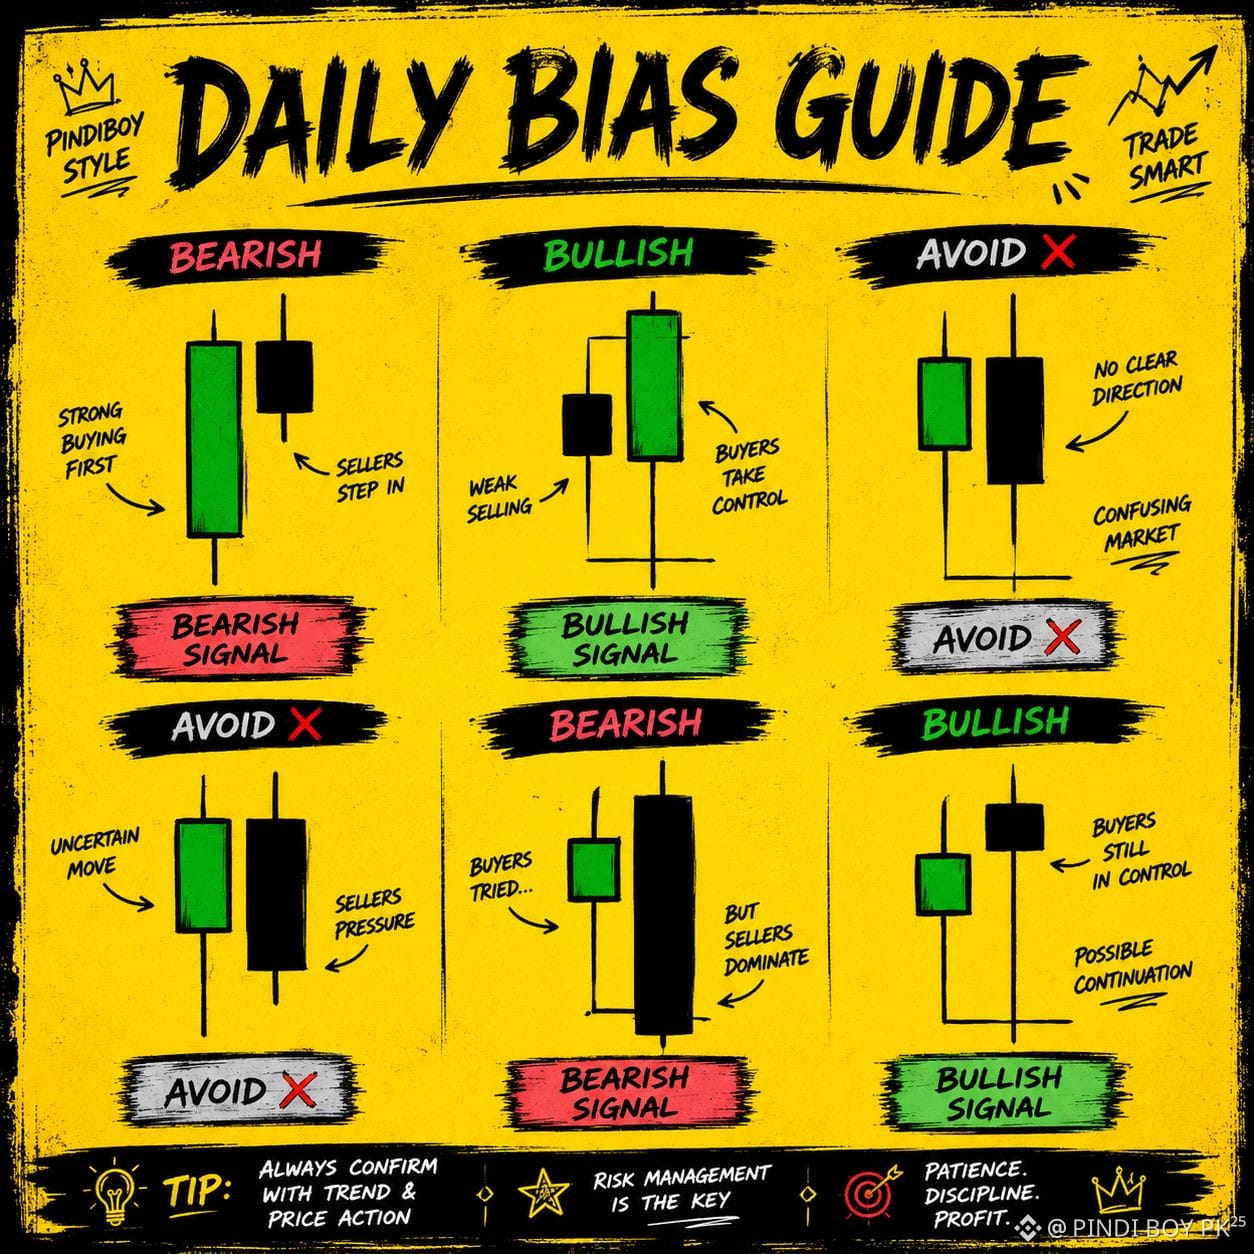
4
611
·
--
Bullish
📈 Bullish Kicker — A Powerful Reversal Signal
The Bullish Kicker is a candlestick formation that can signal a potential shift from bearish momentum to bullish momentum.
🔴 First candle: Sellers remain in control with a strong bearish candle.
🟢 Second candle: Buyers suddenly take over with a strong bullish candle, showing a sharp change in market sentiment.
When this setup appears after a sustained decline, it can indicate that bullish momentum is entering the market. Traders may then look for confirmation before considering a trade in the direction of the new trend.
🎯 Key lesson: Don’t trade the pattern blindly. Confirm the trend, watch volume and structure, and always manage your risk.
Have you spotted a Bullish Kicker on a live chart? 👀📊
#BinanceSquare #cryptotrading #CandlestickPatterns #BullishKicker #PriceAction
📈 Bullish Kicker — A Powerful Reversal Signal
The Bullish Kicker is a candlestick formation that can signal a potential shift from bearish momentum to bullish momentum.
🔴 First candle: Sellers remain in control with a strong bearish candle.
🟢 Second candle: Buyers suddenly take over with a strong bullish candle, showing a sharp change in market sentiment.
When this setup appears after a sustained decline, it can indicate that bullish momentum is entering the market. Traders may then look for confirmation before considering a trade in the direction of the new trend.
🎯 Key lesson: Don’t trade the pattern blindly. Confirm the trend, watch volume and structure, and always manage your risk.
Have you spotted a Bullish Kicker on a live chart? 👀📊
#BinanceSquare #cryptotrading #CandlestickPatterns #BullishKicker #PriceAction
The Bullish Kicker is a candlestick formation that can signal a potential shift from bearish momentum to bullish momentum.
🔴 First candle: Sellers remain in control with a strong bearish candle.
🟢 Second candle: Buyers suddenly take over with a strong bullish candle, showing a sharp change in market sentiment.
When this setup appears after a sustained decline, it can indicate that bullish momentum is entering the market. Traders may then look for confirmation before considering a trade in the direction of the new trend.
🎯 Key lesson: Don’t trade the pattern blindly. Confirm the trend, watch volume and structure, and always manage your risk.
Have you spotted a Bullish Kicker on a live chart? 👀📊
#BinanceSquare #cryptotrading #CandlestickPatterns #BullishKicker #PriceAction
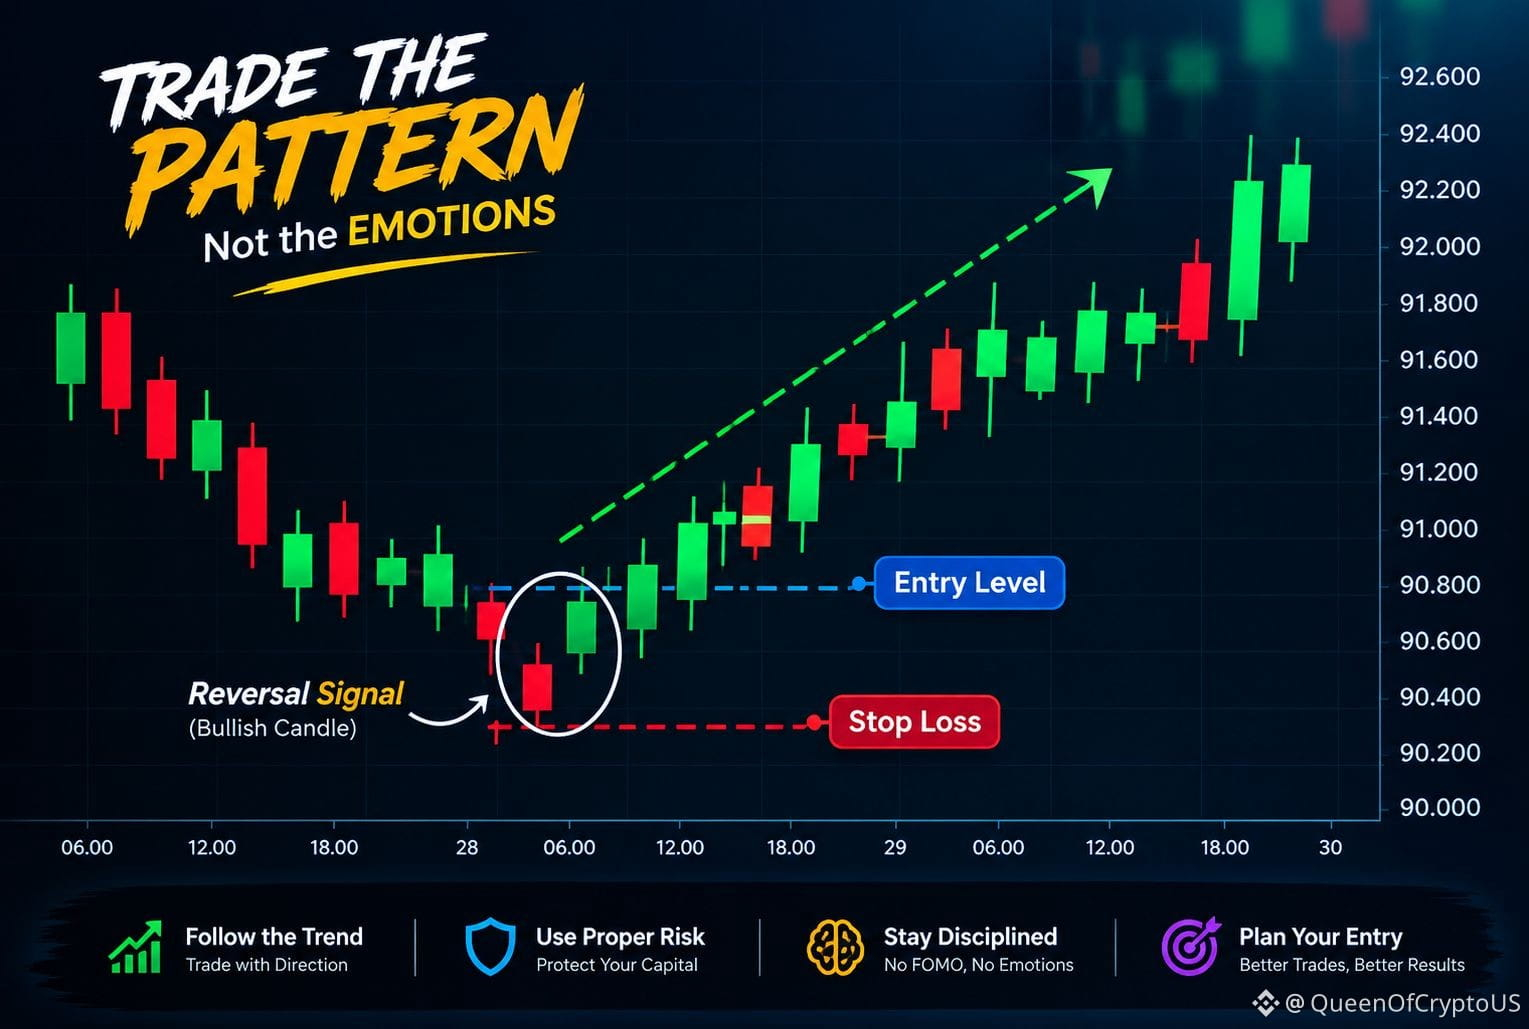
1
20
Log in to explore more content
Join global crypto users on Binance Square
⚡️ Get latest and useful information about crypto.
💬 Trusted by the world’s largest crypto exchange.
👍 Discover real insights from verified creators.
Email / Phone number
Trending Topics
1
#WhoWillSucceedJensenHuangatNvidia?
149,873 views
1,571 Discussing
2
#WhatWillDriveCryptoandStocks’NextRebound?
546,924 views
3,410 Discussing
3
#BitcoinActiveSupplyInProfitDropsBelow45%
65,509 views
667 Discussing
4
#KavaSaysAbnormalActivityLimitedToKavaLend
35,519 views
371 Discussing
5
#USSpotXRPETFsSeeLargestWeeklyOutflowIn8Months
27,312 views
326 Discussing
6
#USPPIMissMayEaseBTCPressure
282,626 views
2,223 Discussing
7
#WORPTLetsTouristsConvertCryptoToThaiBaht
9,456 views
88 Discussing
8
#TONStrategyReports$23.97MQ3NetLoss
10,134 views
42 Discussing
9
#PolkadotCommunityApprovesNewStrategyWith97%Vote
26,515 views
285 Discussing
10
#dYdXPlansV9.9UpgradeToShiftUSDCToInjective
24,297 views
245 Discussing