
#marketanalysis
marketanalysis
10.8M views
69,117 Discussing
Hot
Latest

·
--
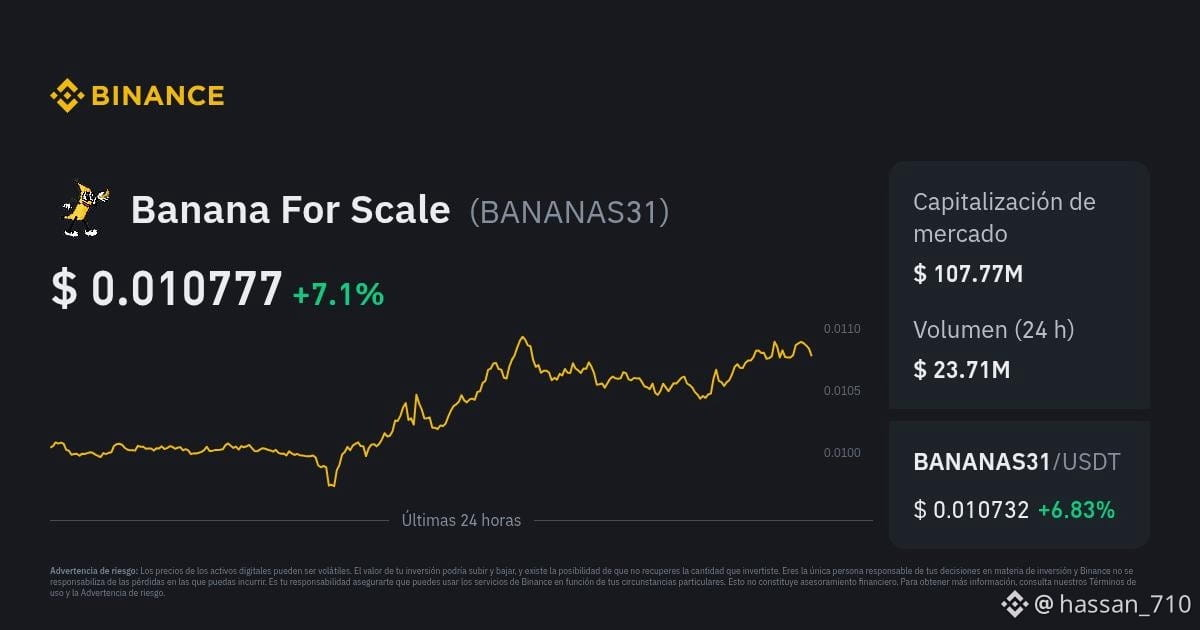
$BANANAS31 LATEST MARKET ANALYSIS 🚀
📅 14 November 2026
💰 Price: $0.004357
📈 24H Change: +2.93%
📊 24H High: $0.004689
📉 24H Low: $0.003771
📉 7D Change: -25.71%
📊 Market Outlook:
$BANANAS31 is showing a short-term bounce, but the broader weekly trend remains bearish.
⚠️ Market volatility remains high. Prices can change rapidly.
$BANANAS31 BananaForScale #BinanceSquare #CryptoUpdate #MarketAnalysis #WhatWillDriveCryptoandStocks’NextRebound? #WhoWillSucceedJensenHuangatNvidia?
{spot}(BANANAS31USDT)
$BANANAS31 LATEST MARKET ANALYSIS 🚀
📅 14 November 2026
💰 Price: $0.004357
📈 24H Change: +2.93%
📊 24H High: $0.004689
📉 24H Low: $0.003771
📉 7D Change: -25.71%
📊 Market Outlook:
$BANANAS31 is showing a short-term bounce, but the broader weekly trend remains bearish.
⚠️ Market volatility remains high. Prices can change rapidly.
$BANANAS31 BananaForScale #BinanceSquare #CryptoUpdate #MarketAnalysis #WhatWillDriveCryptoandStocks’NextRebound? #WhoWillSucceedJensenHuangatNvidia?
📅 14 November 2026
💰 Price: $0.004357
📈 24H Change: +2.93%
📊 24H High: $0.004689
📉 24H Low: $0.003771
📉 7D Change: -25.71%
📊 Market Outlook:
$BANANAS31 is showing a short-term bounce, but the broader weekly trend remains bearish.
⚠️ Market volatility remains high. Prices can change rapidly.
$BANANAS31 BananaForScale #BinanceSquare #CryptoUpdate #MarketAnalysis #WhatWillDriveCryptoandStocks’NextRebound? #WhoWillSucceedJensenHuangatNvidia?
84

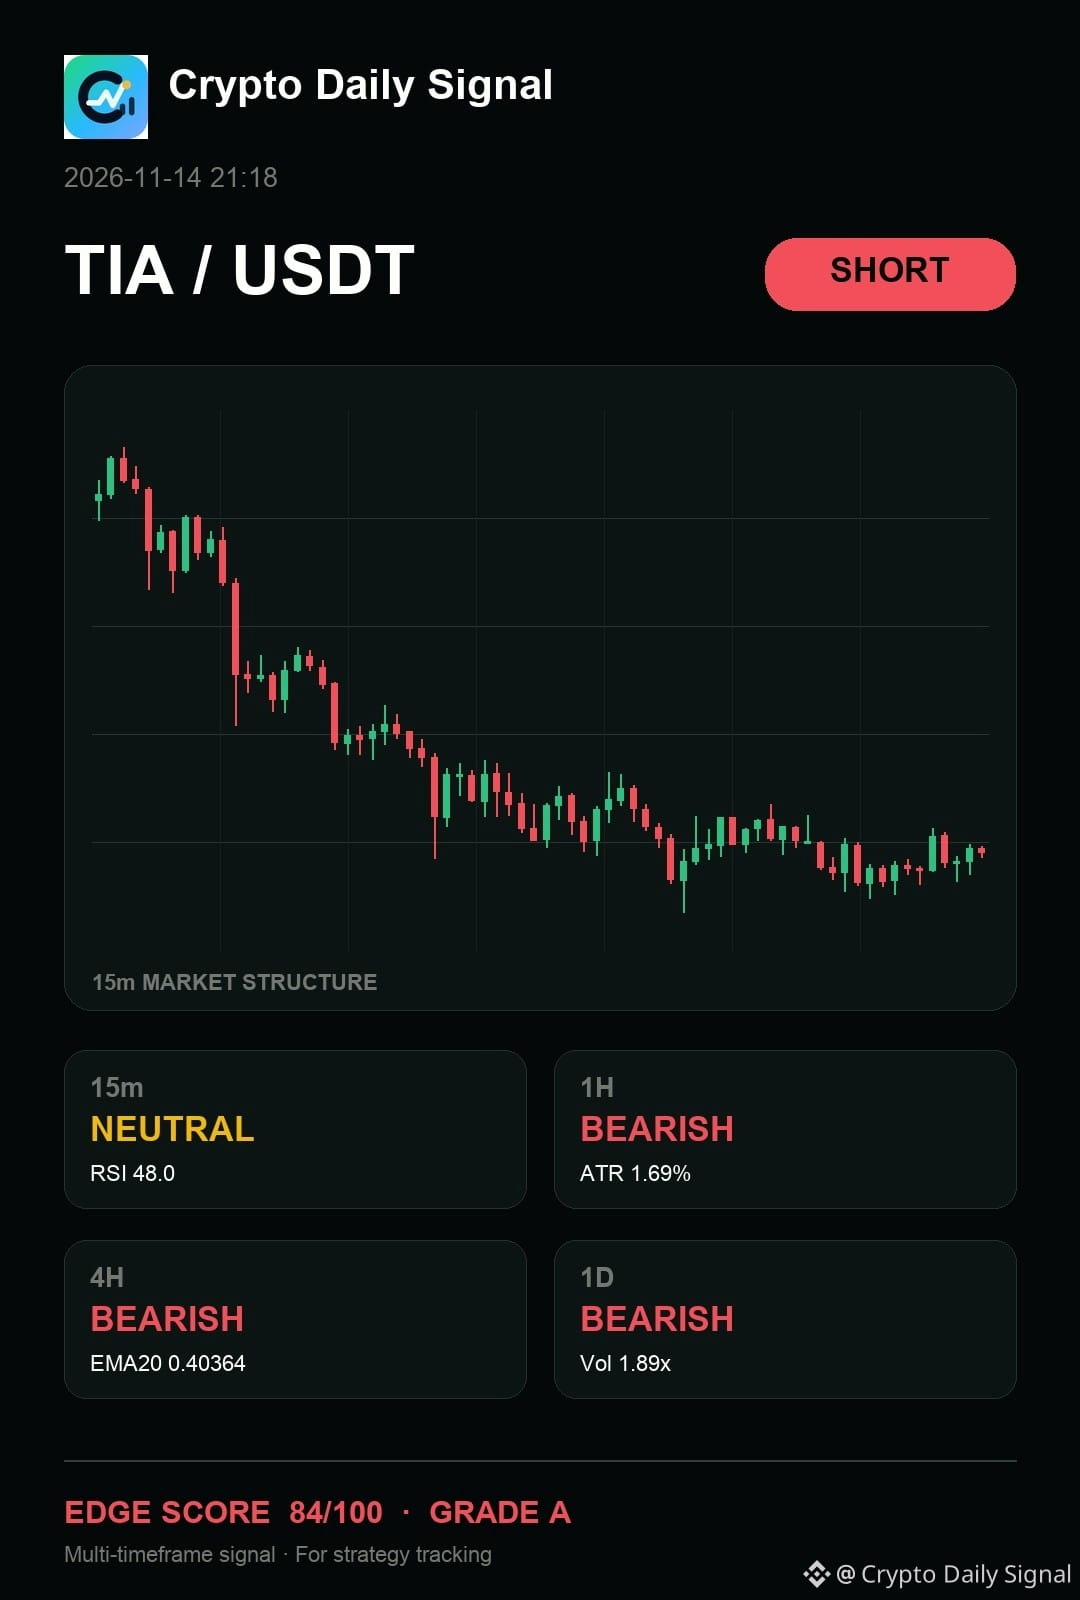
$TIA — right now, I would say it keeps the bearish thesis active as long as it stays inside that descending channel formation. We're seeing lower highs popping up consistently across the shorter timeframes, which matches the established bearish bias on the larger charts. A strong move back above that immediate resistance level would signal a big shift.
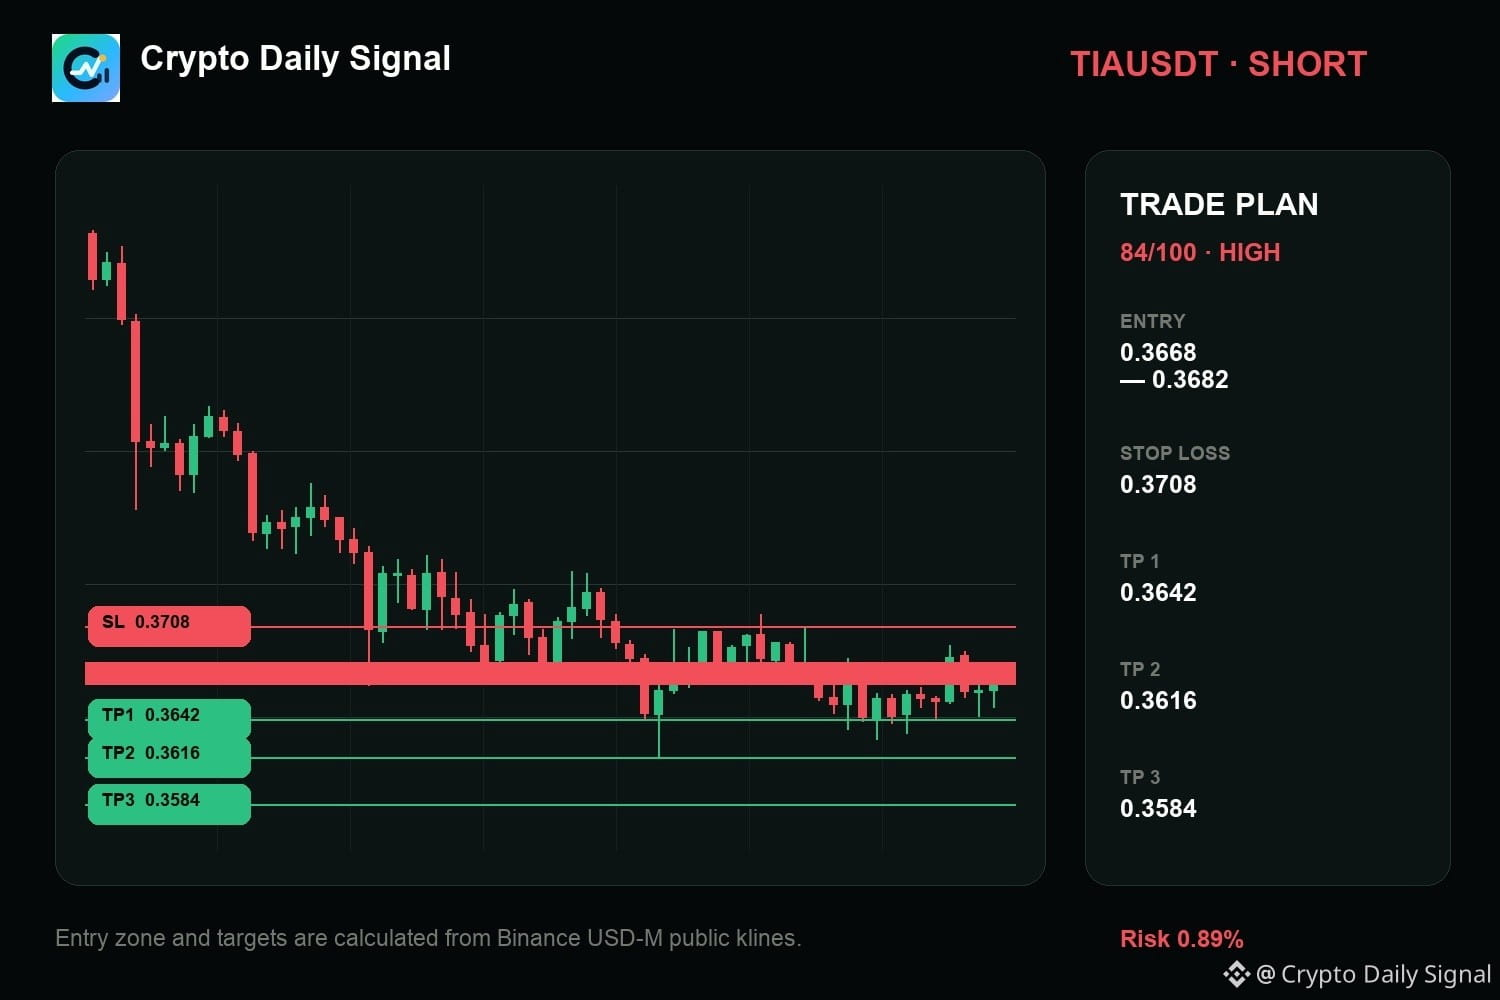
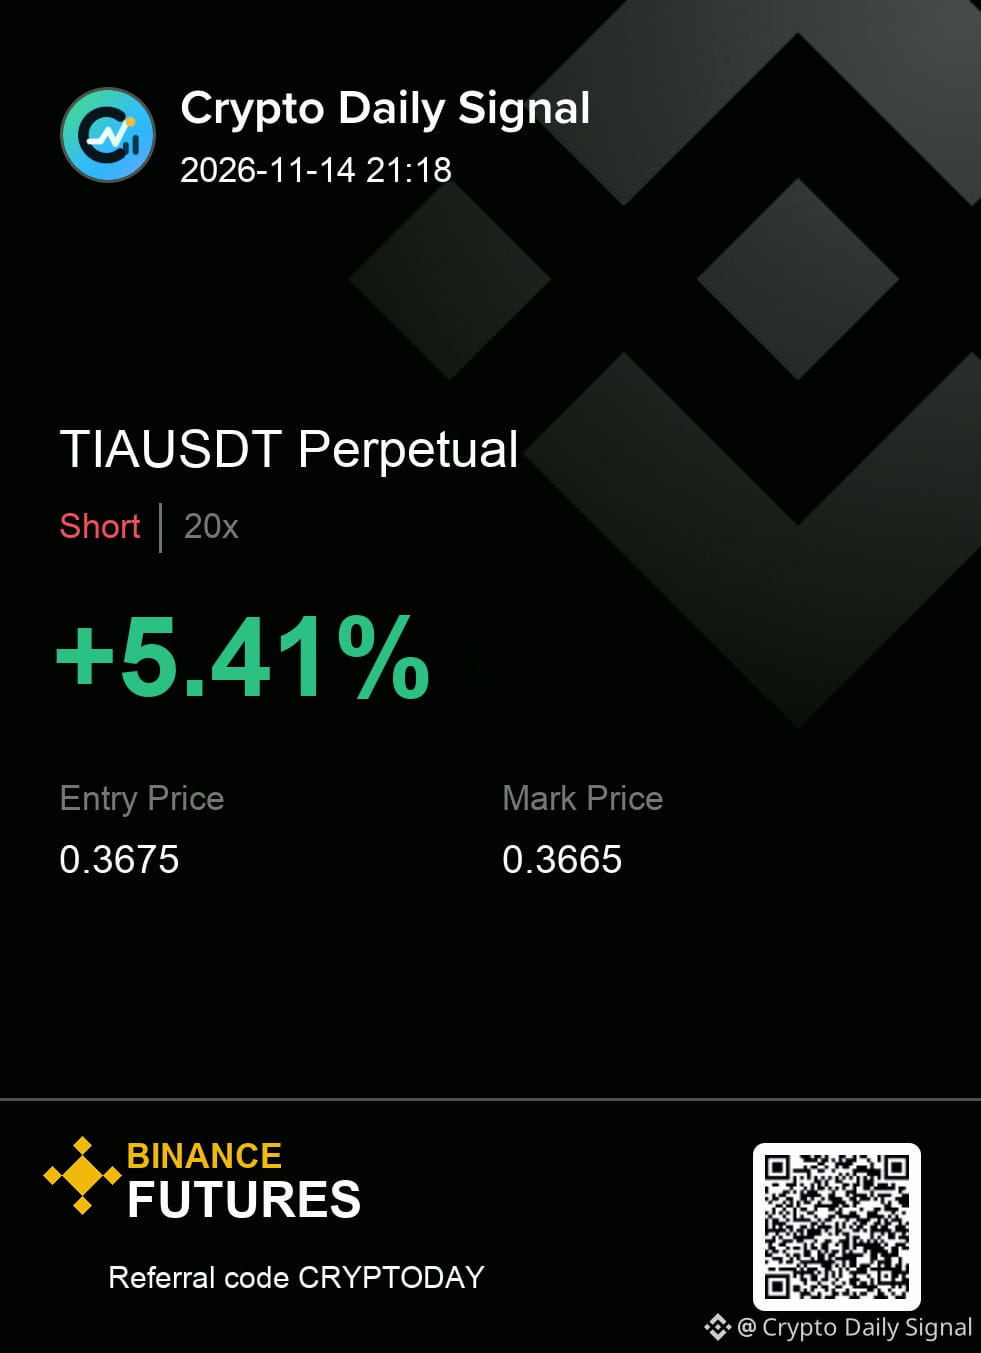
My levels for TIAUSDT — SHORT
Entry zone 0.3668 - 0.3682
Risk line 0.3708
Targets 0.3642 / 0.3616 / 0.3584
#MarketAnalysis
{future}(TIAUSDT)
$TIA — right now, I would say it keeps the bearish thesis active as long as it stays inside that descending channel formation. We're seeing lower highs popping up consistently across the shorter timeframes, which matches the established bearish bias on the larger charts. A strong move back above that immediate resistance level would signal a big shift.
My levels for TIAUSDT — SHORT
Entry zone 0.3668 - 0.3682
Risk line 0.3708
Targets 0.3642 / 0.3616 / 0.3584
#MarketAnalysis
My levels for TIAUSDT — SHORT
Entry zone 0.3668 - 0.3682
Risk line 0.3708
Targets 0.3642 / 0.3616 / 0.3584
#MarketAnalysis
11

·
--
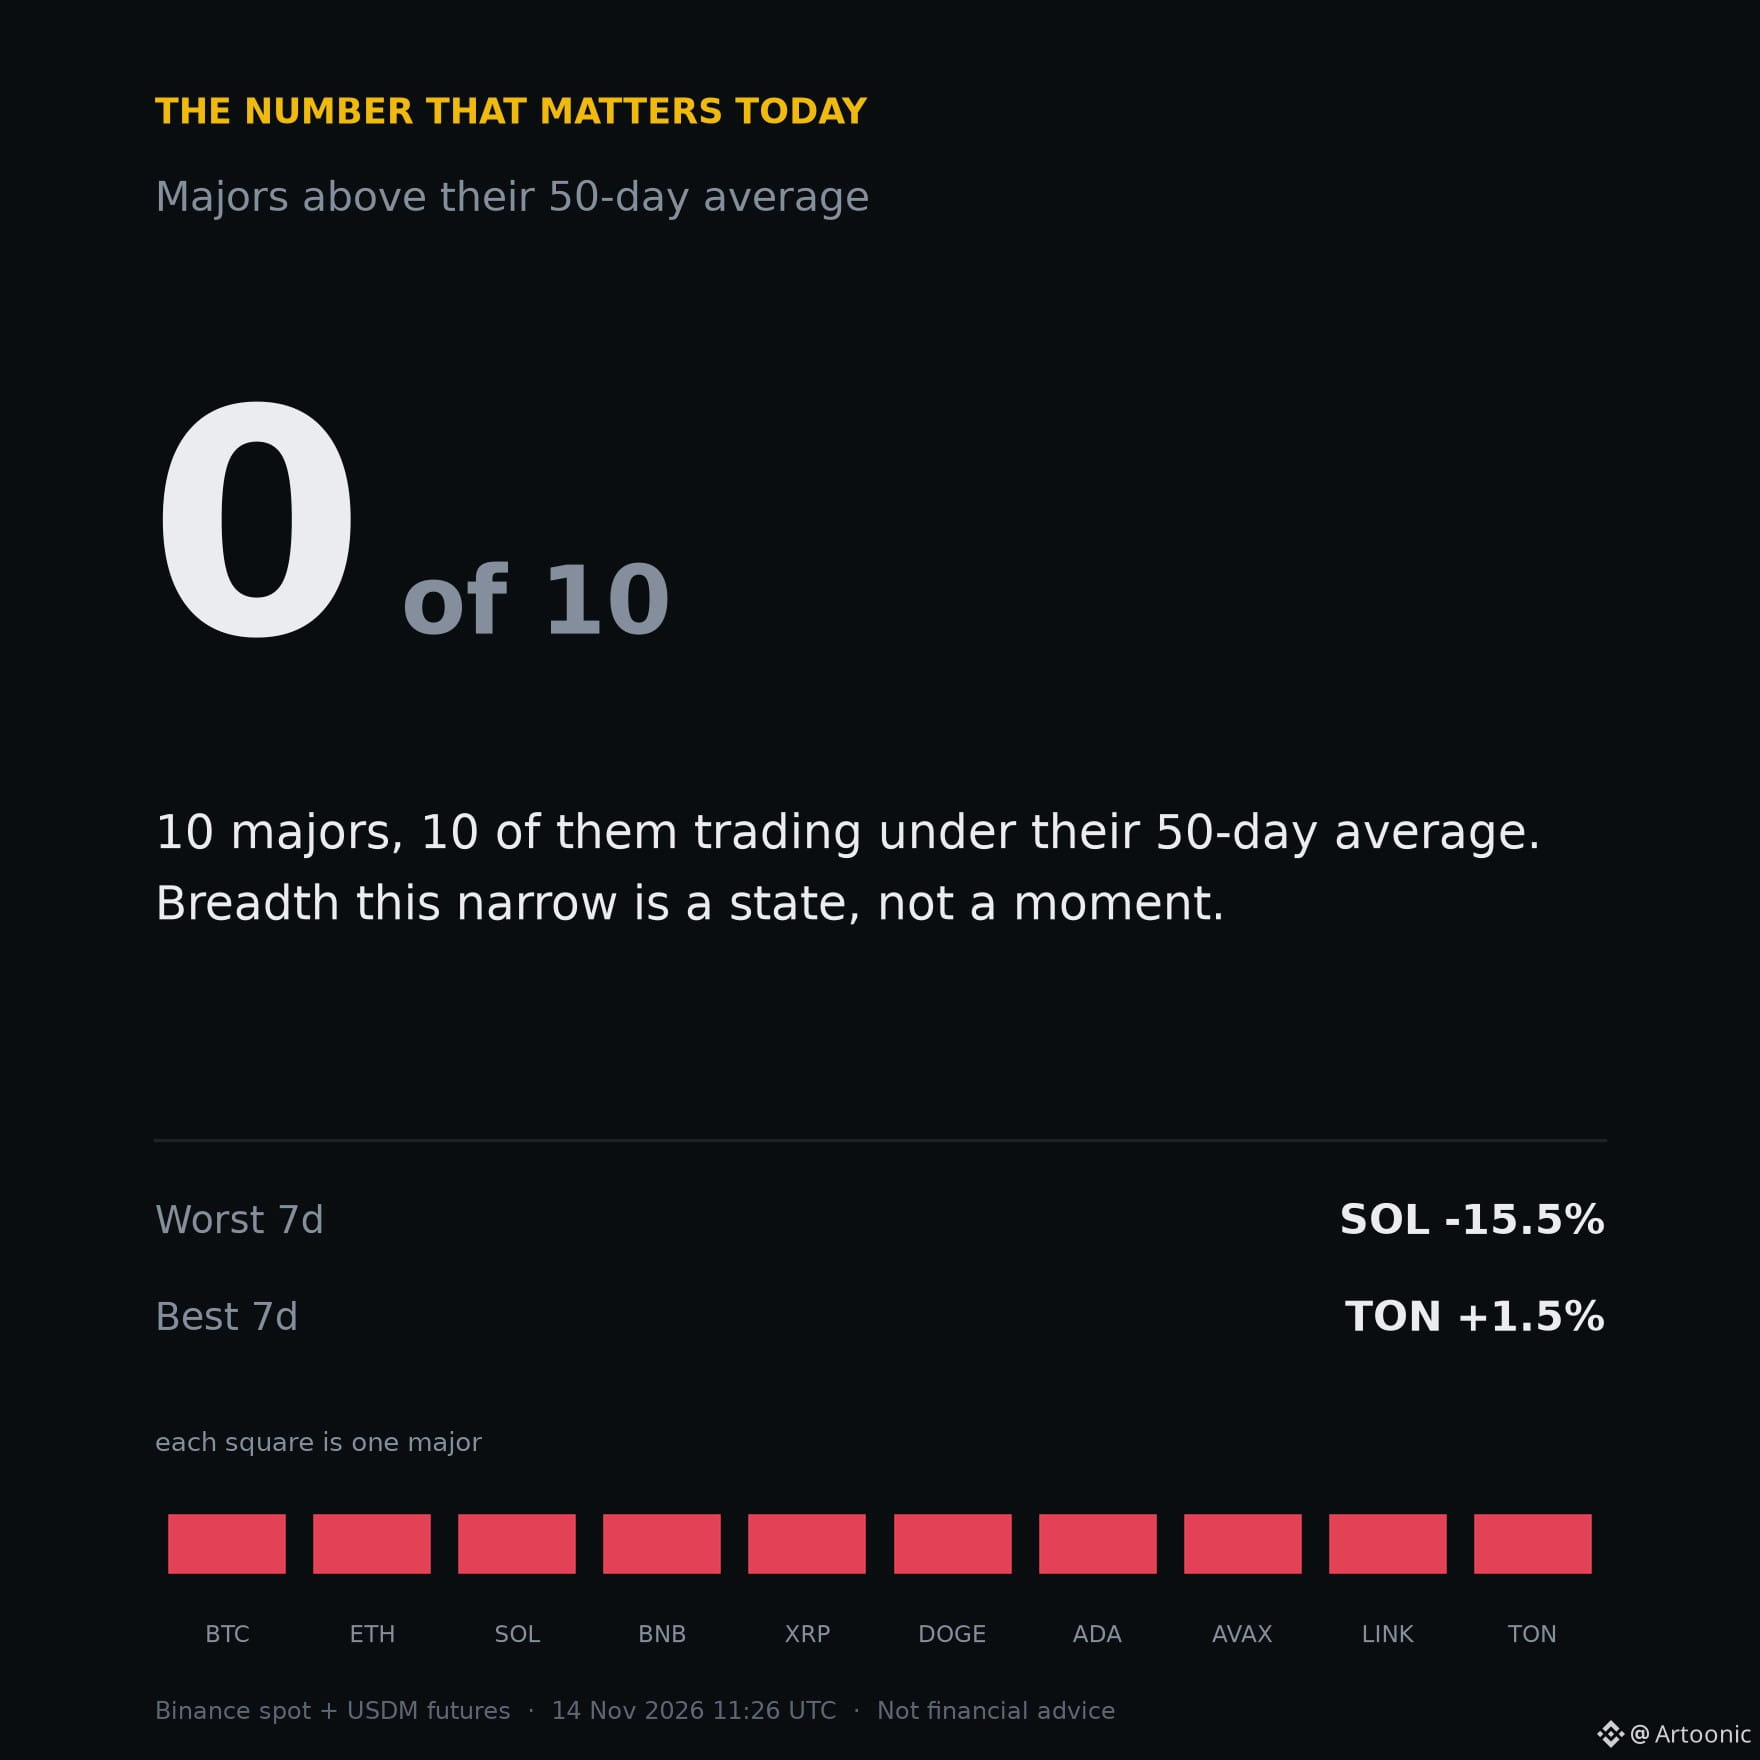
Nothing in the top ten is holding its trend line.
All ten majors I track are trading below their 50-day average tonight. BTC is 11.4% lower over seven days, SOL is down 15.5%, and the best of the group, TON, managed +1.5% for the week.
Zero breadth is not a prediction. It is a description: the market has stopped rewarding patience, because there is no quiet group of assets holding up while the rest fall.
It does not imply a bottom either. Readings like this can persist for weeks, and the repair usually starts with one or two majors reclaiming their average before the rest follow.
So watch the count, not the price. Two or three names back above their 50-day while BTC chops sideways says more than any single green candle.
$BTC $SOL $TON
If breadth has to repair one name at a time, which one leads it?
#bitcoin #crypto #altcoins #marketanalysis
Nothing in the top ten is holding its trend line.
All ten majors I track are trading below their 50-day average tonight. BTC is 11.4% lower over seven days, SOL is down 15.5%, and the best of the group, TON, managed +1.5% for the week.
Zero breadth is not a prediction. It is a description: the market has stopped rewarding patience, because there is no quiet group of assets holding up while the rest fall.
It does not imply a bottom either. Readings like this can persist for weeks, and the repair usually starts with one or two majors reclaiming their average before the rest follow.
So watch the count, not the price. Two or three names back above their 50-day while BTC chops sideways says more than any single green candle.
$BTC $SOL $TON
If breadth has to repair one name at a time, which one leads it?
#bitcoin #crypto #altcoins #marketanalysis
All ten majors I track are trading below their 50-day average tonight. BTC is 11.4% lower over seven days, SOL is down 15.5%, and the best of the group, TON, managed +1.5% for the week.
Zero breadth is not a prediction. It is a description: the market has stopped rewarding patience, because there is no quiet group of assets holding up while the rest fall.
It does not imply a bottom either. Readings like this can persist for weeks, and the repair usually starts with one or two majors reclaiming their average before the rest follow.
So watch the count, not the price. Two or three names back above their 50-day while BTC chops sideways says more than any single green candle.
$BTC $SOL $TON
If breadth has to repair one name at a time, which one leads it?
#bitcoin #crypto #altcoins #marketanalysis
162

·
--
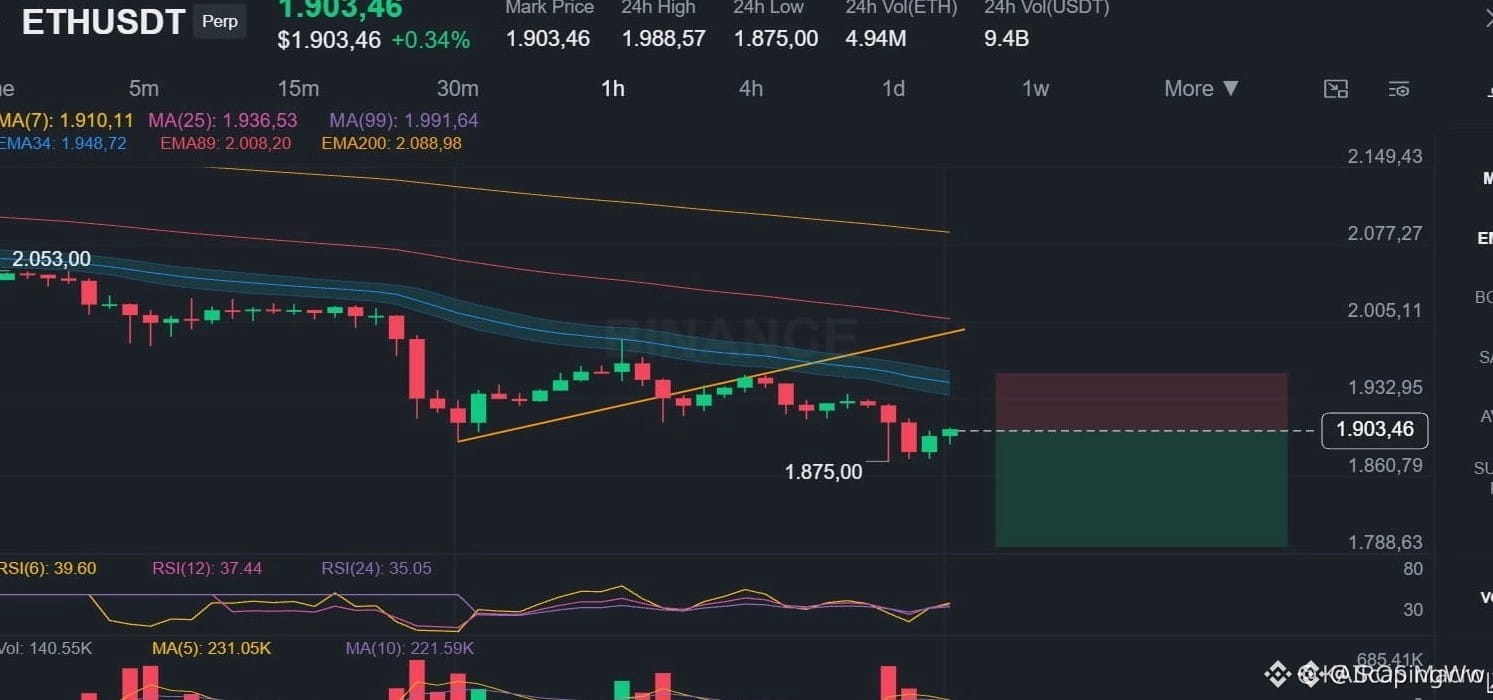
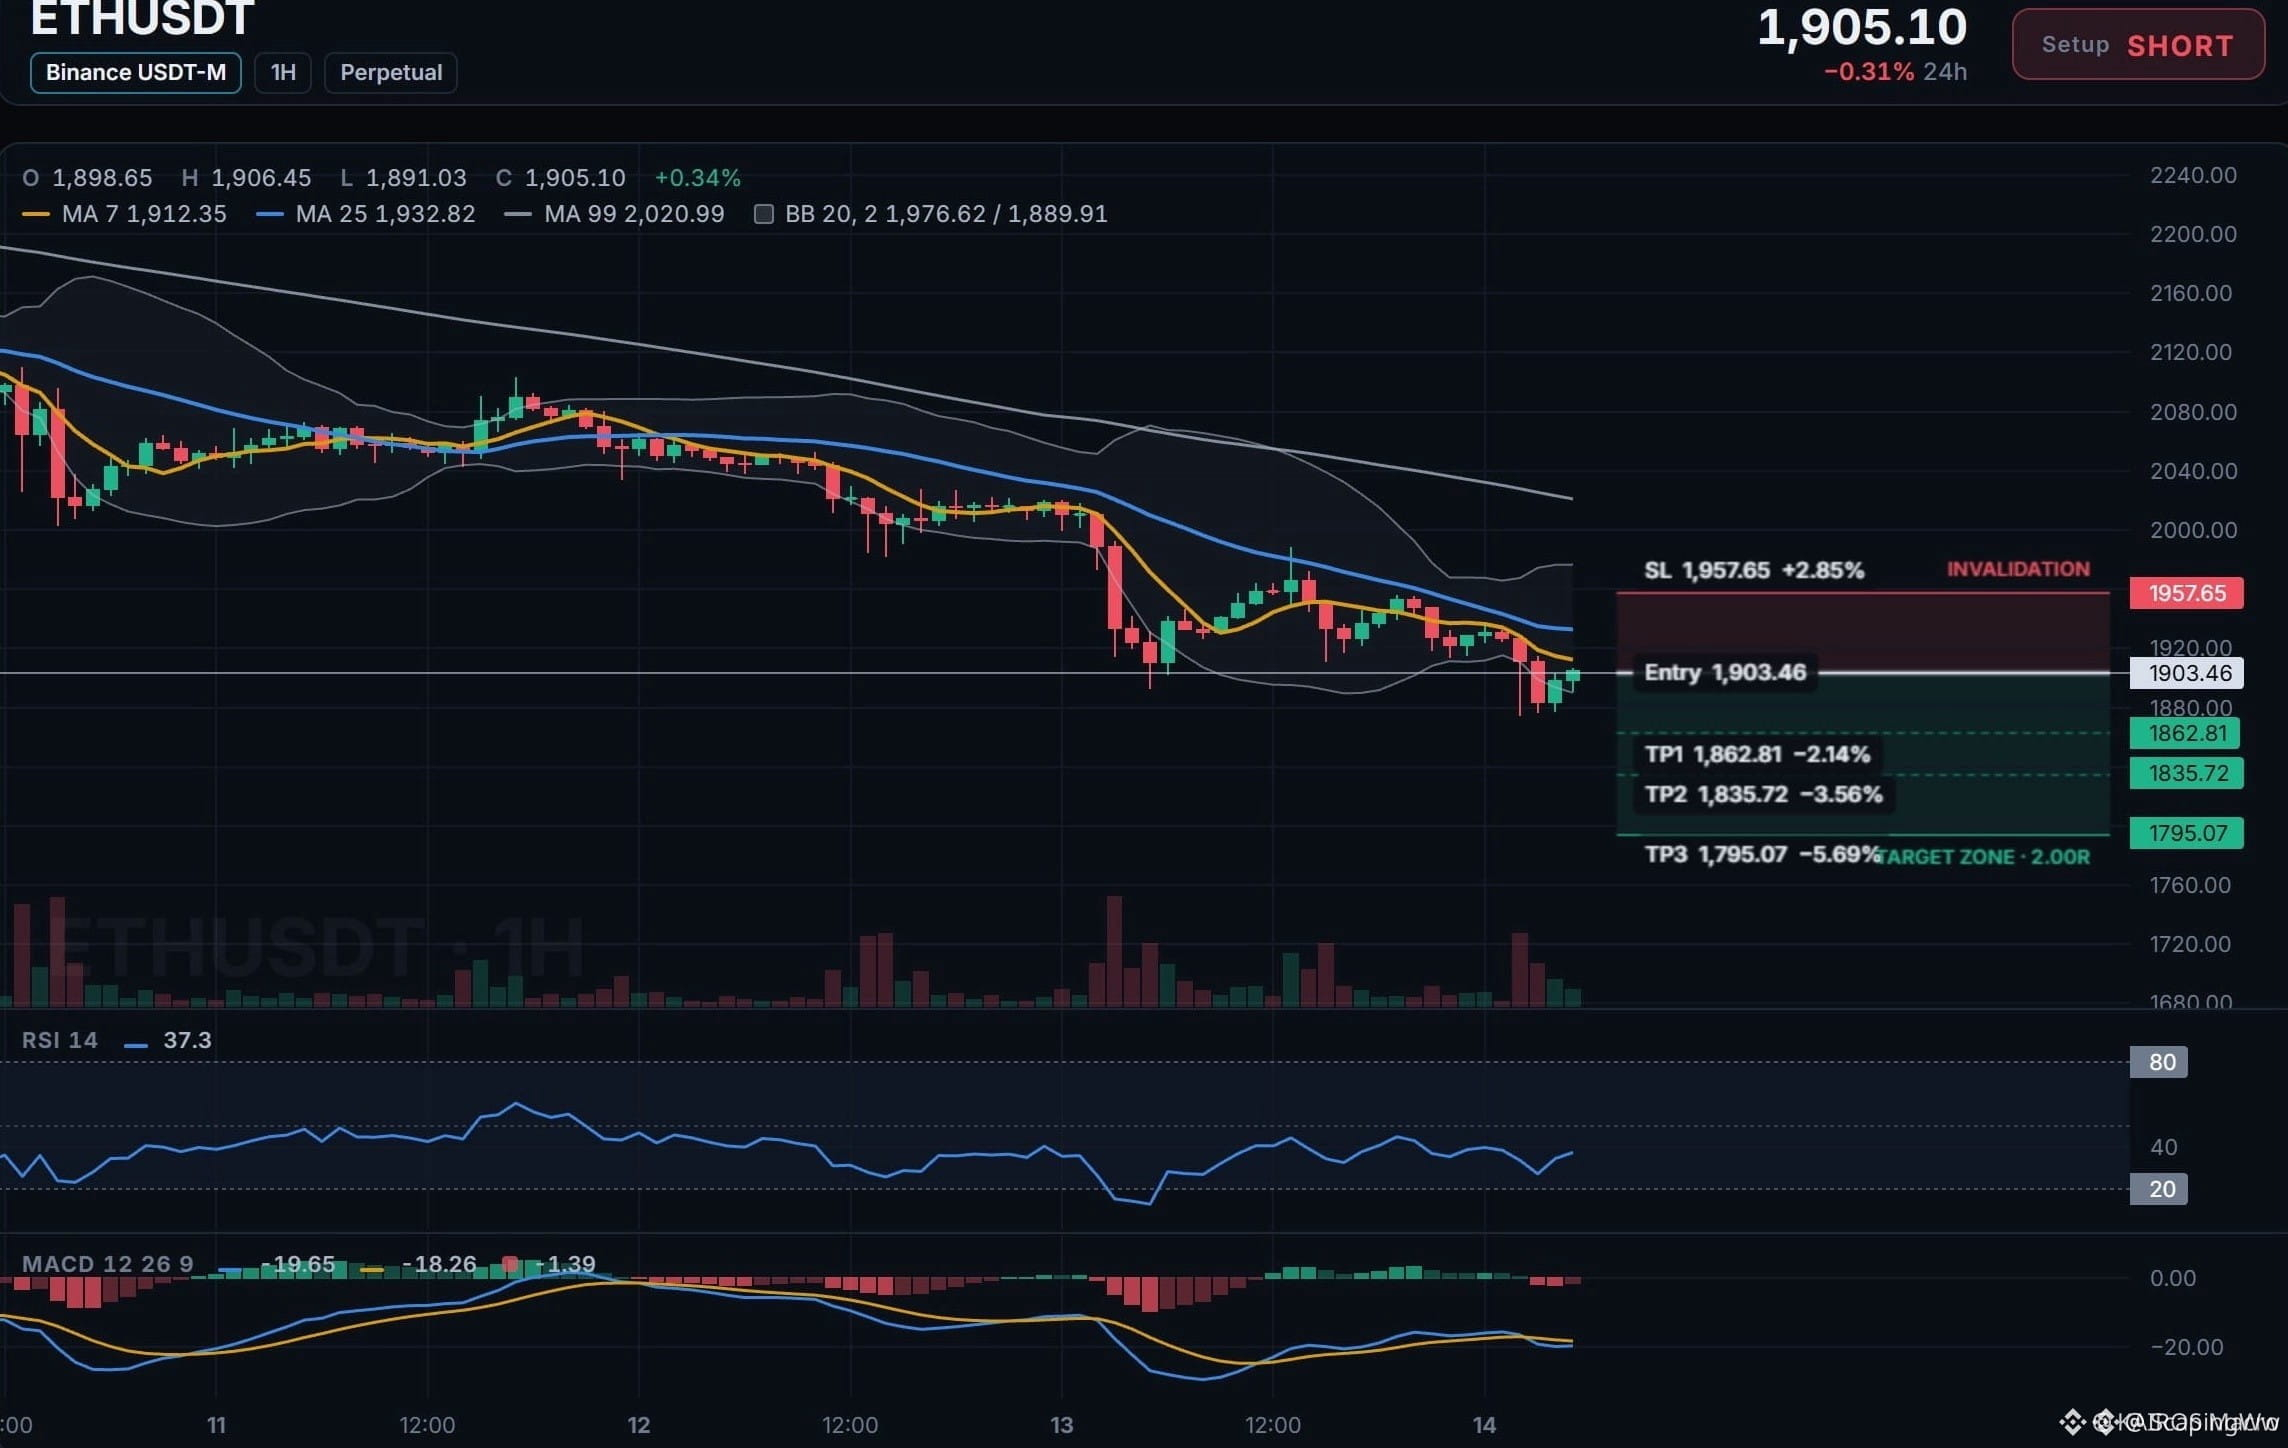
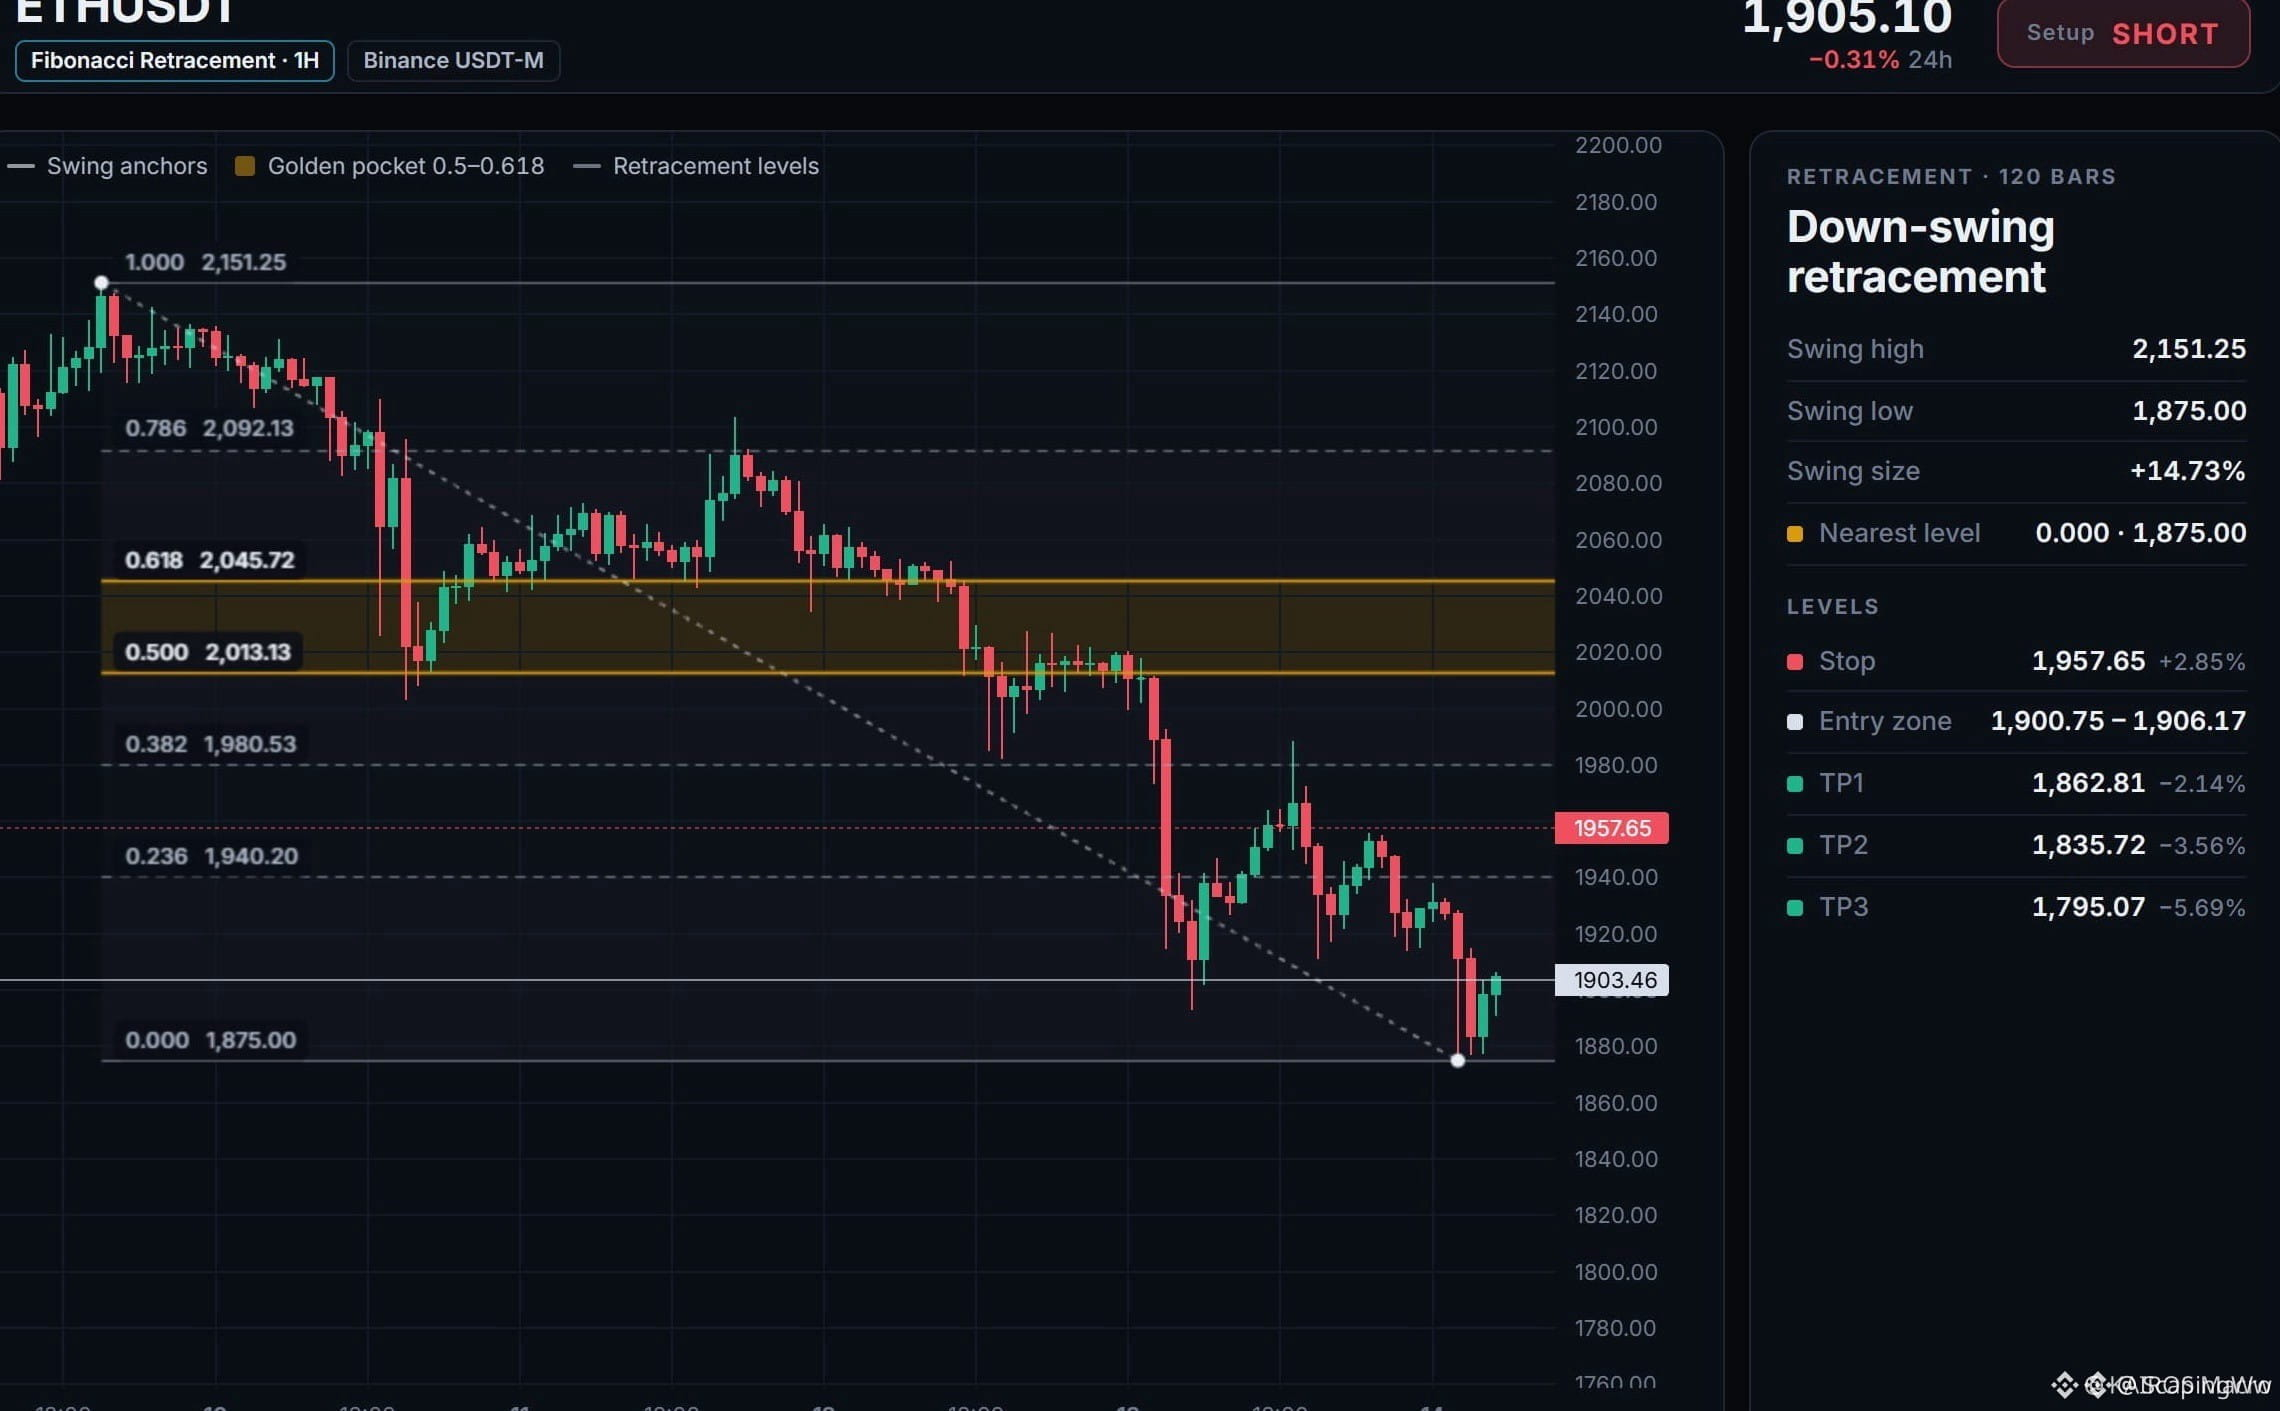
🐻 $ETH BEARS CRUSH THE EMA DESPITE RSI SITTING IN OVERSOLD TERRITORY! 📉
Entry: 1900.75 - 1906.17 ⚡
Target: 1862.81 🚀
Stop Loss: 1957.65 ⚠️
Sellers are currently driving the 4H chart with absolute dominance, slicing through key moving averages while momentum stays heavy. 📊
RSI is flashing 24.9 in deep oversold waters, meaning a violent relief bounce could catch late shorts off guard at any moment. ⚡ My game plan is locking in half the position at the first target and immediately sliding risk to breakeven. 🛡️
💬 Are you riding this downward momentum or bracing for a sharp counter-trend squeeze? 👇
⚠️ Not financial advice. Always manage your risk. 🛡️
🏷️ #ETH #ShortSetup #CryptoTrading #MarketAnalysis
🦈 ⚡
🐻 $ETH BEARS CRUSH THE EMA DESPITE RSI SITTING IN OVERSOLD TERRITORY! 📉
Entry: 1900.75 - 1906.17 ⚡
Target: 1862.81 🚀
Stop Loss: 1957.65 ⚠️
Sellers are currently driving the 4H chart with absolute dominance, slicing through key moving averages while momentum stays heavy. 📊
RSI is flashing 24.9 in deep oversold waters, meaning a violent relief bounce could catch late shorts off guard at any moment. ⚡ My game plan is locking in half the position at the first target and immediately sliding risk to breakeven. 🛡️
💬 Are you riding this downward momentum or bracing for a sharp counter-trend squeeze? 👇
⚠️ Not financial advice. Always manage your risk. 🛡️
🏷️ #ETH #ShortSetup #CryptoTrading #MarketAnalysis
🦈 ⚡
Entry: 1900.75 - 1906.17 ⚡
Target: 1862.81 🚀
Stop Loss: 1957.65 ⚠️
Sellers are currently driving the 4H chart with absolute dominance, slicing through key moving averages while momentum stays heavy. 📊
RSI is flashing 24.9 in deep oversold waters, meaning a violent relief bounce could catch late shorts off guard at any moment. ⚡ My game plan is locking in half the position at the first target and immediately sliding risk to breakeven. 🛡️
💬 Are you riding this downward momentum or bracing for a sharp counter-trend squeeze? 👇
⚠️ Not financial advice. Always manage your risk. 🛡️
🏷️ #ETH #ShortSetup #CryptoTrading #MarketAnalysis
🦈 ⚡
10
·
--
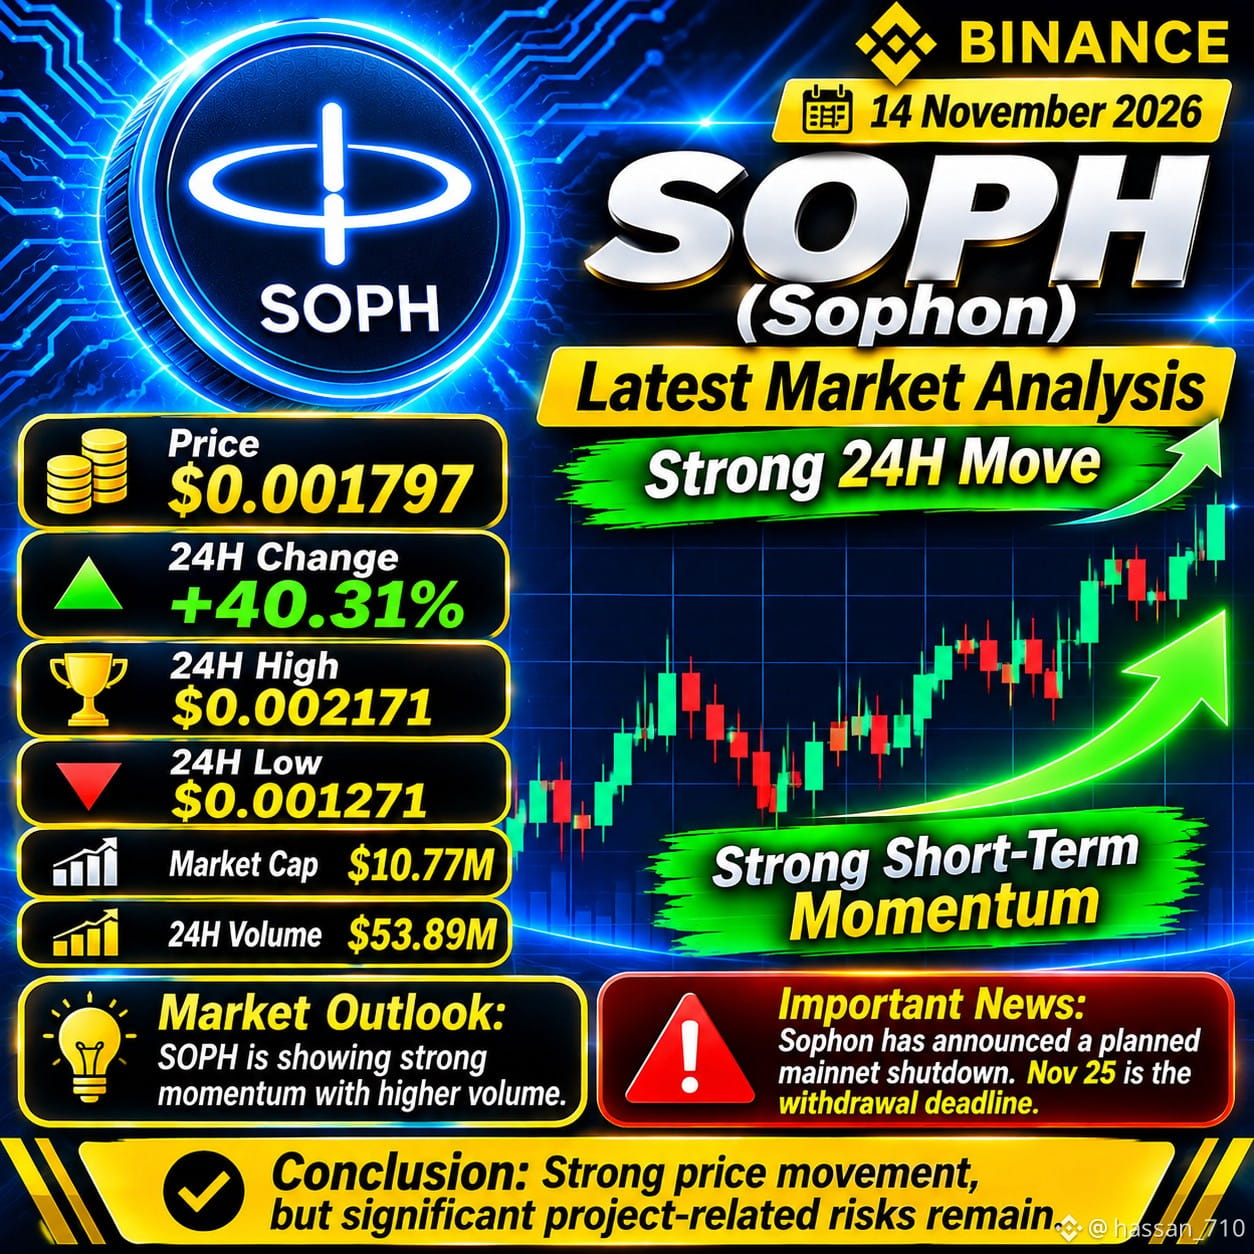
$SOPH LATEST MARKET ANALYSIS 🚀
📅 14 November 2026
💰 Price: $0.001797
📈 24H Change: +40.31%
📊 24H High: $0.002171
📉 24H Low: $0.001271
💎 Market Cap: $10.77M
📊 24H Volume: $53.89M
Market Outlook:
$SOPH is showing strong short-term momentum, with increased trading volume.
⚠️ Important News: Sophon has announced a planned mainnet shutdown. November 25 is the reported withdrawal deadline for assets on its old chain. SOPH on Ethereum is a separate consideration.
Conclusion: Strong price movement, but significant project-related risks remain.
$SOPH #Sophon #WhatWillDriveCryptoandStocks’NextRebound? #SOPH #CryptoUpdate #MarketAnalysis
{spot}(SOPHUSDT)
$SOPH LATEST MARKET ANALYSIS 🚀
📅 14 November 2026
💰 Price: $0.001797
📈 24H Change: +40.31%
📊 24H High: $0.002171
📉 24H Low: $0.001271
💎 Market Cap: $10.77M
📊 24H Volume: $53.89M
Market Outlook:
$SOPH is showing strong short-term momentum, with increased trading volume.
⚠️ Important News: Sophon has announced a planned mainnet shutdown. November 25 is the reported withdrawal deadline for assets on its old chain. SOPH on Ethereum is a separate consideration.
Conclusion: Strong price movement, but significant project-related risks remain.
$SOPH #Sophon #WhatWillDriveCryptoandStocks’NextRebound? #SOPH #CryptoUpdate #MarketAnalysis
📅 14 November 2026
💰 Price: $0.001797
📈 24H Change: +40.31%
📊 24H High: $0.002171
📉 24H Low: $0.001271
💎 Market Cap: $10.77M
📊 24H Volume: $53.89M
Market Outlook:
$SOPH is showing strong short-term momentum, with increased trading volume.
⚠️ Important News: Sophon has announced a planned mainnet shutdown. November 25 is the reported withdrawal deadline for assets on its old chain. SOPH on Ethereum is a separate consideration.
Conclusion: Strong price movement, but significant project-related risks remain.
$SOPH #Sophon #WhatWillDriveCryptoandStocks’NextRebound? #SOPH #CryptoUpdate #MarketAnalysis
131

·
--
$NU
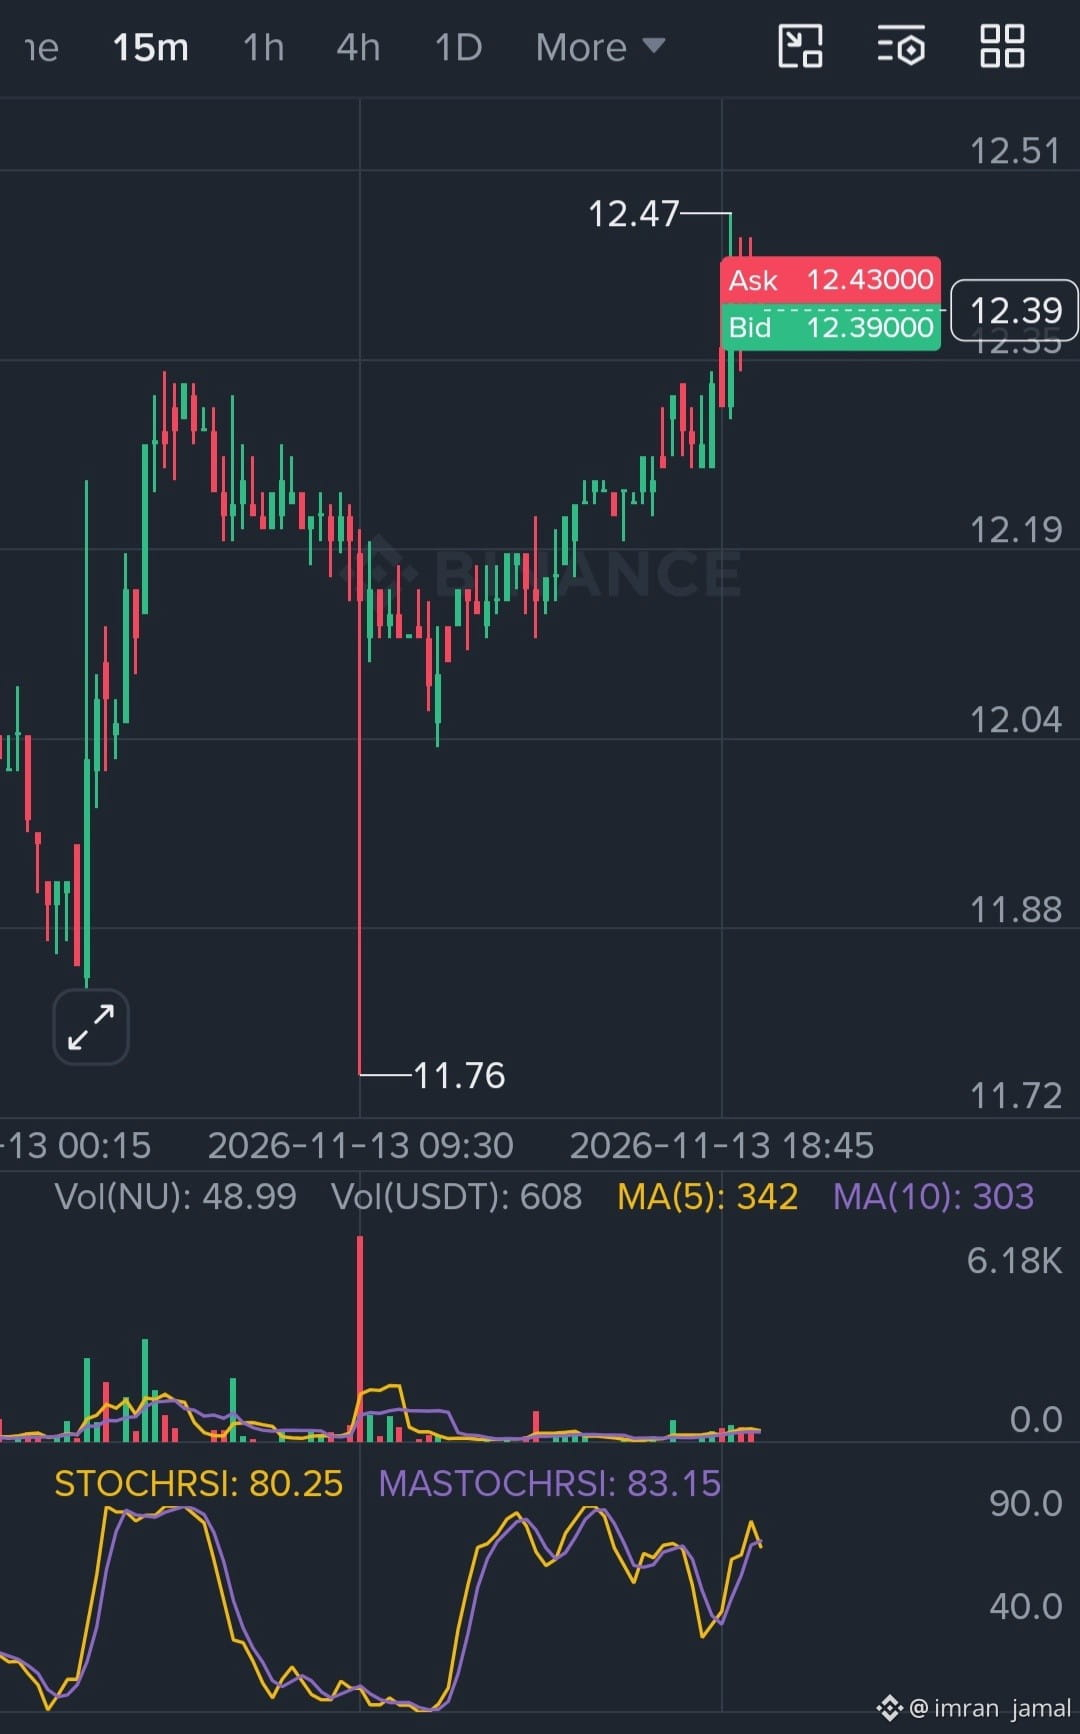
📊 NUUSDT Market Analysis – Latest Update
NUUSDT is showing mixed market momentum after its recent Binance Futures listing. Buyers are showing interest, but volatility and short-term selling pressure remain important factors.
Support: $11.83 – $12.00
Resistance: $12.35 – $12.41
Bullish Signal: Breakout above $12.41 with strong volume.
Bearish Signal: Breakdown below $11.83.
Market Outlook: Neutral to bullish if buyers defend support. Watch volume confirmation before entering a trade.
⚠️ Trade carefully and always use a stop-loss.
#MarketAnalysis #Benince #NUUSDT #Altcoins!
{future}(NUUSDT)
$NU
📊 NUUSDT Market Analysis – Latest Update
NUUSDT is showing mixed market momentum after its recent Binance Futures listing. Buyers are showing interest, but volatility and short-term selling pressure remain important factors.
Support: $11.83 – $12.00
Resistance: $12.35 – $12.41
Bullish Signal: Breakout above $12.41 with strong volume.
Bearish Signal: Breakdown below $11.83.
Market Outlook: Neutral to bullish if buyers defend support. Watch volume confirmation before entering a trade.
⚠️ Trade carefully and always use a stop-loss.
#MarketAnalysis #Benince #NUUSDT #Altcoins!
📊 NUUSDT Market Analysis – Latest Update
NUUSDT is showing mixed market momentum after its recent Binance Futures listing. Buyers are showing interest, but volatility and short-term selling pressure remain important factors.
Support: $11.83 – $12.00
Resistance: $12.35 – $12.41
Bullish Signal: Breakout above $12.41 with strong volume.
Bearish Signal: Breakdown below $11.83.
Market Outlook: Neutral to bullish if buyers defend support. Watch volume confirmation before entering a trade.
⚠️ Trade carefully and always use a stop-loss.
#MarketAnalysis #Benince #NUUSDT #Altcoins!
418

·
--
🚨 BITCOIN ALERT: BTC Sweeps $67.5K! Eyes Now on the Weekly Close.
$BTC just swept $67,539 and is trading near $69,350 as we head into a massive weekly close. 🎯
After peaking at $126.2K and carving out a macro floor at $57.8K, Bitcoin is now testing a critical weekly support cluster between $66,000 and $69,000.
Sunday’s weekly candle close decides the next big trend:
🟢 Close above $72.5K–$74.4K: Confirms a bear trap/liquidity grab and sets up a bounce back toward $78K–$81K.
🔴 Close below $66,000: Breaks weekly structure and opens the door to $60K–$62K.
Don't chase weekend noise, let Sunday’s candle show its hand first. 📊
Where do you see $BTC closing this Sunday, above $72.5K or below $66K? 👇
#bitcoin #BTC #cryptotrading #MarketAnalysis
🚨 BITCOIN ALERT: BTC Sweeps $67.5K! Eyes Now on the Weekly Close.
$BTC just swept $67,539 and is trading near $69,350 as we head into a massive weekly close. 🎯
After peaking at $126.2K and carving out a macro floor at $57.8K, Bitcoin is now testing a critical weekly support cluster between $66,000 and $69,000.
Sunday’s weekly candle close decides the next big trend:
🟢 Close above $72.5K–$74.4K: Confirms a bear trap/liquidity grab and sets up a bounce back toward $78K–$81K.
🔴 Close below $66,000: Breaks weekly structure and opens the door to $60K–$62K.
Don't chase weekend noise, let Sunday’s candle show its hand first. 📊
Where do you see $BTC closing this Sunday, above $72.5K or below $66K? 👇
#bitcoin #BTC #cryptotrading #MarketAnalysis
$BTC just swept $67,539 and is trading near $69,350 as we head into a massive weekly close. 🎯
After peaking at $126.2K and carving out a macro floor at $57.8K, Bitcoin is now testing a critical weekly support cluster between $66,000 and $69,000.
Sunday’s weekly candle close decides the next big trend:
🟢 Close above $72.5K–$74.4K: Confirms a bear trap/liquidity grab and sets up a bounce back toward $78K–$81K.
🔴 Close below $66,000: Breaks weekly structure and opens the door to $60K–$62K.
Don't chase weekend noise, let Sunday’s candle show its hand first. 📊
Where do you see $BTC closing this Sunday, above $72.5K or below $66K? 👇
#bitcoin #BTC #cryptotrading #MarketAnalysis
Trader M08:
Your 74.4K line sits right next to this week's open. Binance spot opened the week at 74,851 and printed a 67,568 low, so a close above that zone would turn a candle that fell almost 10% into a long lower wick. It would also end a run of three straight red weekly closes that started from the 82,116 open on Oct 19.
1
3
233

·
--

Article
BITCOIN: NORMAL CORRECTION OR THE BEGINNING OF A MAJOR MARKET COLLAPSE?A Professional Analysis of Market Structure, Institutional Capital, Global Liquidity, and What Could Come Next
The cryptocurrency market is facing another serious test. Bitcoin has come under renewed selling pressure, major altcoins have weakened, and investors are increasingly questioning whether the current decline represents a temporary correction or the beginning of a much deeper bearish cycle.
This is an important distinction. A correction is a normal part of financial markets, while a structural collapse suggests that the foundations supporting an asset or an entire market are deteriorating.
Confusing the two can lead to poor investment decisions. Buying every decline without understanding the market can expose investors to unnecessary losses. Selling everything during a temporary correction can also mean abandoning positions without sufficient evidence.
My objective here is not to predict an exact bottom or promise an immediate recovery. It is to examine the factors behind the decline, identify the warning signs, and establish what investors should monitor before making their next decision.
1. WHAT IS REALLY HAPPENING TO BITCOIN?
Bitcoin's recent decline should not be viewed in isolation. The broader cryptocurrency market is experiencing pressure from several interconnected factors, including weaker institutional demand, uncertainty surrounding monetary policy, changing investor appetite for risk, and volatility across global financial markets.
Bitcoin has become increasingly connected to traditional financial markets. Institutional investors can now gain exposure through regulated investment products, while professional trading firms use derivatives and sophisticated risk-management strategies.
This wider participation has increased market accessibility, but it has also made Bitcoin more sensitive to changes in global liquidity and investor positioning.
When investors become concerned about economic conditions, they often reduce exposure to assets considered more volatile. Cryptocurrency can therefore experience selling pressure even when its underlying technology and network operations remain healthy.
The important question is not simply how much Bitcoin has declined, but why investors are selling and whether genuine demand is returning.
2. THE INFLUENCE OF INSTITUTIONAL INVESTORS
Institutional participation has become one of the most important components of the modern Bitcoin market.
Spot Bitcoin ETFs created a convenient investment channel for traditional investors, allowing them to obtain price exposure without directly managing cryptocurrency wallets.
However, institutional participation is not permanently bullish. Capital can enter during periods of confidence and leave when investment conditions change.
Persistent ETF withdrawals can reduce an important source of Spot market demand. When selling from investment products coincides with weaker participation from individual investors, the market may struggle to recover.
It is equally important not to interpret every withdrawal as a permanent loss of confidence. Portfolio rebalancing, profit-taking, risk reduction, and changing investment strategies can all influence institutional flows.
What matters is the broader trend.
Are withdrawals continuing? Are new inflows returning? Is Spot demand strong enough to absorb available supply?
These are more useful questions than assuming institutions are either abandoning Bitcoin or accumulating it at every lower price.
3. GLOBAL LIQUIDITY: THE FACTOR THAT CONNECTS CRYPTO TO THE WORLD ECONOMY
One of the most underestimated influences on cryptocurrency valuations is global liquidity.
Bitcoin is often discussed as an alternative monetary asset, but its market price is also influenced by the availability and cost of capital.
When interest rates are high, investors may prefer traditional interest-bearing assets. When monetary conditions become restrictive, speculative investments can become less attractive.
Inflation is another important variable. If inflation remains persistent, central banks may have less flexibility to reduce interest rates. This can maintain pressure on financial assets that depend heavily on investor confidence and liquidity.
The Federal Reserve's policy expectations therefore matter to cryptocurrency investors, even though the central bank does not directly determine Bitcoin's price.
A more supportive monetary environment could improve demand for risk assets. Conversely, persistent inflation and tighter financial conditions could extend the current period of weakness.
Bitcoin may operate independently of any single government or central bank, but its market valuation does not operate independently of the global financial system.
4. AI INVESTMENT AND THE ROTATION OF GLOBAL CAPITAL
Another development worth monitoring is the changing relationship between cryptocurrency and technology-sector investments.
Artificial intelligence has become a major destination for institutional capital. Large technology companies are committing substantial resources to data centres, computing infrastructure, semiconductors, and AI development.
These investments have attracted considerable market attention, but they have also raised questions about valuations, capital expenditure, future profitability, and the sustainability of expected returns.
When investors reassess technology valuations, capital can move rapidly between different asset classes.
Cryptocurrency can be affected by these changes through broader risk appetite, portfolio rebalancing, and liquidity conditions.
It would be inaccurate to claim that AI investment alone is responsible for Bitcoin's decline. The relationship is more complicated.
However, the competition for institutional capital is real. Cryptocurrency must attract investment based on its own economic value, adoption, and long-term potential.
The next market phase may reveal whether investors are reducing their overall exposure to risk or simply reallocating capital toward other opportunities.
5. THE DANGERS OF LEVERAGE AND FORCED LIQUIDATIONS
Derivatives trading can amplify market movements.
When traders use leverage, relatively small price changes can have a significant impact on their positions. If the market moves against them, margin requirements increase and positions may be automatically liquidated.
This creates a potential chain reaction:
Bitcoin begins declining.Leveraged long positions experience increasing losses.Margin positions approach liquidation thresholds.Forced selling adds pressure to the market.Additional price declines trigger further liquidations.
This process can make a correction more severe than the initial selling pressure would otherwise justify.
However, liquidations are not automatically evidence of a market collapse. They can also remove excessive leverage and reduce speculative positioning.
The important distinction is whether the market stabilizes after forced selling or whether genuine Spot demand remains insufficient.
Investors should pay attention to open interest, funding rates, liquidation activity, and Spot trading volume rather than relying on price movements alone.
A market recovery supported by genuine Spot buying is generally more convincing than one driven primarily by the closure of leveraged short positions.
6. WHY ALTCOINS ARE OFTEN MORE VULNERABLE
Bitcoin remains the dominant reference point for the cryptocurrency market, but alternative cryptocurrencies frequently experience larger percentage movements during periods of uncertainty.
This is partly related to differences in market capitalization, liquidity, investor participation, and token economics.
When investors become defensive, they often reduce exposure to smaller and more speculative assets first.
Consequently, altcoins can experience sharper declines even when their respective projects continue developing.
This is particularly important when evaluating assets such as ETH, SOL, and NEAR.
Each has a different ecosystem, technological purpose, adoption profile, and economic model. Their investment potential should not be judged exclusively by Bitcoin's daily movement.
At the same time, a strong technology project does not automatically guarantee a recovering token price.
Investors must distinguish between the quality of a blockchain project and the valuation of its associated cryptocurrency.
The next recovery may reward projects with genuine utility, sustainable adoption, strong development activity, and healthy liquidity rather than every token that participated in the previous market rally.
7. NORMAL CORRECTION OR STRUCTURAL COLLAPSE?
This is the central question.
A normal correction involves a decline in market prices without a fundamental breakdown in the underlying asset or financial infrastructure.
It may be caused by profit-taking, changes in liquidity, excessive leverage, macroeconomic uncertainty, or temporary imbalances between buyers and sellers.
A structural collapse is considerably more serious. It involves deterioration in the foundations supporting market confidence, such as major custody failures, systemic exchange problems, persistent liquidity breakdowns, severe stablecoin disruptions, or fundamental damage to important networks.
The current price decline alone cannot establish that such a collapse is taking place.
Bitcoin continues to operate as a network, cryptocurrency exchanges continue facilitating trading, and the broader blockchain ecosystem remains active.
These observations do not eliminate investment risk. They simply mean that falling prices should not automatically be treated as evidence of a failed financial infrastructure.
There is also a third possibility that investors should not overlook: an extended bear market.
A prolonged bear market can develop without a systemic collapse. Prices may remain depressed, institutional participation may weaken, and speculative interest may decline over an extended period.
This possibility deserves serious consideration.
The market does not have to collapse completely for investors to experience a prolonged and difficult period of losses.
8. THREE POSSIBLE MARKET SCENARIOS
SCENARIO ONE: A HEALTHY CORRECTION AND GRADUAL RECOVERY
Selling pressure begins to weaken, Spot demand improves, institutional withdrawals stabilize, and Bitcoin gradually reclaims important technical levels.
Under this scenario, the current decline could become a correction within a broader market cycle.
However, a sustainable recovery would require confirmation from market participation rather than a temporary price bounce.
SCENARIO TWO: AN EXTENDED BEARISH MARKET
Institutional demand remains weak, monetary conditions stay restrictive, and investors continue reducing exposure to speculative assets.
Bitcoin may experience repeated recovery attempts followed by renewed selling, while altcoins remain under greater pressure.
This scenario would represent a prolonged bearish environment, but not necessarily a collapse of the cryptocurrency ecosystem.
SCENARIO THREE: A STRUCTURAL MARKET BREAKDOWN
Liquidity deteriorates significantly, major financial infrastructure experiences serious failures, institutional confidence weakens further, and important long-term market structures break down.
Under this scenario, the decline could develop into a much more serious market event.
This is a risk that investors should monitor, not a conclusion that can be justified by price declines alone.
9. WHAT SHOULD INVESTORS WATCH NOW?
Rather than attempting to predict every market movement, investors should monitor a combination of indicators.
Spot Market Demand: Are buyers entering the market, or are price increases primarily driven by derivatives activity?
Institutional Flows: Are ETF withdrawals slowing, stabilizing, or turning into sustained inflows?
Market Liquidity: Is trading depth improving, and can the market absorb selling without excessive price movements?
Derivatives Positioning: Is excessive leverage being reduced, or is speculative exposure rebuilding too quickly?
Macroeconomic Conditions: Are inflation, interest-rate expectations, and global liquidity becoming more supportive?
Bitcoin Market Structure: Are important support and resistance areas being respected, and are recovery attempts supported by meaningful trading volume?
No single indicator should determine an investment decision. The strongest conclusions come from several independent signals pointing in the same direction.
10. MY APPROACH TO SPOT INVESTING DURING THIS DECLINE
Market uncertainty requires discipline, not emotional reactions.
I believe capital preservation should remain the first priority, especially when the direction of the market is unclear.
For Spot investors, several principles are worth considering:
Do Not Commit All Capital at Once: A market that appears inexpensive today may become cheaper tomorrow. Maintaining available liquidity provides flexibility.
Consider Staggered Entries: Dividing an intended investment into several stages can reduce dependence on one entry price.
Prioritize Quality: Focus on established networks, real adoption, liquidity, security, and credible long-term development.
Avoid Unnecessary Leverage: Spot ownership avoids leverage-driven liquidation when assets are fully funded, although the market value can still decline substantially.
Reassess Every Position: Holding an asset should be based on a continuing investment thesis, not simply the hope of recovering an earlier entry price.
Separate Investment From Speculation: Short-term volatility and long-term investment objectives require different approaches.
The objective is not to identify the exact bottom. It is to maintain sufficient flexibility to make informed decisions when stronger market evidence becomes available.
11. THE BIGGER PICTURE: IS THE CRYPTO INDUSTRY LOSING ITS FUTURE?
A decline in cryptocurrency valuations should not automatically be confused with a decline in blockchain technology itself.
The cryptocurrency industry continues to evolve across several areas, including decentralized finance, tokenization, stablecoins, institutional custody, payment infrastructure, and blockchain-based applications.
These developments have their own adoption cycles and commercial challenges.
A market correction may expose projects that relied excessively on speculation rather than genuine utility.
It may also encourage stronger risk management, more sustainable token economics, and better standards across the industry.
However, technological progress does not guarantee that every cryptocurrency will increase in value.
Investors must remain selective and recognize that some projects may never recover their previous market valuations.
The long-term future of blockchain technology and the short-term direction of cryptocurrency prices are related, but they are not the same question.
12. FINAL ASSESSMENT: CAUTION WITHOUT PANIC
My assessment is that the current market environment deserves serious caution. Weak institutional demand, uncertainty surrounding global liquidity, volatility in technology investments, and the effects of leveraged trading can combine to create further downside pressure.
However, a confirmed systemic collapse cannot be established from these developments alone.
The market must demonstrate whether buyers are returning, whether liquidity is stabilizing, and whether Bitcoin can establish a more sustainable price structure.
I would not treat every decline as a buying opportunity, nor would I assume that every recovery attempt represents the beginning of a new bull market.
Both approaches ignore the importance of evidence.
The most responsible position is to remain flexible, protect capital, monitor market conditions, and avoid decisions driven by fear or excessive optimism.
A correction is not a collapse. A bear market is not necessarily the end of an industry. But neither is a lower price a guarantee of future profit.
CONCLUSION: THE NEXT MOVE WILL BE DECIDED BY EVIDENCE
Bitcoin is facing a meaningful test of market confidence.
Institutional flows, global liquidity, investor positioning, and the behavior of traditional financial markets will all influence what happens next.
The coming period should be approached with patience and a clear understanding of risk.
For long-term investors, this is a time to evaluate fundamentals and maintain financial flexibility. For short-term traders, it is a time to respect volatility and avoid unnecessary exposure.
My philosophy remains unchanged:
Capital preservation first. Analysis before action. Discipline over emotion.
The strongest investors are not those who predict every market movement correctly. They are those who manage risk effectively, recognize changing conditions, and remain prepared for more than one possible outcome.
{spot}(BTCUSDT)
{spot}(ETHUSDT)
{spot}(NEARUSDT)
$BTC $ETH $NEAR
This article represents independent market commentary and educational analysis. It is not financial advice, a guarantee of market direction, or a recommendation to buy or sell any digital asset. Market conditions can change rapidly; always conduct your own research.
#CryptoMarket #NEAR #MarketAnalysis #RiskManagem #TripsSam
BITCOIN: NORMAL CORRECTION OR THE BEGINNING OF A MAJOR MARKET COLLAPSE?
A Professional Analysis of Market Structure, Institutional Capital, Global Liquidity, and What Could Come Next
The cryptocurrency market is facing another serious test. Bitcoin has come under renewed selling pressure, major altcoins have weakened, and investors are increasingly questioning whether the current decline represents a temporary correction or the beginning of a much deeper bearish cycle.
This is an important distinction. A correction is a normal part of financial markets, while a structural collapse suggests that the foundations supporting an asset or an entire market are deteriorating.
Confusing the two can lead to poor investment decisions. Buying every decline without understanding the market can expose investors to unnecessary losses. Selling everything during a temporary correction can also mean abandoning positions without sufficient evidence.
My objective here is not to predict an exact bottom or promise an immediate recovery. It is to examine the factors behind the decline, identify the warning signs, and establish what investors should monitor before making their next decision.
1. WHAT IS REALLY HAPPENING TO BITCOIN?
Bitcoin's recent decline should not be viewed in isolation. The broader cryptocurrency market is experiencing pressure from several interconnected factors, including weaker institutional demand, uncertainty surrounding monetary policy, changing investor appetite for risk, and volatility across global financial markets.
Bitcoin has become increasingly connected to traditional financial markets. Institutional investors can now gain exposure through regulated investment products, while professional trading firms use derivatives and sophisticated risk-management strategies.
This wider participation has increased market accessibility, but it has also made Bitcoin more sensitive to changes in global liquidity and investor positioning.
When investors become concerned about economic conditions, they often reduce exposure to assets considered more volatile. Cryptocurrency can therefore experience selling pressure even when its underlying technology and network operations remain healthy.
The important question is not simply how much Bitcoin has declined, but why investors are selling and whether genuine demand is returning.
2. THE INFLUENCE OF INSTITUTIONAL INVESTORS
Institutional participation has become one of the most important components of the modern Bitcoin market.
Spot Bitcoin ETFs created a convenient investment channel for traditional investors, allowing them to obtain price exposure without directly managing cryptocurrency wallets.
However, institutional participation is not permanently bullish. Capital can enter during periods of confidence and leave when investment conditions change.
Persistent ETF withdrawals can reduce an important source of Spot market demand. When selling from investment products coincides with weaker participation from individual investors, the market may struggle to recover.
It is equally important not to interpret every withdrawal as a permanent loss of confidence. Portfolio rebalancing, profit-taking, risk reduction, and changing investment strategies can all influence institutional flows.
What matters is the broader trend.
Are withdrawals continuing? Are new inflows returning? Is Spot demand strong enough to absorb available supply?
These are more useful questions than assuming institutions are either abandoning Bitcoin or accumulating it at every lower price.
3. GLOBAL LIQUIDITY: THE FACTOR THAT CONNECTS CRYPTO TO THE WORLD ECONOMY
One of the most underestimated influences on cryptocurrency valuations is global liquidity.
Bitcoin is often discussed as an alternative monetary asset, but its market price is also influenced by the availability and cost of capital.
When interest rates are high, investors may prefer traditional interest-bearing assets. When monetary conditions become restrictive, speculative investments can become less attractive.
Inflation is another important variable. If inflation remains persistent, central banks may have less flexibility to reduce interest rates. This can maintain pressure on financial assets that depend heavily on investor confidence and liquidity.
The Federal Reserve's policy expectations therefore matter to cryptocurrency investors, even though the central bank does not directly determine Bitcoin's price.
A more supportive monetary environment could improve demand for risk assets. Conversely, persistent inflation and tighter financial conditions could extend the current period of weakness.
Bitcoin may operate independently of any single government or central bank, but its market valuation does not operate independently of the global financial system.
4. AI INVESTMENT AND THE ROTATION OF GLOBAL CAPITAL
Another development worth monitoring is the changing relationship between cryptocurrency and technology-sector investments.
Artificial intelligence has become a major destination for institutional capital. Large technology companies are committing substantial resources to data centres, computing infrastructure, semiconductors, and AI development.
These investments have attracted considerable market attention, but they have also raised questions about valuations, capital expenditure, future profitability, and the sustainability of expected returns.
When investors reassess technology valuations, capital can move rapidly between different asset classes.
Cryptocurrency can be affected by these changes through broader risk appetite, portfolio rebalancing, and liquidity conditions.
It would be inaccurate to claim that AI investment alone is responsible for Bitcoin's decline. The relationship is more complicated.
However, the competition for institutional capital is real. Cryptocurrency must attract investment based on its own economic value, adoption, and long-term potential.
The next market phase may reveal whether investors are reducing their overall exposure to risk or simply reallocating capital toward other opportunities.
5. THE DANGERS OF LEVERAGE AND FORCED LIQUIDATIONS
Derivatives trading can amplify market movements.
When traders use leverage, relatively small price changes can have a significant impact on their positions. If the market moves against them, margin requirements increase and positions may be automatically liquidated.
This creates a potential chain reaction:
Bitcoin begins declining.Leveraged long positions experience increasing losses.Margin positions approach liquidation thresholds.Forced selling adds pressure to the market.Additional price declines trigger further liquidations.
This process can make a correction more severe than the initial selling pressure would otherwise justify.
However, liquidations are not automatically evidence of a market collapse. They can also remove excessive leverage and reduce speculative positioning.
The important distinction is whether the market stabilizes after forced selling or whether genuine Spot demand remains insufficient.
Investors should pay attention to open interest, funding rates, liquidation activity, and Spot trading volume rather than relying on price movements alone.
A market recovery supported by genuine Spot buying is generally more convincing than one driven primarily by the closure of leveraged short positions.
6. WHY ALTCOINS ARE OFTEN MORE VULNERABLE
Bitcoin remains the dominant reference point for the cryptocurrency market, but alternative cryptocurrencies frequently experience larger percentage movements during periods of uncertainty.
This is partly related to differences in market capitalization, liquidity, investor participation, and token economics.
When investors become defensive, they often reduce exposure to smaller and more speculative assets first.
Consequently, altcoins can experience sharper declines even when their respective projects continue developing.
This is particularly important when evaluating assets such as ETH, SOL, and NEAR.
Each has a different ecosystem, technological purpose, adoption profile, and economic model. Their investment potential should not be judged exclusively by Bitcoin's daily movement.
At the same time, a strong technology project does not automatically guarantee a recovering token price.
Investors must distinguish between the quality of a blockchain project and the valuation of its associated cryptocurrency.
The next recovery may reward projects with genuine utility, sustainable adoption, strong development activity, and healthy liquidity rather than every token that participated in the previous market rally.
7. NORMAL CORRECTION OR STRUCTURAL COLLAPSE?
This is the central question.
A normal correction involves a decline in market prices without a fundamental breakdown in the underlying asset or financial infrastructure.
It may be caused by profit-taking, changes in liquidity, excessive leverage, macroeconomic uncertainty, or temporary imbalances between buyers and sellers.
A structural collapse is considerably more serious. It involves deterioration in the foundations supporting market confidence, such as major custody failures, systemic exchange problems, persistent liquidity breakdowns, severe stablecoin disruptions, or fundamental damage to important networks.
The current price decline alone cannot establish that such a collapse is taking place.
Bitcoin continues to operate as a network, cryptocurrency exchanges continue facilitating trading, and the broader blockchain ecosystem remains active.
These observations do not eliminate investment risk. They simply mean that falling prices should not automatically be treated as evidence of a failed financial infrastructure.
There is also a third possibility that investors should not overlook: an extended bear market.
A prolonged bear market can develop without a systemic collapse. Prices may remain depressed, institutional participation may weaken, and speculative interest may decline over an extended period.
This possibility deserves serious consideration.
The market does not have to collapse completely for investors to experience a prolonged and difficult period of losses.
8. THREE POSSIBLE MARKET SCENARIOS
SCENARIO ONE: A HEALTHY CORRECTION AND GRADUAL RECOVERY
Selling pressure begins to weaken, Spot demand improves, institutional withdrawals stabilize, and Bitcoin gradually reclaims important technical levels.
Under this scenario, the current decline could become a correction within a broader market cycle.
However, a sustainable recovery would require confirmation from market participation rather than a temporary price bounce.
SCENARIO TWO: AN EXTENDED BEARISH MARKET
Institutional demand remains weak, monetary conditions stay restrictive, and investors continue reducing exposure to speculative assets.
Bitcoin may experience repeated recovery attempts followed by renewed selling, while altcoins remain under greater pressure.
This scenario would represent a prolonged bearish environment, but not necessarily a collapse of the cryptocurrency ecosystem.
SCENARIO THREE: A STRUCTURAL MARKET BREAKDOWN
Liquidity deteriorates significantly, major financial infrastructure experiences serious failures, institutional confidence weakens further, and important long-term market structures break down.
Under this scenario, the decline could develop into a much more serious market event.
This is a risk that investors should monitor, not a conclusion that can be justified by price declines alone.
9. WHAT SHOULD INVESTORS WATCH NOW?
Rather than attempting to predict every market movement, investors should monitor a combination of indicators.
Spot Market Demand: Are buyers entering the market, or are price increases primarily driven by derivatives activity?
Institutional Flows: Are ETF withdrawals slowing, stabilizing, or turning into sustained inflows?
Market Liquidity: Is trading depth improving, and can the market absorb selling without excessive price movements?
Derivatives Positioning: Is excessive leverage being reduced, or is speculative exposure rebuilding too quickly?
Macroeconomic Conditions: Are inflation, interest-rate expectations, and global liquidity becoming more supportive?
Bitcoin Market Structure: Are important support and resistance areas being respected, and are recovery attempts supported by meaningful trading volume?
No single indicator should determine an investment decision. The strongest conclusions come from several independent signals pointing in the same direction.
10. MY APPROACH TO SPOT INVESTING DURING THIS DECLINE
Market uncertainty requires discipline, not emotional reactions.
I believe capital preservation should remain the first priority, especially when the direction of the market is unclear.
For Spot investors, several principles are worth considering:
Do Not Commit All Capital at Once: A market that appears inexpensive today may become cheaper tomorrow. Maintaining available liquidity provides flexibility.
Consider Staggered Entries: Dividing an intended investment into several stages can reduce dependence on one entry price.
Prioritize Quality: Focus on established networks, real adoption, liquidity, security, and credible long-term development.
Avoid Unnecessary Leverage: Spot ownership avoids leverage-driven liquidation when assets are fully funded, although the market value can still decline substantially.
Reassess Every Position: Holding an asset should be based on a continuing investment thesis, not simply the hope of recovering an earlier entry price.
Separate Investment From Speculation: Short-term volatility and long-term investment objectives require different approaches.
The objective is not to identify the exact bottom. It is to maintain sufficient flexibility to make informed decisions when stronger market evidence becomes available.
11. THE BIGGER PICTURE: IS THE CRYPTO INDUSTRY LOSING ITS FUTURE?
A decline in cryptocurrency valuations should not automatically be confused with a decline in blockchain technology itself.
The cryptocurrency industry continues to evolve across several areas, including decentralized finance, tokenization, stablecoins, institutional custody, payment infrastructure, and blockchain-based applications.
These developments have their own adoption cycles and commercial challenges.
A market correction may expose projects that relied excessively on speculation rather than genuine utility.
It may also encourage stronger risk management, more sustainable token economics, and better standards across the industry.
However, technological progress does not guarantee that every cryptocurrency will increase in value.
Investors must remain selective and recognize that some projects may never recover their previous market valuations.
The long-term future of blockchain technology and the short-term direction of cryptocurrency prices are related, but they are not the same question.
12. FINAL ASSESSMENT: CAUTION WITHOUT PANIC
My assessment is that the current market environment deserves serious caution. Weak institutional demand, uncertainty surrounding global liquidity, volatility in technology investments, and the effects of leveraged trading can combine to create further downside pressure.
However, a confirmed systemic collapse cannot be established from these developments alone.
The market must demonstrate whether buyers are returning, whether liquidity is stabilizing, and whether Bitcoin can establish a more sustainable price structure.
I would not treat every decline as a buying opportunity, nor would I assume that every recovery attempt represents the beginning of a new bull market.
Both approaches ignore the importance of evidence.
The most responsible position is to remain flexible, protect capital, monitor market conditions, and avoid decisions driven by fear or excessive optimism.
A correction is not a collapse. A bear market is not necessarily the end of an industry. But neither is a lower price a guarantee of future profit.
CONCLUSION: THE NEXT MOVE WILL BE DECIDED BY EVIDENCE
Bitcoin is facing a meaningful test of market confidence.
Institutional flows, global liquidity, investor positioning, and the behavior of traditional financial markets will all influence what happens next.
The coming period should be approached with patience and a clear understanding of risk.
For long-term investors, this is a time to evaluate fundamentals and maintain financial flexibility. For short-term traders, it is a time to respect volatility and avoid unnecessary exposure.
My philosophy remains unchanged:
Capital preservation first. Analysis before action. Discipline over emotion.
The strongest investors are not those who predict every market movement correctly. They are those who manage risk effectively, recognize changing conditions, and remain prepared for more than one possible outcome.
$BTC $ETH $NEAR
This article represents independent market commentary and educational analysis. It is not financial advice, a guarantee of market direction, or a recommendation to buy or sell any digital asset. Market conditions can change rapidly; always conduct your own research.
#CryptoMarket #NEAR #MarketAnalysis #RiskManagem #TripsSam
The cryptocurrency market is facing another serious test. Bitcoin has come under renewed selling pressure, major altcoins have weakened, and investors are increasingly questioning whether the current decline represents a temporary correction or the beginning of a much deeper bearish cycle.
This is an important distinction. A correction is a normal part of financial markets, while a structural collapse suggests that the foundations supporting an asset or an entire market are deteriorating.
Confusing the two can lead to poor investment decisions. Buying every decline without understanding the market can expose investors to unnecessary losses. Selling everything during a temporary correction can also mean abandoning positions without sufficient evidence.
My objective here is not to predict an exact bottom or promise an immediate recovery. It is to examine the factors behind the decline, identify the warning signs, and establish what investors should monitor before making their next decision.
1. WHAT IS REALLY HAPPENING TO BITCOIN?
Bitcoin's recent decline should not be viewed in isolation. The broader cryptocurrency market is experiencing pressure from several interconnected factors, including weaker institutional demand, uncertainty surrounding monetary policy, changing investor appetite for risk, and volatility across global financial markets.
Bitcoin has become increasingly connected to traditional financial markets. Institutional investors can now gain exposure through regulated investment products, while professional trading firms use derivatives and sophisticated risk-management strategies.
This wider participation has increased market accessibility, but it has also made Bitcoin more sensitive to changes in global liquidity and investor positioning.
When investors become concerned about economic conditions, they often reduce exposure to assets considered more volatile. Cryptocurrency can therefore experience selling pressure even when its underlying technology and network operations remain healthy.
The important question is not simply how much Bitcoin has declined, but why investors are selling and whether genuine demand is returning.
2. THE INFLUENCE OF INSTITUTIONAL INVESTORS
Institutional participation has become one of the most important components of the modern Bitcoin market.
Spot Bitcoin ETFs created a convenient investment channel for traditional investors, allowing them to obtain price exposure without directly managing cryptocurrency wallets.
However, institutional participation is not permanently bullish. Capital can enter during periods of confidence and leave when investment conditions change.
Persistent ETF withdrawals can reduce an important source of Spot market demand. When selling from investment products coincides with weaker participation from individual investors, the market may struggle to recover.
It is equally important not to interpret every withdrawal as a permanent loss of confidence. Portfolio rebalancing, profit-taking, risk reduction, and changing investment strategies can all influence institutional flows.
What matters is the broader trend.
Are withdrawals continuing? Are new inflows returning? Is Spot demand strong enough to absorb available supply?
These are more useful questions than assuming institutions are either abandoning Bitcoin or accumulating it at every lower price.
3. GLOBAL LIQUIDITY: THE FACTOR THAT CONNECTS CRYPTO TO THE WORLD ECONOMY
One of the most underestimated influences on cryptocurrency valuations is global liquidity.
Bitcoin is often discussed as an alternative monetary asset, but its market price is also influenced by the availability and cost of capital.
When interest rates are high, investors may prefer traditional interest-bearing assets. When monetary conditions become restrictive, speculative investments can become less attractive.
Inflation is another important variable. If inflation remains persistent, central banks may have less flexibility to reduce interest rates. This can maintain pressure on financial assets that depend heavily on investor confidence and liquidity.
The Federal Reserve's policy expectations therefore matter to cryptocurrency investors, even though the central bank does not directly determine Bitcoin's price.
A more supportive monetary environment could improve demand for risk assets. Conversely, persistent inflation and tighter financial conditions could extend the current period of weakness.
Bitcoin may operate independently of any single government or central bank, but its market valuation does not operate independently of the global financial system.
4. AI INVESTMENT AND THE ROTATION OF GLOBAL CAPITAL
Another development worth monitoring is the changing relationship between cryptocurrency and technology-sector investments.
Artificial intelligence has become a major destination for institutional capital. Large technology companies are committing substantial resources to data centres, computing infrastructure, semiconductors, and AI development.
These investments have attracted considerable market attention, but they have also raised questions about valuations, capital expenditure, future profitability, and the sustainability of expected returns.
When investors reassess technology valuations, capital can move rapidly between different asset classes.
Cryptocurrency can be affected by these changes through broader risk appetite, portfolio rebalancing, and liquidity conditions.
It would be inaccurate to claim that AI investment alone is responsible for Bitcoin's decline. The relationship is more complicated.
However, the competition for institutional capital is real. Cryptocurrency must attract investment based on its own economic value, adoption, and long-term potential.
The next market phase may reveal whether investors are reducing their overall exposure to risk or simply reallocating capital toward other opportunities.
5. THE DANGERS OF LEVERAGE AND FORCED LIQUIDATIONS
Derivatives trading can amplify market movements.
When traders use leverage, relatively small price changes can have a significant impact on their positions. If the market moves against them, margin requirements increase and positions may be automatically liquidated.
This creates a potential chain reaction:
Bitcoin begins declining.Leveraged long positions experience increasing losses.Margin positions approach liquidation thresholds.Forced selling adds pressure to the market.Additional price declines trigger further liquidations.
This process can make a correction more severe than the initial selling pressure would otherwise justify.
However, liquidations are not automatically evidence of a market collapse. They can also remove excessive leverage and reduce speculative positioning.
The important distinction is whether the market stabilizes after forced selling or whether genuine Spot demand remains insufficient.
Investors should pay attention to open interest, funding rates, liquidation activity, and Spot trading volume rather than relying on price movements alone.
A market recovery supported by genuine Spot buying is generally more convincing than one driven primarily by the closure of leveraged short positions.
6. WHY ALTCOINS ARE OFTEN MORE VULNERABLE
Bitcoin remains the dominant reference point for the cryptocurrency market, but alternative cryptocurrencies frequently experience larger percentage movements during periods of uncertainty.
This is partly related to differences in market capitalization, liquidity, investor participation, and token economics.
When investors become defensive, they often reduce exposure to smaller and more speculative assets first.
Consequently, altcoins can experience sharper declines even when their respective projects continue developing.
This is particularly important when evaluating assets such as ETH, SOL, and NEAR.
Each has a different ecosystem, technological purpose, adoption profile, and economic model. Their investment potential should not be judged exclusively by Bitcoin's daily movement.
At the same time, a strong technology project does not automatically guarantee a recovering token price.
Investors must distinguish between the quality of a blockchain project and the valuation of its associated cryptocurrency.
The next recovery may reward projects with genuine utility, sustainable adoption, strong development activity, and healthy liquidity rather than every token that participated in the previous market rally.
7. NORMAL CORRECTION OR STRUCTURAL COLLAPSE?
This is the central question.
A normal correction involves a decline in market prices without a fundamental breakdown in the underlying asset or financial infrastructure.
It may be caused by profit-taking, changes in liquidity, excessive leverage, macroeconomic uncertainty, or temporary imbalances between buyers and sellers.
A structural collapse is considerably more serious. It involves deterioration in the foundations supporting market confidence, such as major custody failures, systemic exchange problems, persistent liquidity breakdowns, severe stablecoin disruptions, or fundamental damage to important networks.
The current price decline alone cannot establish that such a collapse is taking place.
Bitcoin continues to operate as a network, cryptocurrency exchanges continue facilitating trading, and the broader blockchain ecosystem remains active.
These observations do not eliminate investment risk. They simply mean that falling prices should not automatically be treated as evidence of a failed financial infrastructure.
There is also a third possibility that investors should not overlook: an extended bear market.
A prolonged bear market can develop without a systemic collapse. Prices may remain depressed, institutional participation may weaken, and speculative interest may decline over an extended period.
This possibility deserves serious consideration.
The market does not have to collapse completely for investors to experience a prolonged and difficult period of losses.
8. THREE POSSIBLE MARKET SCENARIOS
SCENARIO ONE: A HEALTHY CORRECTION AND GRADUAL RECOVERY
Selling pressure begins to weaken, Spot demand improves, institutional withdrawals stabilize, and Bitcoin gradually reclaims important technical levels.
Under this scenario, the current decline could become a correction within a broader market cycle.
However, a sustainable recovery would require confirmation from market participation rather than a temporary price bounce.
SCENARIO TWO: AN EXTENDED BEARISH MARKET
Institutional demand remains weak, monetary conditions stay restrictive, and investors continue reducing exposure to speculative assets.
Bitcoin may experience repeated recovery attempts followed by renewed selling, while altcoins remain under greater pressure.
This scenario would represent a prolonged bearish environment, but not necessarily a collapse of the cryptocurrency ecosystem.
SCENARIO THREE: A STRUCTURAL MARKET BREAKDOWN
Liquidity deteriorates significantly, major financial infrastructure experiences serious failures, institutional confidence weakens further, and important long-term market structures break down.
Under this scenario, the decline could develop into a much more serious market event.
This is a risk that investors should monitor, not a conclusion that can be justified by price declines alone.
9. WHAT SHOULD INVESTORS WATCH NOW?
Rather than attempting to predict every market movement, investors should monitor a combination of indicators.
Spot Market Demand: Are buyers entering the market, or are price increases primarily driven by derivatives activity?
Institutional Flows: Are ETF withdrawals slowing, stabilizing, or turning into sustained inflows?
Market Liquidity: Is trading depth improving, and can the market absorb selling without excessive price movements?
Derivatives Positioning: Is excessive leverage being reduced, or is speculative exposure rebuilding too quickly?
Macroeconomic Conditions: Are inflation, interest-rate expectations, and global liquidity becoming more supportive?
Bitcoin Market Structure: Are important support and resistance areas being respected, and are recovery attempts supported by meaningful trading volume?
No single indicator should determine an investment decision. The strongest conclusions come from several independent signals pointing in the same direction.
10. MY APPROACH TO SPOT INVESTING DURING THIS DECLINE
Market uncertainty requires discipline, not emotional reactions.
I believe capital preservation should remain the first priority, especially when the direction of the market is unclear.
For Spot investors, several principles are worth considering:
Do Not Commit All Capital at Once: A market that appears inexpensive today may become cheaper tomorrow. Maintaining available liquidity provides flexibility.
Consider Staggered Entries: Dividing an intended investment into several stages can reduce dependence on one entry price.
Prioritize Quality: Focus on established networks, real adoption, liquidity, security, and credible long-term development.
Avoid Unnecessary Leverage: Spot ownership avoids leverage-driven liquidation when assets are fully funded, although the market value can still decline substantially.
Reassess Every Position: Holding an asset should be based on a continuing investment thesis, not simply the hope of recovering an earlier entry price.
Separate Investment From Speculation: Short-term volatility and long-term investment objectives require different approaches.
The objective is not to identify the exact bottom. It is to maintain sufficient flexibility to make informed decisions when stronger market evidence becomes available.
11. THE BIGGER PICTURE: IS THE CRYPTO INDUSTRY LOSING ITS FUTURE?
A decline in cryptocurrency valuations should not automatically be confused with a decline in blockchain technology itself.
The cryptocurrency industry continues to evolve across several areas, including decentralized finance, tokenization, stablecoins, institutional custody, payment infrastructure, and blockchain-based applications.
These developments have their own adoption cycles and commercial challenges.
A market correction may expose projects that relied excessively on speculation rather than genuine utility.
It may also encourage stronger risk management, more sustainable token economics, and better standards across the industry.
However, technological progress does not guarantee that every cryptocurrency will increase in value.
Investors must remain selective and recognize that some projects may never recover their previous market valuations.
The long-term future of blockchain technology and the short-term direction of cryptocurrency prices are related, but they are not the same question.
12. FINAL ASSESSMENT: CAUTION WITHOUT PANIC
My assessment is that the current market environment deserves serious caution. Weak institutional demand, uncertainty surrounding global liquidity, volatility in technology investments, and the effects of leveraged trading can combine to create further downside pressure.
However, a confirmed systemic collapse cannot be established from these developments alone.
The market must demonstrate whether buyers are returning, whether liquidity is stabilizing, and whether Bitcoin can establish a more sustainable price structure.
I would not treat every decline as a buying opportunity, nor would I assume that every recovery attempt represents the beginning of a new bull market.
Both approaches ignore the importance of evidence.
The most responsible position is to remain flexible, protect capital, monitor market conditions, and avoid decisions driven by fear or excessive optimism.
A correction is not a collapse. A bear market is not necessarily the end of an industry. But neither is a lower price a guarantee of future profit.
CONCLUSION: THE NEXT MOVE WILL BE DECIDED BY EVIDENCE
Bitcoin is facing a meaningful test of market confidence.
Institutional flows, global liquidity, investor positioning, and the behavior of traditional financial markets will all influence what happens next.
The coming period should be approached with patience and a clear understanding of risk.
For long-term investors, this is a time to evaluate fundamentals and maintain financial flexibility. For short-term traders, it is a time to respect volatility and avoid unnecessary exposure.
My philosophy remains unchanged:
Capital preservation first. Analysis before action. Discipline over emotion.
The strongest investors are not those who predict every market movement correctly. They are those who manage risk effectively, recognize changing conditions, and remain prepared for more than one possible outcome.
$BTC $ETH $NEAR
This article represents independent market commentary and educational analysis. It is not financial advice, a guarantee of market direction, or a recommendation to buy or sell any digital asset. Market conditions can change rapidly; always conduct your own research.
#CryptoMarket #NEAR #MarketAnalysis #RiskManagem #TripsSam
238
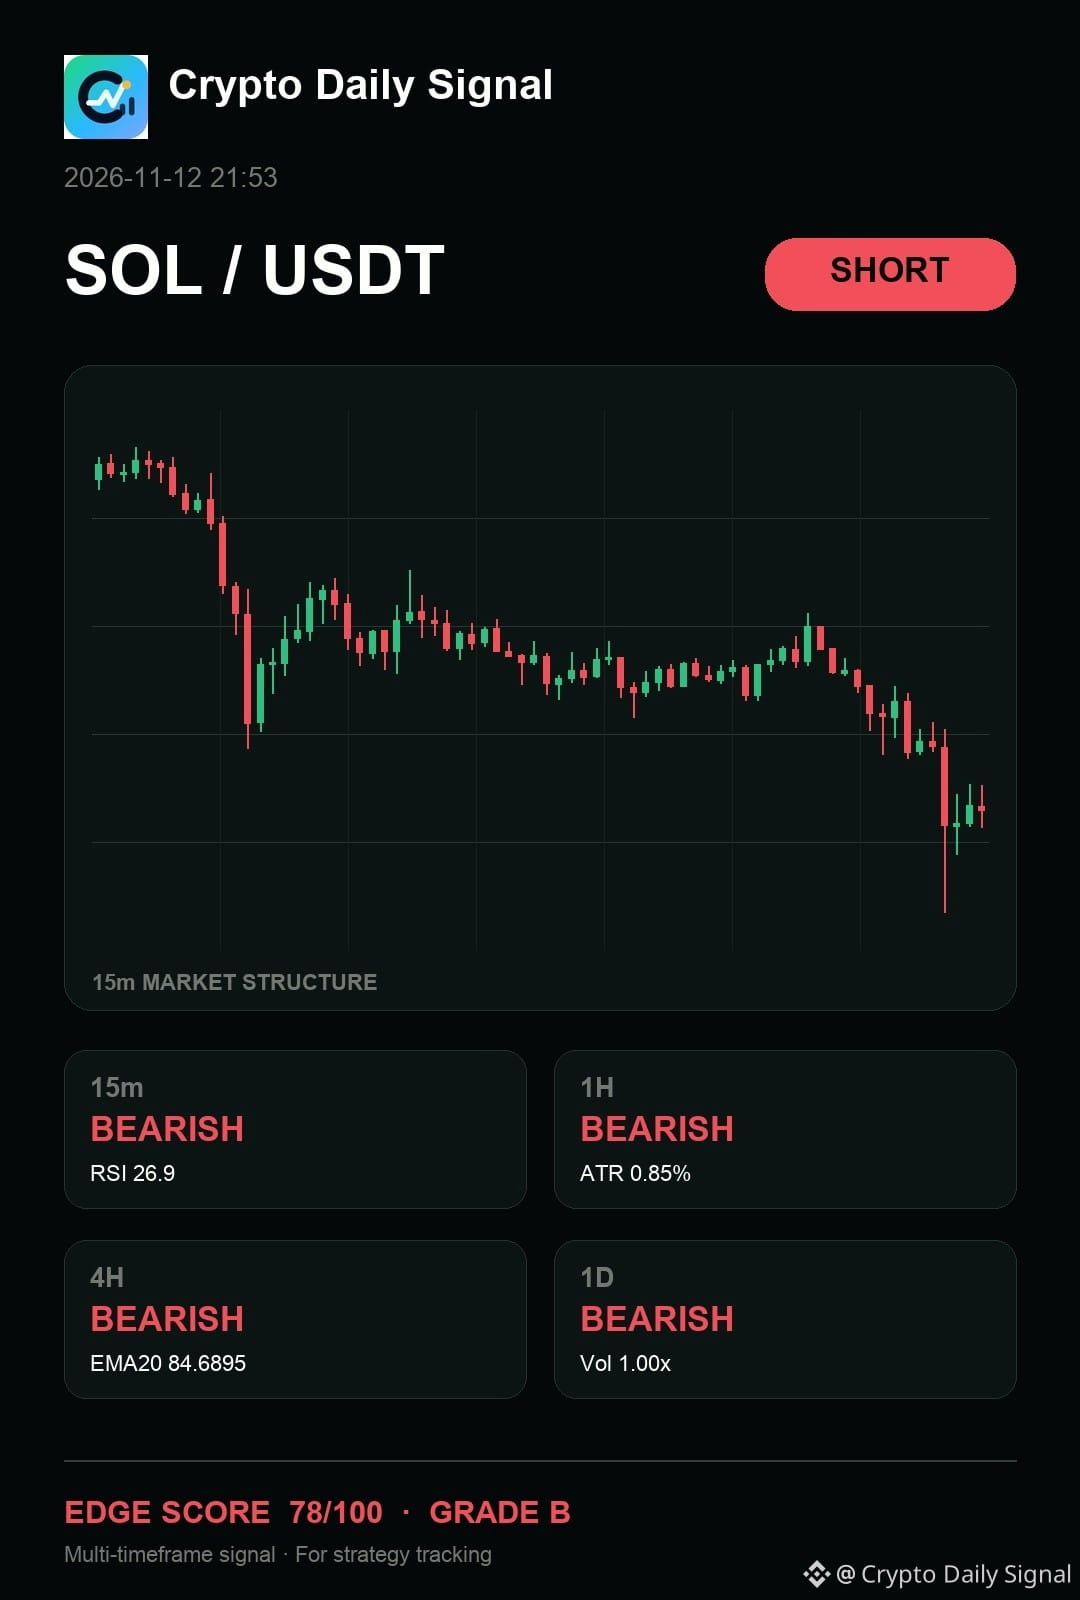
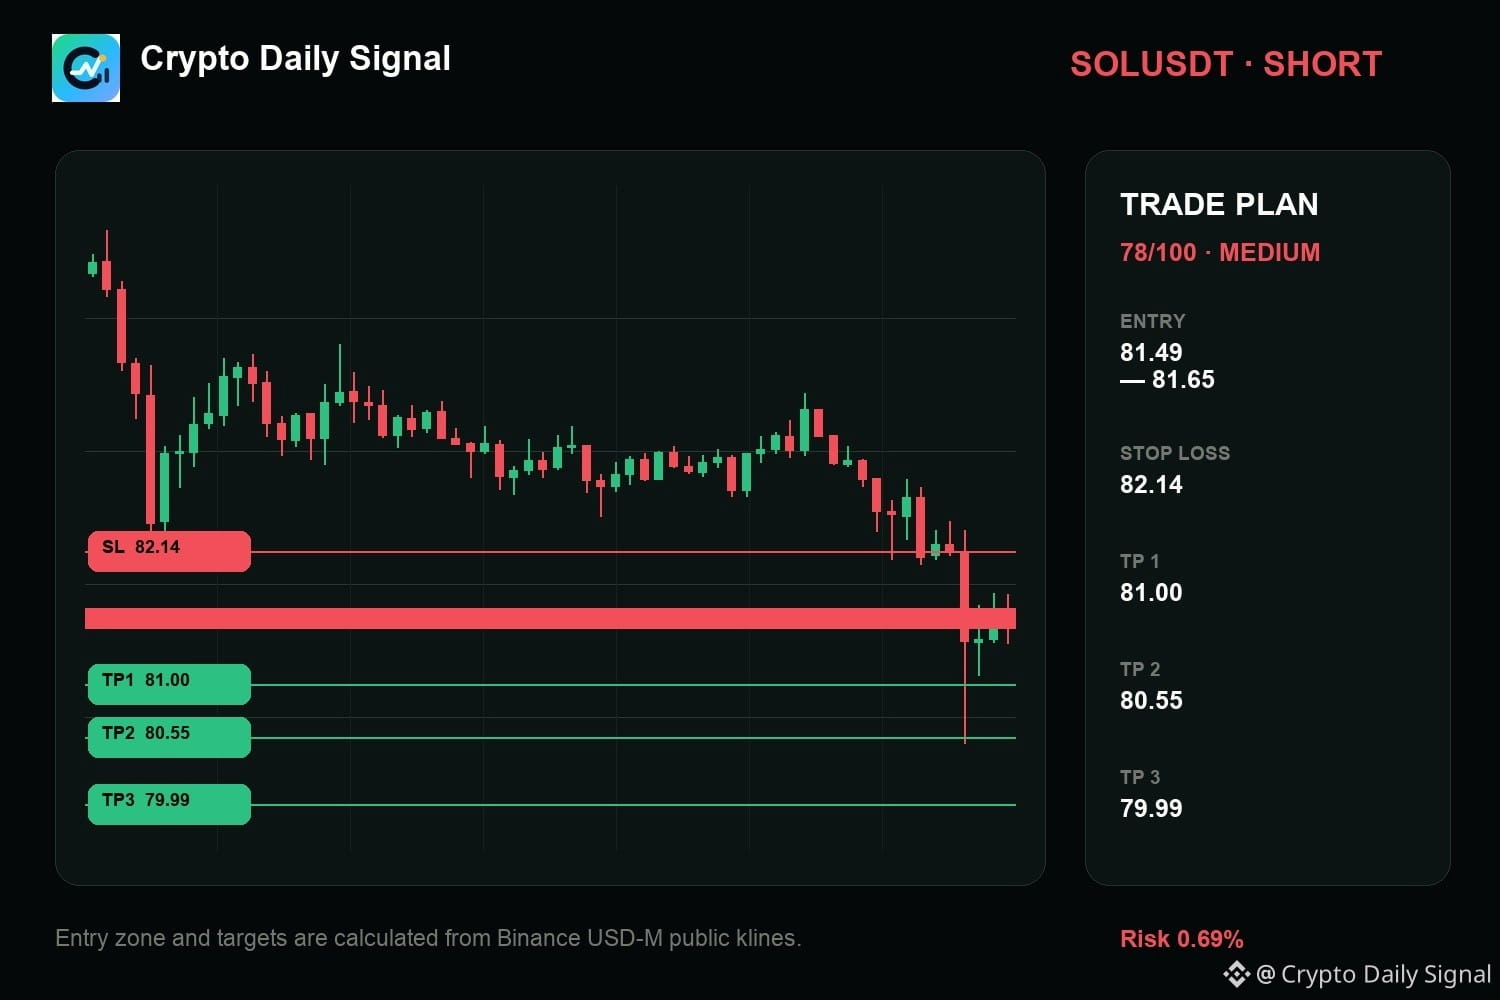
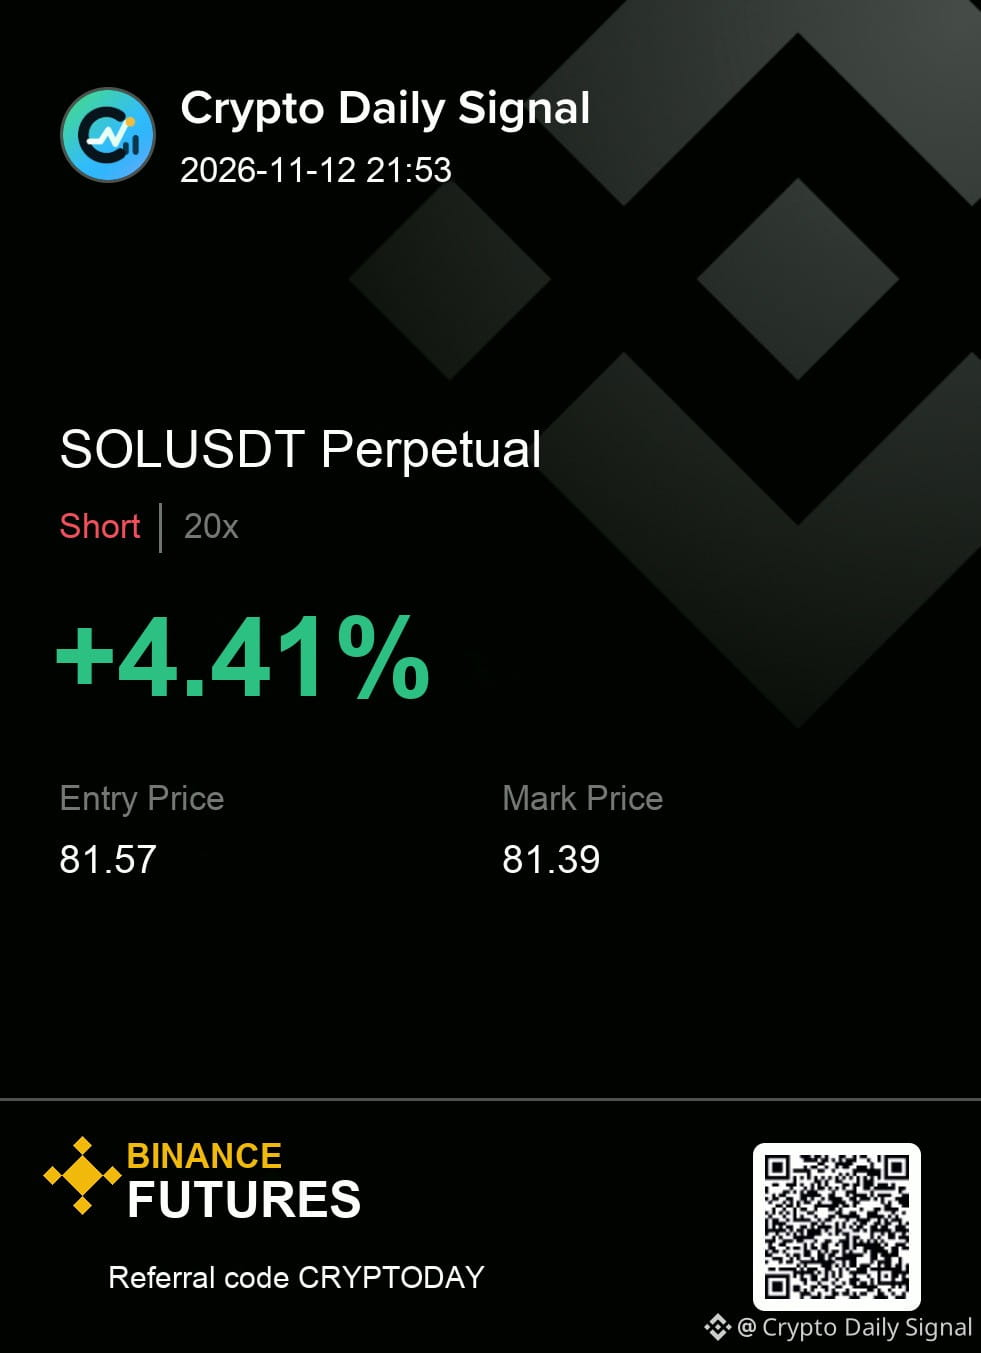
$SOL — tbh, I keep coming back to how it still has a valid bearish path if it can't reclaim the immediate short-term support. The price is currently tucked inside that descending channel structure, and recent candles aren't pushing above the last minor peak. A failure to break that resistance level would make this short idea much cleaner structurally.
SHORT plan for SOLUSDT
81.49 - 81.65 entry | 82.14 stop
81.00 → 80.55 → 79.99
#MarketAnalysis
{future}(SOLUSDT)
$SOL — tbh, I keep coming back to how it still has a valid bearish path if it can't reclaim the immediate short-term support. The price is currently tucked inside that descending channel structure, and recent candles aren't pushing above the last minor peak. A failure to break that resistance level would make this short idea much cleaner structurally.
SHORT plan for SOLUSDT
81.49 - 81.65 entry | 82.14 stop
81.00 → 80.55 → 79.99
#MarketAnalysis
SHORT plan for SOLUSDT
81.49 - 81.65 entry | 82.14 stop
81.00 → 80.55 → 79.99
#MarketAnalysis
11

·
--
🚨 WHY IS THE CRYPTO MARKET FALLING? 📉
The crypto market is facing strong selling pressure, and investors are becoming cautious.
🔻 Main Reasons Behind the Market Drop:
1️⃣ Higher-than-expected US inflation
2️⃣ Fear of further interest rate hikes by the Federal Reserve
3️⃣ Bitcoin ETF outflows
4️⃣ Heavy liquidation of leveraged traders
5️⃣ Weak investor confidence and market uncertainty
📊 Market Situation:
Bitcoin and Ethereum are facing pressure, while many altcoins are also declining.
💡 My Trading Strategy:
✅ Avoid emotional trading
✅ Manage your risk carefully
✅ Use Stop Loss
✅ Don't use excessive leverage
✅ Wait for market confirmation before buying
Remember: Every market correction brings risk, but patience and discipline are key to long-term success.
🚀 Stay Alert. Stay Safe. Trade Smart!
#CryptoMarket #bitcoin #BTC #Ethereum #Binance #CryptoCrash #Altcoins #TradingUpdate #MarketAnalysis
🚨 WHY IS THE CRYPTO MARKET FALLING? 📉
The crypto market is facing strong selling pressure, and investors are becoming cautious.
🔻 Main Reasons Behind the Market Drop:
1️⃣ Higher-than-expected US inflation
2️⃣ Fear of further interest rate hikes by the Federal Reserve
3️⃣ Bitcoin ETF outflows
4️⃣ Heavy liquidation of leveraged traders
5️⃣ Weak investor confidence and market uncertainty
📊 Market Situation:
Bitcoin and Ethereum are facing pressure, while many altcoins are also declining.
💡 My Trading Strategy:
✅ Avoid emotional trading
✅ Manage your risk carefully
✅ Use Stop Loss
✅ Don't use excessive leverage
✅ Wait for market confirmation before buying
Remember: Every market correction brings risk, but patience and discipline are key to long-term success.
🚀 Stay Alert. Stay Safe. Trade Smart!
#CryptoMarket #bitcoin #BTC #Ethereum #Binance #CryptoCrash #Altcoins #TradingUpdate #MarketAnalysis
The crypto market is facing strong selling pressure, and investors are becoming cautious.
🔻 Main Reasons Behind the Market Drop:
1️⃣ Higher-than-expected US inflation
2️⃣ Fear of further interest rate hikes by the Federal Reserve
3️⃣ Bitcoin ETF outflows
4️⃣ Heavy liquidation of leveraged traders
5️⃣ Weak investor confidence and market uncertainty
📊 Market Situation:
Bitcoin and Ethereum are facing pressure, while many altcoins are also declining.
💡 My Trading Strategy:
✅ Avoid emotional trading
✅ Manage your risk carefully
✅ Use Stop Loss
✅ Don't use excessive leverage
✅ Wait for market confirmation before buying
Remember: Every market correction brings risk, but patience and discipline are key to long-term success.
🚀 Stay Alert. Stay Safe. Trade Smart!
#CryptoMarket #bitcoin #BTC #Ethereum #Binance #CryptoCrash #Altcoins #TradingUpdate #MarketAnalysis

70
·
--
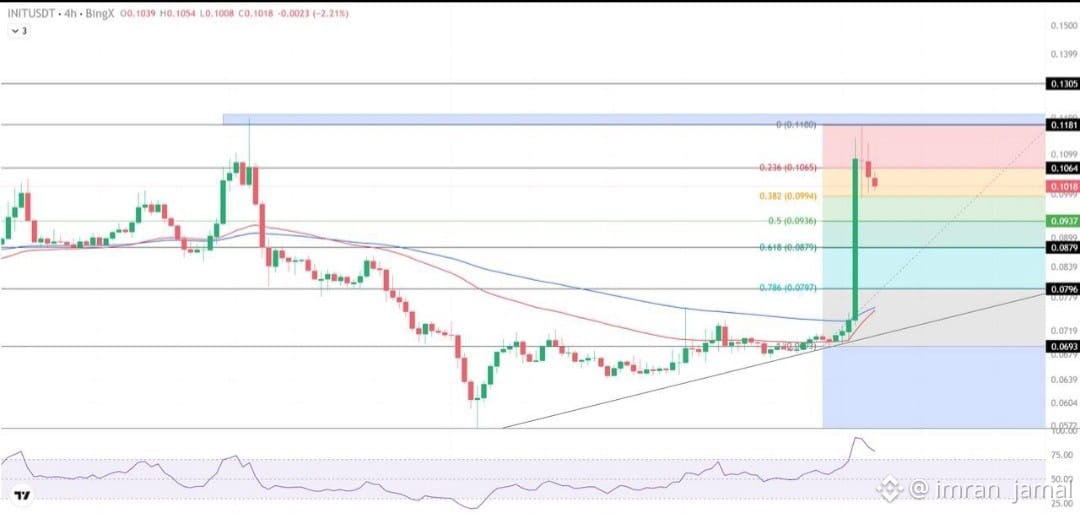
$INIT
📊 INITUSDT MARKET ANALYSIS
🚀 INIT is showing strong bullish momentum with increased trading activity. Buyers are dominating the short-term trend, but volatility remains high.
🔹 Support: $0.1809 – $0.1704
🔹 Resistance: $0.2147 – $0.2335
🎯 Bullish Target: $0.2574
📈 Market Outlook: A strong breakout above $0.2147 could open the door to further upside. Watch volume confirmation before entering.
⚠️ Manage risk and avoid chasing sudden pumps.
#INITUSTD #MarketAnalysis #Benince #altcoins
{future}(INITUSDT)
$INIT
📊 INITUSDT MARKET ANALYSIS
🚀 INIT is showing strong bullish momentum with increased trading activity. Buyers are dominating the short-term trend, but volatility remains high.
🔹 Support: $0.1809 – $0.1704
🔹 Resistance: $0.2147 – $0.2335
🎯 Bullish Target: $0.2574
📈 Market Outlook: A strong breakout above $0.2147 could open the door to further upside. Watch volume confirmation before entering.
⚠️ Manage risk and avoid chasing sudden pumps.
#INITUSTD #MarketAnalysis #Benince #altcoins
📊 INITUSDT MARKET ANALYSIS
🚀 INIT is showing strong bullish momentum with increased trading activity. Buyers are dominating the short-term trend, but volatility remains high.
🔹 Support: $0.1809 – $0.1704
🔹 Resistance: $0.2147 – $0.2335
🎯 Bullish Target: $0.2574
📈 Market Outlook: A strong breakout above $0.2147 could open the door to further upside. Watch volume confirmation before entering.
⚠️ Manage risk and avoid chasing sudden pumps.
#INITUSTD #MarketAnalysis #Benince #altcoins
343
·
--
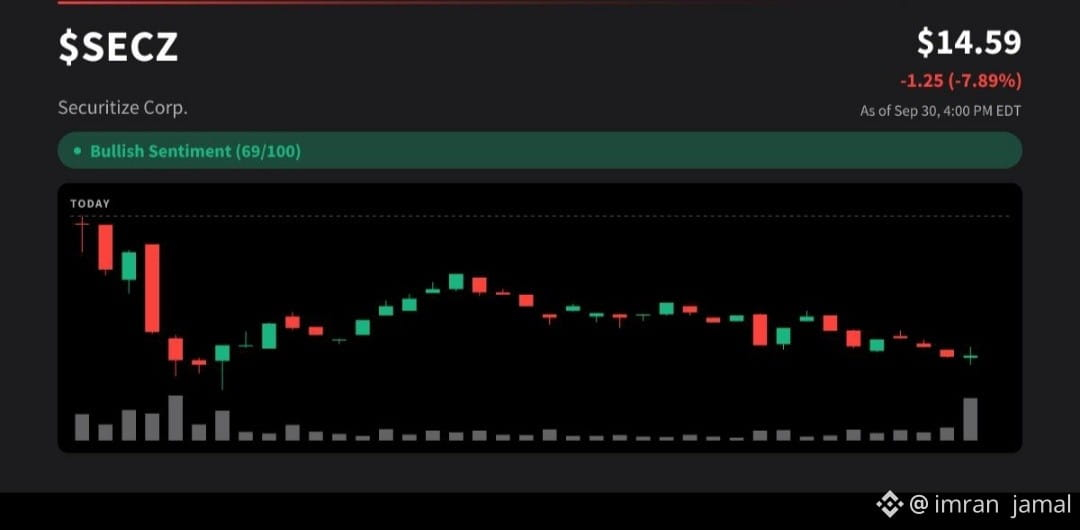
$SECZ
📊 SECZUSDT MARKET ANALYSIS
SECZ is showing a strong short-term recovery, with bullish momentum returning to the market. Buyers are attempting to push the price toward the next resistance zone.
🔹 Resistance: $8.10 – $9.10
🔹 Support: $7.50 – $6.70
🔹 Bullish Target: $9.10 – $9.88
📈 Market Outlook: Bullish above $7.50, but a breakout above $9.10 with strong volume could confirm further upside.
⚠️ Watch volatility and manage risk carefully.
#SECZUSDT #MarketAnalysis #Benince #altcoins
{future}(SECZUSDT)
$SECZ
📊 SECZUSDT MARKET ANALYSIS
SECZ is showing a strong short-term recovery, with bullish momentum returning to the market. Buyers are attempting to push the price toward the next resistance zone.
🔹 Resistance: $8.10 – $9.10
🔹 Support: $7.50 – $6.70
🔹 Bullish Target: $9.10 – $9.88
📈 Market Outlook: Bullish above $7.50, but a breakout above $9.10 with strong volume could confirm further upside.
⚠️ Watch volatility and manage risk carefully.
#SECZUSDT #MarketAnalysis #Benince #altcoins
📊 SECZUSDT MARKET ANALYSIS
SECZ is showing a strong short-term recovery, with bullish momentum returning to the market. Buyers are attempting to push the price toward the next resistance zone.
🔹 Resistance: $8.10 – $9.10
🔹 Support: $7.50 – $6.70
🔹 Bullish Target: $9.10 – $9.88
📈 Market Outlook: Bullish above $7.50, but a breakout above $9.10 with strong volume could confirm further upside.
⚠️ Watch volatility and manage risk carefully.
#SECZUSDT #MarketAnalysis #Benince #altcoins
225

·
--
Crypto Today: Bitcoin, Ethereum, XRP extend decline with US CPI in focus#CryptoTrading.
Bitcoin corrects below $75,000 on Tuesday ahead of US CPI report.
Ethereum ticks lower near $2,100 as downtrending momentum indicators weigh.
XRP falls for the sixth consecutive day and trades below $1.10 amid a heavily capped upside.#market_tips
$XRP
{spot}(XRPUSDT)
$ETH
{spot}(ETHUSDT)
$BTC
{spot}(BTCUSDT)
#Market_Update Technical analysis: XRP faces persistent downtrend
XRP trades at $1.09, extending a bearish bias as price holds well below the clustered EMAs and the active SuperTrend line. The 50-day EMA at $1.29, the 100-day EMA at $1.30 and the 200-day EMA at $1.35 all sit overhead, reinforcing a capped tone, while the SuperTrend at $1.26 adds to the ceiling.
Momentum remains weak, with the MACD below zero, while the RSI at 26 slips into oversold territory, suggesting selling pressure is stretched but not yet reversed.
Technical analysis: Bitcoin slips below $75K as bearish grip intensifies#CryptoNewss
Bitcoin trades at $74,743, extending a corrective phase with a bearish near-term bias as price holds below the main Exponential Moving Averages (EMAs). The 200-day EMA at $76,457, the 100-day EMA near $77,575 and the 50-day EMA around $79,141 all sit overhead, suggesting the broader uptrend structure is being challenged, while the SuperTrend line at $81,375 further reinforces a cap.
Ethereum technical analysis: ETH bears retain control#MarketAnalysis
Ethereum trades at $2,113, keeping a clear bearish near‑term bias as price holds beneath the upward-sloping support trendline’s break point at $2,229 and stays well below the 200-day EMA at $2,301. The 100-day and 50-day EMAs, at $2,333 and $2,361 respectively, along with the SuperTrend resistance near $2,391, collectively suggest that rallies are likely to be capped while MACD remains in negative territory and the RSI hovers just above oversold conditions, hinting at persistent downside pressure despite a risk of short-covering bounces.
Crypto Today: Bitcoin, Ethereum, XRP extend decline with US CPI in focus#CryptoTrading.
Bitcoin corrects below $75,000 on Tuesday ahead of US CPI report.
Ethereum ticks lower near $2,100 as downtrending momentum indicators weigh.
XRP falls for the sixth consecutive day and trades below $1.10 amid a heavily capped upside.#market_tips
$XRP
$ETH
$BTC
#Market_Update Technical analysis: XRP faces persistent downtrend
XRP trades at $1.09, extending a bearish bias as price holds well below the clustered EMAs and the active SuperTrend line. The 50-day EMA at $1.29, the 100-day EMA at $1.30 and the 200-day EMA at $1.35 all sit overhead, reinforcing a capped tone, while the SuperTrend at $1.26 adds to the ceiling.
Momentum remains weak, with the MACD below zero, while the RSI at 26 slips into oversold territory, suggesting selling pressure is stretched but not yet reversed.
Technical analysis: Bitcoin slips below $75K as bearish grip intensifies#CryptoNewss
Bitcoin trades at $74,743, extending a corrective phase with a bearish near-term bias as price holds below the main Exponential Moving Averages (EMAs). The 200-day EMA at $76,457, the 100-day EMA near $77,575 and the 50-day EMA around $79,141 all sit overhead, suggesting the broader uptrend structure is being challenged, while the SuperTrend line at $81,375 further reinforces a cap.
Ethereum technical analysis: ETH bears retain control#MarketAnalysis
Ethereum trades at $2,113, keeping a clear bearish near‑term bias as price holds beneath the upward-sloping support trendline’s break point at $2,229 and stays well below the 200-day EMA at $2,301. The 100-day and 50-day EMAs, at $2,333 and $2,361 respectively, along with the SuperTrend resistance near $2,391, collectively suggest that rallies are likely to be capped while MACD remains in negative territory and the RSI hovers just above oversold conditions, hinting at persistent downside pressure despite a risk of short-covering bounces.
Bitcoin corrects below $75,000 on Tuesday ahead of US CPI report.
Ethereum ticks lower near $2,100 as downtrending momentum indicators weigh.
XRP falls for the sixth consecutive day and trades below $1.10 amid a heavily capped upside.#market_tips
$XRP
$ETH
$BTC
#Market_Update Technical analysis: XRP faces persistent downtrend
XRP trades at $1.09, extending a bearish bias as price holds well below the clustered EMAs and the active SuperTrend line. The 50-day EMA at $1.29, the 100-day EMA at $1.30 and the 200-day EMA at $1.35 all sit overhead, reinforcing a capped tone, while the SuperTrend at $1.26 adds to the ceiling.
Momentum remains weak, with the MACD below zero, while the RSI at 26 slips into oversold territory, suggesting selling pressure is stretched but not yet reversed.
Technical analysis: Bitcoin slips below $75K as bearish grip intensifies#CryptoNewss
Bitcoin trades at $74,743, extending a corrective phase with a bearish near-term bias as price holds below the main Exponential Moving Averages (EMAs). The 200-day EMA at $76,457, the 100-day EMA near $77,575 and the 50-day EMA around $79,141 all sit overhead, suggesting the broader uptrend structure is being challenged, while the SuperTrend line at $81,375 further reinforces a cap.
Ethereum technical analysis: ETH bears retain control#MarketAnalysis
Ethereum trades at $2,113, keeping a clear bearish near‑term bias as price holds beneath the upward-sloping support trendline’s break point at $2,229 and stays well below the 200-day EMA at $2,301. The 100-day and 50-day EMAs, at $2,333 and $2,361 respectively, along with the SuperTrend resistance near $2,391, collectively suggest that rallies are likely to be capped while MACD remains in negative territory and the RSI hovers just above oversold conditions, hinting at persistent downside pressure despite a risk of short-covering bounces.

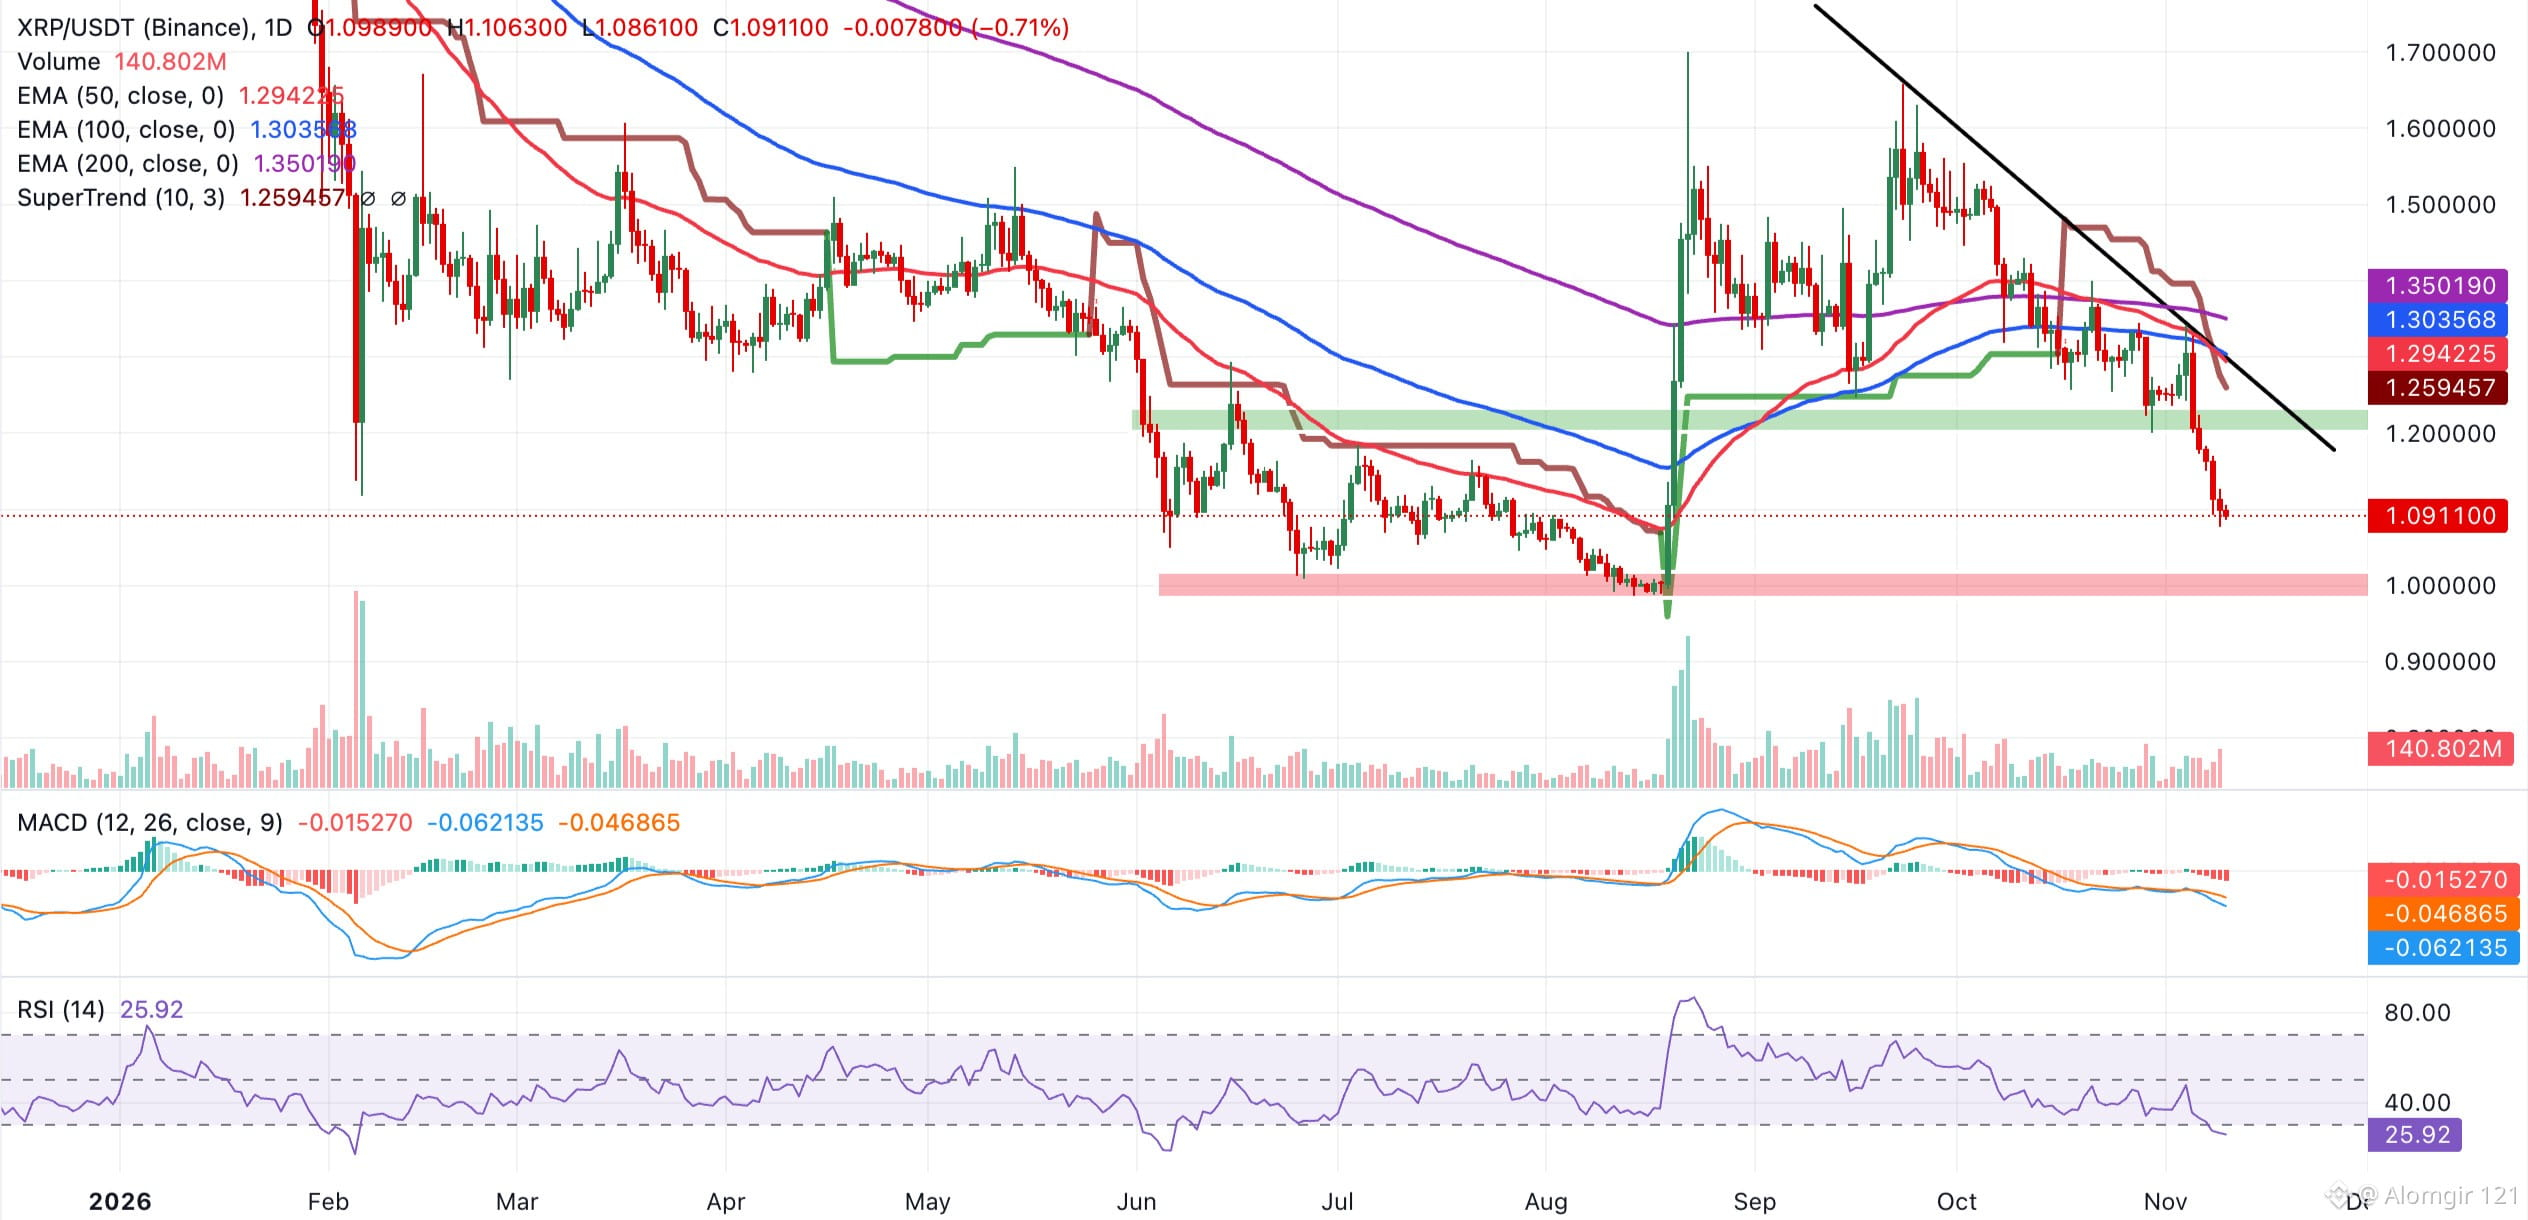
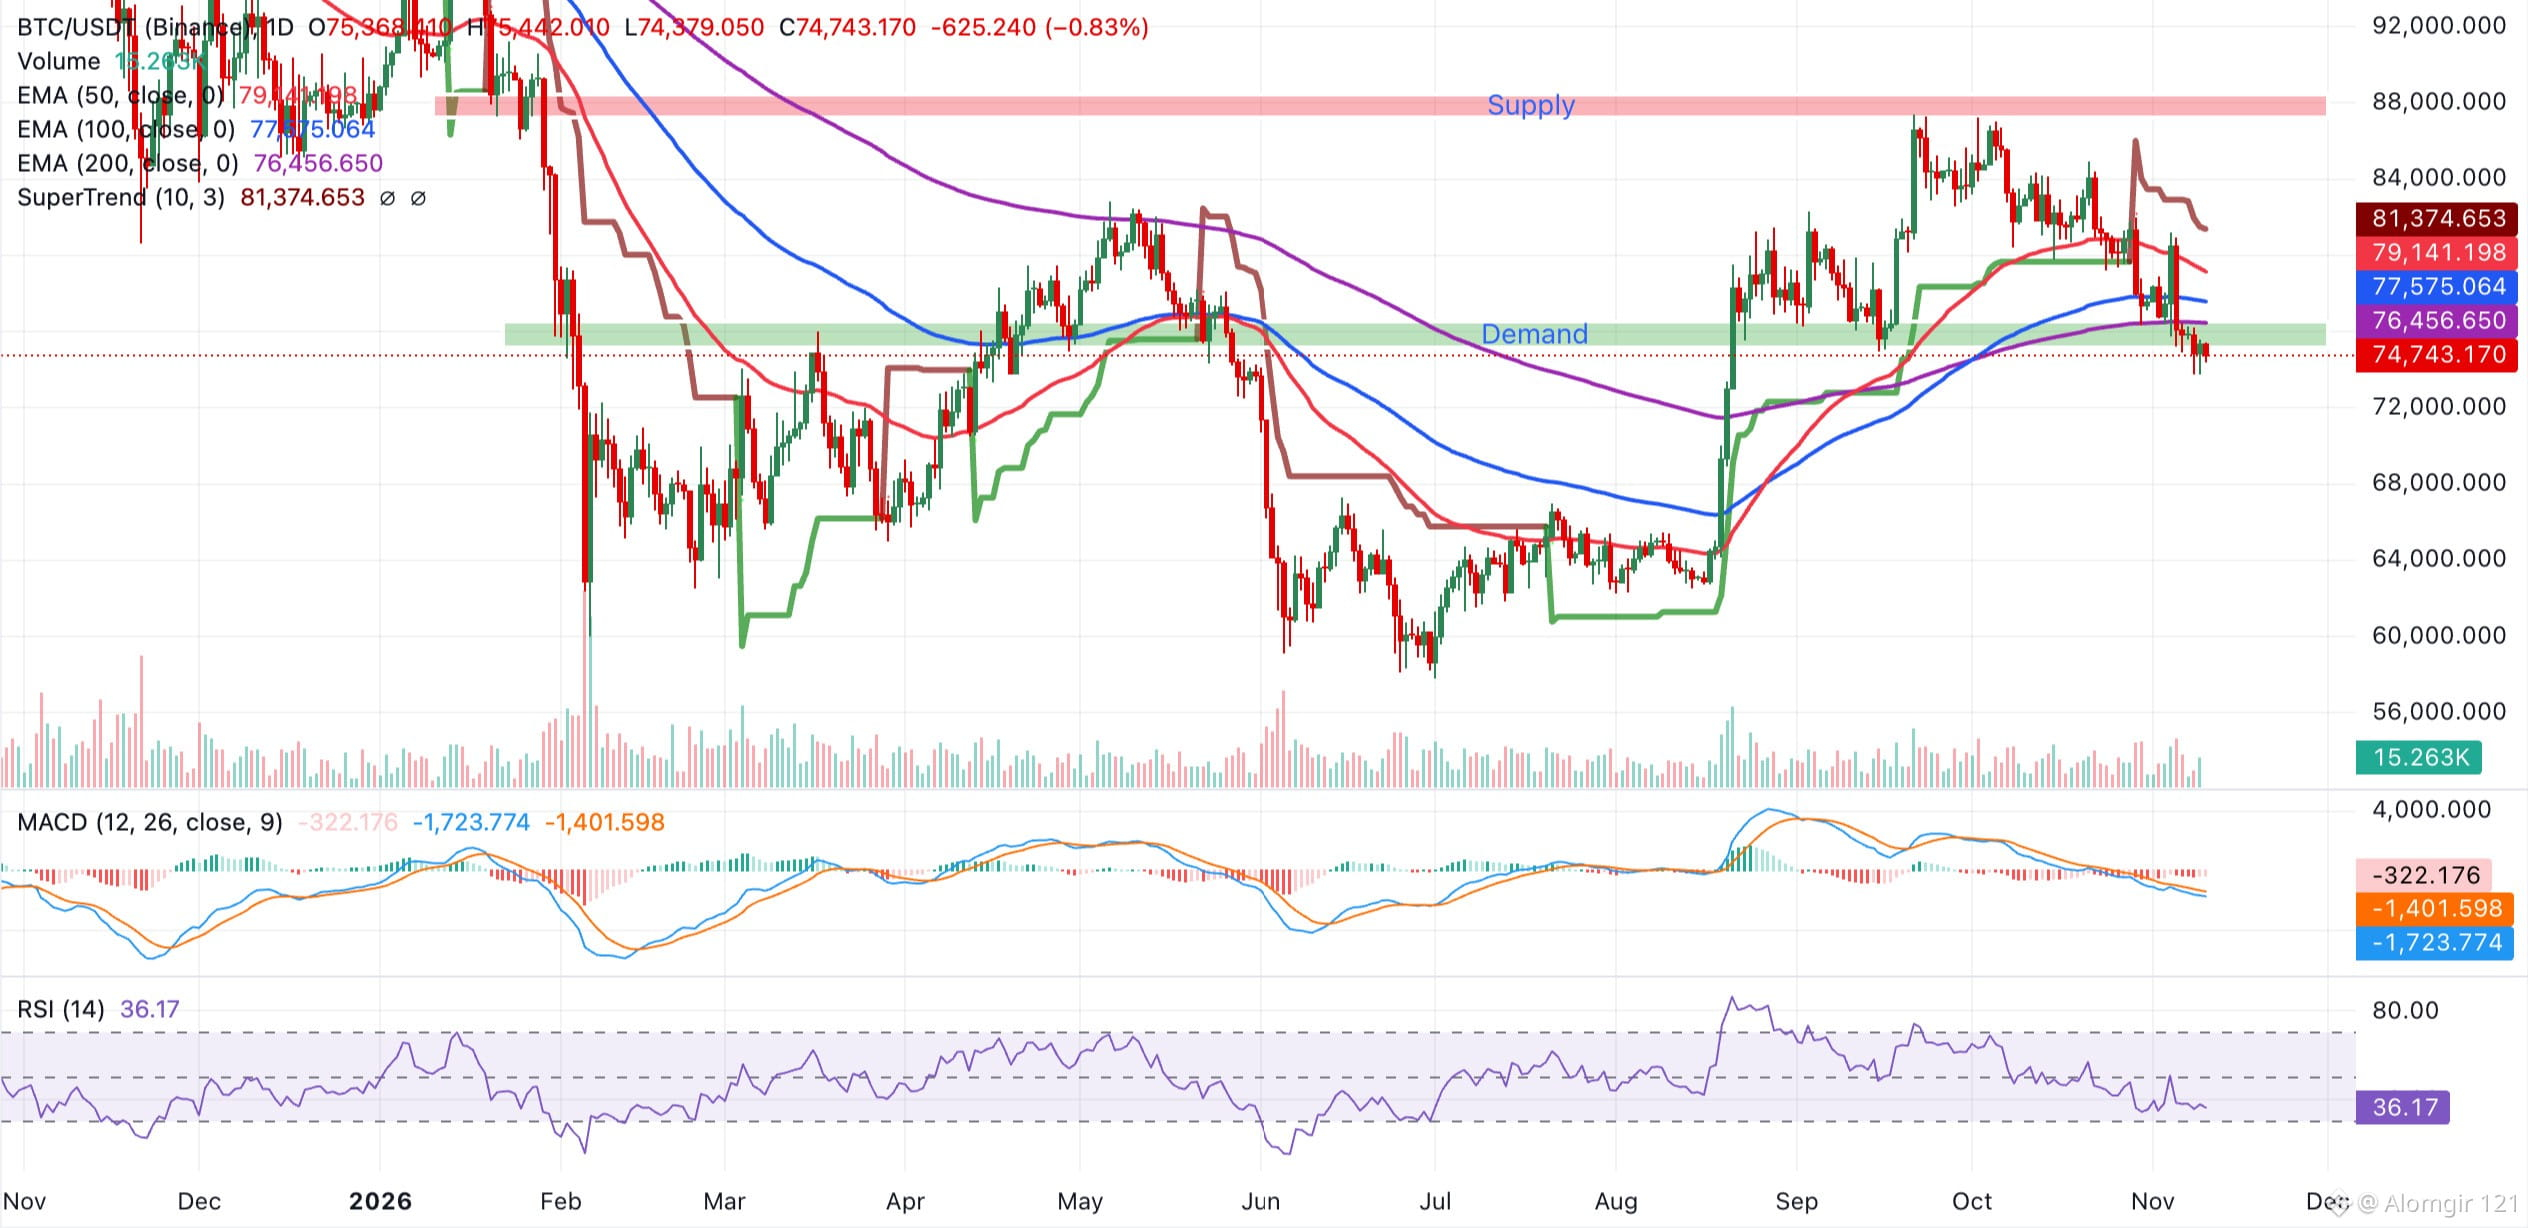
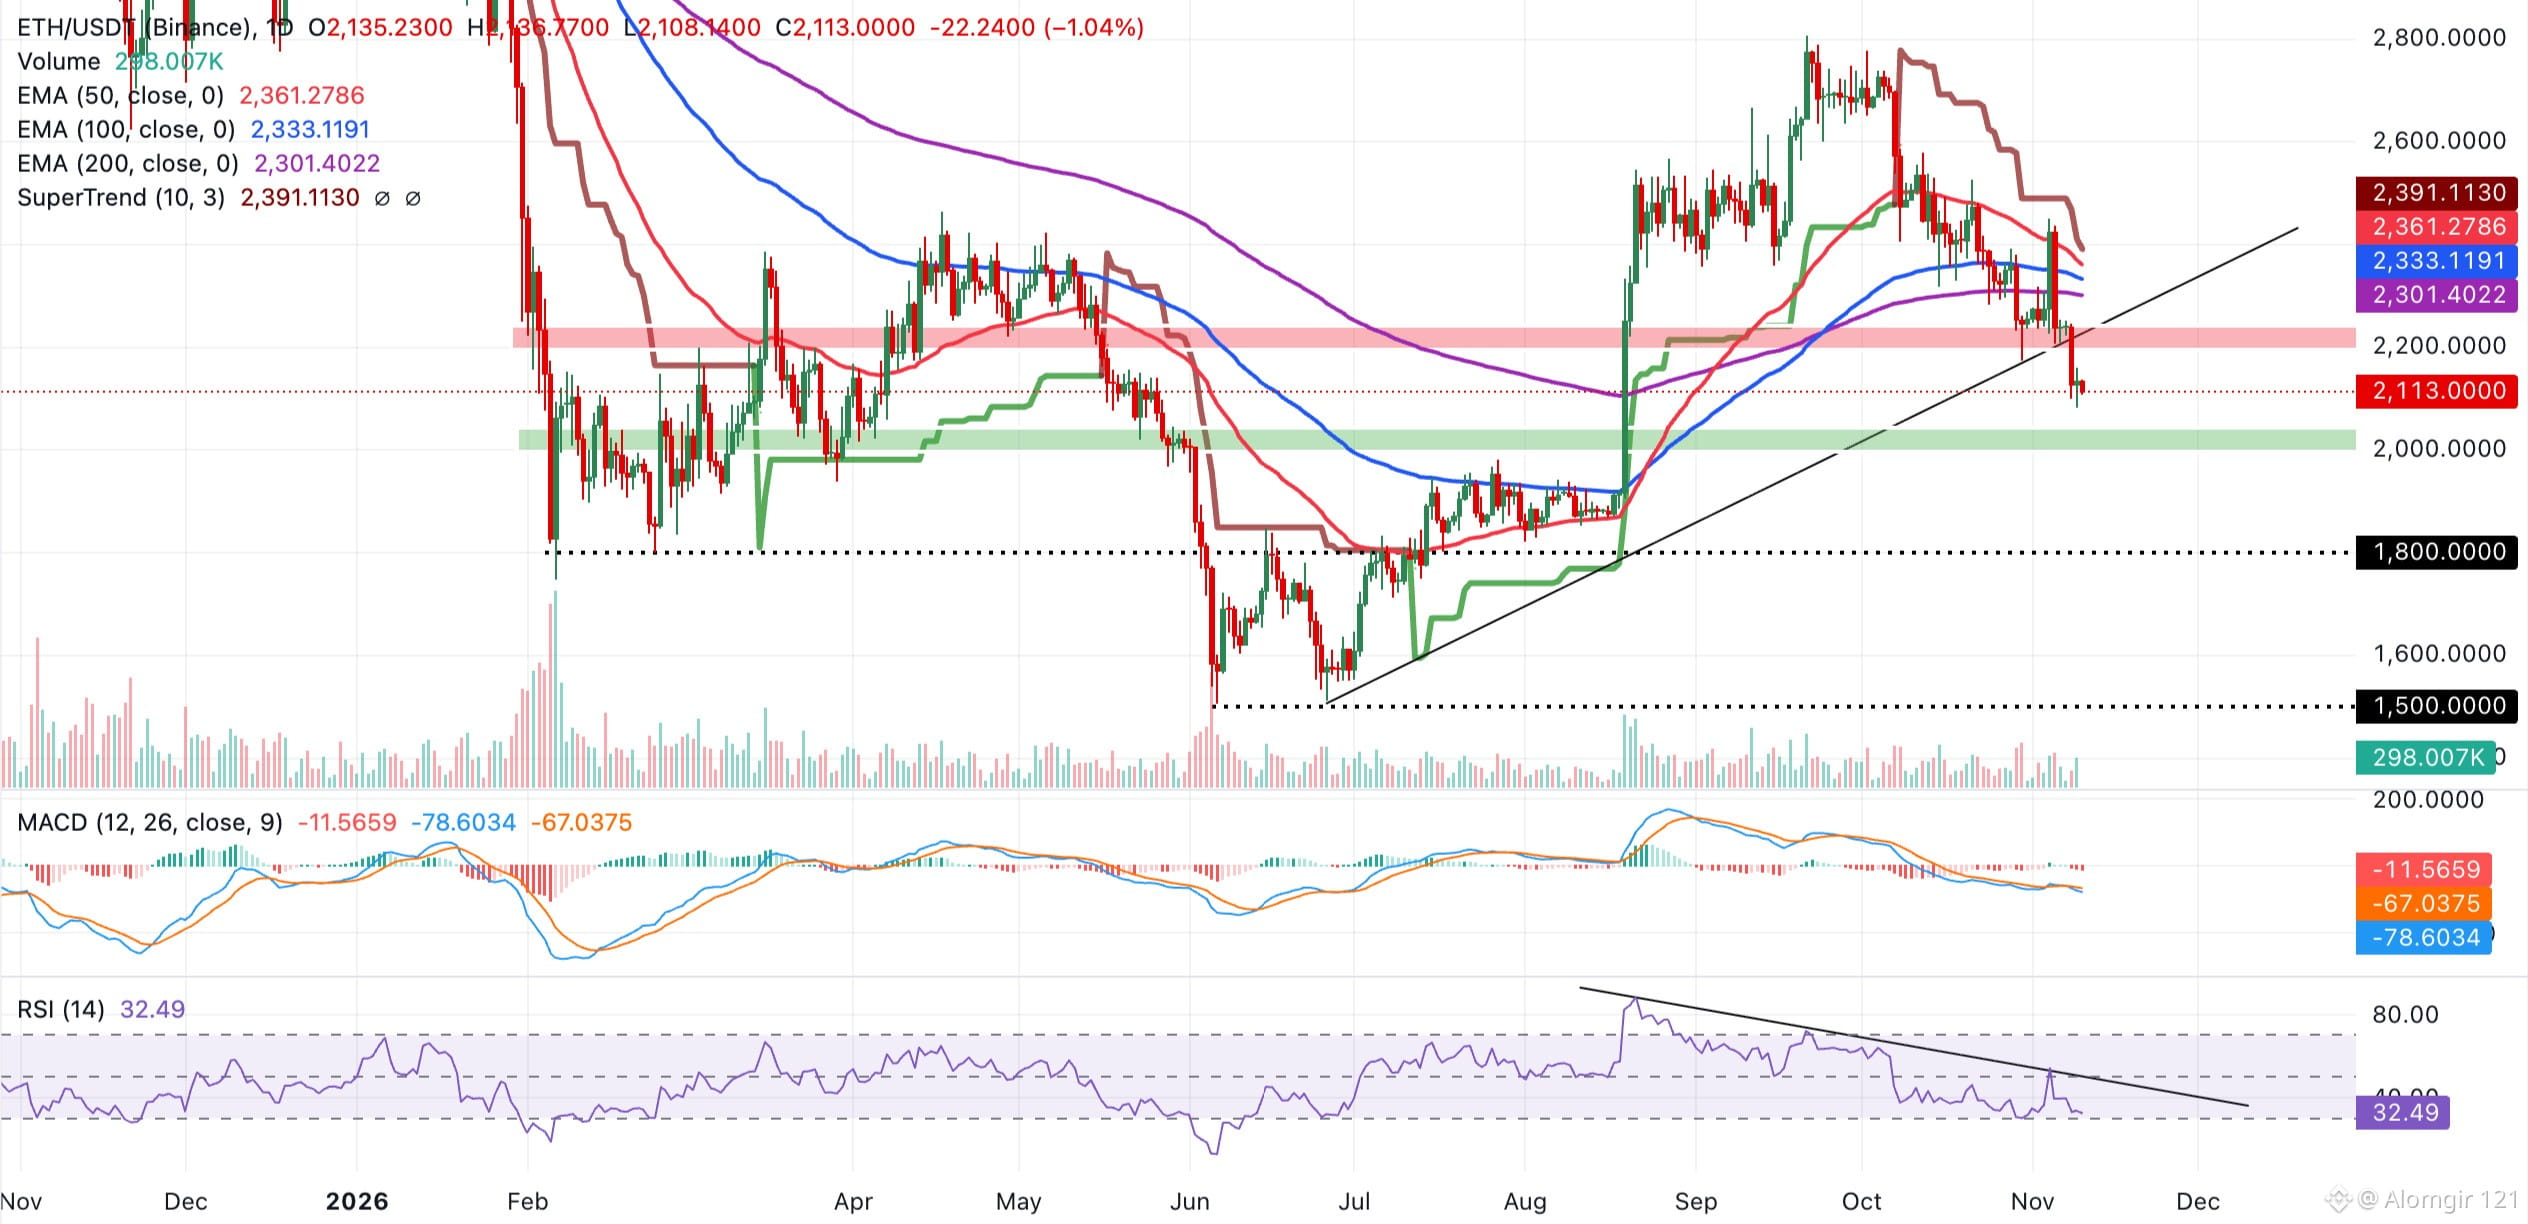
169
$INJ — one thing is clear to me: it keeps the bullish thesis active as the price recently made a higher low compared to the previous swing low. The current sideways trading range is showing respect for the lower boundary, which matches the higher timeframe lean. To get stronger, we need to see it commit above the recent range high.
INJUSDT LONG map
Entry → 8.058 - 8.096
SL → 8.000
TP → 8.154 · 8.216 · 8.293
#MarketAnalysis
{future}(INJUSDT)
$INJ — one thing is clear to me: it keeps the bullish thesis active as the price recently made a higher low compared to the previous swing low. The current sideways trading range is showing respect for the lower boundary, which matches the higher timeframe lean. To get stronger, we need to see it commit above the recent range high.
INJUSDT LONG map
Entry → 8.058 - 8.096
SL → 8.000
TP → 8.154 · 8.216 · 8.293
#MarketAnalysis
INJUSDT LONG map
Entry → 8.058 - 8.096
SL → 8.000
TP → 8.154 · 8.216 · 8.293
#MarketAnalysis
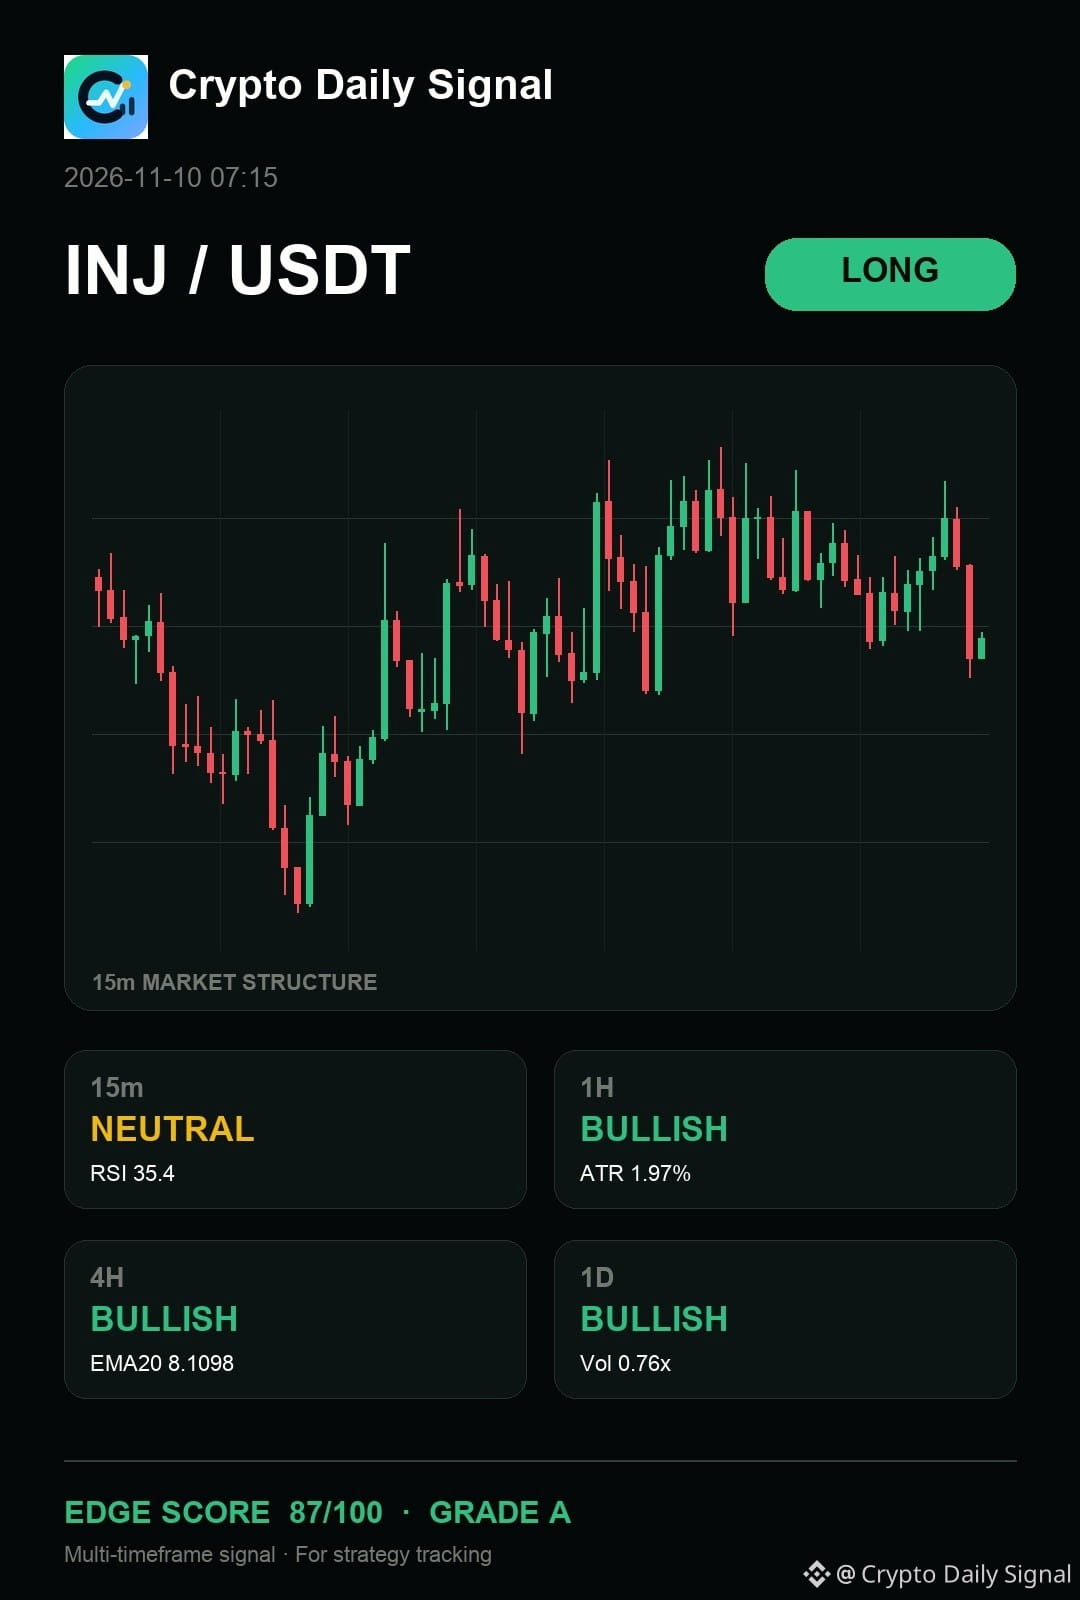
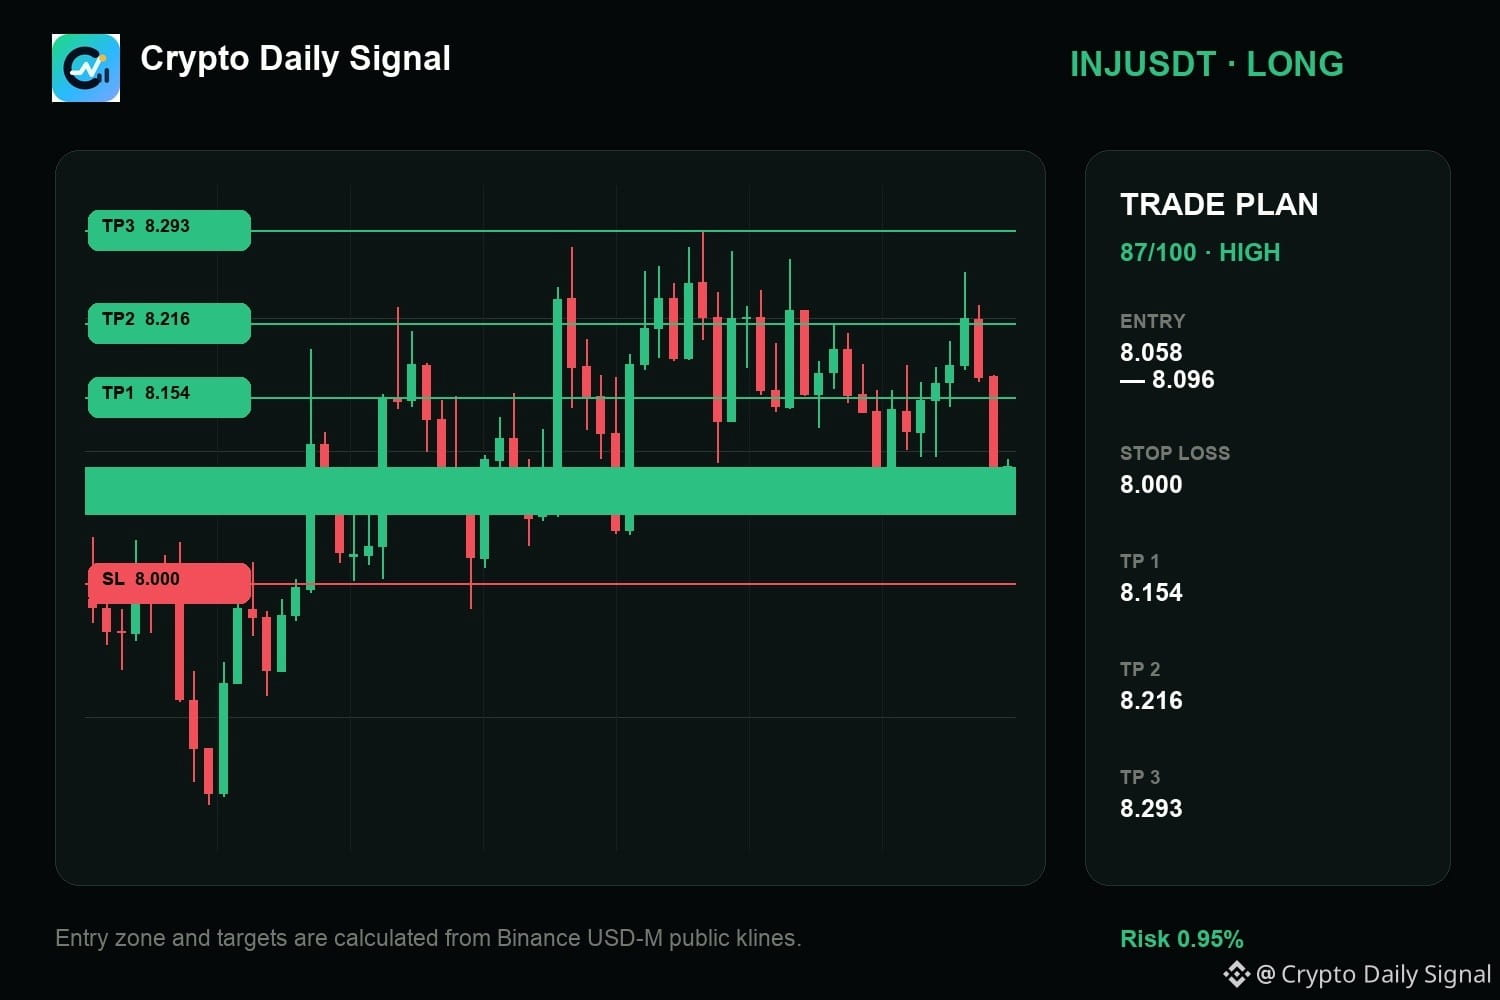
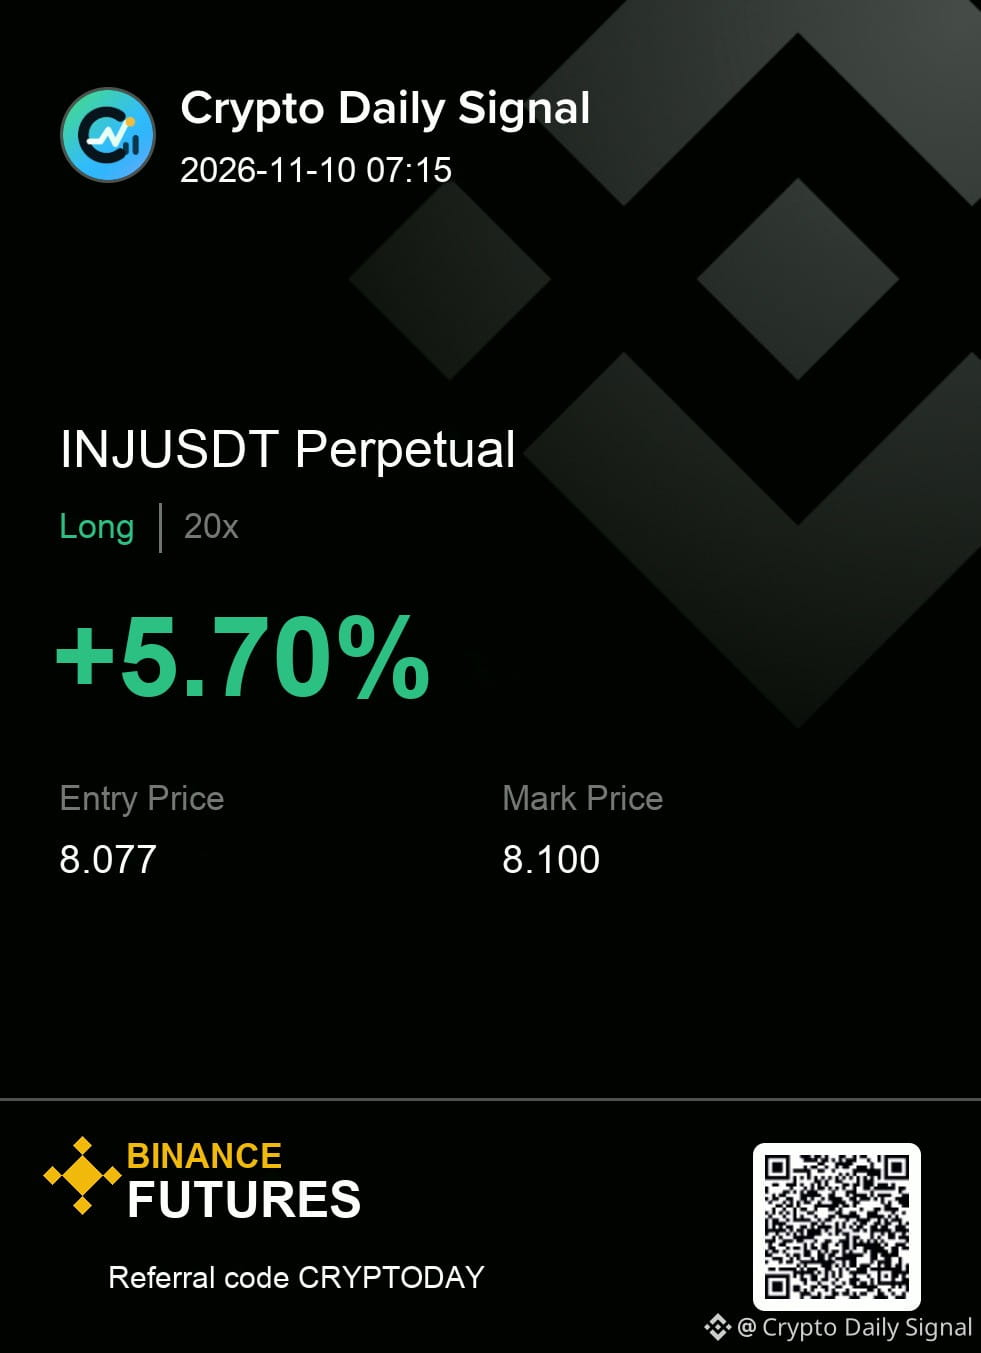
8

The 15-day drawdown table: which names broke structure and which heldOne table that separates the majors from everything else, snapshot 13:30 UTC.
15-day change, close to close:
$BTC -7.44%
$ETH -9.35%
$SOL -14.36%
One-day change:
$BTC -2.19%
$ETH -5.73%
XRP -5.60%
NEAR -4.94%
HYPE -5.07%
ZEC -3.94%
SUI -3.60%
DOGE -2.85%
$SOL -2.87%
ADA -3.05%
BNB -2.42%
PEPE +4.28%
HOT +30.77%
RSR +7.52%
ARB +2.00%
XAUT +0.59%
Position within the 15-day range, close relative to range low:
$BTC +0.92%
$ETH +2.29%
$SOL +1.68%
Now the part worth doing: cross the two columns. $SOL has the worst 15-day drawdown of the three majors at -14.36% but a modest one-day move of -2.87%, and it is 25.62% bid-heavy with negative funding. $ETH has a better 15-day number than $SOL at -9.35% but a far worse day at -5.73%, a balanced book at -0.35%, and the heaviest taker selling of the three at 0.8447.
A large 15-day decline with a quiet day and a bid-heavy book looks different from a large 15-day decline with an active down day and an empty book. The first is where sellers have stopped. The second is where they have not.
Structure across windows, then order book and flow to break the tie. That sequence is the whole method. #MarketAnalysis #Crypto
The 15-day drawdown table: which names broke structure and which held
One table that separates the majors from everything else, snapshot 13:30 UTC.
15-day change, close to close:
$BTC -7.44%
$ETH -9.35%
$SOL -14.36%
One-day change:
$BTC -2.19%
$ETH -5.73%
XRP -5.60%
NEAR -4.94%
HYPE -5.07%
ZEC -3.94%
SUI -3.60%
DOGE -2.85%
$SOL -2.87%
ADA -3.05%
BNB -2.42%
PEPE +4.28%
HOT +30.77%
RSR +7.52%
ARB +2.00%
XAUT +0.59%
Position within the 15-day range, close relative to range low:
$BTC +0.92%
$ETH +2.29%
$SOL +1.68%
Now the part worth doing: cross the two columns. $SOL has the worst 15-day drawdown of the three majors at -14.36% but a modest one-day move of -2.87%, and it is 25.62% bid-heavy with negative funding. $ETH has a better 15-day number than $SOL at -9.35% but a far worse day at -5.73%, a balanced book at -0.35%, and the heaviest taker selling of the three at 0.8447.
A large 15-day decline with a quiet day and a bid-heavy book looks different from a large 15-day decline with an active down day and an empty book. The first is where sellers have stopped. The second is where they have not.
Structure across windows, then order book and flow to break the tie. That sequence is the whole method. #MarketAnalysis #Crypto
15-day change, close to close:
$BTC -7.44%
$ETH -9.35%
$SOL -14.36%
One-day change:
$BTC -2.19%
$ETH -5.73%
XRP -5.60%
NEAR -4.94%
HYPE -5.07%
ZEC -3.94%
SUI -3.60%
DOGE -2.85%
$SOL -2.87%
ADA -3.05%
BNB -2.42%
PEPE +4.28%
HOT +30.77%
RSR +7.52%
ARB +2.00%
XAUT +0.59%
Position within the 15-day range, close relative to range low:
$BTC +0.92%
$ETH +2.29%
$SOL +1.68%
Now the part worth doing: cross the two columns. $SOL has the worst 15-day drawdown of the three majors at -14.36% but a modest one-day move of -2.87%, and it is 25.62% bid-heavy with negative funding. $ETH has a better 15-day number than $SOL at -9.35% but a far worse day at -5.73%, a balanced book at -0.35%, and the heaviest taker selling of the three at 0.8447.
A large 15-day decline with a quiet day and a bid-heavy book looks different from a large 15-day decline with an active down day and an empty book. The first is where sellers have stopped. The second is where they have not.
Structure across windows, then order book and flow to break the tie. That sequence is the whole method. #MarketAnalysis #Crypto
25
Breadth check on Binance spot, snapshot 13:30 UTC:
- 120 of 723 USDT pairs are green (16.6%)
- 14 of 62 liquid pairs above $5M quote volume are green (22.6%)
- 4 of the 20 highest-volume pairs are green
- 49 pairs above +2%, 455 pairs below -2%
That last line is the one that matters. 455 pairs down more than 2% against 49 up more than 2%. Nearly a 10-to-1 split on the extremes.
For context, the big names were not the worst of it: $XRP -5.60%, $ETH -5.73%, NEAR -4.94%, ZEC -3.94%.
A market where almost nothing is up is not a market with isolated weakness. It is one move, expressed everywhere.
That is also why index-level moves can look calmer than the internals. $BTC at -2.19% reads as a soft day; the median pair had it far worse. #Crypto #Altcoins #MarketAnalysis
Breadth check on Binance spot, snapshot 13:30 UTC:
- 120 of 723 USDT pairs are green (16.6%)
- 14 of 62 liquid pairs above $5M quote volume are green (22.6%)
- 4 of the 20 highest-volume pairs are green
- 49 pairs above +2%, 455 pairs below -2%
That last line is the one that matters. 455 pairs down more than 2% against 49 up more than 2%. Nearly a 10-to-1 split on the extremes.
For context, the big names were not the worst of it: $XRP -5.60%, $ETH -5.73%, NEAR -4.94%, ZEC -3.94%.
A market where almost nothing is up is not a market with isolated weakness. It is one move, expressed everywhere.
That is also why index-level moves can look calmer than the internals. $BTC at -2.19% reads as a soft day; the median pair had it far worse. #Crypto #Altcoins #MarketAnalysis
- 120 of 723 USDT pairs are green (16.6%)
- 14 of 62 liquid pairs above $5M quote volume are green (22.6%)
- 4 of the 20 highest-volume pairs are green
- 49 pairs above +2%, 455 pairs below -2%
That last line is the one that matters. 455 pairs down more than 2% against 49 up more than 2%. Nearly a 10-to-1 split on the extremes.
For context, the big names were not the worst of it: $XRP -5.60%, $ETH -5.73%, NEAR -4.94%, ZEC -3.94%.
A market where almost nothing is up is not a market with isolated weakness. It is one move, expressed everywhere.
That is also why index-level moves can look calmer than the internals. $BTC at -2.19% reads as a soft day; the median pair had it far worse. #Crypto #Altcoins #MarketAnalysis
113

#AIChipSlumpNasdaq #📊 BTCUSDT — DAILY MARKET ANALYSIS
🔴 MARKET TREND: Bearish Pressure
📌 PAIR: BTC/USDT
💰 Screenshot Price: 75,557.1 USDT
📉 TECHNICAL ANALYSIS: • Price is below MA(5), MA(10) and MA(20). • The moving averages are trending downward. • Recent candles show selling pressure. • A short-term recovery is possible, but the trend needs confirmation.
🟢 SUPPORT ZONE: 73,442 — Previous chart low shown in the screenshot.
🔴 RESISTANCE ZONES: 75,894 and 78,734 — Chart levels shown in the screenshot.
⚠️ IMPORTANT RISK NOTICE: These levels are taken from the supplied chart and may no longer be current. They are not verified trading targets or a BUY/SELL signal.
Always remember: Cryptocurrency prices are volatile. No profit is guaranteed.
#BTC #Bitcoin #BTCUSDT #CryptoAnalysis #MarketAnalysis
#AIChipSlumpNasdaq #📊 BTCUSDT — DAILY MARKET ANALYSIS
🔴 MARKET TREND: Bearish Pressure
📌 PAIR: BTC/USDT
💰 Screenshot Price: 75,557.1 USDT
📉 TECHNICAL ANALYSIS: • Price is below MA(5), MA(10) and MA(20). • The moving averages are trending downward. • Recent candles show selling pressure. • A short-term recovery is possible, but the trend needs confirmation.
🟢 SUPPORT ZONE: 73,442 — Previous chart low shown in the screenshot.
🔴 RESISTANCE ZONES: 75,894 and 78,734 — Chart levels shown in the screenshot.
⚠️ IMPORTANT RISK NOTICE: These levels are taken from the supplied chart and may no longer be current. They are not verified trading targets or a BUY/SELL signal.
Always remember: Cryptocurrency prices are volatile. No profit is guaranteed.
#BTC #Bitcoin #BTCUSDT #CryptoAnalysis #MarketAnalysis
🔴 MARKET TREND: Bearish Pressure
📌 PAIR: BTC/USDT
💰 Screenshot Price: 75,557.1 USDT
📉 TECHNICAL ANALYSIS: • Price is below MA(5), MA(10) and MA(20). • The moving averages are trending downward. • Recent candles show selling pressure. • A short-term recovery is possible, but the trend needs confirmation.
🟢 SUPPORT ZONE: 73,442 — Previous chart low shown in the screenshot.
🔴 RESISTANCE ZONES: 75,894 and 78,734 — Chart levels shown in the screenshot.
⚠️ IMPORTANT RISK NOTICE: These levels are taken from the supplied chart and may no longer be current. They are not verified trading targets or a BUY/SELL signal.
Always remember: Cryptocurrency prices are volatile. No profit is guaranteed.
#BTC #Bitcoin #BTCUSDT #CryptoAnalysis #MarketAnalysis
104

🚨 $BTC ALERT: The Make-or-Break Moment is HERE! 🚨
Bitcoin is trading on a knife-edge right now (~$75,662). We are in extreme compression, which almost always means an explosive move is imminent.
Are we looking at a relief rally or a final breakdown? Here are the levels that matter right now. 👇
The Technical Setup:
Trend: Short-term Bearish (trading below EMA50).
RSI: Siting near 38 (Oversold territory). A relief bounce is loading.
🔴 The Bear Case (Breakdown):
If BTC loses $74,800, expect a rapid cascade to $73,200 to sweep liquidity before any real recovery.
🟢 The Bull Case (Breakout):
Bulls must reclaim and close a 4-hour candle above $76,400. Do that, and we target $79,700+.
Trader Verdict: Patience is key. Wait for confirmation at $76.4k or look to "buy the blood" near $73.2k.
🔥 COMMUNITY POLL:
Which way is the volatility breaking?
👍 = Breakout to $80k
👎 = Breakdown to $73k
Drop your target price in the comments!
#Bitcoin #BTC #CryptoTrading #MarketAnalysis #crypto
{spot}(BTCUSDT)
🚨 $BTC ALERT: The Make-or-Break Moment is HERE! 🚨
Bitcoin is trading on a knife-edge right now (~$75,662). We are in extreme compression, which almost always means an explosive move is imminent.
Are we looking at a relief rally or a final breakdown? Here are the levels that matter right now. 👇
The Technical Setup:
Trend: Short-term Bearish (trading below EMA50).
RSI: Siting near 38 (Oversold territory). A relief bounce is loading.
🔴 The Bear Case (Breakdown):
If BTC loses $74,800, expect a rapid cascade to $73,200 to sweep liquidity before any real recovery.
🟢 The Bull Case (Breakout):
Bulls must reclaim and close a 4-hour candle above $76,400. Do that, and we target $79,700+.
Trader Verdict: Patience is key. Wait for confirmation at $76.4k or look to "buy the blood" near $73.2k.
🔥 COMMUNITY POLL:
Which way is the volatility breaking?
👍 = Breakout to $80k
👎 = Breakdown to $73k
Drop your target price in the comments!
#Bitcoin #BTC #CryptoTrading #MarketAnalysis #crypto
Bitcoin is trading on a knife-edge right now (~$75,662). We are in extreme compression, which almost always means an explosive move is imminent.
Are we looking at a relief rally or a final breakdown? Here are the levels that matter right now. 👇
The Technical Setup:
Trend: Short-term Bearish (trading below EMA50).
RSI: Siting near 38 (Oversold territory). A relief bounce is loading.
🔴 The Bear Case (Breakdown):
If BTC loses $74,800, expect a rapid cascade to $73,200 to sweep liquidity before any real recovery.
🟢 The Bull Case (Breakout):
Bulls must reclaim and close a 4-hour candle above $76,400. Do that, and we target $79,700+.
Trader Verdict: Patience is key. Wait for confirmation at $76.4k or look to "buy the blood" near $73.2k.
🔥 COMMUNITY POLL:
Which way is the volatility breaking?
👍 = Breakout to $80k
👎 = Breakdown to $73k
Drop your target price in the comments!
#Bitcoin #BTC #CryptoTrading #MarketAnalysis #crypto
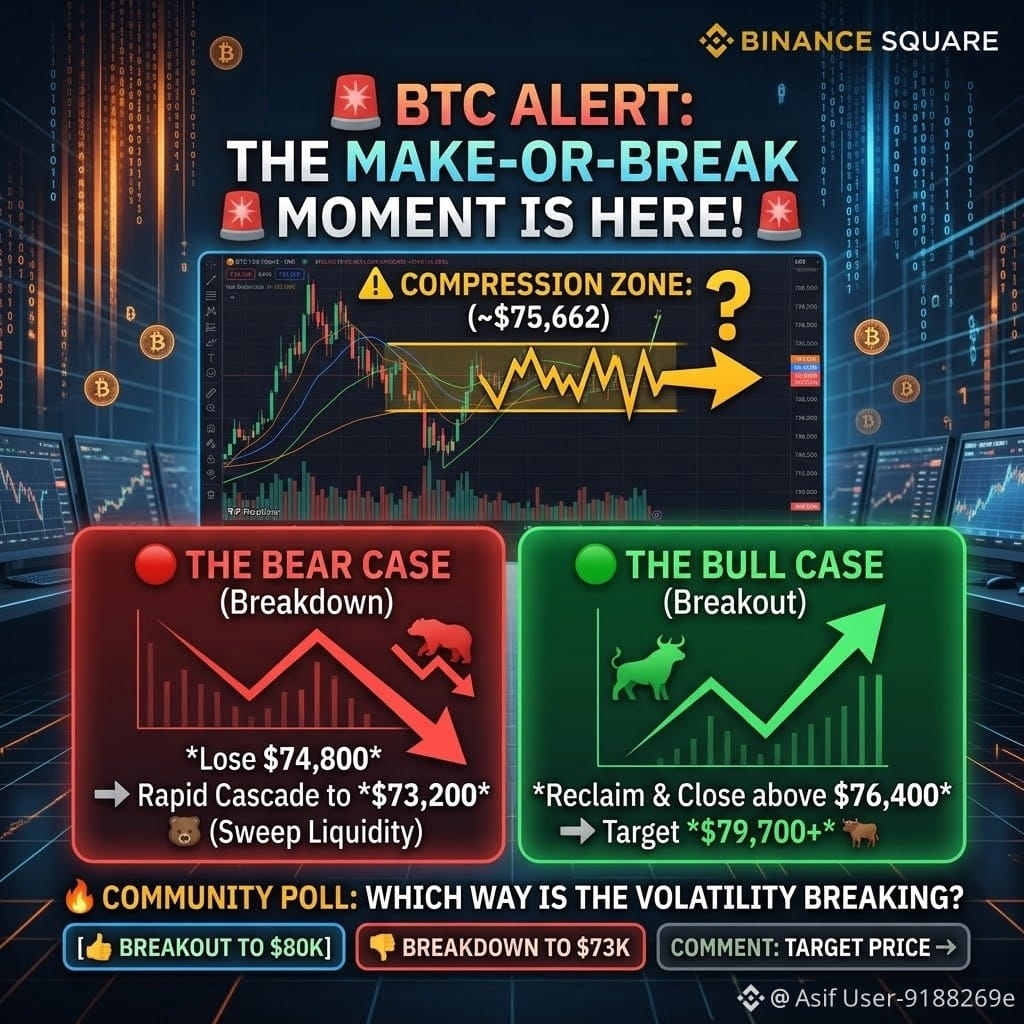
68
$FIL keeps the bearish thesis active as the price action is carving out lower highs across shorter timeframes, staying under the trendline connecting previous peaks. Volume remains elevated, adding weight to the weakness shown in the recent candle bodies. A clear close below the immediate trading range floor would solidify this downside bias.
I only want the planned reaction; anything else is a pass.
My levels for FILUSDT — SHORT
Entry zone 0.7642 - 0.7656
Risk line 0.7689
Targets 0.7609 / 0.7577 / 0.7538
#MarketAnalysis
{future}(FILUSDT)
$FIL keeps the bearish thesis active as the price action is carving out lower highs across shorter timeframes, staying under the trendline connecting previous peaks. Volume remains elevated, adding weight to the weakness shown in the recent candle bodies. A clear close below the immediate trading range floor would solidify this downside bias.
I only want the planned reaction; anything else is a pass.
My levels for FILUSDT — SHORT
Entry zone 0.7642 - 0.7656
Risk line 0.7689
Targets 0.7609 / 0.7577 / 0.7538
#MarketAnalysis
I only want the planned reaction; anything else is a pass.
My levels for FILUSDT — SHORT
Entry zone 0.7642 - 0.7656
Risk line 0.7689
Targets 0.7609 / 0.7577 / 0.7538
#MarketAnalysis
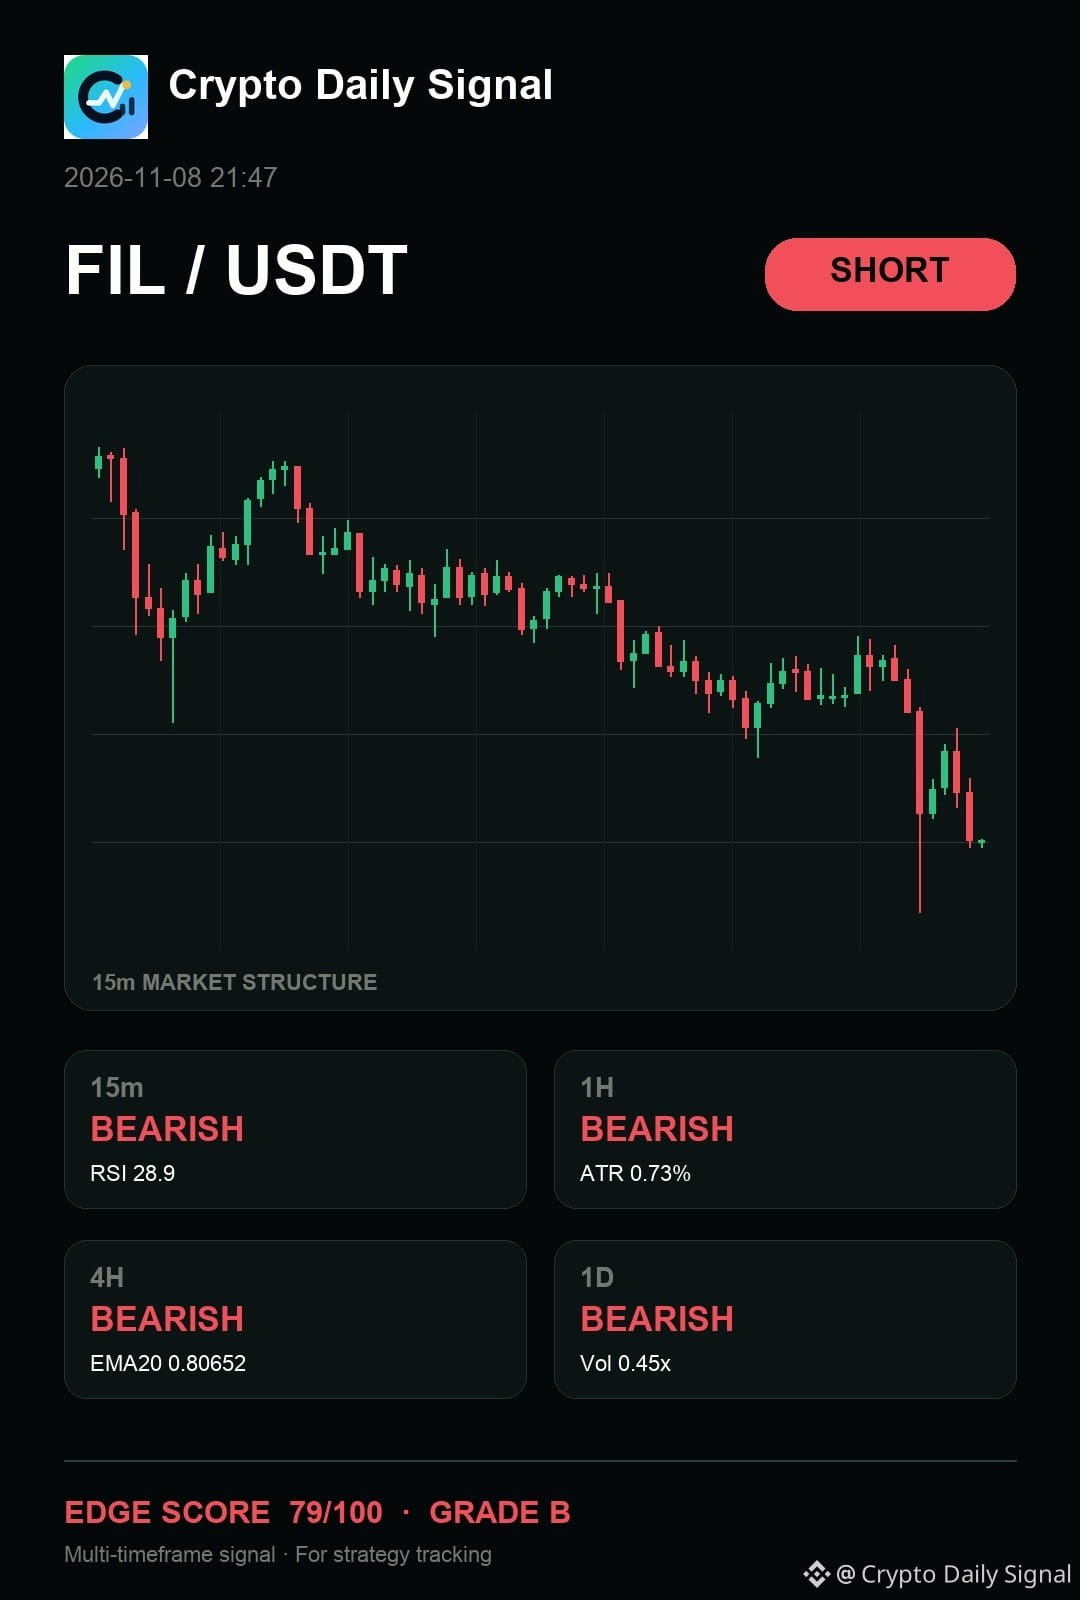
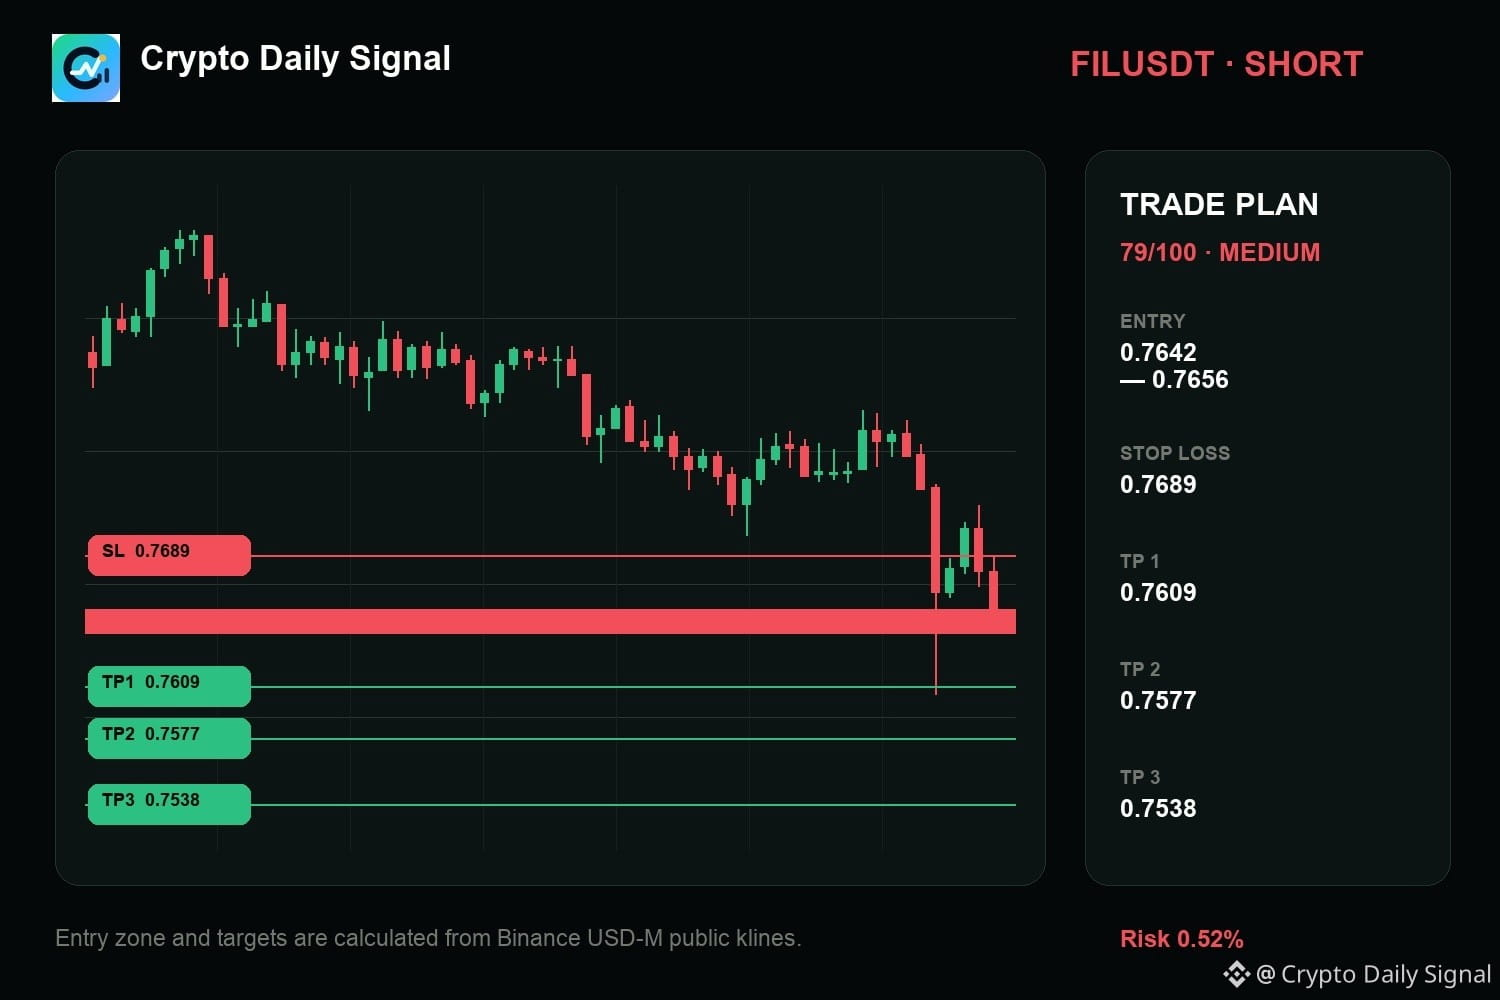
59

·
--
$BTC Market Outlook | November 8
Bitcoin remains under pressure as institutional ETF outflows and broader market uncertainty weigh on sentiment.
Key Levels:
- Support: $76K–$78K
- Resistance: $80K–$82K
My Take: A sustained recovery above $80K could improve bullish momentum. Until then, risk management and patience remain key. Avoid chasing volatile moves.
#Bitcoin #BTC
#CryptoMarketMoves #TradingTales #MarketAnalysis
{spot}(BTCUSDT)
$BTC Market Outlook | November 8
Bitcoin remains under pressure as institutional ETF outflows and broader market uncertainty weigh on sentiment.
Key Levels:
- Support: $76K–$78K
- Resistance: $80K–$82K
My Take: A sustained recovery above $80K could improve bullish momentum. Until then, risk management and patience remain key. Avoid chasing volatile moves.
#Bitcoin #BTC
#CryptoMarketMoves #TradingTales #MarketAnalysis
Bitcoin remains under pressure as institutional ETF outflows and broader market uncertainty weigh on sentiment.
Key Levels:
- Support: $76K–$78K
- Resistance: $80K–$82K
My Take: A sustained recovery above $80K could improve bullish momentum. Until then, risk management and patience remain key. Avoid chasing volatile moves.
#Bitcoin #BTC
#CryptoMarketMoves #TradingTales #MarketAnalysis
82
Log in to explore more content
Join global crypto users on Binance Square
⚡️ Get latest and useful information about crypto.
💬 Trusted by the world’s largest crypto exchange.
👍 Discover real insights from verified creators.
Email / Phone number
Trending Topics
1
#WhoWillSucceedJensenHuangatNvidia?
81,433 views
1,115 Discussing
2
#WhatWillDriveCryptoandStocks’NextRebound?
431,655 views
3,015 Discussing
3
#BitcoinActiveSupplyInProfitDropsBelow45%
21,738 views
336 Discussing
4
#KavaSaysAbnormalActivityLimitedToKavaLend
8,507 views
170 Discussing
5
#USSpotXRPETFsSeeLargestWeeklyOutflowIn8Months
7,720 views
161 Discussing
6
#USPPIMissMayEaseBTCPressure
206,752 views
2,041 Discussing
7
#WORPTLetsTouristsConvertCryptoToThaiBaht
2,550 views
50 Discussing
8
#TONStrategyReports$23.97MQ3NetLoss
3,193 views
41 Discussing
9
#PolkadotCommunityApprovesNewStrategyWith97%Vote
18,626 views
244 Discussing
10
#dYdXPlansV9.9UpgradeToShiftUSDCToInjective
11,380 views
197 Discussing