
#technicalanalysis
technicalanalysis
28.4M Aufrufe
198,628 Kommentare
Hot
Zuletzt

·
--
Bärisch
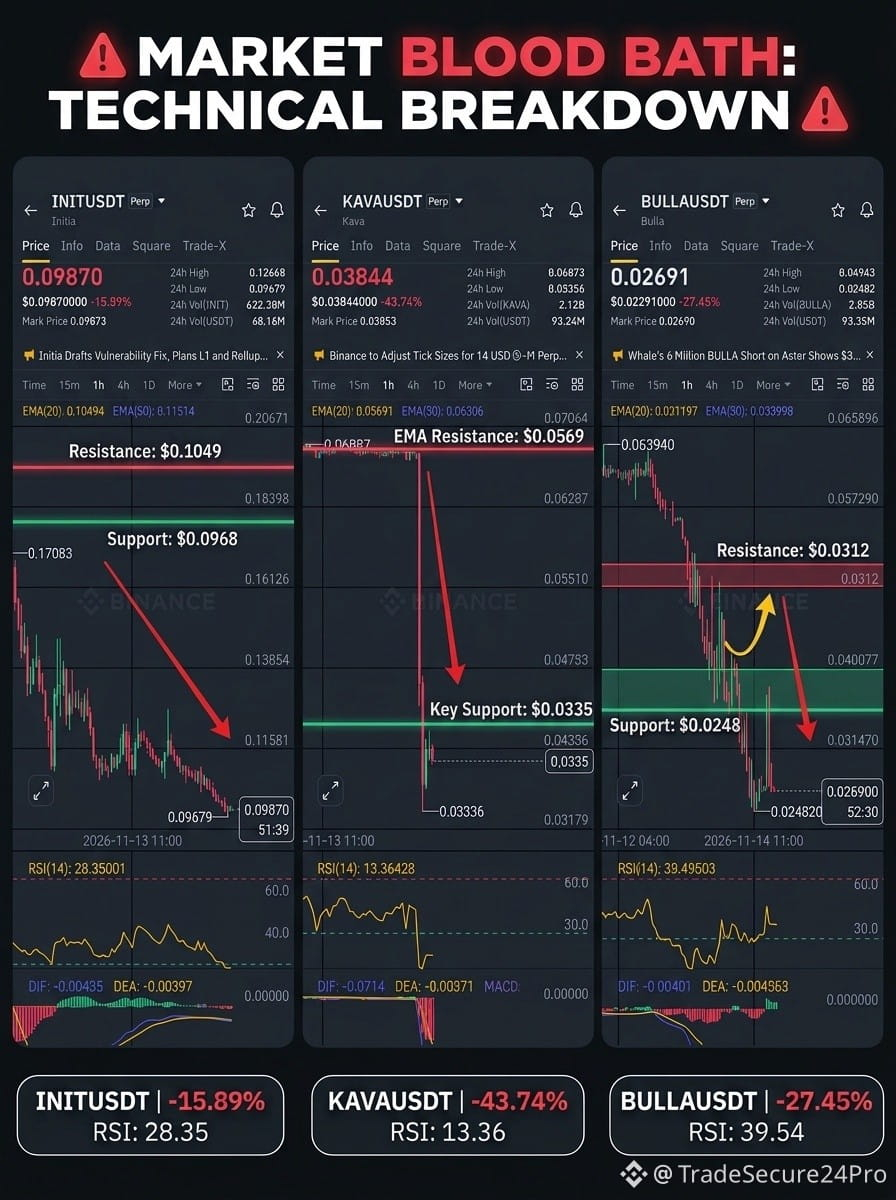
🚨 BLUTBAD AM MARKT: 3 Coins stehen gerade vor massiven Abverkäufen! 📉🔥
Die Bären haben die totale Kontrolle übernommen! Sicherheitslücken, Leerverkäufe von Walen und Netzwerkausfälle lösen Panikverkäufe aus. Hier die technische Analyse:
1️⃣ $KAVA (KAVAUSDT) — Der vertikale Absturz um 43 % 🔻
Kurs & Technik: Um -43.74 % auf $0.03844 abgestürzt. Weit unter dem EMA(20) ($0.05691), der RSI(14) liegt mit 13.36 im extremen Bereich (stark überverkauft).
Auslöser & Beobachtung: Sicherheitsbedenken und Handelsstopps an Börsen lösten Panikverkäufe aus. Behalte die Unterstützung bei $0.0335 im Blick – ein Durchbruch könnte weitere Verluste bringen, während Erholungen späte Leerverkäufer in die Falle locken könnten!
2️⃣ $INIT (INITUSDT) — Abwärtstrend hält trotz Netzwerkausfall an ⚠️
Kurs & Technik: Um -15.89 % auf $0.09870 gefallen, am EMA(20) ($0.10494) abgeprallt, RSI(14) bei 28.35 und bärischer MACD.
Auslöser & Beobachtung: Händler verkaufen wegen des jüngsten Exploits und des Netzwerkausfalls. Wenn die Unterstützung bei $0.0968 nicht hält, ist mit einem weiteren Kursrückgang zu rechnen.
3️⃣ $BULLA (BULLAUSDT) — Wale gehen massiv short 🐋
Kurs & Technik: Um -27.45 % auf $0.02691 unter den EMA(20) ($0.03119) gefallen. Der RSI(14) liegt bei 39.54 und deutet auf eine vorübergehende Erholung hin.
Auslöser & Beobachtung: Ein massiver Short von 6M BULLA durch einen Wal verstärkt den Abwärtsdruck. Achte auf eine mögliche Abweisung an der Widerstandszone bei $0.0312.
💡 Fazit für Trader: Wenn der RSI auf 13–28 fällt, solltest du nicht blind am Tief FOMO-shorten! Extrem überverkaufte Niveaus lösen oft heftige Short Squeezes aus. Begrenze dein Risiko mit strikten Stop-Losses. 🛡️
Shortest du den Trend oder setzt du auf eine Erholung? Schreib es unten in die Kommentare! 👇💬
#BİNANCEFUTURES #KAVA #INIT #BULLA #TechnicalAnalysis
🚨 BLUTBAD AM MARKT: 3 Coins stehen gerade vor massiven Abverkäufen! 📉🔥
Die Bären haben die totale Kontrolle übernommen! Sicherheitslücken, Leerverkäufe von Walen und Netzwerkausfälle lösen Panikverkäufe aus. Hier die technische Analyse:
1️⃣ $KAVA (KAVAUSDT) — Der vertikale Absturz um 43 % 🔻
Kurs & Technik: Um -43.74 % auf $0.03844 abgestürzt. Weit unter dem EMA(20) ($0.05691), der RSI(14) liegt mit 13.36 im extremen Bereich (stark überverkauft).
Auslöser & Beobachtung: Sicherheitsbedenken und Handelsstopps an Börsen lösten Panikverkäufe aus. Behalte die Unterstützung bei $0.0335 im Blick – ein Durchbruch könnte weitere Verluste bringen, während Erholungen späte Leerverkäufer in die Falle locken könnten!
2️⃣ $INIT (INITUSDT) — Abwärtstrend hält trotz Netzwerkausfall an ⚠️
Kurs & Technik: Um -15.89 % auf $0.09870 gefallen, am EMA(20) ($0.10494) abgeprallt, RSI(14) bei 28.35 und bärischer MACD.
Auslöser & Beobachtung: Händler verkaufen wegen des jüngsten Exploits und des Netzwerkausfalls. Wenn die Unterstützung bei $0.0968 nicht hält, ist mit einem weiteren Kursrückgang zu rechnen.
3️⃣ $BULLA (BULLAUSDT) — Wale gehen massiv short 🐋
Kurs & Technik: Um -27.45 % auf $0.02691 unter den EMA(20) ($0.03119) gefallen. Der RSI(14) liegt bei 39.54 und deutet auf eine vorübergehende Erholung hin.
Auslöser & Beobachtung: Ein massiver Short von 6M BULLA durch einen Wal verstärkt den Abwärtsdruck. Achte auf eine mögliche Abweisung an der Widerstandszone bei $0.0312.
💡 Fazit für Trader: Wenn der RSI auf 13–28 fällt, solltest du nicht blind am Tief FOMO-shorten! Extrem überverkaufte Niveaus lösen oft heftige Short Squeezes aus. Begrenze dein Risiko mit strikten Stop-Losses. 🛡️
Shortest du den Trend oder setzt du auf eine Erholung? Schreib es unten in die Kommentare! 👇💬
#BİNANCEFUTURES #KAVA #INIT #BULLA #TechnicalAnalysis
Die Bären haben die totale Kontrolle übernommen! Sicherheitslücken, Leerverkäufe von Walen und Netzwerkausfälle lösen Panikverkäufe aus. Hier die technische Analyse:
1️⃣ $KAVA (KAVAUSDT) — Der vertikale Absturz um 43 % 🔻
Kurs & Technik: Um -43.74 % auf $0.03844 abgestürzt. Weit unter dem EMA(20) ($0.05691), der RSI(14) liegt mit 13.36 im extremen Bereich (stark überverkauft).
Auslöser & Beobachtung: Sicherheitsbedenken und Handelsstopps an Börsen lösten Panikverkäufe aus. Behalte die Unterstützung bei $0.0335 im Blick – ein Durchbruch könnte weitere Verluste bringen, während Erholungen späte Leerverkäufer in die Falle locken könnten!
2️⃣ $INIT (INITUSDT) — Abwärtstrend hält trotz Netzwerkausfall an ⚠️
Kurs & Technik: Um -15.89 % auf $0.09870 gefallen, am EMA(20) ($0.10494) abgeprallt, RSI(14) bei 28.35 und bärischer MACD.
Auslöser & Beobachtung: Händler verkaufen wegen des jüngsten Exploits und des Netzwerkausfalls. Wenn die Unterstützung bei $0.0968 nicht hält, ist mit einem weiteren Kursrückgang zu rechnen.
3️⃣ $BULLA (BULLAUSDT) — Wale gehen massiv short 🐋
Kurs & Technik: Um -27.45 % auf $0.02691 unter den EMA(20) ($0.03119) gefallen. Der RSI(14) liegt bei 39.54 und deutet auf eine vorübergehende Erholung hin.
Auslöser & Beobachtung: Ein massiver Short von 6M BULLA durch einen Wal verstärkt den Abwärtsdruck. Achte auf eine mögliche Abweisung an der Widerstandszone bei $0.0312.
💡 Fazit für Trader: Wenn der RSI auf 13–28 fällt, solltest du nicht blind am Tief FOMO-shorten! Extrem überverkaufte Niveaus lösen oft heftige Short Squeezes aus. Begrenze dein Risiko mit strikten Stop-Losses. 🛡️
Shortest du den Trend oder setzt du auf eine Erholung? Schreib es unten in die Kommentare! 👇💬
#BİNANCEFUTURES #KAVA #INIT #BULLA #TechnicalAnalysis
CipherX 零号:
1
1
2
1
1k

·
--
Bärisch
Übersetzung ansehen
$AKE
Following extreme intraday volatility between $0.009067 and $0.018115, $AKE has cooled down into a steady accumulation phase, currently trading at $0.012373.
Bullish MA Alignment: Price has reclaimed and is holding above all three key moving averages—MA(7) at $0.012273, MA(25) at $0.012180, and MA(99) at $0.012054—signaling a gradual shift back to short-term bullish momentum.
Key Support: $0.01205 – $0.01218 (MA99 & MA25 confluence zone).
Key Resistance: $0.01300 – $0.01350 (previous breakdown area).
As long as bulls defend the $0.01205 support level, a breakout backed by rising volume could trigger a retest of the $0.01300+ zone.
Not financial advice. Always manage your risk.
$AKE #AKE #USDT #CryptoTrading #TechnicalAnalysis
$AKE
Following extreme intraday volatility between $0.009067 and $0.018115, $AKE has cooled down into a steady accumulation phase, currently trading at $0.012373.
Bullish MA Alignment: Price has reclaimed and is holding above all three key moving averages—MA(7) at $0.012273, MA(25) at $0.012180, and MA(99) at $0.012054—signaling a gradual shift back to short-term bullish momentum.
Key Support: $0.01205 – $0.01218 (MA99 & MA25 confluence zone).
Key Resistance: $0.01300 – $0.01350 (previous breakdown area).
As long as bulls defend the $0.01205 support level, a breakout backed by rising volume could trigger a retest of the $0.01300+ zone.
Not financial advice. Always manage your risk.
$AKE #AKE #USDT #CryptoTrading #TechnicalAnalysis
Following extreme intraday volatility between $0.009067 and $0.018115, $AKE has cooled down into a steady accumulation phase, currently trading at $0.012373.
Bullish MA Alignment: Price has reclaimed and is holding above all three key moving averages—MA(7) at $0.012273, MA(25) at $0.012180, and MA(99) at $0.012054—signaling a gradual shift back to short-term bullish momentum.
Key Support: $0.01205 – $0.01218 (MA99 & MA25 confluence zone).
Key Resistance: $0.01300 – $0.01350 (previous breakdown area).
As long as bulls defend the $0.01205 support level, a breakout backed by rising volume could trigger a retest of the $0.01300+ zone.
Not financial advice. Always manage your risk.
$AKE #AKE #USDT #CryptoTrading #TechnicalAnalysis
2
509


·
--
Übersetzung ansehen
$SUI
🔴 SUI/USDT: Bears Are Taking Control!
SUI is showing significant weakness on the 4H timeframe.
Price is trading around $0.7457, sitting below EMA 7, EMA 25 and EMA 99. This bearish alignment suggests sellers still have control of the market.
Key levels I'm watching:
🔻 Support: $0.7412 – $0.7355
🔺 Resistance: $0.7666 – $0.7752
The Williams %R is deeply oversold, so a temporary bounce is possible. I would rather wait for a weak retest before considering another short.
My bias remains bearish until buyers reclaim important resistance levels.
Would you buy this dip, or wait for another leg down?
#SUI #CryptoTrading #TechnicalAnalysis
{future}(SUIUSDT)
$SUI
🔴 SUI/USDT: Bears Are Taking Control!
SUI is showing significant weakness on the 4H timeframe.
Price is trading around $0.7457, sitting below EMA 7, EMA 25 and EMA 99. This bearish alignment suggests sellers still have control of the market.
Key levels I'm watching:
🔻 Support: $0.7412 – $0.7355
🔺 Resistance: $0.7666 – $0.7752
The Williams %R is deeply oversold, so a temporary bounce is possible. I would rather wait for a weak retest before considering another short.
My bias remains bearish until buyers reclaim important resistance levels.
Would you buy this dip, or wait for another leg down?
#SUI #CryptoTrading #TechnicalAnalysis
🔴 SUI/USDT: Bears Are Taking Control!
SUI is showing significant weakness on the 4H timeframe.
Price is trading around $0.7457, sitting below EMA 7, EMA 25 and EMA 99. This bearish alignment suggests sellers still have control of the market.
Key levels I'm watching:
🔻 Support: $0.7412 – $0.7355
🔺 Resistance: $0.7666 – $0.7752
The Williams %R is deeply oversold, so a temporary bounce is possible. I would rather wait for a weak retest before considering another short.
My bias remains bearish until buyers reclaim important resistance levels.
Would you buy this dip, or wait for another leg down?
#SUI #CryptoTrading #TechnicalAnalysis
1
389

·
--
Übersetzung ansehen
🟢 $LTC · 1H
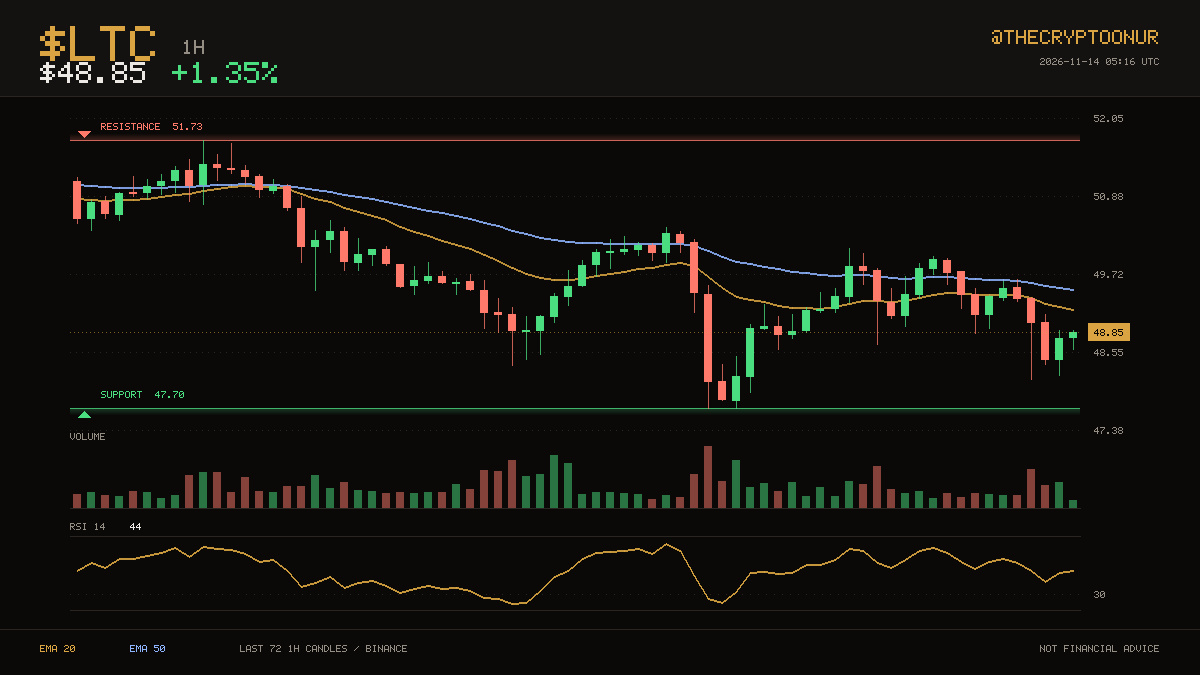
Price is $48.85 and $LTC remains below the averages that capped it earlier. $47.70 on the low side and $51.73 on the high side have contained the last three days. Price is down in the lower third of that range. That is 5.9% to the ceiling and 2.4% to the floor. The 20 has stayed below the 50 for a long stretch now. RSI at 44 is neutral, so momentum is not blocking a move either way. Over the past day it has traded between $47.86 and $50.11, sitting around the middle of it now. Turnover is unremarkable, running 1.0x the recent average. Up 1.3% over 24 hours.
DYOR
$LTC #TechnicalAnalysis
🟢 $LTC · 1H
Price is $48.85 and $LTC remains below the averages that capped it earlier. $47.70 on the low side and $51.73 on the high side have contained the last three days. Price is down in the lower third of that range. That is 5.9% to the ceiling and 2.4% to the floor. The 20 has stayed below the 50 for a long stretch now. RSI at 44 is neutral, so momentum is not blocking a move either way. Over the past day it has traded between $47.86 and $50.11, sitting around the middle of it now. Turnover is unremarkable, running 1.0x the recent average. Up 1.3% over 24 hours.
DYOR
$LTC #TechnicalAnalysis
Price is $48.85 and $LTC remains below the averages that capped it earlier. $47.70 on the low side and $51.73 on the high side have contained the last three days. Price is down in the lower third of that range. That is 5.9% to the ceiling and 2.4% to the floor. The 20 has stayed below the 50 for a long stretch now. RSI at 44 is neutral, so momentum is not blocking a move either way. Over the past day it has traded between $47.86 and $50.11, sitting around the middle of it now. Turnover is unremarkable, running 1.0x the recent average. Up 1.3% over 24 hours.
DYOR
$LTC #TechnicalAnalysis
1
651

·
--
Bärisch
⚠️ $ZEC — VERSUCHE NICHT, DAS FALLENDE MESSER AUFZUFANGEN!
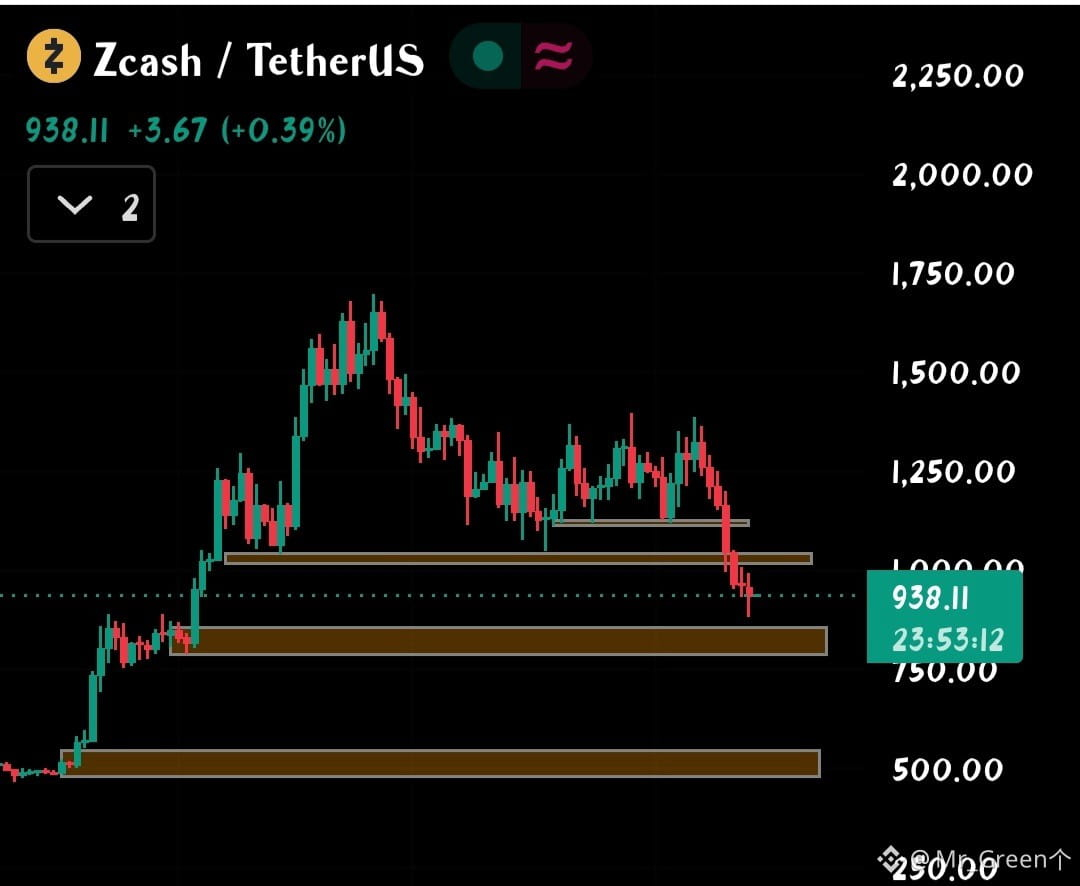
Ich bin bei Zcash weiterhin bearish. Der Chart zeigt mehr als nur einen normalen Rücksetzer; die Marktstruktur hat sich deutlich verschlechtert.
Schauen wir uns die technische Lage an:
📉 1. Marktstruktur
ZEC hat mehrere Unterstützungszonen verloren und bildet weiterhin tiefere Hochs und tiefere Tiefs. Solange wir keinen klaren Wechsel der Marktstruktur (MSS) und ein höheres Tief sehen, gibt es für mich keinen überzeugenden Grund, bullisch zu werden.
📊 2. Momentum-Indikatoren
Der Tages-RSI liegt bei etwa 32,8 – der überverkauften Zone nahe.
Der MACD bleibt negativ und signalisiert bärisches Momentum.
Der Kurs liegt unter den wichtigen gleitenden Tagesdurchschnitten.
Auch der technische Ausblick im 4-Stunden-Chart zeigt starken Abwärtsdruck.
Überverkaufte Bedingungen können eine Erholung auslösen, signalisieren aber nicht automatisch eine Trendwende.
🎯 3. Wichtige Kurszonen
$916: Unmittelbare Unterstützung, die es zu beobachten gilt.
$800–$860: Meine bevorzugte Zone für eine mögliche Seitwärtskonsolidierung.
$1,000–$1,050: Wichtiger Widerstandsbereich, den der Kurs zurückerobern muss.
Unter $800: Das Risiko weiterer Kursverluste steigt.
Meine Strategie?
Ich habe kein Interesse daran, ZEC hier blind zu kaufen. Ich würde lieber warten, bis sich der Kurs im Bereich von $800–$860 stabilisiert, eine solide Basis bildet und eine bullische Struktur zeigt.
Wenn du unbedingt gegen den Trend handeln willst, liegt das Risiko bei dir. Verwechsle aber eine vorübergehende Erholung nicht mit einer bestätigten Trendwende.
Geduld ist auch eine Position. Lass ZEC erst beweisen, dass die Käufer zurück sind, bevor du über einen Long nachdenkst.
#ZEC #Zcash #CryptoAnalysis #TechnicalAnalysis
{future}(ZECUSDT)
⚠️ $ZEC — VERSUCHE NICHT, DAS FALLENDE MESSER AUFZUFANGEN!
Ich bin bei Zcash weiterhin bearish. Der Chart zeigt mehr als nur einen normalen Rücksetzer; die Marktstruktur hat sich deutlich verschlechtert.
Schauen wir uns die technische Lage an:
📉 1. Marktstruktur
ZEC hat mehrere Unterstützungszonen verloren und bildet weiterhin tiefere Hochs und tiefere Tiefs. Solange wir keinen klaren Wechsel der Marktstruktur (MSS) und ein höheres Tief sehen, gibt es für mich keinen überzeugenden Grund, bullisch zu werden.
📊 2. Momentum-Indikatoren
Der Tages-RSI liegt bei etwa 32,8 – der überverkauften Zone nahe.
Der MACD bleibt negativ und signalisiert bärisches Momentum.
Der Kurs liegt unter den wichtigen gleitenden Tagesdurchschnitten.
Auch der technische Ausblick im 4-Stunden-Chart zeigt starken Abwärtsdruck.
Überverkaufte Bedingungen können eine Erholung auslösen, signalisieren aber nicht automatisch eine Trendwende.
🎯 3. Wichtige Kurszonen
$916: Unmittelbare Unterstützung, die es zu beobachten gilt.
$800–$860: Meine bevorzugte Zone für eine mögliche Seitwärtskonsolidierung.
$1,000–$1,050: Wichtiger Widerstandsbereich, den der Kurs zurückerobern muss.
Unter $800: Das Risiko weiterer Kursverluste steigt.
Meine Strategie?
Ich habe kein Interesse daran, ZEC hier blind zu kaufen. Ich würde lieber warten, bis sich der Kurs im Bereich von $800–$860 stabilisiert, eine solide Basis bildet und eine bullische Struktur zeigt.
Wenn du unbedingt gegen den Trend handeln willst, liegt das Risiko bei dir. Verwechsle aber eine vorübergehende Erholung nicht mit einer bestätigten Trendwende.
Geduld ist auch eine Position. Lass ZEC erst beweisen, dass die Käufer zurück sind, bevor du über einen Long nachdenkst.
#ZEC #Zcash #CryptoAnalysis #TechnicalAnalysis
Ich bin bei Zcash weiterhin bearish. Der Chart zeigt mehr als nur einen normalen Rücksetzer; die Marktstruktur hat sich deutlich verschlechtert.
Schauen wir uns die technische Lage an:
📉 1. Marktstruktur
ZEC hat mehrere Unterstützungszonen verloren und bildet weiterhin tiefere Hochs und tiefere Tiefs. Solange wir keinen klaren Wechsel der Marktstruktur (MSS) und ein höheres Tief sehen, gibt es für mich keinen überzeugenden Grund, bullisch zu werden.
📊 2. Momentum-Indikatoren
Der Tages-RSI liegt bei etwa 32,8 – der überverkauften Zone nahe.
Der MACD bleibt negativ und signalisiert bärisches Momentum.
Der Kurs liegt unter den wichtigen gleitenden Tagesdurchschnitten.
Auch der technische Ausblick im 4-Stunden-Chart zeigt starken Abwärtsdruck.
Überverkaufte Bedingungen können eine Erholung auslösen, signalisieren aber nicht automatisch eine Trendwende.
🎯 3. Wichtige Kurszonen
$916: Unmittelbare Unterstützung, die es zu beobachten gilt.
$800–$860: Meine bevorzugte Zone für eine mögliche Seitwärtskonsolidierung.
$1,000–$1,050: Wichtiger Widerstandsbereich, den der Kurs zurückerobern muss.
Unter $800: Das Risiko weiterer Kursverluste steigt.
Meine Strategie?
Ich habe kein Interesse daran, ZEC hier blind zu kaufen. Ich würde lieber warten, bis sich der Kurs im Bereich von $800–$860 stabilisiert, eine solide Basis bildet und eine bullische Struktur zeigt.
Wenn du unbedingt gegen den Trend handeln willst, liegt das Risiko bei dir. Verwechsle aber eine vorübergehende Erholung nicht mit einer bestätigten Trendwende.
Geduld ist auch eine Position. Lass ZEC erst beweisen, dass die Käufer zurück sind, bevor du über einen Long nachdenkst.
#ZEC #Zcash #CryptoAnalysis #TechnicalAnalysis
743

·
--
BTC/USDT — Stark überverkauft, kurzfristiger Trend jedoch weiterhin bearish
Binance-Spotpreis: $67,180.01
24-Stunden-Veränderung: -1.425%
24-Stunden-Spanne: $66,456.00 – $70,214.31
Wichtige technische Niveaus
Unterstützung: $66,613–$66,456, gefolgt vom psychologischen Niveau bei $66,000.
Widerstand: $67,568, $68,446 und danach der 4H-EMA20 bei $70,978.
Trend & Momentum: BTC liegt weiterhin deutlich unter seinem 4H-EMA20, was die kurzfristig bearishe Struktur bestätigt. Der RSI14 liegt bei 18.2 und signalisiert ein stark überverkauftes Momentum. Eine Erholungsbewegung ist möglich, doch überverkaufte Bedingungen allein bestätigen keine Trendwende.
Bullishes Szenario: Hält die Unterstützungszone von $66,456–$66,613 und wird $67,568 zurückerobert, könnte sich eine Erholung in Richtung $68,446 eröffnen. Eine deutliche Verbesserung des Trends würde eine anhaltende Bewegung in Richtung und über den EMA20 hinaus erfordern.
Bearishes Szenario: Ein klarer Durchbruch unter $66,456 würde das psychologische Niveau bei $66,000 in den Fokus rücken und die aktuelle Abwärtsstruktur verstärken.
Fazit: BTC ist stark überverkauft und notiert nahe seinem 24-Stunden-Tief. Der Erhalt der Unterstützung ist entscheidend, während $67,568 der erste Widerstand ist, den Käufer zurückerobern müssen.
{spot}(BTCUSDT)
{spot}(ETHUSDT)
{spot}(NEARUSDT)
$BTC $NEAR $ETH
#TripsSam #BTC #Bitcoin #CryptoMarket #TechnicalAnalysis
Nur Marktanalyse — keine Finanzberatung.
BTC/USDT — Stark überverkauft, kurzfristiger Trend jedoch weiterhin bearish
Binance-Spotpreis: $67,180.01
24-Stunden-Veränderung: -1.425%
24-Stunden-Spanne: $66,456.00 – $70,214.31
Wichtige technische Niveaus
Unterstützung: $66,613–$66,456, gefolgt vom psychologischen Niveau bei $66,000.
Widerstand: $67,568, $68,446 und danach der 4H-EMA20 bei $70,978.
Trend & Momentum: BTC liegt weiterhin deutlich unter seinem 4H-EMA20, was die kurzfristig bearishe Struktur bestätigt. Der RSI14 liegt bei 18.2 und signalisiert ein stark überverkauftes Momentum. Eine Erholungsbewegung ist möglich, doch überverkaufte Bedingungen allein bestätigen keine Trendwende.
Bullishes Szenario: Hält die Unterstützungszone von $66,456–$66,613 und wird $67,568 zurückerobert, könnte sich eine Erholung in Richtung $68,446 eröffnen. Eine deutliche Verbesserung des Trends würde eine anhaltende Bewegung in Richtung und über den EMA20 hinaus erfordern.
Bearishes Szenario: Ein klarer Durchbruch unter $66,456 würde das psychologische Niveau bei $66,000 in den Fokus rücken und die aktuelle Abwärtsstruktur verstärken.
Fazit: BTC ist stark überverkauft und notiert nahe seinem 24-Stunden-Tief. Der Erhalt der Unterstützung ist entscheidend, während $67,568 der erste Widerstand ist, den Käufer zurückerobern müssen.
$BTC $NEAR $ETH
#TripsSam #BTC #Bitcoin #CryptoMarket #TechnicalAnalysis
Nur Marktanalyse — keine Finanzberatung.
Binance-Spotpreis: $67,180.01
24-Stunden-Veränderung: -1.425%
24-Stunden-Spanne: $66,456.00 – $70,214.31
Wichtige technische Niveaus
Unterstützung: $66,613–$66,456, gefolgt vom psychologischen Niveau bei $66,000.
Widerstand: $67,568, $68,446 und danach der 4H-EMA20 bei $70,978.
Trend & Momentum: BTC liegt weiterhin deutlich unter seinem 4H-EMA20, was die kurzfristig bearishe Struktur bestätigt. Der RSI14 liegt bei 18.2 und signalisiert ein stark überverkauftes Momentum. Eine Erholungsbewegung ist möglich, doch überverkaufte Bedingungen allein bestätigen keine Trendwende.
Bullishes Szenario: Hält die Unterstützungszone von $66,456–$66,613 und wird $67,568 zurückerobert, könnte sich eine Erholung in Richtung $68,446 eröffnen. Eine deutliche Verbesserung des Trends würde eine anhaltende Bewegung in Richtung und über den EMA20 hinaus erfordern.
Bearishes Szenario: Ein klarer Durchbruch unter $66,456 würde das psychologische Niveau bei $66,000 in den Fokus rücken und die aktuelle Abwärtsstruktur verstärken.
Fazit: BTC ist stark überverkauft und notiert nahe seinem 24-Stunden-Tief. Der Erhalt der Unterstützung ist entscheidend, während $67,568 der erste Widerstand ist, den Käufer zurückerobern müssen.
$BTC $NEAR $ETH
#TripsSam #BTC #Bitcoin #CryptoMarket #TechnicalAnalysis
Nur Marktanalyse — keine Finanzberatung.
2
378
·
--
Übersetzung ansehen
🔥 $SUI
{future}(SUIUSDT)
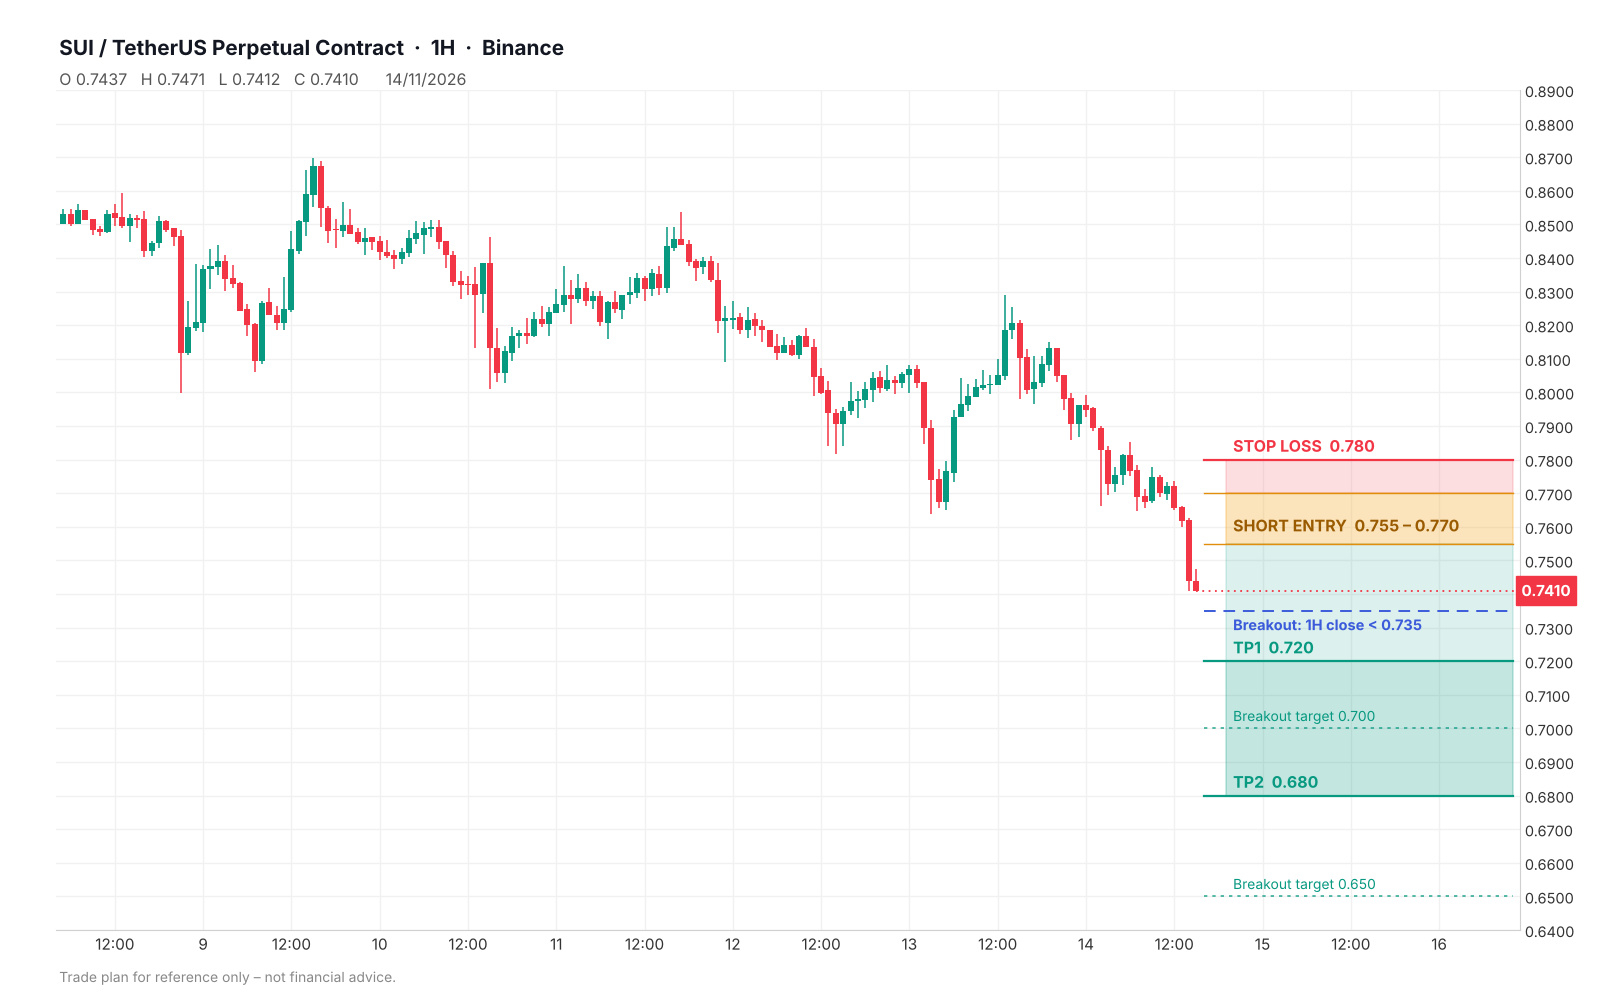
– Short Setup (Nov 14)
SUI is bearish on every timeframe (1W–5m): lower highs, repeated BOS down, price sliding into Discount near 0.74. Cheap isn't a buy signal in a downtrend, so don't catch the falling knife.
📉 Entry: short on a pullback to 0.755–0.770 after a rejection candle
🛑 Stop loss: 0.780
🎯 TP1: 0.720
🎯 TP2: 0.680
Breakout play: a 1H close below 0.735 opens 0.70 → 0.65. Longs only after a bullish CHoCH on 15m/1H.
Context: Suiet wallet is ending support, DeFi TVL is down ~22% in a month, Fear & Greed at 18. Weekend liquidity is thin, so keep risk at 1–2% per trade.
⚠️ Not financial advice. DYOR.
#SUI #Crypto #Trading #TechnicalAnalysis
🔥 $SUI
– Short Setup (Nov 14)
SUI is bearish on every timeframe (1W–5m): lower highs, repeated BOS down, price sliding into Discount near 0.74. Cheap isn't a buy signal in a downtrend, so don't catch the falling knife.
📉 Entry: short on a pullback to 0.755–0.770 after a rejection candle
🛑 Stop loss: 0.780
🎯 TP1: 0.720
🎯 TP2: 0.680
Breakout play: a 1H close below 0.735 opens 0.70 → 0.65. Longs only after a bullish CHoCH on 15m/1H.
Context: Suiet wallet is ending support, DeFi TVL is down ~22% in a month, Fear & Greed at 18. Weekend liquidity is thin, so keep risk at 1–2% per trade.
⚠️ Not financial advice. DYOR.
#SUI #Crypto #Trading #TechnicalAnalysis
– Short Setup (Nov 14)
SUI is bearish on every timeframe (1W–5m): lower highs, repeated BOS down, price sliding into Discount near 0.74. Cheap isn't a buy signal in a downtrend, so don't catch the falling knife.
📉 Entry: short on a pullback to 0.755–0.770 after a rejection candle
🛑 Stop loss: 0.780
🎯 TP1: 0.720
🎯 TP2: 0.680
Breakout play: a 1H close below 0.735 opens 0.70 → 0.65. Longs only after a bullish CHoCH on 15m/1H.
Context: Suiet wallet is ending support, DeFi TVL is down ~22% in a month, Fear & Greed at 18. Weekend liquidity is thin, so keep risk at 1–2% per trade.
⚠️ Not financial advice. DYOR.
#SUI #Crypto #Trading #TechnicalAnalysis
109

Übersetzung ansehen
$SHELL
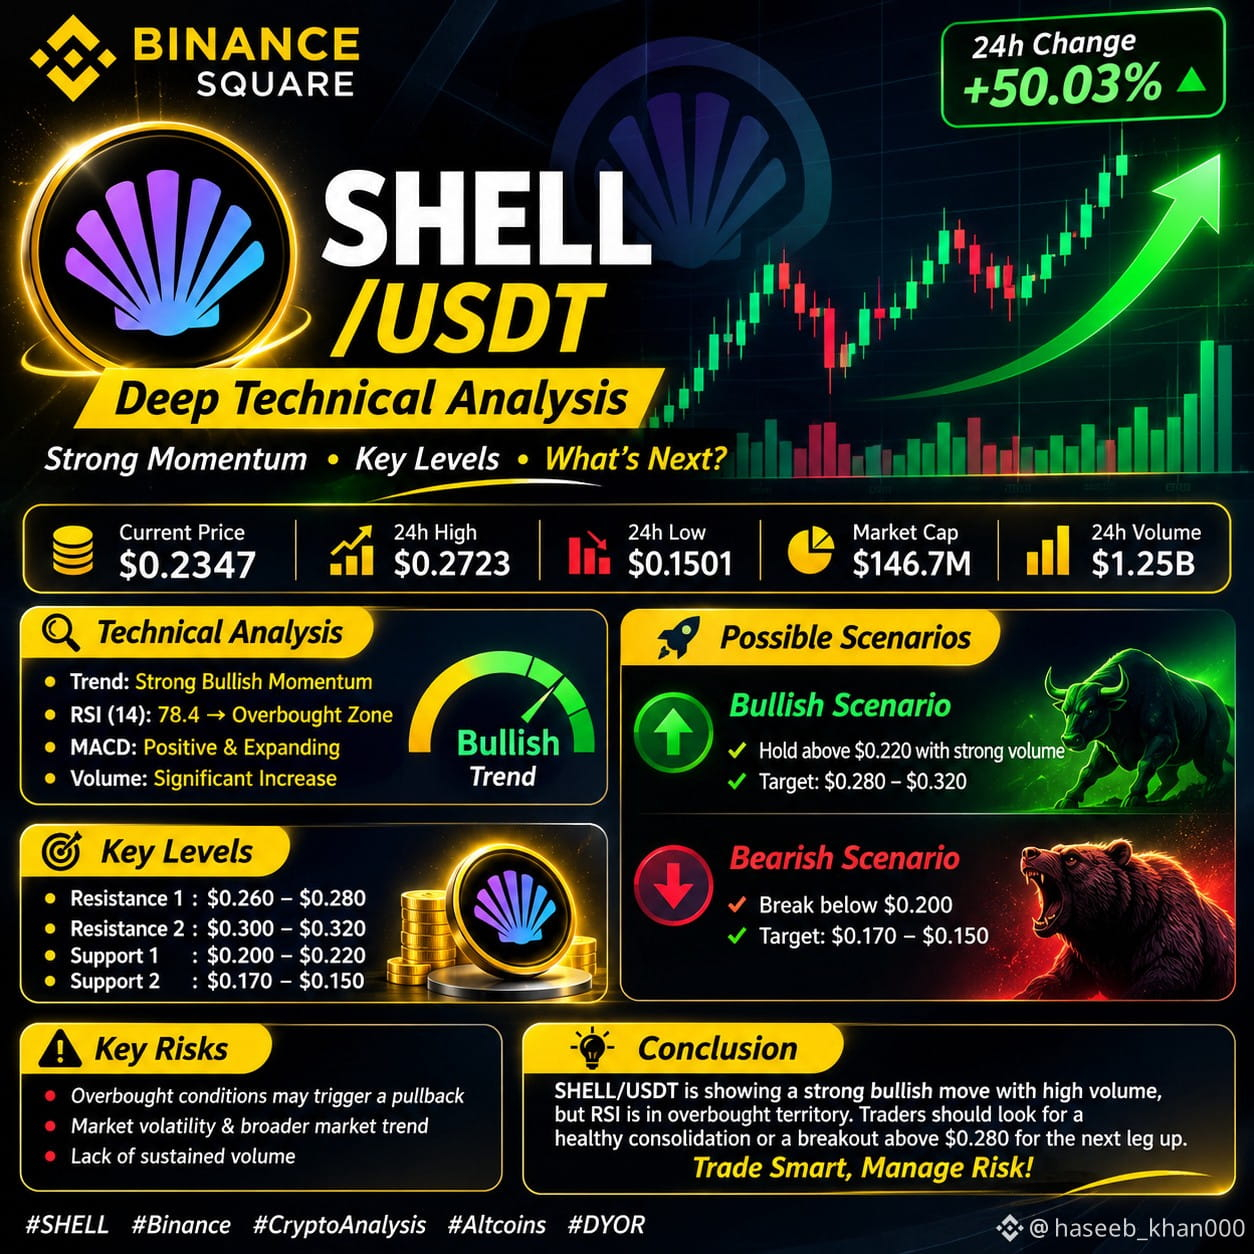
SHELL/USDT: Explosive Momentum or a Potential Reversal? 🔍
MyShell ($SHELL) | Deep Technical Market Analysis
SHELL has attracted significant market attention following an aggressive upward move accompanied by a substantial increase in trading activity. However, after such a sharp rally, the key question is whether buyers can sustain momentum or whether profit-taking will trigger a deeper correction.
📊 1. Market Structure
Recent Binance market data shows:
- Strong short-term price expansion.
- Significant increase in spot and futures trading activity.
- Elevated open interest, indicating growing derivatives participation.
- Sharp intraday fluctuations, reflecting increased volatility.
The recent rally is notable, but volume expansion alone does not confirm a sustainable uptrend.
📈 2. Key Technical Levels
Based on recent observed trading ranges:
- Immediate Support: $0.0285–$0.0300
- Resistance 1: $0.0367
- Major Resistance: $0.0516
- Major Historical Swing Low: $0.0186
These are reference zones from recent market activity, not guaranteed turning points.
🐂 3. Bullish Scenario
If SHELL maintains its near-term support zone and buying volume continues to strengthen, a recovery toward $0.0367 could become possible.
A sustained breakout above this resistance, supported by strong spot volume and a successful retest, would strengthen the bullish structure.
🐻 4. Bearish Scenario
If buyers fail to defend the $0.0285–$0.0300 area, downside pressure could increase.
A breakdown accompanied by expanding selling volume would weaken the short-term structure and could expose lower support areas.
⚠️ 5. Important Risks
- Rapid price appreciation increases correction risk.
- Elevated open interest can amplify volatility.
- Profit-taking may reverse short-term momentum.
- Token supply emissions and broader market sentiment deserve attention.
What is your view on $SHELL?
#shellusdt #MyShell #BinanceSquare #TechnicalAnalysis
{future}(SHELLUSDT)
$SHELL
SHELL/USDT: Explosive Momentum or a Potential Reversal? 🔍
MyShell ($SHELL ) | Deep Technical Market Analysis
SHELL has attracted significant market attention following an aggressive upward move accompanied by a substantial increase in trading activity. However, after such a sharp rally, the key question is whether buyers can sustain momentum or whether profit-taking will trigger a deeper correction.
📊 1. Market Structure
Recent Binance market data shows:
- Strong short-term price expansion.
- Significant increase in spot and futures trading activity.
- Elevated open interest, indicating growing derivatives participation.
- Sharp intraday fluctuations, reflecting increased volatility.
The recent rally is notable, but volume expansion alone does not confirm a sustainable uptrend.
📈 2. Key Technical Levels
Based on recent observed trading ranges:
- Immediate Support: $0.0285–$0.0300
- Resistance 1: $0.0367
- Major Resistance: $0.0516
- Major Historical Swing Low: $0.0186
These are reference zones from recent market activity, not guaranteed turning points.
🐂 3. Bullish Scenario
If SHELL maintains its near-term support zone and buying volume continues to strengthen, a recovery toward $0.0367 could become possible.
A sustained breakout above this resistance, supported by strong spot volume and a successful retest, would strengthen the bullish structure.
🐻 4. Bearish Scenario
If buyers fail to defend the $0.0285–$0.0300 area, downside pressure could increase.
A breakdown accompanied by expanding selling volume would weaken the short-term structure and could expose lower support areas.
⚠️ 5. Important Risks
- Rapid price appreciation increases correction risk.
- Elevated open interest can amplify volatility.
- Profit-taking may reverse short-term momentum.
- Token supply emissions and broader market sentiment deserve attention.
What is your view on $SHELL ?
#shellusdt #MyShell #BinanceSquare #TechnicalAnalysis
SHELL/USDT: Explosive Momentum or a Potential Reversal? 🔍
MyShell ($SHELL ) | Deep Technical Market Analysis
SHELL has attracted significant market attention following an aggressive upward move accompanied by a substantial increase in trading activity. However, after such a sharp rally, the key question is whether buyers can sustain momentum or whether profit-taking will trigger a deeper correction.
📊 1. Market Structure
Recent Binance market data shows:
- Strong short-term price expansion.
- Significant increase in spot and futures trading activity.
- Elevated open interest, indicating growing derivatives participation.
- Sharp intraday fluctuations, reflecting increased volatility.
The recent rally is notable, but volume expansion alone does not confirm a sustainable uptrend.
📈 2. Key Technical Levels
Based on recent observed trading ranges:
- Immediate Support: $0.0285–$0.0300
- Resistance 1: $0.0367
- Major Resistance: $0.0516
- Major Historical Swing Low: $0.0186
These are reference zones from recent market activity, not guaranteed turning points.
🐂 3. Bullish Scenario
If SHELL maintains its near-term support zone and buying volume continues to strengthen, a recovery toward $0.0367 could become possible.
A sustained breakout above this resistance, supported by strong spot volume and a successful retest, would strengthen the bullish structure.
🐻 4. Bearish Scenario
If buyers fail to defend the $0.0285–$0.0300 area, downside pressure could increase.
A breakdown accompanied by expanding selling volume would weaken the short-term structure and could expose lower support areas.
⚠️ 5. Important Risks
- Rapid price appreciation increases correction risk.
- Elevated open interest can amplify volatility.
- Profit-taking may reverse short-term momentum.
- Token supply emissions and broader market sentiment deserve attention.
What is your view on $SHELL ?
#shellusdt #MyShell #BinanceSquare #TechnicalAnalysis
169
Übersetzung ansehen
🚨 LUNC MARKET UPDATE – NOVEMBER 14, 2026 🚨
🔥 Can Terra Classic (LUNC) make a comeback?
$LUNC is currently showing bearish momentum, but an important support zone is approaching.
📊 MARKET SNAPSHOT
- Current price: $0.00003638
- Daily RSI: 24 (oversold)
- Market trend: Bearish
🎯 KEY PRICE LEVELS
🟢 Resistance 1: $0.00003749
🟢 Resistance 2: $0.00003857
🔴 Support 1: $0.00003628
🔴 Support 2: $0.00003520
📈 WHAT TO WATCH
If LUNC moves above $0.00003749 and holds, market sentiment could improve.
However, a breakdown below $0.00003628 could bring further downside pressure.
RSI is in oversold territory, but that alone does not confirm a reversal.
💬 COMMUNITY QUESTION
Do you think LUNC will recover, or will bearish pressure continue?
Share your thoughts below! 👇
#LUNC #TerraClassic #CryptoAnalysis #BinanceSquare #CryptoMarket #TechnicalAnalysis #WhoWillSucceedJensenHuangatNvidia? #WhatWillDriveCryptoandStocks’NextRebound? #USPPIMissMayEaseBTCPressure
Educational market analysis only. Not financial advice. No guaranteed returns.
{spot}(LUNCUSDT)
🚨 LUNC MARKET UPDATE – NOVEMBER 14, 2026 🚨
🔥 Can Terra Classic (LUNC) make a comeback?
$LUNC is currently showing bearish momentum, but an important support zone is approaching.
📊 MARKET SNAPSHOT
- Current price: $0.00003638
- Daily RSI: 24 (oversold)
- Market trend: Bearish
🎯 KEY PRICE LEVELS
🟢 Resistance 1: $0.00003749
🟢 Resistance 2: $0.00003857
🔴 Support 1: $0.00003628
🔴 Support 2: $0.00003520
📈 WHAT TO WATCH
If LUNC moves above $0.00003749 and holds, market sentiment could improve.
However, a breakdown below $0.00003628 could bring further downside pressure.
RSI is in oversold territory, but that alone does not confirm a reversal.
💬 COMMUNITY QUESTION
Do you think LUNC will recover, or will bearish pressure continue?
Share your thoughts below! 👇
#LUNC #TerraClassic #CryptoAnalysis #BinanceSquare #CryptoMarket #TechnicalAnalysis #WhoWillSucceedJensenHuangatNvidia? #WhatWillDriveCryptoandStocks’NextRebound? #USPPIMissMayEaseBTCPressure
Educational market analysis only. Not financial advice. No guaranteed returns.
🔥 Can Terra Classic (LUNC) make a comeback?
$LUNC is currently showing bearish momentum, but an important support zone is approaching.
📊 MARKET SNAPSHOT
- Current price: $0.00003638
- Daily RSI: 24 (oversold)
- Market trend: Bearish
🎯 KEY PRICE LEVELS
🟢 Resistance 1: $0.00003749
🟢 Resistance 2: $0.00003857
🔴 Support 1: $0.00003628
🔴 Support 2: $0.00003520
📈 WHAT TO WATCH
If LUNC moves above $0.00003749 and holds, market sentiment could improve.
However, a breakdown below $0.00003628 could bring further downside pressure.
RSI is in oversold territory, but that alone does not confirm a reversal.
💬 COMMUNITY QUESTION
Do you think LUNC will recover, or will bearish pressure continue?
Share your thoughts below! 👇
#LUNC #TerraClassic #CryptoAnalysis #BinanceSquare #CryptoMarket #TechnicalAnalysis #WhoWillSucceedJensenHuangatNvidia? #WhatWillDriveCryptoandStocks’NextRebound? #USPPIMissMayEaseBTCPressure
Educational market analysis only. Not financial advice. No guaranteed returns.

2
211

·
--
Übersetzung ansehen
$UVXY
🚀 UVXYUSDT Market Update | November 14, 2026
📈 Current Price: $18.73 🔥 24H Change: +9.09%
UVXY is showing a strong recovery with increased buying activity. Bulls are attempting to maintain momentum, but volatility remains extremely high.
Key Levels
Support: $18.10
Resistance: $19.73
Next Resistance: $21.03
Bullish Scenario: A confirmed breakout above $19.73 could open the way toward $21.03.
Bearish Scenario: Losing $18.10 may increase downside pressure.
🎯 Strategy: Wait for breakout confirmation. Avoid excessive leverage and use strict risk management.
#UVXYUSDT #CryptoTrading. #MarketUpdate #Binance #TechnicalAnalysis
{future}(UVXYUSDT)
$UVXY
🚀 UVXYUSDT Market Update | November 14, 2026
📈 Current Price: $18.73 🔥 24H Change: +9.09%
UVXY is showing a strong recovery with increased buying activity. Bulls are attempting to maintain momentum, but volatility remains extremely high.
Key Levels
Support: $18.10
Resistance: $19.73
Next Resistance: $21.03
Bullish Scenario: A confirmed breakout above $19.73 could open the way toward $21.03.
Bearish Scenario: Losing $18.10 may increase downside pressure.
🎯 Strategy: Wait for breakout confirmation. Avoid excessive leverage and use strict risk management.
#UVXYUSDT #CryptoTrading. #MarketUpdate #Binance #TechnicalAnalysis
🚀 UVXYUSDT Market Update | November 14, 2026
📈 Current Price: $18.73 🔥 24H Change: +9.09%
UVXY is showing a strong recovery with increased buying activity. Bulls are attempting to maintain momentum, but volatility remains extremely high.
Key Levels
Support: $18.10
Resistance: $19.73
Next Resistance: $21.03
Bullish Scenario: A confirmed breakout above $19.73 could open the way toward $21.03.
Bearish Scenario: Losing $18.10 may increase downside pressure.
🎯 Strategy: Wait for breakout confirmation. Avoid excessive leverage and use strict risk management.
#UVXYUSDT #CryptoTrading. #MarketUpdate #Binance #TechnicalAnalysis
64

Übersetzung ansehen
🚨 $XRP / USDT: Psychological $1.00 Breakdown Test & Deep Oversold RSI!
XRP is currently trading under intense near-term pressure around the $0.985 - $1.01 demand zone, dipping just below the critical $1.00 psychological threshold. With the 14-day RSI plunged deep into oversold territory (around 21–24) and MACD remaining negative, price action is sitting at a major high-timeframe inflection point. Here is the technical breakdown:
📊 Key Technical Levels to Watch:
Major Support Zone: $0.92 - $0.98 (Immediate structural demand base below the $1.00 psychological handle. Bulls must quickly reclaim $1.00 and defend this floor to prevent deeper structural capitulation.)
Immediate Resistance & SuperTrend: $1.21 - $1.22 (First key technical hurdle marked by the SuperTrend indicator, which bulls must reclaim to ease immediate downside pressure.)
Macro EMA Resistance Cluster: $1.26 - $1.35 (Dense overhead supply zone formed by the 50-day EMA at $1.26–$1.28, the 100-day EMA at $1.29–$1.30, and the 200-day EMA at $1.34–$1.35.)
🔍 Market Dynamics & Strategy:
Order Flow & Sentiment: Selling pressure remains dominant across short- and medium-term timeframes, keeping price suppressed beneath all major daily and weekly exponential moving averages. However, extreme oversold oscillator readings indicate that short-term bearish momentum is heavily stretched, raising the probability of a technical relief bounce if buyers step in.
Execution Plan: Avoid catching falling knives in unconfirmed territory. Wait for a decisive high-timeframe reclaim and hold above the $1.00 psychological level or a volume-backed breakout toward the $1.21 SuperTrend pivot. Strict risk management is mandatory!
#XRP #Ripple #cryptotrading #TechnicalAnalysis #coinstrategist_
🚨 $XRP / USDT: Psychological $1.00 Breakdown Test & Deep Oversold RSI!
XRP is currently trading under intense near-term pressure around the $0.985 - $1.01 demand zone, dipping just below the critical $1.00 psychological threshold. With the 14-day RSI plunged deep into oversold territory (around 21–24) and MACD remaining negative, price action is sitting at a major high-timeframe inflection point. Here is the technical breakdown:
📊 Key Technical Levels to Watch:
Major Support Zone: $0.92 - $0.98 (Immediate structural demand base below the $1.00 psychological handle. Bulls must quickly reclaim $1.00 and defend this floor to prevent deeper structural capitulation.)
Immediate Resistance & SuperTrend: $1.21 - $1.22 (First key technical hurdle marked by the SuperTrend indicator, which bulls must reclaim to ease immediate downside pressure.)
Macro EMA Resistance Cluster: $1.26 - $1.35 (Dense overhead supply zone formed by the 50-day EMA at $1.26–$1.28, the 100-day EMA at $1.29–$1.30, and the 200-day EMA at $1.34–$1.35.)
🔍 Market Dynamics & Strategy:
Order Flow & Sentiment: Selling pressure remains dominant across short- and medium-term timeframes, keeping price suppressed beneath all major daily and weekly exponential moving averages. However, extreme oversold oscillator readings indicate that short-term bearish momentum is heavily stretched, raising the probability of a technical relief bounce if buyers step in.
Execution Plan: Avoid catching falling knives in unconfirmed territory. Wait for a decisive high-timeframe reclaim and hold above the $1.00 psychological level or a volume-backed breakout toward the $1.21 SuperTrend pivot. Strict risk management is mandatory!
#XRP #Ripple #cryptotrading #TechnicalAnalysis #coinstrategist_
XRP is currently trading under intense near-term pressure around the $0.985 - $1.01 demand zone, dipping just below the critical $1.00 psychological threshold. With the 14-day RSI plunged deep into oversold territory (around 21–24) and MACD remaining negative, price action is sitting at a major high-timeframe inflection point. Here is the technical breakdown:
📊 Key Technical Levels to Watch:
Major Support Zone: $0.92 - $0.98 (Immediate structural demand base below the $1.00 psychological handle. Bulls must quickly reclaim $1.00 and defend this floor to prevent deeper structural capitulation.)
Immediate Resistance & SuperTrend: $1.21 - $1.22 (First key technical hurdle marked by the SuperTrend indicator, which bulls must reclaim to ease immediate downside pressure.)
Macro EMA Resistance Cluster: $1.26 - $1.35 (Dense overhead supply zone formed by the 50-day EMA at $1.26–$1.28, the 100-day EMA at $1.29–$1.30, and the 200-day EMA at $1.34–$1.35.)
🔍 Market Dynamics & Strategy:
Order Flow & Sentiment: Selling pressure remains dominant across short- and medium-term timeframes, keeping price suppressed beneath all major daily and weekly exponential moving averages. However, extreme oversold oscillator readings indicate that short-term bearish momentum is heavily stretched, raising the probability of a technical relief bounce if buyers step in.
Execution Plan: Avoid catching falling knives in unconfirmed territory. Wait for a decisive high-timeframe reclaim and hold above the $1.00 psychological level or a volume-backed breakout toward the $1.21 SuperTrend pivot. Strict risk management is mandatory!
#XRP #Ripple #cryptotrading #TechnicalAnalysis #coinstrategist_
121
·
--
$DODOX
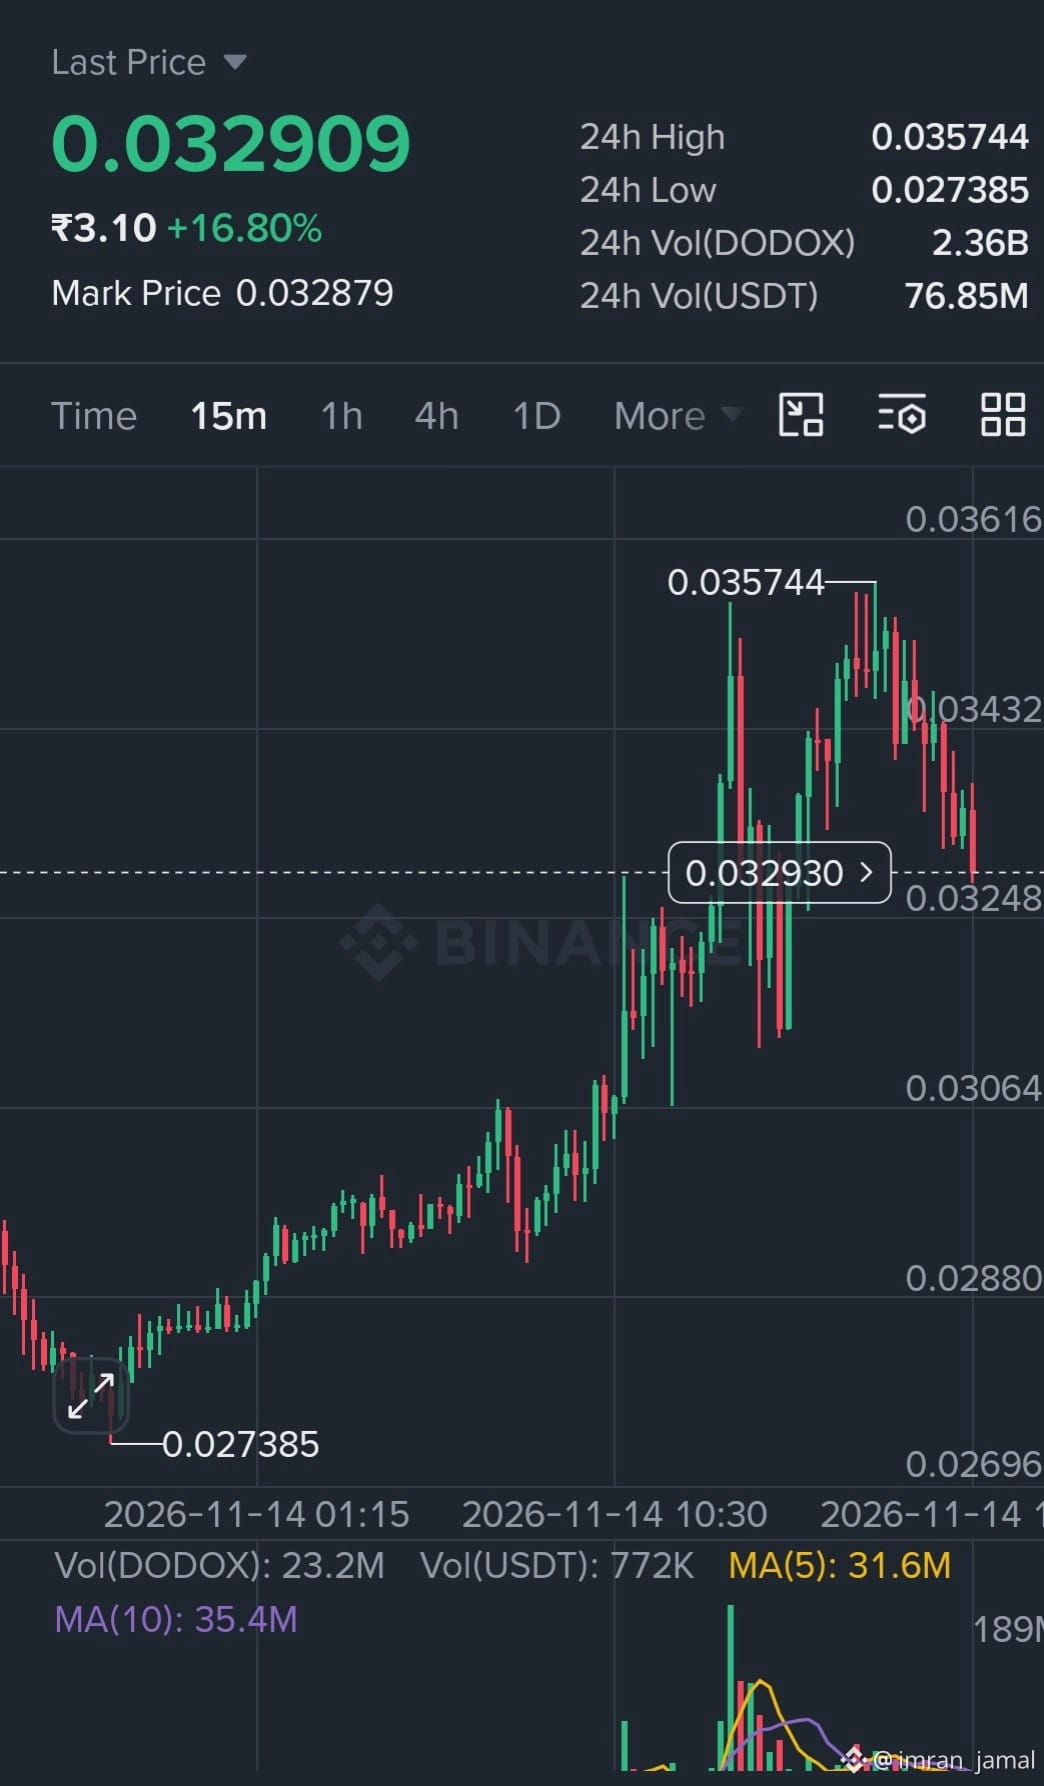
🚀 DODOXUSDT Marktupdate | 14. November 2026
📊 DODOX weist eine starke Volatilität und ein erhebliches Handelsaufkommen auf. Die jüngste Kursentwicklung zeigt einen deutlichen Anstieg, auf den Verkaufsdruck folgte.
📈 Bullisch: Ein Ausbruch über 0,0360 $ könnte den Weg in Richtung 0,0400 $ ebnen.
📉 Bärisch: Ein Verlust der Unterstützungszone bei 0,0320 $ könnte weitere Kursverluste auslösen.
🎯 Strategie: Vor dem Einstieg auf eine Bestätigung durch das Handelsvolumen warten. Einen angemessenen Stop-Loss und ein umsichtiges Risikomanagement nutzen.
#DODOXUSDT #BİNANCE #CryptoUpdate #TechnicalAnalysis
{future}(DODOXUSDT)
$DODOX
🚀 DODOXUSDT Marktupdate | 14. November 2026
📊 DODOX weist eine starke Volatilität und ein erhebliches Handelsaufkommen auf. Die jüngste Kursentwicklung zeigt einen deutlichen Anstieg, auf den Verkaufsdruck folgte.
📈 Bullisch: Ein Ausbruch über 0,0360 $ könnte den Weg in Richtung 0,0400 $ ebnen.
📉 Bärisch: Ein Verlust der Unterstützungszone bei 0,0320 $ könnte weitere Kursverluste auslösen.
🎯 Strategie: Vor dem Einstieg auf eine Bestätigung durch das Handelsvolumen warten. Einen angemessenen Stop-Loss und ein umsichtiges Risikomanagement nutzen.
#DODOXUSDT #BİNANCE #CryptoUpdate #TechnicalAnalysis
🚀 DODOXUSDT Marktupdate | 14. November 2026
📊 DODOX weist eine starke Volatilität und ein erhebliches Handelsaufkommen auf. Die jüngste Kursentwicklung zeigt einen deutlichen Anstieg, auf den Verkaufsdruck folgte.
📈 Bullisch: Ein Ausbruch über 0,0360 $ könnte den Weg in Richtung 0,0400 $ ebnen.
📉 Bärisch: Ein Verlust der Unterstützungszone bei 0,0320 $ könnte weitere Kursverluste auslösen.
🎯 Strategie: Vor dem Einstieg auf eine Bestätigung durch das Handelsvolumen warten. Einen angemessenen Stop-Loss und ein umsichtiges Risikomanagement nutzen.
#DODOXUSDT #BİNANCE #CryptoUpdate #TechnicalAnalysis
183

Übersetzung ansehen
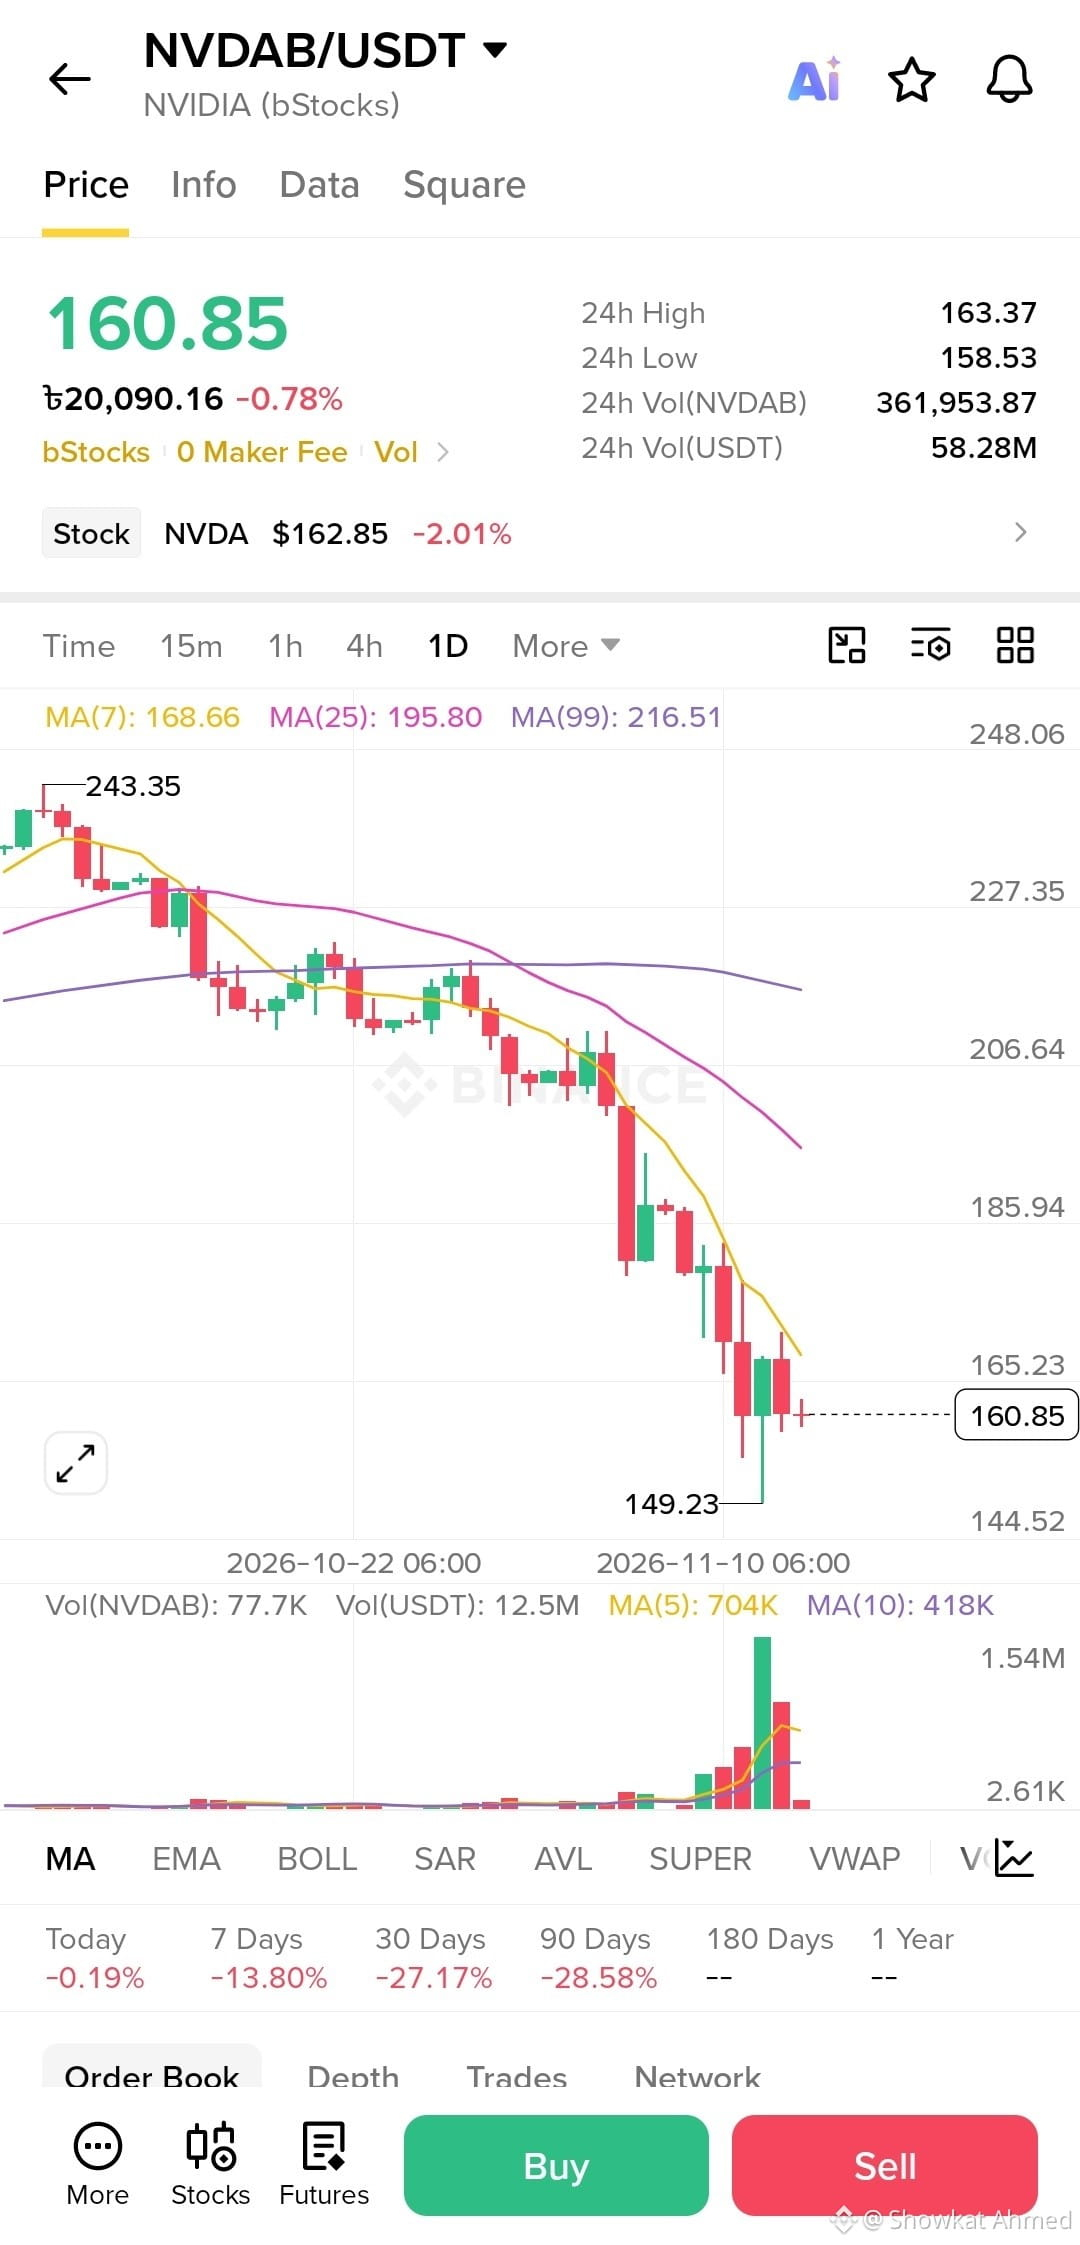
📉 NVIDIA (NVDA) – Is the Downtrend Getting Stronger?
NVIDIA is currently facing significant selling pressure. Let's take a look at the daily chart.
📊 Current Market Overview:
- Current Price: $160.85
- 24H Change: -0.78%
- 7D Performance: -13.80%
- 30D Performance: -27.17%
- 90D Performance: -28.58%
- Recent Low: $149.23
📉 Technical Analysis:
NVDA is trading below all three major moving averages:
- MA(7): $168.66
- MA(25): $195.80
- MA(99): $216.51
This indicates that the overall trend remains bearish.
Key Levels to Watch:
- Support: $149.23
- Resistance: $165.23
- Next Resistance: $185.94
A strong recovery above the short-term moving average could be an early sign of momentum improvement. However, buyers still need to show strength before any trend reversal can be confirmed.
💭 What's Next for NVIDIA?
Will NVDA recover from this correction, or could we see further downside?
Share your thoughts in the comments!
⚠️ This post is for educational purposes only, not financial advice.
# #Crypto #BinanceSquare #Stockmarket #TechnicalAnalysis #trading #MarketAnalysis $NVDAB
📉 NVIDIA (NVDA) – Is the Downtrend Getting Stronger?
NVIDIA is currently facing significant selling pressure. Let's take a look at the daily chart.
📊 Current Market Overview:
- Current Price: $160.85
- 24H Change: -0.78%
- 7D Performance: -13.80%
- 30D Performance: -27.17%
- 90D Performance: -28.58%
- Recent Low: $149.23
📉 Technical Analysis:
NVDA is trading below all three major moving averages:
- MA(7): $168.66
- MA(25): $195.80
- MA(99): $216.51
This indicates that the overall trend remains bearish.
Key Levels to Watch:
- Support: $149.23
- Resistance: $165.23
- Next Resistance: $185.94
A strong recovery above the short-term moving average could be an early sign of momentum improvement. However, buyers still need to show strength before any trend reversal can be confirmed.
💭 What's Next for NVIDIA?
Will NVDA recover from this correction, or could we see further downside?
Share your thoughts in the comments!
⚠️ This post is for educational purposes only, not financial advice.
# #Crypto #BinanceSquare #Stockmarket #TechnicalAnalysis #trading #MarketAnalysis $NVDAB
NVIDIA is currently facing significant selling pressure. Let's take a look at the daily chart.
📊 Current Market Overview:
- Current Price: $160.85
- 24H Change: -0.78%
- 7D Performance: -13.80%
- 30D Performance: -27.17%
- 90D Performance: -28.58%
- Recent Low: $149.23
📉 Technical Analysis:
NVDA is trading below all three major moving averages:
- MA(7): $168.66
- MA(25): $195.80
- MA(99): $216.51
This indicates that the overall trend remains bearish.
Key Levels to Watch:
- Support: $149.23
- Resistance: $165.23
- Next Resistance: $185.94
A strong recovery above the short-term moving average could be an early sign of momentum improvement. However, buyers still need to show strength before any trend reversal can be confirmed.
💭 What's Next for NVIDIA?
Will NVDA recover from this correction, or could we see further downside?
Share your thoughts in the comments!
⚠️ This post is for educational purposes only, not financial advice.
# #Crypto #BinanceSquare #Stockmarket #TechnicalAnalysis #trading #MarketAnalysis $NVDAB
147

·
--
Übersetzung ansehen
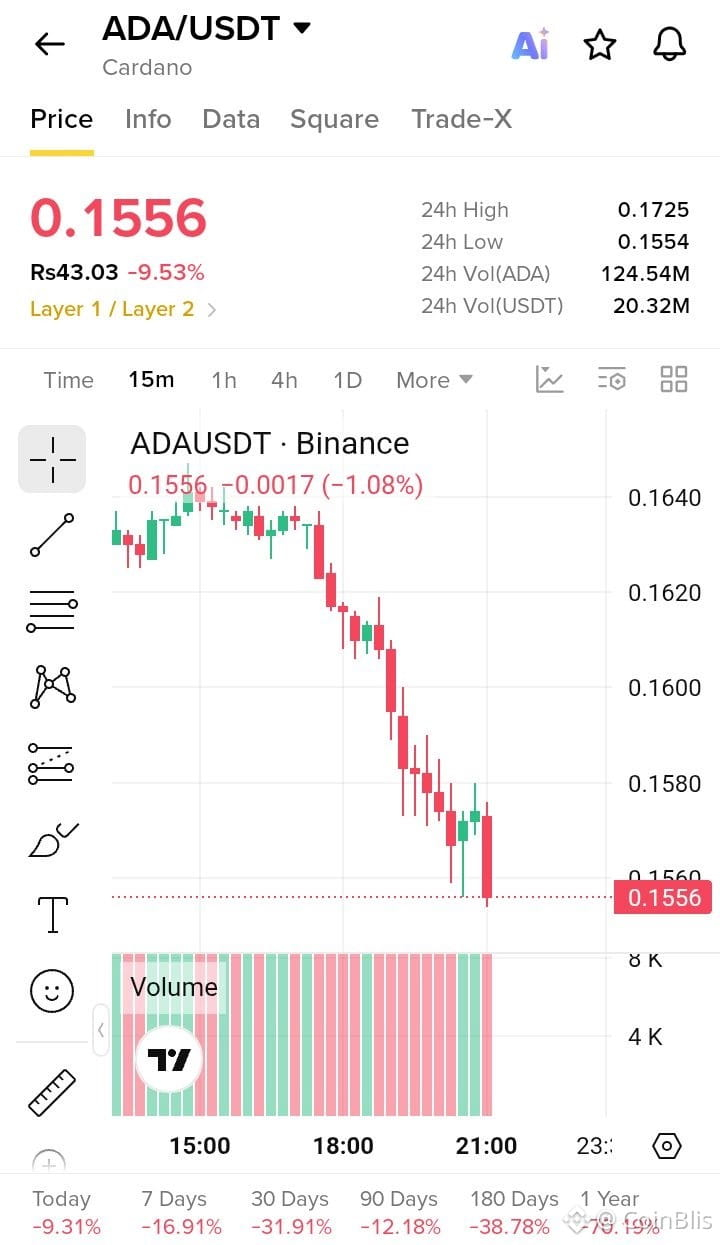
$ADA SHORT TRADE SIGNAL 📉
TRADE SETUP:
🔴 Direction: SHORT
📍 Entry Zone: 0.1555 – 0.1562
🎯 TP1: 0.1545
🎯 TP2: 0.1535
🎯 TP3: 0.1525
🛑 Stop Loss: 0.1578
MARKET OUTLOOK:
ADA is showing persistent bearish pressure on the 15-minute chart, with consecutive lower highs and lower lows. Sellers remain in control, while recent minor rebounds have failed to reclaim higher resistance. Price is testing the 0.1555 support area, and a confirmed breakdown could accelerate the move toward lower targets. A recovery above 0.1578 would invalidate this short setup.
$AAPLB $MSFTB
#ADA #Cardano #cryptotrading #ShortSignal #TechnicalAnalysis
$ADA SHORT TRADE SIGNAL 📉
TRADE SETUP:
🔴 Direction: SHORT
📍 Entry Zone: 0.1555 – 0.1562
🎯 TP1: 0.1545
🎯 TP2: 0.1535
🎯 TP3: 0.1525
🛑 Stop Loss: 0.1578
MARKET OUTLOOK:
ADA is showing persistent bearish pressure on the 15-minute chart, with consecutive lower highs and lower lows. Sellers remain in control, while recent minor rebounds have failed to reclaim higher resistance. Price is testing the 0.1555 support area, and a confirmed breakdown could accelerate the move toward lower targets. A recovery above 0.1578 would invalidate this short setup.
$AAPLB $MSFTB
#ADA #Cardano #cryptotrading #ShortSignal #TechnicalAnalysis
TRADE SETUP:
🔴 Direction: SHORT
📍 Entry Zone: 0.1555 – 0.1562
🎯 TP1: 0.1545
🎯 TP2: 0.1535
🎯 TP3: 0.1525
🛑 Stop Loss: 0.1578
MARKET OUTLOOK:
ADA is showing persistent bearish pressure on the 15-minute chart, with consecutive lower highs and lower lows. Sellers remain in control, while recent minor rebounds have failed to reclaim higher resistance. Price is testing the 0.1555 support area, and a confirmed breakdown could accelerate the move toward lower targets. A recovery above 0.1578 would invalidate this short setup.
$AAPLB $MSFTB
#ADA #Cardano #cryptotrading #ShortSignal #TechnicalAnalysis
130

$BTC
{spot}(BTCUSDT)
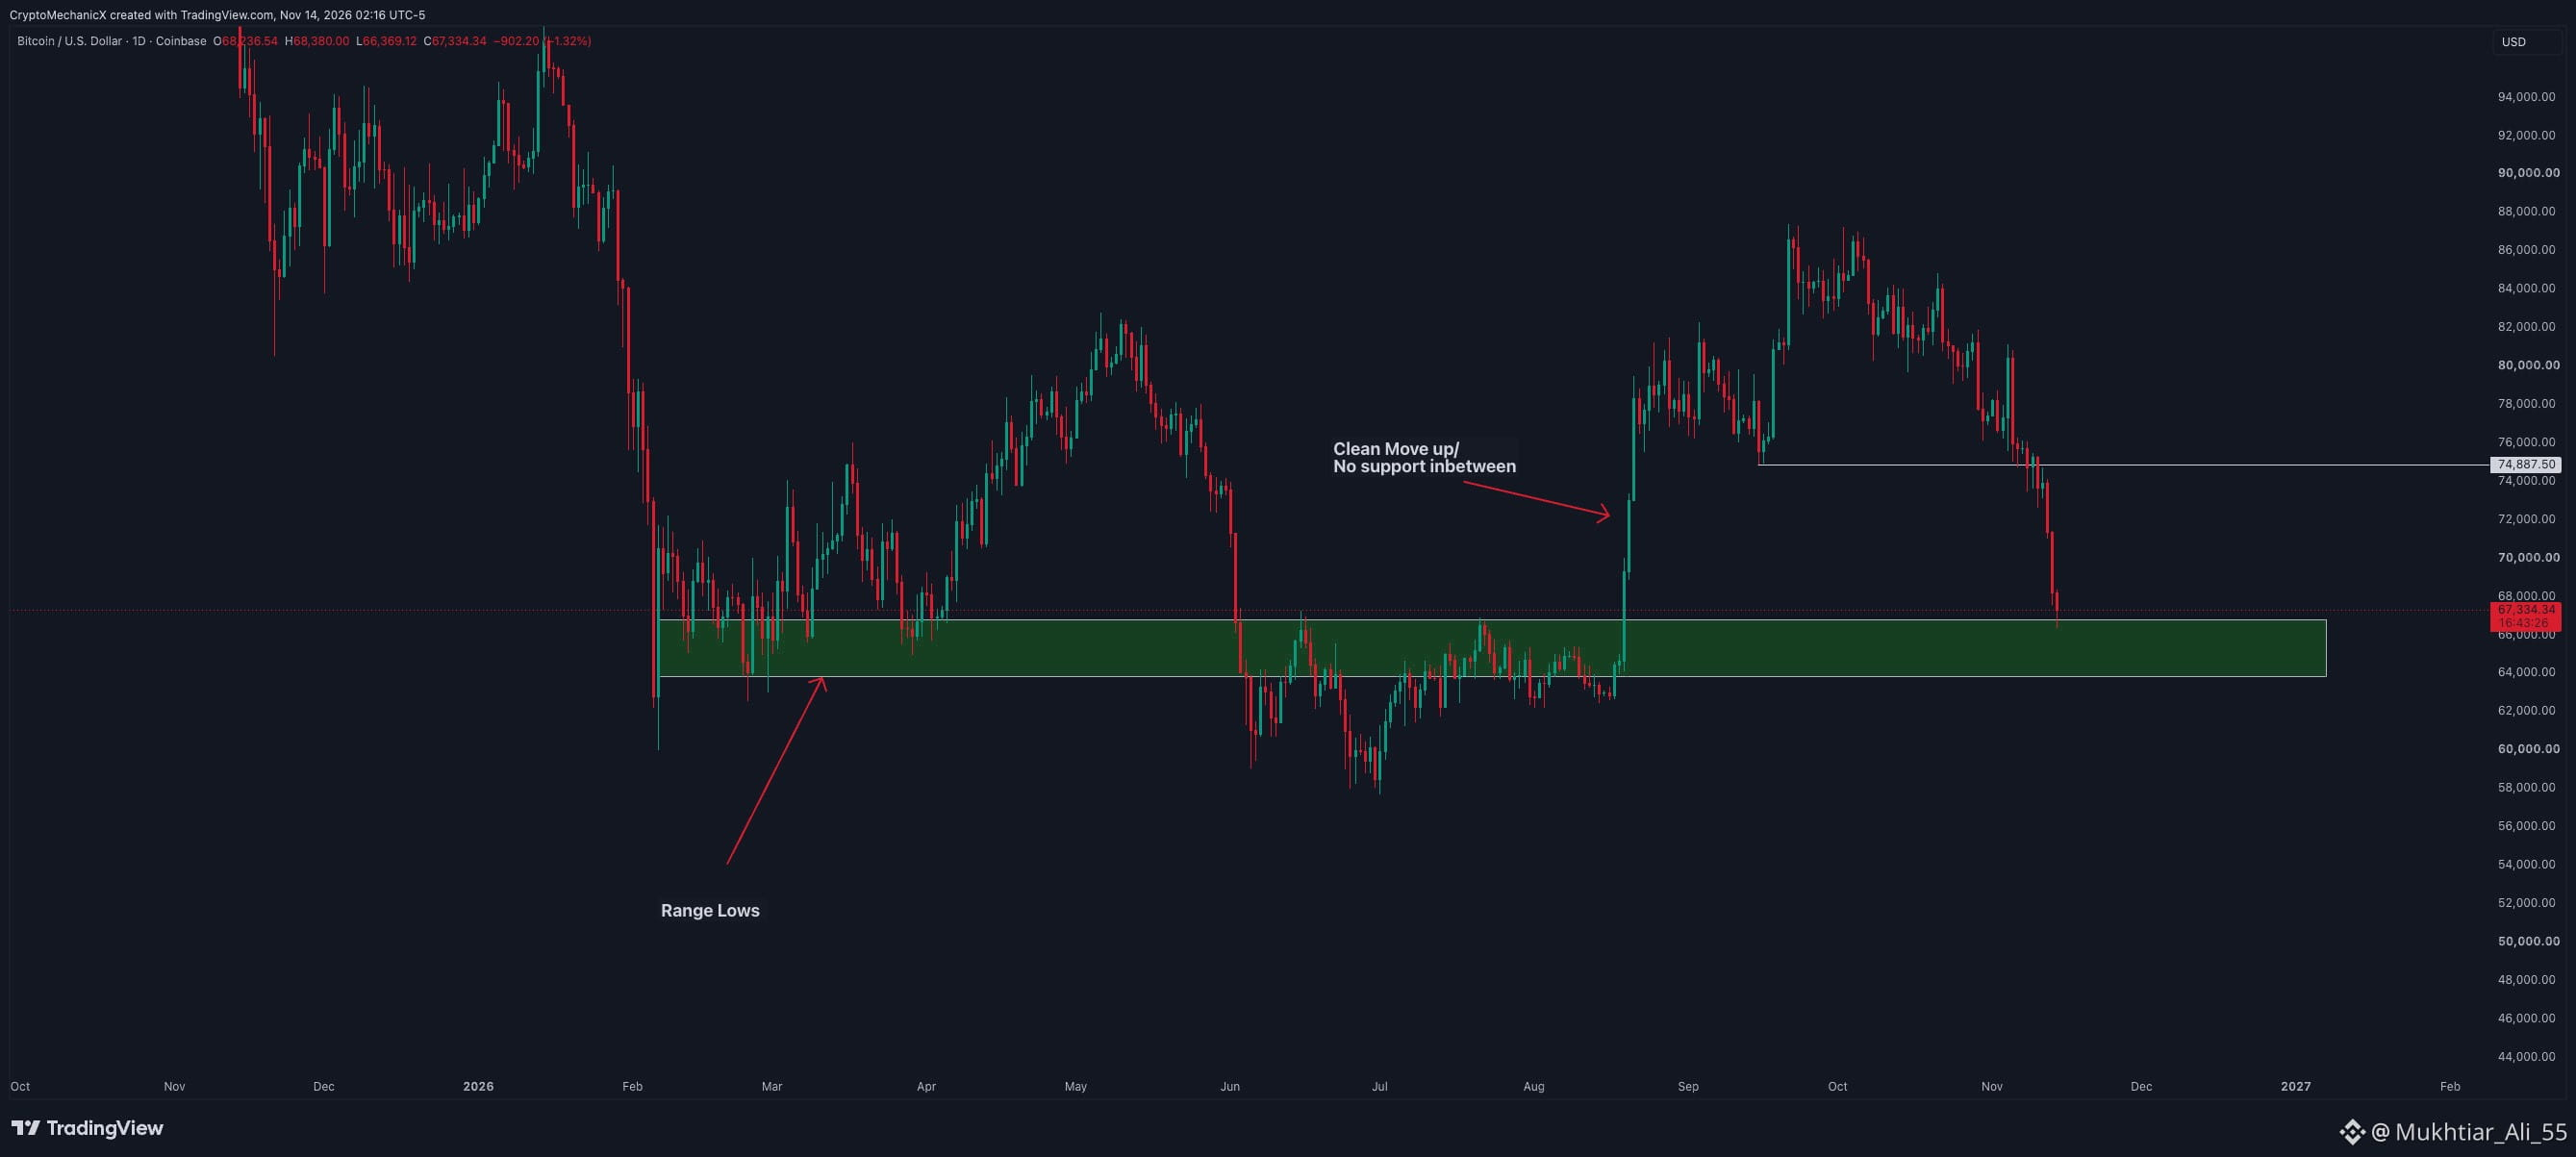
Als BTC unter die Marke von 75.000 $ fiel, wies ich darauf hin, dass es darunter kaum Unterstützung gab. Das einzige Setup, das für mich gut aussah, war eine Rückeroberung der Marke von 75.000 $. Solange der Kurs unter diesem Niveau bleibt, haben die Bären die Kontrolle.
Auf dem Chart links sieht man, dass der Anstieg sauber verlief und unterwegs keine wirkliche Konsolidierung oder Unterstützungszonen aufwies. Wir alle haben gesehen, wie es danach weiterging.
Jetzt nähert sich der Kurs jedoch einem wichtigen Bereich im Tageschart. Es handelt sich um eine tägliche Nachfragezone – genau dort, wo die gesamte Rallye in Richtung der 87.000-$-Region begann. Der Bereich zwischen 63.000 $ und 67.000 $ markiert außerdem die Tiefs der vorherigen Handelsspanne.
Das sind gleich mehrere gute Gründe für die Annahme, dass BTC hier Unterstützung finden könnte.
Ob es sich dabei um eine kurze Erholung oder um einen bedeutenderen Boden handelt, kann ich ehrlich gesagt nicht sagen. Der Verkaufsdruck war unaufhaltsam und deutlich stärker, als ich erwartet hatte. Wir müssen beobachten, wie der Kurs reagiert.
Unterm Strich: Unterhalb von 75.000 $ gab es keine nennenswerte Unterstützung, aber BTC nähert sich jetzt einer Zone, in der man durchaus erwarten kann, dass Käufer auftauchen und etwas Unterstützung bieten.
#Bitcoin #BTC #Crypto #TechnicalAnalysis #CryptoTrading
$BTC
Als BTC unter die Marke von 75.000 $ fiel, wies ich darauf hin, dass es darunter kaum Unterstützung gab. Das einzige Setup, das für mich gut aussah, war eine Rückeroberung der Marke von 75.000 $. Solange der Kurs unter diesem Niveau bleibt, haben die Bären die Kontrolle.
Auf dem Chart links sieht man, dass der Anstieg sauber verlief und unterwegs keine wirkliche Konsolidierung oder Unterstützungszonen aufwies. Wir alle haben gesehen, wie es danach weiterging.
Jetzt nähert sich der Kurs jedoch einem wichtigen Bereich im Tageschart. Es handelt sich um eine tägliche Nachfragezone – genau dort, wo die gesamte Rallye in Richtung der 87.000-$-Region begann. Der Bereich zwischen 63.000 $ und 67.000 $ markiert außerdem die Tiefs der vorherigen Handelsspanne.
Das sind gleich mehrere gute Gründe für die Annahme, dass BTC hier Unterstützung finden könnte.
Ob es sich dabei um eine kurze Erholung oder um einen bedeutenderen Boden handelt, kann ich ehrlich gesagt nicht sagen. Der Verkaufsdruck war unaufhaltsam und deutlich stärker, als ich erwartet hatte. Wir müssen beobachten, wie der Kurs reagiert.
Unterm Strich: Unterhalb von 75.000 $ gab es keine nennenswerte Unterstützung, aber BTC nähert sich jetzt einer Zone, in der man durchaus erwarten kann, dass Käufer auftauchen und etwas Unterstützung bieten.
#Bitcoin #BTC #Crypto #TechnicalAnalysis #CryptoTrading
Als BTC unter die Marke von 75.000 $ fiel, wies ich darauf hin, dass es darunter kaum Unterstützung gab. Das einzige Setup, das für mich gut aussah, war eine Rückeroberung der Marke von 75.000 $. Solange der Kurs unter diesem Niveau bleibt, haben die Bären die Kontrolle.
Auf dem Chart links sieht man, dass der Anstieg sauber verlief und unterwegs keine wirkliche Konsolidierung oder Unterstützungszonen aufwies. Wir alle haben gesehen, wie es danach weiterging.
Jetzt nähert sich der Kurs jedoch einem wichtigen Bereich im Tageschart. Es handelt sich um eine tägliche Nachfragezone – genau dort, wo die gesamte Rallye in Richtung der 87.000-$-Region begann. Der Bereich zwischen 63.000 $ und 67.000 $ markiert außerdem die Tiefs der vorherigen Handelsspanne.
Das sind gleich mehrere gute Gründe für die Annahme, dass BTC hier Unterstützung finden könnte.
Ob es sich dabei um eine kurze Erholung oder um einen bedeutenderen Boden handelt, kann ich ehrlich gesagt nicht sagen. Der Verkaufsdruck war unaufhaltsam und deutlich stärker, als ich erwartet hatte. Wir müssen beobachten, wie der Kurs reagiert.
Unterm Strich: Unterhalb von 75.000 $ gab es keine nennenswerte Unterstützung, aber BTC nähert sich jetzt einer Zone, in der man durchaus erwarten kann, dass Käufer auftauchen und etwas Unterstützung bieten.
#Bitcoin #BTC #Crypto #TechnicalAnalysis #CryptoTrading
1
5

·
--
🚨 **$BTC /USDT — BÄRISCHES SHORT-SETUP!** 🔴🐻
Bitcoin zeigt im 1-Stunden-Chart eine bärische Dynamik und wird unterhalb der gestaffelten EMAs gehandelt. Die Verkäufer haben weiterhin die Kontrolle, aber überverkaufte Bedingungen könnten eine vorübergehende Erholung auslösen. 📉
{future}(BTCUSDT)
📍 **SHORT-EINSTIEG:** $67,198.92 – $67,323.28
🎯 **GEWINNMITNAHMEZIELE:**
- TP1: $66,210.07 (-1.6%)
- TP2: $65,509.38 (-2.6%)
- TP3: $64,458.34 (-4.2%)
🛑 **STOP-LOSS:** $68,662.48 (+2.1%)
📊 **TRADE-MANAGEMENT:**
- Bei TP1 50 % schließen.
- Bei TP2 25 % schließen.
- Die verbleibenden 25 % bei TP3 schließen.
- Nach TP1 den SL auf den Einstiegspreis verschieben.
🔎 **WARUM ICH DEN SHORT IM BLICK HABE:**
- Bärische EMA-Struktur im 1-Stunden-Chart.
- Der Kurs wird unter wichtigen EMAs gehandelt.
- Ein RSI von 22.4 im 4-Stunden-Chart weist auf überverkaufte Bedingungen hin.
- Eine Fortsetzung der Abwärtsdynamik ist möglich.
⚠️ **Risikomanagement:** Nur mäßige Überzeugung. Positionsgröße gering halten und auf plötzliche Erholungsrallyes achten.
💬 Wo liegt eurer Meinung nach das nächste Abwärtsziel für BTC? 👇
DYOR | NFA. Ausschließlich eine lehrreiche Marktanalyse, keine Finanzberatung.
#BTC #Bitcoin #BTCUSDT #Binance #ShortSignal #CryptoTrading #TechnicalAnalysis
🚨 **$BTC /USDT — BÄRISCHES SHORT-SETUP!** 🔴🐻
Bitcoin zeigt im 1-Stunden-Chart eine bärische Dynamik und wird unterhalb der gestaffelten EMAs gehandelt. Die Verkäufer haben weiterhin die Kontrolle, aber überverkaufte Bedingungen könnten eine vorübergehende Erholung auslösen. 📉
📍 **SHORT-EINSTIEG:** $67,198.92 – $67,323.28
🎯 **GEWINNMITNAHMEZIELE:**
- TP1: $66,210.07 (-1.6%)
- TP2: $65,509.38 (-2.6%)
- TP3: $64,458.34 (-4.2%)
🛑 **STOP-LOSS:** $68,662.48 (+2.1%)
📊 **TRADE-MANAGEMENT:**
- Bei TP1 50 % schließen.
- Bei TP2 25 % schließen.
- Die verbleibenden 25 % bei TP3 schließen.
- Nach TP1 den SL auf den Einstiegspreis verschieben.
🔎 **WARUM ICH DEN SHORT IM BLICK HABE:**
- Bärische EMA-Struktur im 1-Stunden-Chart.
- Der Kurs wird unter wichtigen EMAs gehandelt.
- Ein RSI von 22.4 im 4-Stunden-Chart weist auf überverkaufte Bedingungen hin.
- Eine Fortsetzung der Abwärtsdynamik ist möglich.
⚠️ **Risikomanagement:** Nur mäßige Überzeugung. Positionsgröße gering halten und auf plötzliche Erholungsrallyes achten.
💬 Wo liegt eurer Meinung nach das nächste Abwärtsziel für BTC? 👇
DYOR | NFA. Ausschließlich eine lehrreiche Marktanalyse, keine Finanzberatung.
#BTC #Bitcoin #BTCUSDT #Binance #ShortSignal #CryptoTrading #TechnicalAnalysis
Bitcoin zeigt im 1-Stunden-Chart eine bärische Dynamik und wird unterhalb der gestaffelten EMAs gehandelt. Die Verkäufer haben weiterhin die Kontrolle, aber überverkaufte Bedingungen könnten eine vorübergehende Erholung auslösen. 📉
📍 **SHORT-EINSTIEG:** $67,198.92 – $67,323.28
🎯 **GEWINNMITNAHMEZIELE:**
- TP1: $66,210.07 (-1.6%)
- TP2: $65,509.38 (-2.6%)
- TP3: $64,458.34 (-4.2%)
🛑 **STOP-LOSS:** $68,662.48 (+2.1%)
📊 **TRADE-MANAGEMENT:**
- Bei TP1 50 % schließen.
- Bei TP2 25 % schließen.
- Die verbleibenden 25 % bei TP3 schließen.
- Nach TP1 den SL auf den Einstiegspreis verschieben.
🔎 **WARUM ICH DEN SHORT IM BLICK HABE:**
- Bärische EMA-Struktur im 1-Stunden-Chart.
- Der Kurs wird unter wichtigen EMAs gehandelt.
- Ein RSI von 22.4 im 4-Stunden-Chart weist auf überverkaufte Bedingungen hin.
- Eine Fortsetzung der Abwärtsdynamik ist möglich.
⚠️ **Risikomanagement:** Nur mäßige Überzeugung. Positionsgröße gering halten und auf plötzliche Erholungsrallyes achten.
💬 Wo liegt eurer Meinung nach das nächste Abwärtsziel für BTC? 👇
DYOR | NFA. Ausschließlich eine lehrreiche Marktanalyse, keine Finanzberatung.
#BTC #Bitcoin #BTCUSDT #Binance #ShortSignal #CryptoTrading #TechnicalAnalysis
62

·
--
Übersetzung ansehen
Anatomy of the Arbitrum Tape: Weekend Chart Mechanics
Sunday evening usually brings the wick hunters out to play as we watch the weekly candle close approach. While the broader market is often distracted by noise, we need to look at how $ARB is actually printing its structural foundation. If you look at the recent price action hovering near the 0.64 region, you will notice the wick rejections are telling a much deeper story than the candle bodies themselves. A long lower shadow in this zone isn't just a line on a screen; it represents a specific pocket where liquidity was grabbed and spot absorption prevented a deeper slide toward previous lows.
When we apply Smart Money Concepts to the ARB chart, we are essentially hunting for Fair Value Gaps where price moved too fast for orders to be filled efficiently. These gaps often act as magnets during the Monday volatility shift. We also have to keep the macro tokenomics in mind. With a circulating float of approximately 3.9 billion tokens and a total supply of 10 billion, the Wyckoff accumulation phase here is notably prolonged. We are seeing classic signs of a preliminary support followed by a test, but the overhead supply from scheduled unlocks means the distribution phase is never far from a trader's mind.
Mastering the Market Structure Shift is the final piece of the puzzle. A true shift occurs when the sequence of lower highs is finally interrupted by a clean break of a recent swing high. For ARB, this involves neutralizing the localized order blocks that formed during previous sell-side imbalances. These blocks represent where institutional sell orders are clustered. I am paying close attention to how the candles react to these institutional footprints as the liquidity thinness of the weekend fades. Are you seeing signs of a genuine Wyckoff spring here, or is this just another liquidity trap before the weekly open?
_
#TechnicalAnalysis #CandlestickPatterns
Anatomy of the Arbitrum Tape: Weekend Chart Mechanics
Sunday evening usually brings the wick hunters out to play as we watch the weekly candle close approach. While the broader market is often distracted by noise, we need to look at how $ARB is actually printing its structural foundation. If you look at the recent price action hovering near the 0.64 region, you will notice the wick rejections are telling a much deeper story than the candle bodies themselves. A long lower shadow in this zone isn't just a line on a screen; it represents a specific pocket where liquidity was grabbed and spot absorption prevented a deeper slide toward previous lows.
When we apply Smart Money Concepts to the ARB chart, we are essentially hunting for Fair Value Gaps where price moved too fast for orders to be filled efficiently. These gaps often act as magnets during the Monday volatility shift. We also have to keep the macro tokenomics in mind. With a circulating float of approximately 3.9 billion tokens and a total supply of 10 billion, the Wyckoff accumulation phase here is notably prolonged. We are seeing classic signs of a preliminary support followed by a test, but the overhead supply from scheduled unlocks means the distribution phase is never far from a trader's mind.
Mastering the Market Structure Shift is the final piece of the puzzle. A true shift occurs when the sequence of lower highs is finally interrupted by a clean break of a recent swing high. For ARB, this involves neutralizing the localized order blocks that formed during previous sell-side imbalances. These blocks represent where institutional sell orders are clustered. I am paying close attention to how the candles react to these institutional footprints as the liquidity thinness of the weekend fades. Are you seeing signs of a genuine Wyckoff spring here, or is this just another liquidity trap before the weekly open?
_
#TechnicalAnalysis #CandlestickPatterns
Sunday evening usually brings the wick hunters out to play as we watch the weekly candle close approach. While the broader market is often distracted by noise, we need to look at how $ARB is actually printing its structural foundation. If you look at the recent price action hovering near the 0.64 region, you will notice the wick rejections are telling a much deeper story than the candle bodies themselves. A long lower shadow in this zone isn't just a line on a screen; it represents a specific pocket where liquidity was grabbed and spot absorption prevented a deeper slide toward previous lows.
When we apply Smart Money Concepts to the ARB chart, we are essentially hunting for Fair Value Gaps where price moved too fast for orders to be filled efficiently. These gaps often act as magnets during the Monday volatility shift. We also have to keep the macro tokenomics in mind. With a circulating float of approximately 3.9 billion tokens and a total supply of 10 billion, the Wyckoff accumulation phase here is notably prolonged. We are seeing classic signs of a preliminary support followed by a test, but the overhead supply from scheduled unlocks means the distribution phase is never far from a trader's mind.
Mastering the Market Structure Shift is the final piece of the puzzle. A true shift occurs when the sequence of lower highs is finally interrupted by a clean break of a recent swing high. For ARB, this involves neutralizing the localized order blocks that formed during previous sell-side imbalances. These blocks represent where institutional sell orders are clustered. I am paying close attention to how the candles react to these institutional footprints as the liquidity thinness of the weekend fades. Are you seeing signs of a genuine Wyckoff spring here, or is this just another liquidity trap before the weekly open?
_
#TechnicalAnalysis #CandlestickPatterns
1
131

Übersetzung ansehen
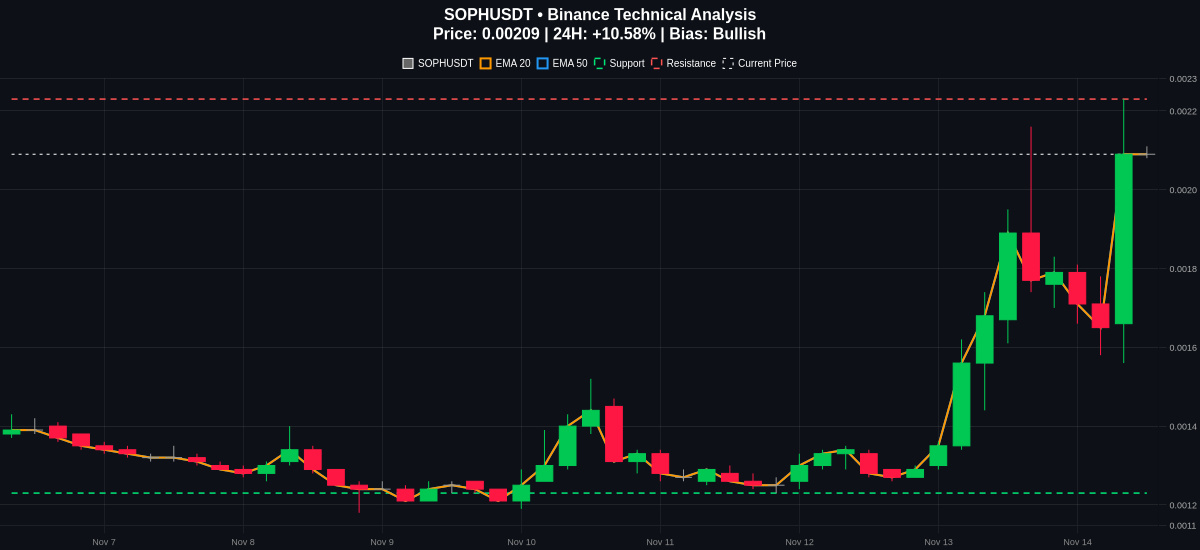
Is $SOPH about to make a major move past its ceiling? 🚀
SOPHUSDT is currently trading at 0.00209, marking a solid 24-hour gain of over 10 percent. Price is pressing right up against a key resistance level at 0.00223, and the bullish trend structure suggests buyers are attempting to build pressure.
Looking at the technical indicators, the setup shows strong upward momentum. The MACD line at 0.000168 sits above its signal line at 0.000104, while the price holds well above both the EMA20 at 0.00161 and EMA50 at 0.00148.
At the same time, the RSI is reading at 74.36. While this indicates elevated conditions, it is not an automatic sell signal, though the distance from the EMA20 does introduce some potential pullback risk if momentum cools down.
On the downside, support is established at 0.00123, which serves as a key invalidation area to monitor if the market reverses. Watch for a confirmed break above resistance or a retest of support before making any moves.
How are you managing your risk on SOPH right now?
#SOPH #CryptoTrading #TechnicalAnalysis
Follow me for more update 📈
Is $SOPH about to make a major move past its ceiling? 🚀
SOPHUSDT is currently trading at 0.00209, marking a solid 24-hour gain of over 10 percent. Price is pressing right up against a key resistance level at 0.00223, and the bullish trend structure suggests buyers are attempting to build pressure.
Looking at the technical indicators, the setup shows strong upward momentum. The MACD line at 0.000168 sits above its signal line at 0.000104, while the price holds well above both the EMA20 at 0.00161 and EMA50 at 0.00148.
At the same time, the RSI is reading at 74.36. While this indicates elevated conditions, it is not an automatic sell signal, though the distance from the EMA20 does introduce some potential pullback risk if momentum cools down.
On the downside, support is established at 0.00123, which serves as a key invalidation area to monitor if the market reverses. Watch for a confirmed break above resistance or a retest of support before making any moves.
How are you managing your risk on SOPH right now?
#SOPH #CryptoTrading #TechnicalAnalysis
Follow me for more update 📈
SOPHUSDT is currently trading at 0.00209, marking a solid 24-hour gain of over 10 percent. Price is pressing right up against a key resistance level at 0.00223, and the bullish trend structure suggests buyers are attempting to build pressure.
Looking at the technical indicators, the setup shows strong upward momentum. The MACD line at 0.000168 sits above its signal line at 0.000104, while the price holds well above both the EMA20 at 0.00161 and EMA50 at 0.00148.
At the same time, the RSI is reading at 74.36. While this indicates elevated conditions, it is not an automatic sell signal, though the distance from the EMA20 does introduce some potential pullback risk if momentum cools down.
On the downside, support is established at 0.00123, which serves as a key invalidation area to monitor if the market reverses. Watch for a confirmed break above resistance or a retest of support before making any moves.
How are you managing your risk on SOPH right now?
#SOPH #CryptoTrading #TechnicalAnalysis
Follow me for more update 📈
181

Übersetzung ansehen
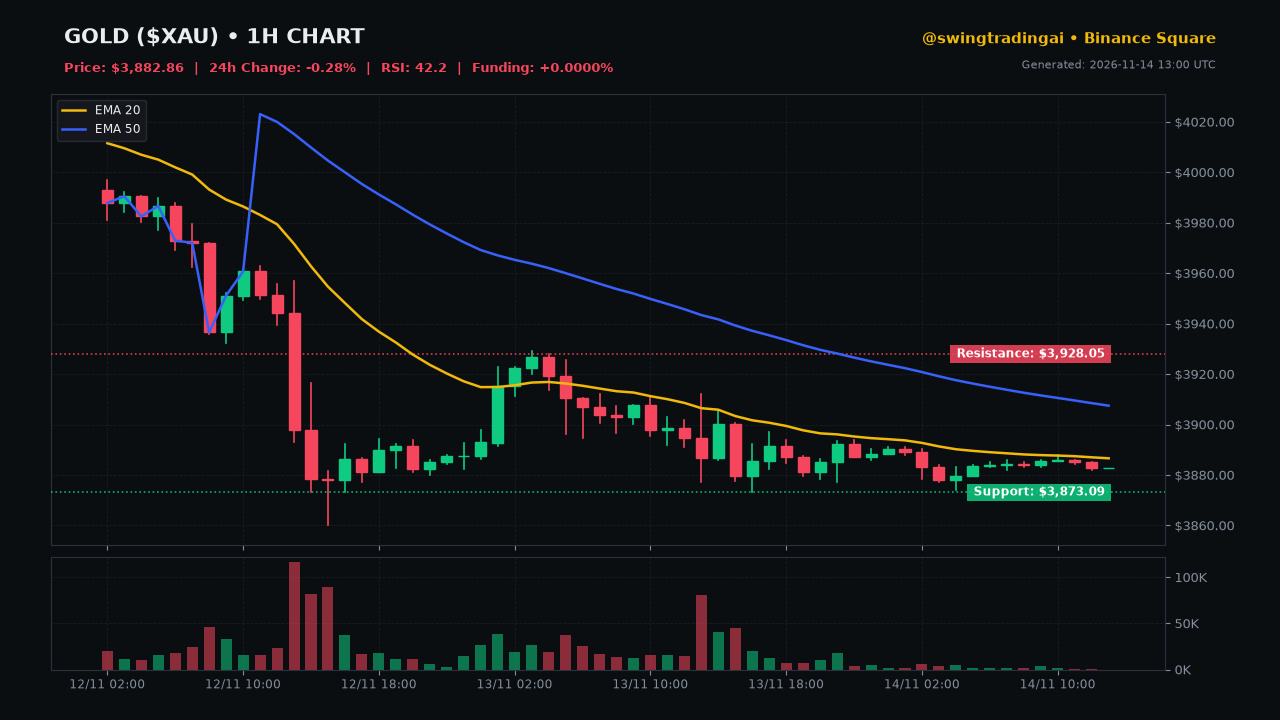
📊 ORDER FLOW COMPRESSION: $XAU TIGHTENS INTO CRITICAL VOLUME SHELF
I am watching gold hover near crucial intraday lows this morning as sellers slowly exhaust their momentum. Order flow shows a noticeable lack of aggressive follow-through on this minor pullback, suggesting smart money is absorbing supply.
📊 HARD METRICS & ORDER FLOW:
• Price Action: $3,882.86 (-0.28% 24h) testing range lows
• RSI (14): 42.2 in neutral territory indicating potential trend continuation
• Trend Bias: EMA(20) at $3,886.62 and EMA(50) at $3,907.49 signaling a mild bearish correction
• Key Levels: Immediate support at $3,873.09 versus overhead resistance at $3,928.05
🎯 TACTICAL SWING PLAYBOOK:
Trade the levels, not the emotions.
🟢 BULLISH SCENARIO:
If price sweeps the $3,873 support and forms a strong rejection wick, I am looking to long the retest with a tight stop-loss below $3,865. Targeting a recovery back toward the EMA(20) at $3,886 and resistance at $3,928 for a solid 1:3.0 Risk-to-Reward ratio.
🔴 BEARISH SCENARIO:
If volume surges on a sustained breakdown beneath $3,873, I expect a deeper flush toward the $3,850 psychological demand zone. Invalidation sits on any reclaim of the $3,886 level.
💬 COMMUNITY DEBATE:
Are you fading this dip or waiting for a confirmed breakout above resistance? Drop your target below! 👇
$XAU #Write2Earn #BinanceSquare #CryptoTrading #TechnicalAnalysis
⚠️ Educational purposes only. Not financial advice. Always manage your risk.
📊 ORDER FLOW COMPRESSION: $XAU TIGHTENS INTO CRITICAL VOLUME SHELF
I am watching gold hover near crucial intraday lows this morning as sellers slowly exhaust their momentum. Order flow shows a noticeable lack of aggressive follow-through on this minor pullback, suggesting smart money is absorbing supply.
📊 HARD METRICS & ORDER FLOW:
• Price Action: $3,882.86 (-0.28% 24h) testing range lows
• RSI (14): 42.2 in neutral territory indicating potential trend continuation
• Trend Bias: EMA(20) at $3,886.62 and EMA(50) at $3,907.49 signaling a mild bearish correction
• Key Levels: Immediate support at $3,873.09 versus overhead resistance at $3,928.05
🎯 TACTICAL SWING PLAYBOOK:
Trade the levels, not the emotions.
🟢 BULLISH SCENARIO:
If price sweeps the $3,873 support and forms a strong rejection wick, I am looking to long the retest with a tight stop-loss below $3,865. Targeting a recovery back toward the EMA(20) at $3,886 and resistance at $3,928 for a solid 1:3.0 Risk-to-Reward ratio.
🔴 BEARISH SCENARIO:
If volume surges on a sustained breakdown beneath $3,873, I expect a deeper flush toward the $3,850 psychological demand zone. Invalidation sits on any reclaim of the $3,886 level.
💬 COMMUNITY DEBATE:
Are you fading this dip or waiting for a confirmed breakout above resistance? Drop your target below! 👇
$XAU #Write2Earn #BinanceSquare #CryptoTrading #TechnicalAnalysis
⚠️ Educational purposes only. Not financial advice. Always manage your risk.
I am watching gold hover near crucial intraday lows this morning as sellers slowly exhaust their momentum. Order flow shows a noticeable lack of aggressive follow-through on this minor pullback, suggesting smart money is absorbing supply.
📊 HARD METRICS & ORDER FLOW:
• Price Action: $3,882.86 (-0.28% 24h) testing range lows
• RSI (14): 42.2 in neutral territory indicating potential trend continuation
• Trend Bias: EMA(20) at $3,886.62 and EMA(50) at $3,907.49 signaling a mild bearish correction
• Key Levels: Immediate support at $3,873.09 versus overhead resistance at $3,928.05
🎯 TACTICAL SWING PLAYBOOK:
Trade the levels, not the emotions.
🟢 BULLISH SCENARIO:
If price sweeps the $3,873 support and forms a strong rejection wick, I am looking to long the retest with a tight stop-loss below $3,865. Targeting a recovery back toward the EMA(20) at $3,886 and resistance at $3,928 for a solid 1:3.0 Risk-to-Reward ratio.
🔴 BEARISH SCENARIO:
If volume surges on a sustained breakdown beneath $3,873, I expect a deeper flush toward the $3,850 psychological demand zone. Invalidation sits on any reclaim of the $3,886 level.
💬 COMMUNITY DEBATE:
Are you fading this dip or waiting for a confirmed breakout above resistance? Drop your target below! 👇
$XAU #Write2Earn #BinanceSquare #CryptoTrading #TechnicalAnalysis
⚠️ Educational purposes only. Not financial advice. Always manage your risk.
151
·
--
Bullisch
NEAR/USDT — Positive Entwicklung in 24 Stunden, aber das 4-Stunden-Momentum bleibt schwach
Binance-Spotpreis: $3.363
Veränderung in 24 Stunden: +0.900%
Spanne in 24 Stunden: $3.313 – $3.639
Wichtige technische Niveaus
Unterstützung: $3.340–$3.313, gefolgt von $3.265.
Widerstand: $3.478, der 4-Stunden-EMA20 bei etwa $3.514, danach $3.639.
Trend & Momentum: NEAR verzeichnet in den letzten 24 Stunden eine positive Veränderung, die kurzfristige technische Struktur bleibt jedoch schwach. Der Kurs liegt unter dem 4-Stunden-EMA20, während der RSI14 bei 38.0 auf negatives Momentum hindeutet, ohne dass stark überverkaufte Bedingungen vorliegen.
Bullishes Szenario: Hält sich der Kurs über $3.313 und erobert $3.478 zurück, könnte dies Spielraum für einen Test des EMA20 bei etwa $3.514 schaffen. Ein nachhaltiger Ausbruch über dieses Niveau würde $3.639 wieder in den Fokus rücken.
Bearishes Szenario: Ein deutlicher Durchbruch unter $3.313 würde das jüngste Swing-Tief bei $3.265 freilegen. Gelingt es nicht, $3.478 zurückzuerobern, bleibt der Erholungsversuch anfällig.
Fazit: Die positive Veränderung von NEAR in den letzten 24 Stunden hat bislang noch nicht zu einer bestätigten Erholung im 4-Stunden-Zeitrahmen geführt. Entscheidend ist, ob die Käufer $3.514 zurückerobern und das kurzfristige Momentum wiederherstellen können.
{spot}(NEARUSDT)
{spot}(BTCUSDT)
{spot}(ETHUSDT)
$NEAR $BTC $ETH
#TripsSam #NEAR #NEARProtocol #Altcoins #TechnicalAnalysis
Nur Marktanalyse — keine Finanzberatung.
NEAR/USDT — Positive Entwicklung in 24 Stunden, aber das 4-Stunden-Momentum bleibt schwach
Binance-Spotpreis: $3.363
Veränderung in 24 Stunden: +0.900%
Spanne in 24 Stunden: $3.313 – $3.639
Wichtige technische Niveaus
Unterstützung: $3.340–$3.313, gefolgt von $3.265.
Widerstand: $3.478, der 4-Stunden-EMA20 bei etwa $3.514, danach $3.639.
Trend & Momentum: NEAR verzeichnet in den letzten 24 Stunden eine positive Veränderung, die kurzfristige technische Struktur bleibt jedoch schwach. Der Kurs liegt unter dem 4-Stunden-EMA20, während der RSI14 bei 38.0 auf negatives Momentum hindeutet, ohne dass stark überverkaufte Bedingungen vorliegen.
Bullishes Szenario: Hält sich der Kurs über $3.313 und erobert $3.478 zurück, könnte dies Spielraum für einen Test des EMA20 bei etwa $3.514 schaffen. Ein nachhaltiger Ausbruch über dieses Niveau würde $3.639 wieder in den Fokus rücken.
Bearishes Szenario: Ein deutlicher Durchbruch unter $3.313 würde das jüngste Swing-Tief bei $3.265 freilegen. Gelingt es nicht, $3.478 zurückzuerobern, bleibt der Erholungsversuch anfällig.
Fazit: Die positive Veränderung von NEAR in den letzten 24 Stunden hat bislang noch nicht zu einer bestätigten Erholung im 4-Stunden-Zeitrahmen geführt. Entscheidend ist, ob die Käufer $3.514 zurückerobern und das kurzfristige Momentum wiederherstellen können.
$NEAR $BTC $ETH
#TripsSam #NEAR #NEARProtocol #Altcoins #TechnicalAnalysis
Nur Marktanalyse — keine Finanzberatung.
Binance-Spotpreis: $3.363
Veränderung in 24 Stunden: +0.900%
Spanne in 24 Stunden: $3.313 – $3.639
Wichtige technische Niveaus
Unterstützung: $3.340–$3.313, gefolgt von $3.265.
Widerstand: $3.478, der 4-Stunden-EMA20 bei etwa $3.514, danach $3.639.
Trend & Momentum: NEAR verzeichnet in den letzten 24 Stunden eine positive Veränderung, die kurzfristige technische Struktur bleibt jedoch schwach. Der Kurs liegt unter dem 4-Stunden-EMA20, während der RSI14 bei 38.0 auf negatives Momentum hindeutet, ohne dass stark überverkaufte Bedingungen vorliegen.
Bullishes Szenario: Hält sich der Kurs über $3.313 und erobert $3.478 zurück, könnte dies Spielraum für einen Test des EMA20 bei etwa $3.514 schaffen. Ein nachhaltiger Ausbruch über dieses Niveau würde $3.639 wieder in den Fokus rücken.
Bearishes Szenario: Ein deutlicher Durchbruch unter $3.313 würde das jüngste Swing-Tief bei $3.265 freilegen. Gelingt es nicht, $3.478 zurückzuerobern, bleibt der Erholungsversuch anfällig.
Fazit: Die positive Veränderung von NEAR in den letzten 24 Stunden hat bislang noch nicht zu einer bestätigten Erholung im 4-Stunden-Zeitrahmen geführt. Entscheidend ist, ob die Käufer $3.514 zurückerobern und das kurzfristige Momentum wiederherstellen können.
$NEAR $BTC $ETH
#TripsSam #NEAR #NEARProtocol #Altcoins #TechnicalAnalysis
Nur Marktanalyse — keine Finanzberatung.
137
Anmelden und weiter Inhalte entdecken
Krypto-Nutzer weltweit auf Binance Square kennenlernen
⚡️ Bleib in Sachen Krypto stets am Puls.
💬 Die weltgrößte Kryptobörse vertraut darauf.
👍 Erhalte verlässliche Einblicke von verifizierten Creators.
E-Mail-Adresse/Telefonnummer
Trendthemen
1
#WhoWillSucceedJensenHuangatNvidia?
87,627 Aufrufe
1,149 Kommentare
2
#WhatWillDriveCryptoandStocks’NextRebound?
439,239 Aufrufe
3,050 Kommentare
3
#BitcoinActiveSupplyInProfitDropsBelow45%
26,051 Aufrufe
365 Kommentare
4
#KavaSaysAbnormalActivityLimitedToKavaLend
10,638 Aufrufe
182 Kommentare
5
#USSpotXRPETFsSeeLargestWeeklyOutflowIn8Months
9,738 Aufrufe
175 Kommentare
6
#USPPIMissMayEaseBTCPressure
213,404 Aufrufe
2,065 Kommentare
7
#WORPTLetsTouristsConvertCryptoToThaiBaht
2,831 Aufrufe
51 Kommentare
8
#TONStrategyReports$23.97MQ3NetLoss
3,714 Aufrufe
41 Kommentare
9
#PolkadotCommunityApprovesNewStrategyWith97%Vote
19,491 Aufrufe
249 Kommentare
10
#dYdXPlansV9.9UpgradeToShiftUSDCToInjective
12,350 Aufrufe
200 Kommentare