
#openinterest
openinterest
460,684 views
3,049 Discussing
Hot
Latest

·
--
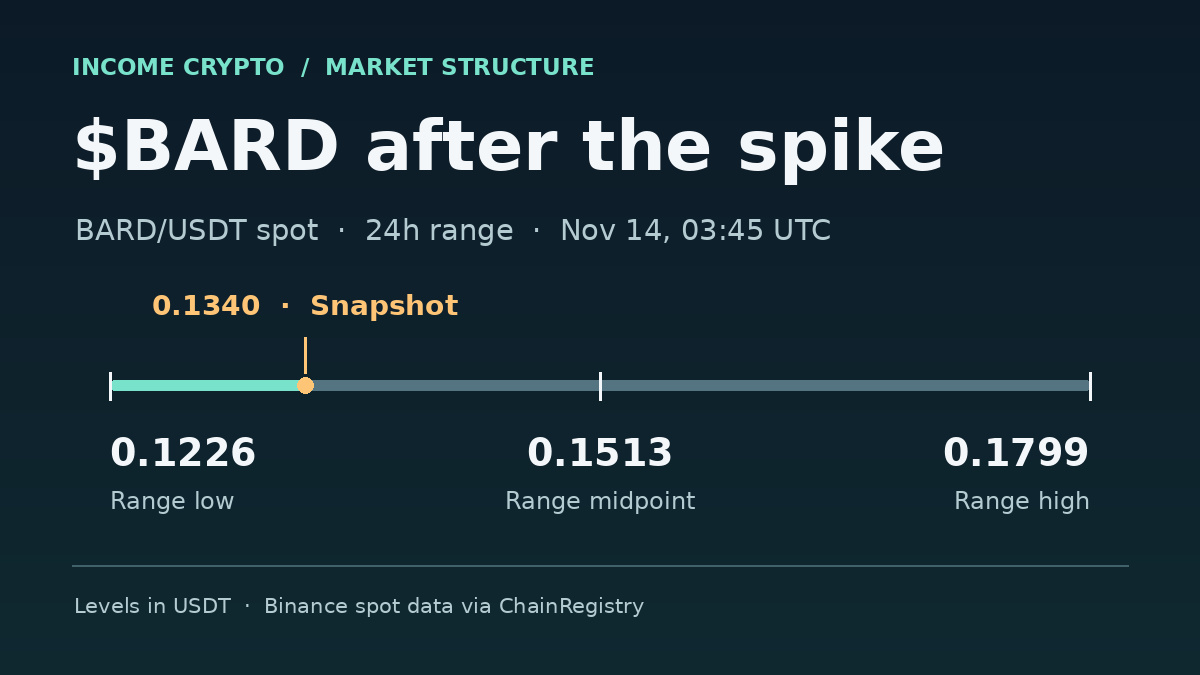
$BARD ran from roughly 0.08 to 0.18 USDT over Nov. 12–13. After a move like that, I’d watch the next pullback. That’s where I’d look for buyers to show up again.
Short liquidations may have added fuel to the Lombard rally. When leveraged shorts get forced out, the orders that close them can push price higher. What started the move is still unclear.
At 03:15 UTC on Nov. 14, Binance BARD/USDT perpetual open interest was $9.1M, down 1.3% over 24 hours. Funding at that same snapshot was −0.94% per funding period, meaning shorts were paying longs.
On the 15-minute BARD/USDT spot chart, I’d watch the 9 and 21 EMAs. If price pulls back toward the 21 on lighter volume, then gets back above the 9 as spot volume picks up, I’d keep watching. If it closes below the 21 on heavier volume and struggles to reclaim it, I’d sit this one out.
After a move like this, what do you look for on the first bounce?
#Lombard #OpenInterest #SpotVolume
{future}(BARDUSDT)
$BARD ran from roughly 0.08 to 0.18 USDT over Nov. 12–13. After a move like that, I’d watch the next pullback. That’s where I’d look for buyers to show up again.
Short liquidations may have added fuel to the Lombard rally. When leveraged shorts get forced out, the orders that close them can push price higher. What started the move is still unclear.
At 03:15 UTC on Nov. 14, Binance BARD/USDT perpetual open interest was $9.1M, down 1.3% over 24 hours. Funding at that same snapshot was −0.94% per funding period, meaning shorts were paying longs.
On the 15-minute BARD/USDT spot chart, I’d watch the 9 and 21 EMAs. If price pulls back toward the 21 on lighter volume, then gets back above the 9 as spot volume picks up, I’d keep watching. If it closes below the 21 on heavier volume and struggles to reclaim it, I’d sit this one out.
After a move like this, what do you look for on the first bounce?
#Lombard #OpenInterest #SpotVolume
Short liquidations may have added fuel to the Lombard rally. When leveraged shorts get forced out, the orders that close them can push price higher. What started the move is still unclear.
At 03:15 UTC on Nov. 14, Binance BARD/USDT perpetual open interest was $9.1M, down 1.3% over 24 hours. Funding at that same snapshot was −0.94% per funding period, meaning shorts were paying longs.
On the 15-minute BARD/USDT spot chart, I’d watch the 9 and 21 EMAs. If price pulls back toward the 21 on lighter volume, then gets back above the 9 as spot volume picks up, I’d keep watching. If it closes below the 21 on heavier volume and struggles to reclaim it, I’d sit this one out.
After a move like this, what do you look for on the first bounce?
#Lombard #OpenInterest #SpotVolume
438

🦈 $BTC OPEN INTEREST SHIFTS AS LEVERAGE MIGRATES AWAY FROM TIER-ONE VENUES! 📉
Smart money footprint reveals a controlled descent in $BTC as 30-day open interest contracts across major institutional hubs. While top-tier liquidity pools stay flat, fresh leverage has quietly accumulated on alternative mid-sized venues. 📊
This structural divergence follows the momentum exhaustion witnessed near the 87K threshold where spot inflows dried up. Forced long liquidations are currently clearing out late speculative excess while expiry settlements compress institutional positioning. ⚡
Are mid-tier leveraged builds signaling an incoming volatility flush or a structural base-building phase? 🤔
⚠️ Not financial advice. Always manage your risk. 🛡️
🏷️ #BTC #MarketStructure #OpenInterest #Crypto
🦈 ⚖️
🦈 $BTC OPEN INTEREST SHIFTS AS LEVERAGE MIGRATES AWAY FROM TIER-ONE VENUES! 📉
Smart money footprint reveals a controlled descent in $BTC as 30-day open interest contracts across major institutional hubs. While top-tier liquidity pools stay flat, fresh leverage has quietly accumulated on alternative mid-sized venues. 📊
This structural divergence follows the momentum exhaustion witnessed near the 87K threshold where spot inflows dried up. Forced long liquidations are currently clearing out late speculative excess while expiry settlements compress institutional positioning. ⚡
Are mid-tier leveraged builds signaling an incoming volatility flush or a structural base-building phase? 🤔
⚠️ Not financial advice. Always manage your risk. 🛡️
🏷️ #BTC #MarketStructure #OpenInterest #Crypto
🦈 ⚖️
Smart money footprint reveals a controlled descent in $BTC as 30-day open interest contracts across major institutional hubs. While top-tier liquidity pools stay flat, fresh leverage has quietly accumulated on alternative mid-sized venues. 📊
This structural divergence follows the momentum exhaustion witnessed near the 87K threshold where spot inflows dried up. Forced long liquidations are currently clearing out late speculative excess while expiry settlements compress institutional positioning. ⚡
Are mid-tier leveraged builds signaling an incoming volatility flush or a structural base-building phase? 🤔
⚠️ Not financial advice. Always manage your risk. 🛡️
🏷️ #BTC #MarketStructure #OpenInterest #Crypto
🦈 ⚖️
12

·
--
🚨 $BTC OPEN INTEREST SHIFT REVEALS WHERE LEVERAGE IS QUIETLY MIGRATING! 🦈
When Bitcoin stalled out near eighty-seven thousand, the underlying derivatives engine started sputtering. Fresh position inflows dried up, forcing a cascade of long liquidations as the market took a controlled breath. 📊
Digging into the thirty-day open interest data tells a fascinating story of migration. While premier liquidity hubs and settlement desks saw flat to negative leverage growth, mid-sized derivatives venues quietly absorbed fresh risk with double-digit expansions. ⚡
This shift means leverage isn't vanishing, it is simply relocating to alternative order books while the market consolidates. 🔍 Are you positioning for a continuation lower or waiting for mid-sized venue leverage to flush out completely? 👇
⚠️ Not financial advice. Always manage your risk. 🛡️
🏷️ #BTC #OpenInterest #DerivativeMetrics #CryptoTrading
🔥 💎
🚨 $BTC OPEN INTEREST SHIFT REVEALS WHERE LEVERAGE IS QUIETLY MIGRATING! 🦈
When Bitcoin stalled out near eighty-seven thousand, the underlying derivatives engine started sputtering. Fresh position inflows dried up, forcing a cascade of long liquidations as the market took a controlled breath. 📊
Digging into the thirty-day open interest data tells a fascinating story of migration. While premier liquidity hubs and settlement desks saw flat to negative leverage growth, mid-sized derivatives venues quietly absorbed fresh risk with double-digit expansions. ⚡
This shift means leverage isn't vanishing, it is simply relocating to alternative order books while the market consolidates. 🔍 Are you positioning for a continuation lower or waiting for mid-sized venue leverage to flush out completely? 👇
⚠️ Not financial advice. Always manage your risk. 🛡️
🏷️ #BTC #OpenInterest #DerivativeMetrics #CryptoTrading
🔥 💎
When Bitcoin stalled out near eighty-seven thousand, the underlying derivatives engine started sputtering. Fresh position inflows dried up, forcing a cascade of long liquidations as the market took a controlled breath. 📊
Digging into the thirty-day open interest data tells a fascinating story of migration. While premier liquidity hubs and settlement desks saw flat to negative leverage growth, mid-sized derivatives venues quietly absorbed fresh risk with double-digit expansions. ⚡
This shift means leverage isn't vanishing, it is simply relocating to alternative order books while the market consolidates. 🔍 Are you positioning for a continuation lower or waiting for mid-sized venue leverage to flush out completely? 👇
⚠️ Not financial advice. Always manage your risk. 🛡️
🏷️ #BTC #OpenInterest #DerivativeMetrics #CryptoTrading
🔥 💎
20
·
--
Article
Open Interest Explained: New Money or Closed Positions?Open interest rose 22% while the price climbed. Then the price doubled and open interest fell 17%.
Same coin, same day, two completely different moves.
Open interest is the number of futures contracts still open. It grows when new positions are opened and falls when positions are closed or liquidated. On its own it does not show direction: every long has a short on the other side. Read it next to the price.
Picture 1 is one day of $AKE (15m candles, 13 Nov 2026): price on top, open interest in contracts in the middle, liquidations at the bottom.
Morning: price up, OI up. New positions were opened into the rise.Evening: price almost doubled, OI dropped, and the biggest short liquidations of the day printed. The move was made by shorts being closed, not by new buyers.After the top: liquidations stopped and OI started to grow again. New positions came back.
One trap most people fall into: open interest in dollars. It rises with the price even when nobody opens anything. During that evening move, OI in contracts fell 17%, while OI in dollars rose by more than half. Watch OI in contracts.
Picture 2 is the other side of it: where positions were opened by price. $BTC over 24 hours: 23.0K BTC opened, 32.8K BTC closed. 43% of all new positions sat in one narrow zone, 68,666-69,071, right at the current price. Many traders with the same entry in one place, so the reaction of price around that zone matters more than a random level on the chart.
Open interest does not predict price. It shows where the leverage is and what drove the move.
Both charts are from PumpGlass, free.
#OpenInterest #Bitcoin #CryptoTrading #Futures #Liquidations
Open Interest Explained: New Money or Closed Positions?
Open interest rose 22% while the price climbed. Then the price doubled and open interest fell 17%.
Same coin, same day, two completely different moves.
Open interest is the number of futures contracts still open. It grows when new positions are opened and falls when positions are closed or liquidated. On its own it does not show direction: every long has a short on the other side. Read it next to the price.
Picture 1 is one day of $AKE (15m candles, 13 Nov 2026): price on top, open interest in contracts in the middle, liquidations at the bottom.
Morning: price up, OI up. New positions were opened into the rise.Evening: price almost doubled, OI dropped, and the biggest short liquidations of the day printed. The move was made by shorts being closed, not by new buyers.After the top: liquidations stopped and OI started to grow again. New positions came back.
One trap most people fall into: open interest in dollars. It rises with the price even when nobody opens anything. During that evening move, OI in contracts fell 17%, while OI in dollars rose by more than half. Watch OI in contracts.
Picture 2 is the other side of it: where positions were opened by price. $BTC over 24 hours: 23.0K BTC opened, 32.8K BTC closed. 43% of all new positions sat in one narrow zone, 68,666-69,071, right at the current price. Many traders with the same entry in one place, so the reaction of price around that zone matters more than a random level on the chart.
Open interest does not predict price. It shows where the leverage is and what drove the move.
Both charts are from PumpGlass, free.
#OpenInterest #Bitcoin #CryptoTrading #Futures #Liquidations
Same coin, same day, two completely different moves.
Open interest is the number of futures contracts still open. It grows when new positions are opened and falls when positions are closed or liquidated. On its own it does not show direction: every long has a short on the other side. Read it next to the price.
Picture 1 is one day of $AKE (15m candles, 13 Nov 2026): price on top, open interest in contracts in the middle, liquidations at the bottom.
Morning: price up, OI up. New positions were opened into the rise.Evening: price almost doubled, OI dropped, and the biggest short liquidations of the day printed. The move was made by shorts being closed, not by new buyers.After the top: liquidations stopped and OI started to grow again. New positions came back.
One trap most people fall into: open interest in dollars. It rises with the price even when nobody opens anything. During that evening move, OI in contracts fell 17%, while OI in dollars rose by more than half. Watch OI in contracts.
Picture 2 is the other side of it: where positions were opened by price. $BTC over 24 hours: 23.0K BTC opened, 32.8K BTC closed. 43% of all new positions sat in one narrow zone, 68,666-69,071, right at the current price. Many traders with the same entry in one place, so the reaction of price around that zone matters more than a random level on the chart.
Open interest does not predict price. It shows where the leverage is and what drove the move.
Both charts are from PumpGlass, free.
#OpenInterest #Bitcoin #CryptoTrading #Futures #Liquidations
1
79

·
--
🚨 $XRP OPEN INTEREST SPIKES NEARLY 20% SIGNALING EXTREME LEVERAGE VULNERABILITY
A massive 20% surge in open interest concentrated on a major exchange reveals aggressive positioning pouring into $XRP . 📊 Meanwhile, broader market open interest remains relatively muted, highlighting an isolated pocket of high-risk leverage that institutional algorithms love to target.
When leveraged positioning detaches this aggressively from aggregate market expansion, it acts as a classic double-edged sword. Smart money often exploits these localized imbalances to trigger cascading liquidations.
💬 Are you positioning for a liquidity sweep of these leveraged extremes or staying flat? 👇
⚠️ Not financial advice. Always manage your risk. 🛡️
🏷️ #XRP #OpenInterest #SmartMoney #Derivatives
🔥
🚨 $XRP OPEN INTEREST SPIKES NEARLY 20% SIGNALING EXTREME LEVERAGE VULNERABILITY
A massive 20% surge in open interest concentrated on a major exchange reveals aggressive positioning pouring into $XRP . 📊 Meanwhile, broader market open interest remains relatively muted, highlighting an isolated pocket of high-risk leverage that institutional algorithms love to target.
When leveraged positioning detaches this aggressively from aggregate market expansion, it acts as a classic double-edged sword. Smart money often exploits these localized imbalances to trigger cascading liquidations.
💬 Are you positioning for a liquidity sweep of these leveraged extremes or staying flat? 👇
⚠️ Not financial advice. Always manage your risk. 🛡️
🏷️ #XRP #OpenInterest #SmartMoney #Derivatives
🔥
A massive 20% surge in open interest concentrated on a major exchange reveals aggressive positioning pouring into $XRP . 📊 Meanwhile, broader market open interest remains relatively muted, highlighting an isolated pocket of high-risk leverage that institutional algorithms love to target.
When leveraged positioning detaches this aggressively from aggregate market expansion, it acts as a classic double-edged sword. Smart money often exploits these localized imbalances to trigger cascading liquidations.
💬 Are you positioning for a liquidity sweep of these leveraged extremes or staying flat? 👇
⚠️ Not financial advice. Always manage your risk. 🛡️
🏷️ #XRP #OpenInterest #SmartMoney #Derivatives
🔥

·
--
$1.3B liquidated, so why didn't Bitcoin's open interest shrink?
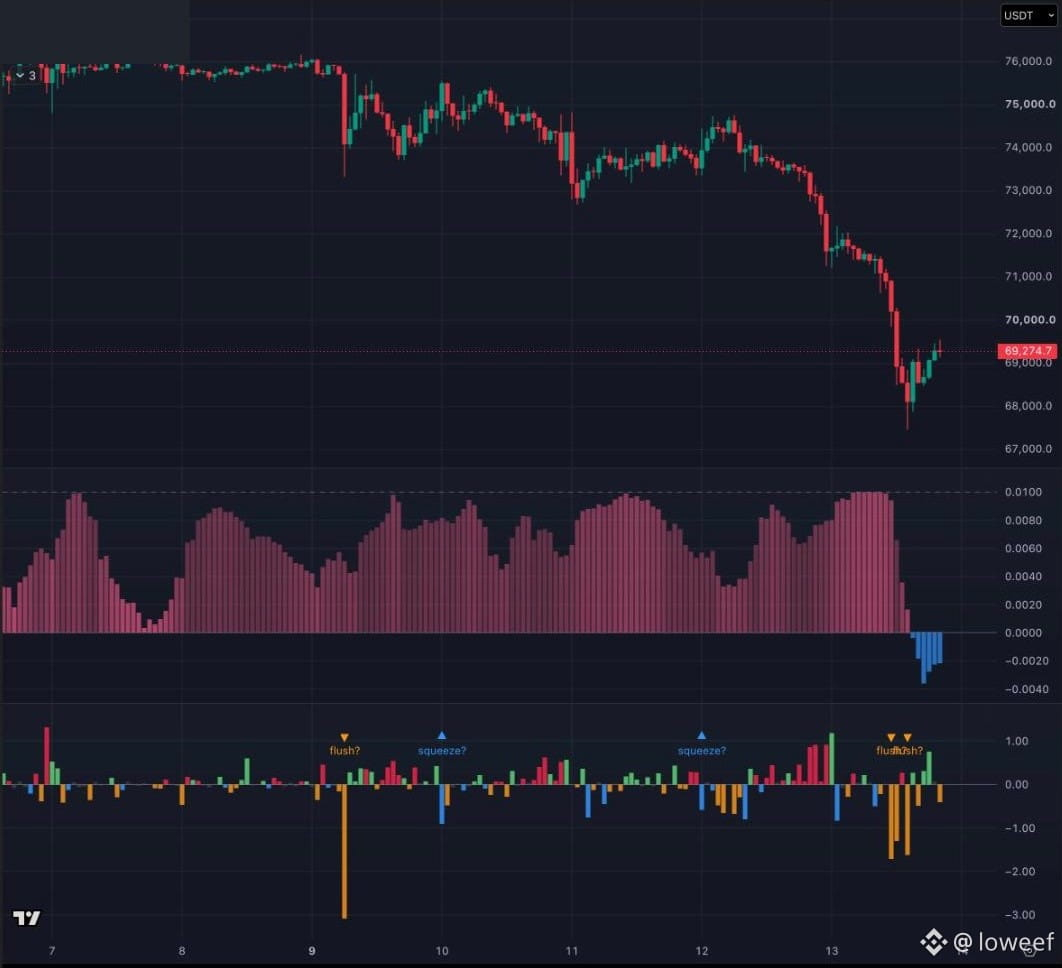
BTC broke below $70,000 on Friday and wicked to about $67,450 on the Binance perp, its lowest since Aug 19. Coinglass counted over $1.3B in crypto futures liquidations in 24 hours, $677M of it in BTC (CoinDesk, via Binance News).
Binance BTC futures, 00:00 to 11:00 UTC:
- Open interest: about 101,150 BTC to 101,400 BTC. Flat.
- Long/short ratio by account: 3.12 to 3.46.
- Top traders by position size: 2.32 to 2.06.
The chart is the BTC perp on 1H. The middle panel, Funding Compass, averages funding across four venues and just turned slightly negative for the first time this week. Below it, OI change split by side: orange bars are today's long flush.
My read: the flush was real, but the leverage came back within hours. More accounts bought the dip while the biggest positions trimmed longs, and negative funding says fresh exposure leans short by size. Not a clean reset. A grind back above $70K with flat OI pressures late shorts. Losing $67.4K makes dip buyers the next fuel.
Who gets squeezed first, late shorts or dip buyers?
$BTC #WhatWillDriveCryptoandStocks’NextRebound? #bitcoin #Openinterest
$1.3B liquidated, so why didn't Bitcoin's open interest shrink?
BTC broke below $70,000 on Friday and wicked to about $67,450 on the Binance perp, its lowest since Aug 19. Coinglass counted over $1.3B in crypto futures liquidations in 24 hours, $677M of it in BTC (CoinDesk, via Binance News).
Binance BTC futures, 00:00 to 11:00 UTC:
- Open interest: about 101,150 BTC to 101,400 BTC. Flat.
- Long/short ratio by account: 3.12 to 3.46.
- Top traders by position size: 2.32 to 2.06.
The chart is the BTC perp on 1H. The middle panel, Funding Compass, averages funding across four venues and just turned slightly negative for the first time this week. Below it, OI change split by side: orange bars are today's long flush.
My read: the flush was real, but the leverage came back within hours. More accounts bought the dip while the biggest positions trimmed longs, and negative funding says fresh exposure leans short by size. Not a clean reset. A grind back above $70K with flat OI pressures late shorts. Losing $67.4K makes dip buyers the next fuel.
Who gets squeezed first, late shorts or dip buyers?
$BTC #WhatWillDriveCryptoandStocks’NextRebound? #bitcoin #Openinterest
BTC broke below $70,000 on Friday and wicked to about $67,450 on the Binance perp, its lowest since Aug 19. Coinglass counted over $1.3B in crypto futures liquidations in 24 hours, $677M of it in BTC (CoinDesk, via Binance News).
Binance BTC futures, 00:00 to 11:00 UTC:
- Open interest: about 101,150 BTC to 101,400 BTC. Flat.
- Long/short ratio by account: 3.12 to 3.46.
- Top traders by position size: 2.32 to 2.06.
The chart is the BTC perp on 1H. The middle panel, Funding Compass, averages funding across four venues and just turned slightly negative for the first time this week. Below it, OI change split by side: orange bars are today's long flush.
My read: the flush was real, but the leverage came back within hours. More accounts bought the dip while the biggest positions trimmed longs, and negative funding says fresh exposure leans short by size. Not a clean reset. A grind back above $70K with flat OI pressures late shorts. Losing $67.4K makes dip buyers the next fuel.
Who gets squeezed first, late shorts or dip buyers?
$BTC #WhatWillDriveCryptoandStocks’NextRebound? #bitcoin #Openinterest
87

SHELL Futures: Open Interest Is Declining
CoinGlass data around November 13, 2026, placed SHELL futures open interest near $3.69 million, down approximately 7.29% over 24 hours.
Open Interest represents the value of outstanding derivatives contracts that have not yet been closed or settled. It provides information about the amount of open positioning in the futures market.
When price declines while Open Interest also falls, one possible interpretation is that existing positions are being closed. In this case, some leveraged long positions may be unwinding.
However, falling Open Interest does not prove that every closing position belongs to a long trader. It is a market-wide figure and must be interpreted alongside price, funding and liquidation data.
For SHELL, the reported decline in OI suggests reduced open positioning rather than a clear expansion in leveraged activity.
#OpenInterest #SHELL #Derivatives
SHELL Futures: Open Interest Is Declining
CoinGlass data around November 13, 2026, placed SHELL futures open interest near $3.69 million, down approximately 7.29% over 24 hours.
Open Interest represents the value of outstanding derivatives contracts that have not yet been closed or settled. It provides information about the amount of open positioning in the futures market.
When price declines while Open Interest also falls, one possible interpretation is that existing positions are being closed. In this case, some leveraged long positions may be unwinding.
However, falling Open Interest does not prove that every closing position belongs to a long trader. It is a market-wide figure and must be interpreted alongside price, funding and liquidation data.
For SHELL, the reported decline in OI suggests reduced open positioning rather than a clear expansion in leveraged activity.
#OpenInterest #SHELL #Derivatives
CoinGlass data around November 13, 2026, placed SHELL futures open interest near $3.69 million, down approximately 7.29% over 24 hours.
Open Interest represents the value of outstanding derivatives contracts that have not yet been closed or settled. It provides information about the amount of open positioning in the futures market.
When price declines while Open Interest also falls, one possible interpretation is that existing positions are being closed. In this case, some leveraged long positions may be unwinding.
However, falling Open Interest does not prove that every closing position belongs to a long trader. It is a market-wide figure and must be interpreted alongside price, funding and liquidation data.
For SHELL, the reported decline in OI suggests reduced open positioning rather than a clear expansion in leveraged activity.
#OpenInterest #SHELL #Derivatives
28

·
--
Bullish
$BTC
{future}(BTCUSDT)
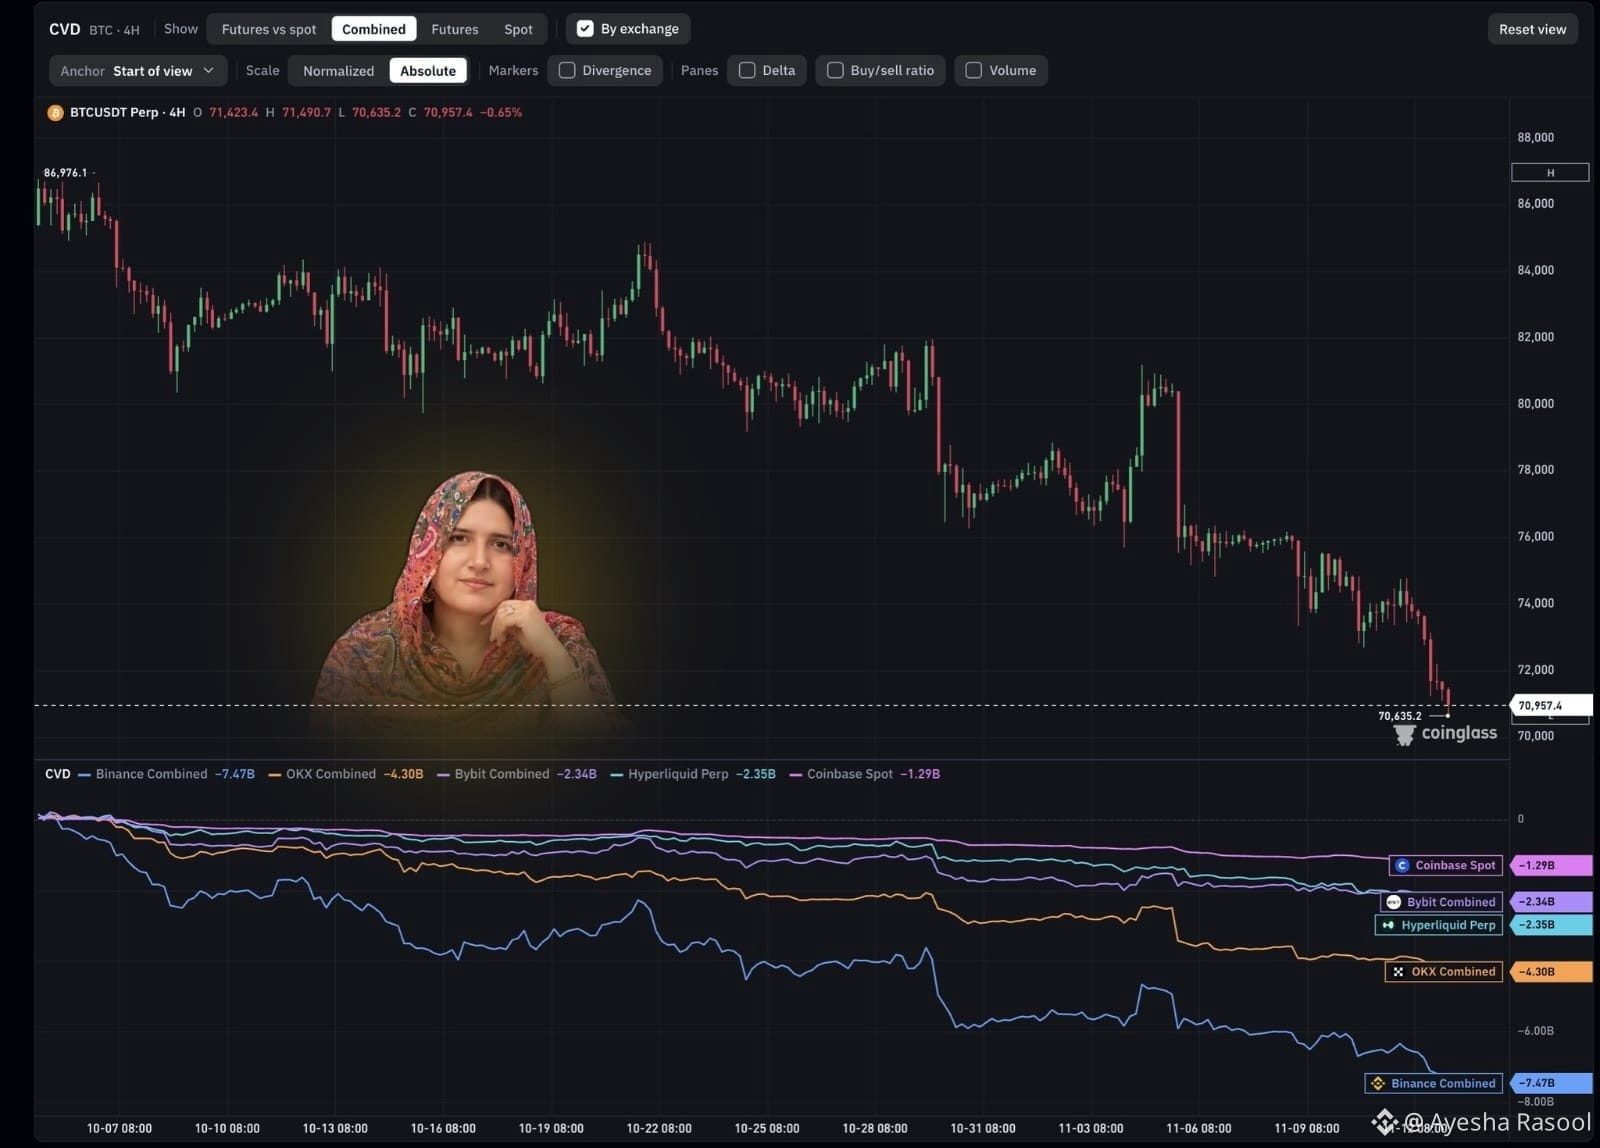
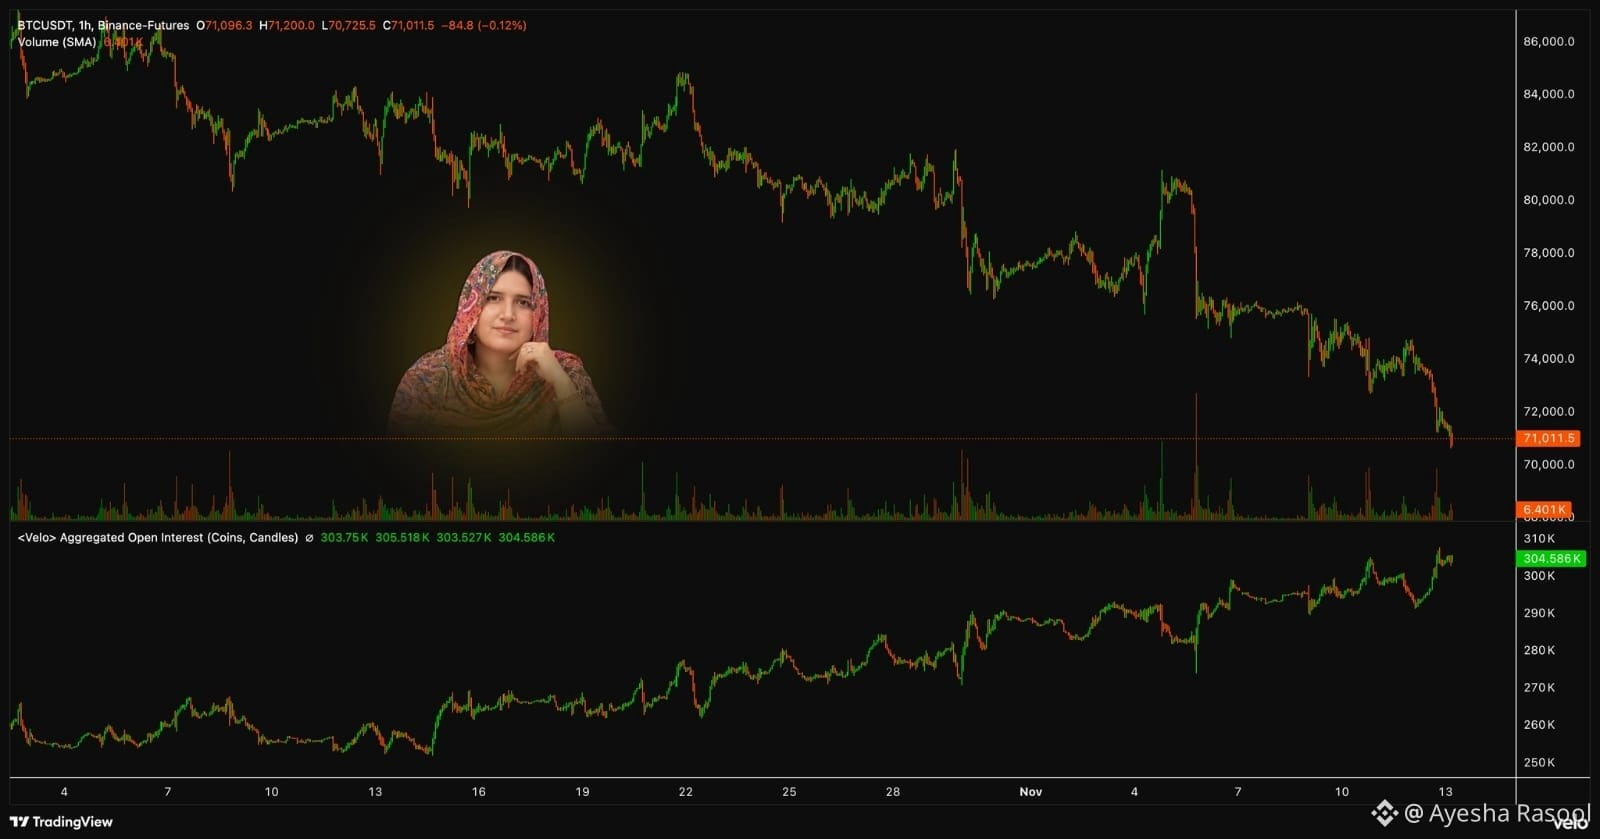
BTC: the $71K level is a bid.
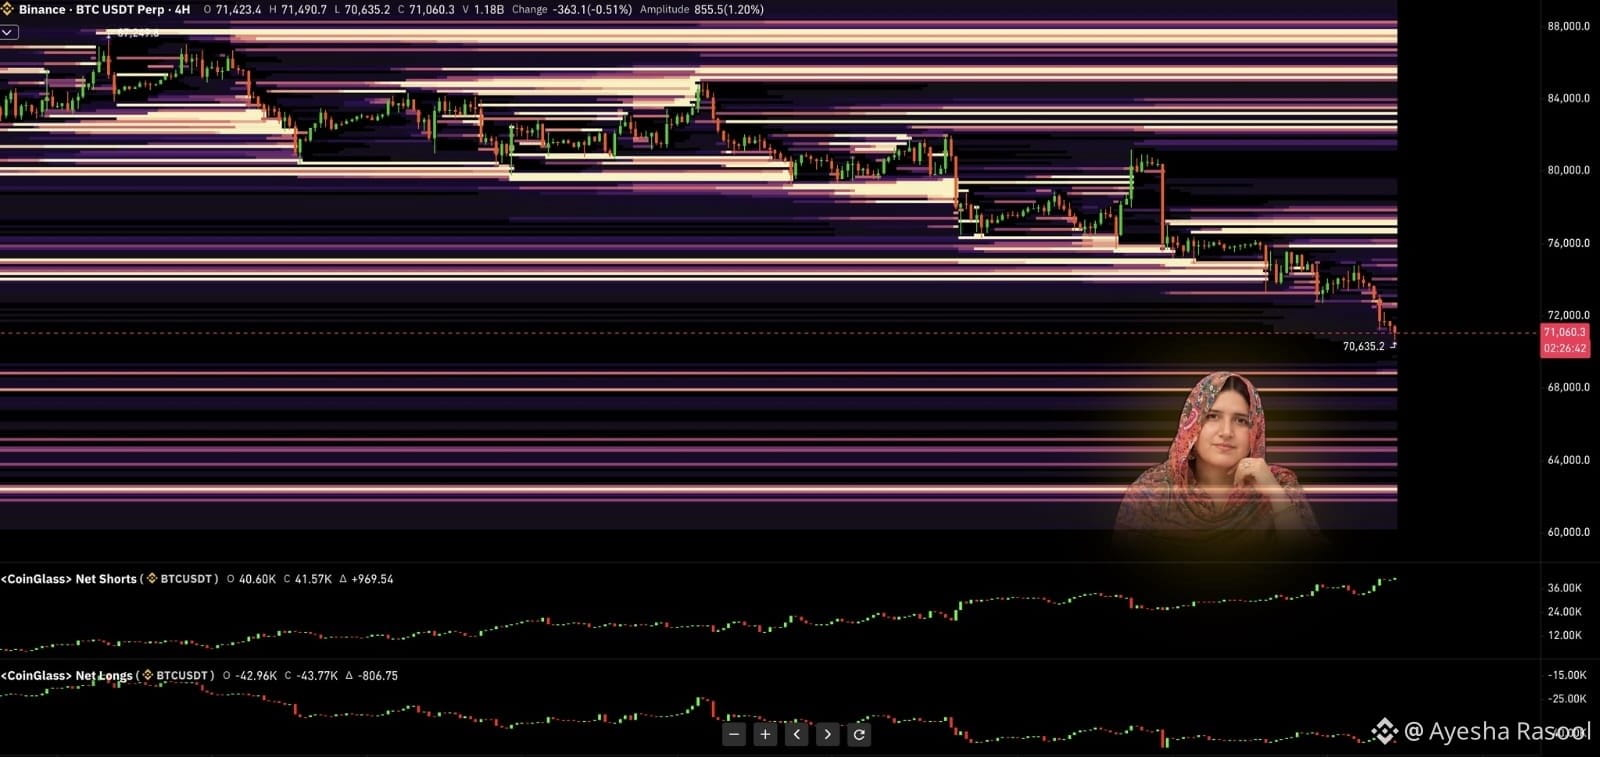
Aggregated open interest kept rising the whole way down, while net shorts kept increasing.
CVD data shows heavy selling from futures, and there are divergences between spot, price and futures.
We've seen how heavy selling like this usually ends. There's a lot of liquidation sitting above price.
Daily RSI is fully oversold, and the 1H, 4H and lower timeframes are getting oversold too. I don't see any reason we won't get a bounce.
If you think it will keep dumping with no retracement or dead cat bounce, think again. Billions in liquidations have already been wiped out in this slow bleed.
Taking the swing low to the swing high, we're also inside the best Fibonacci zone, right between the 0.5 and 0.618 levels.
Whether it's a dead cat bounce or a full reversal, it's going to be brutal.
What do you think? Share with me.
#BTC #Bitcoin #OpenInterest #CryptoAnalysis
$BTC
BTC: the $71K level is a bid.
Aggregated open interest kept rising the whole way down, while net shorts kept increasing.
CVD data shows heavy selling from futures, and there are divergences between spot, price and futures.
We've seen how heavy selling like this usually ends. There's a lot of liquidation sitting above price.
Daily RSI is fully oversold, and the 1H, 4H and lower timeframes are getting oversold too. I don't see any reason we won't get a bounce.
If you think it will keep dumping with no retracement or dead cat bounce, think again. Billions in liquidations have already been wiped out in this slow bleed.
Taking the swing low to the swing high, we're also inside the best Fibonacci zone, right between the 0.5 and 0.618 levels.
Whether it's a dead cat bounce or a full reversal, it's going to be brutal.
What do you think? Share with me.
#BTC #Bitcoin #OpenInterest #CryptoAnalysis
BTC: the $71K level is a bid.
Aggregated open interest kept rising the whole way down, while net shorts kept increasing.
CVD data shows heavy selling from futures, and there are divergences between spot, price and futures.
We've seen how heavy selling like this usually ends. There's a lot of liquidation sitting above price.
Daily RSI is fully oversold, and the 1H, 4H and lower timeframes are getting oversold too. I don't see any reason we won't get a bounce.
If you think it will keep dumping with no retracement or dead cat bounce, think again. Billions in liquidations have already been wiped out in this slow bleed.
Taking the swing low to the swing high, we're also inside the best Fibonacci zone, right between the 0.5 and 0.618 levels.
Whether it's a dead cat bounce or a full reversal, it's going to be brutal.
What do you think? Share with me.
#BTC #Bitcoin #OpenInterest #CryptoAnalysis
1
122

🚨 $BTC DROPS 5% WHILE OPEN INTEREST SPIKES TO NEW HIGHS! ⚡
The recent 5 percent flush below seventy thousand dollars caught casual spot holders off guard, yet derivatives data tells a much deeper story. 📊 Bitcoin denominated open interest actually climbed over three percent during the selloff, proving that aggressive positioning is quietly expanding beneath the surface.
Even with the downward price pressure, funding rates held steady in positive territory at zero point zero one percent. ⚡ This divergence shows that leverage is piling up rapidly, setting the stage for a violent volatility squeeze once direction is forced.
Will this rising open interest fuel a sharp short squeeze back above resistance, or will trapped longs get washed out first? 👇
⚠️ Not financial advice. Always manage your risk. 🛡️
🏷️ #BTC #FuturesTrading #OpenInterest #Crypto
🔥 💎
🚨 $BTC DROPS 5% WHILE OPEN INTEREST SPIKES TO NEW HIGHS! ⚡
The recent 5 percent flush below seventy thousand dollars caught casual spot holders off guard, yet derivatives data tells a much deeper story. 📊 Bitcoin denominated open interest actually climbed over three percent during the selloff, proving that aggressive positioning is quietly expanding beneath the surface.
Even with the downward price pressure, funding rates held steady in positive territory at zero point zero one percent. ⚡ This divergence shows that leverage is piling up rapidly, setting the stage for a violent volatility squeeze once direction is forced.
Will this rising open interest fuel a sharp short squeeze back above resistance, or will trapped longs get washed out first? 👇
⚠️ Not financial advice. Always manage your risk. 🛡️
🏷️ #BTC #FuturesTrading #OpenInterest #Crypto
🔥 💎
The recent 5 percent flush below seventy thousand dollars caught casual spot holders off guard, yet derivatives data tells a much deeper story. 📊 Bitcoin denominated open interest actually climbed over three percent during the selloff, proving that aggressive positioning is quietly expanding beneath the surface.
Even with the downward price pressure, funding rates held steady in positive territory at zero point zero one percent. ⚡ This divergence shows that leverage is piling up rapidly, setting the stage for a violent volatility squeeze once direction is forced.
Will this rising open interest fuel a sharp short squeeze back above resistance, or will trapped longs get washed out first? 👇
⚠️ Not financial advice. Always manage your risk. 🛡️
🏷️ #BTC #FuturesTrading #OpenInterest #Crypto
🔥 💎

·
--
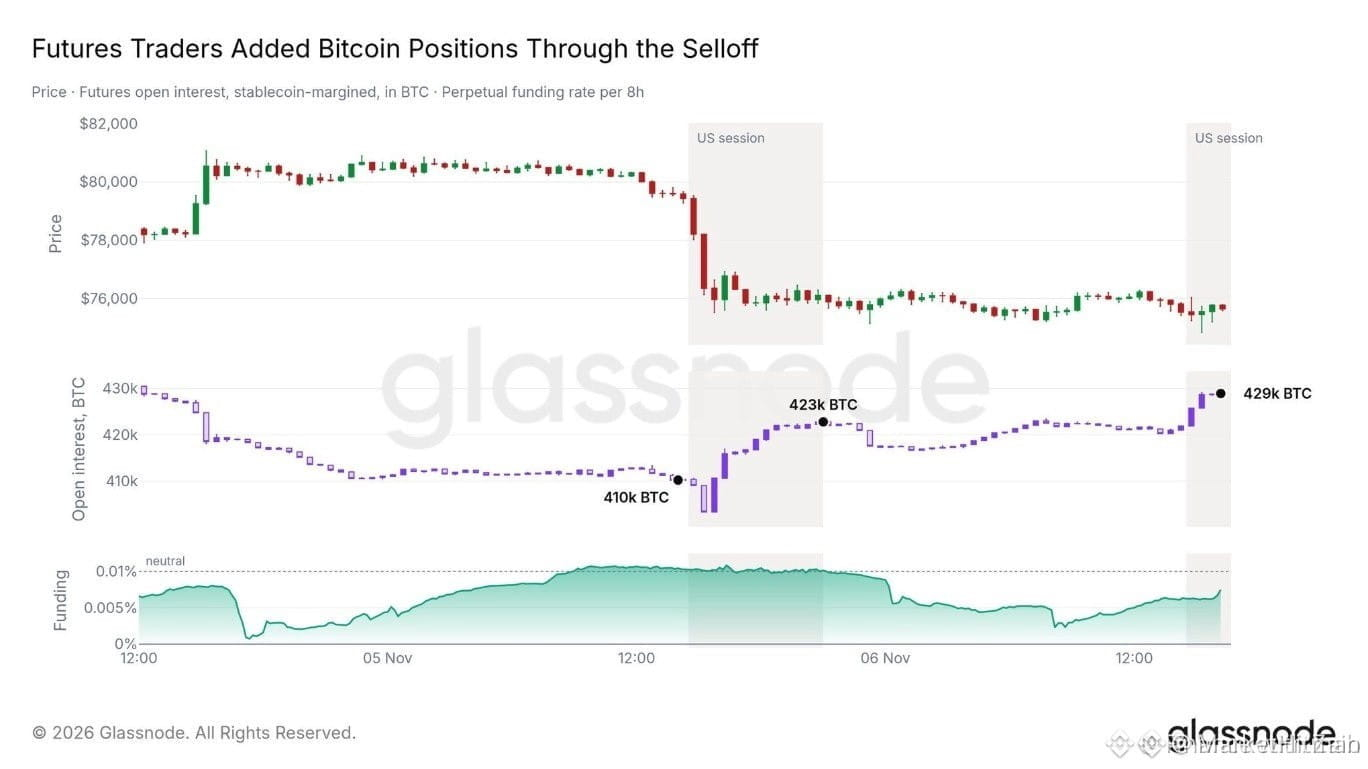
🚨 $BTC OPEN INTEREST SURGES $1.5B AS LEVERAGED LIQUIDITY PILES INTO THE DIP! 🦈
Glassnode telemetry reveals a staggering 1.5 billion dollar injection of open interest while $BTC slid lower. Instead of heading for the exits, aggressive speculators are loading up fresh leverage directly into the blood on the tape. 📊
This aggressive positioning creates a coiled spring dynamic across the order books. When the crowd piles in during a drawdown, the market maker magnet starts pulling toward resting liquidity pockets to trigger a cascade. ⚡
Are these late longs timing a surgical bottom bounce, or walking straight into a brutal long squeeze? 🤔
⚠️ Not financial advice. Always manage your risk. 🛡️
🏷️ #BTC #OpenInterest #Liquidity #CryptoTrading
🦈 🌊
🚨 $BTC OPEN INTEREST SURGES $1.5B AS LEVERAGED LIQUIDITY PILES INTO THE DIP! 🦈
Glassnode telemetry reveals a staggering 1.5 billion dollar injection of open interest while $BTC slid lower. Instead of heading for the exits, aggressive speculators are loading up fresh leverage directly into the blood on the tape. 📊
This aggressive positioning creates a coiled spring dynamic across the order books. When the crowd piles in during a drawdown, the market maker magnet starts pulling toward resting liquidity pockets to trigger a cascade. ⚡
Are these late longs timing a surgical bottom bounce, or walking straight into a brutal long squeeze? 🤔
⚠️ Not financial advice. Always manage your risk. 🛡️
🏷️ #BTC #OpenInterest #Liquidity #CryptoTrading
🦈 🌊
Glassnode telemetry reveals a staggering 1.5 billion dollar injection of open interest while $BTC slid lower. Instead of heading for the exits, aggressive speculators are loading up fresh leverage directly into the blood on the tape. 📊
This aggressive positioning creates a coiled spring dynamic across the order books. When the crowd piles in during a drawdown, the market maker magnet starts pulling toward resting liquidity pockets to trigger a cascade. ⚡
Are these late longs timing a surgical bottom bounce, or walking straight into a brutal long squeeze? 🤔
⚠️ Not financial advice. Always manage your risk. 🛡️
🏷️ #BTC #OpenInterest #Liquidity #CryptoTrading
🦈 🌊
2
·
--
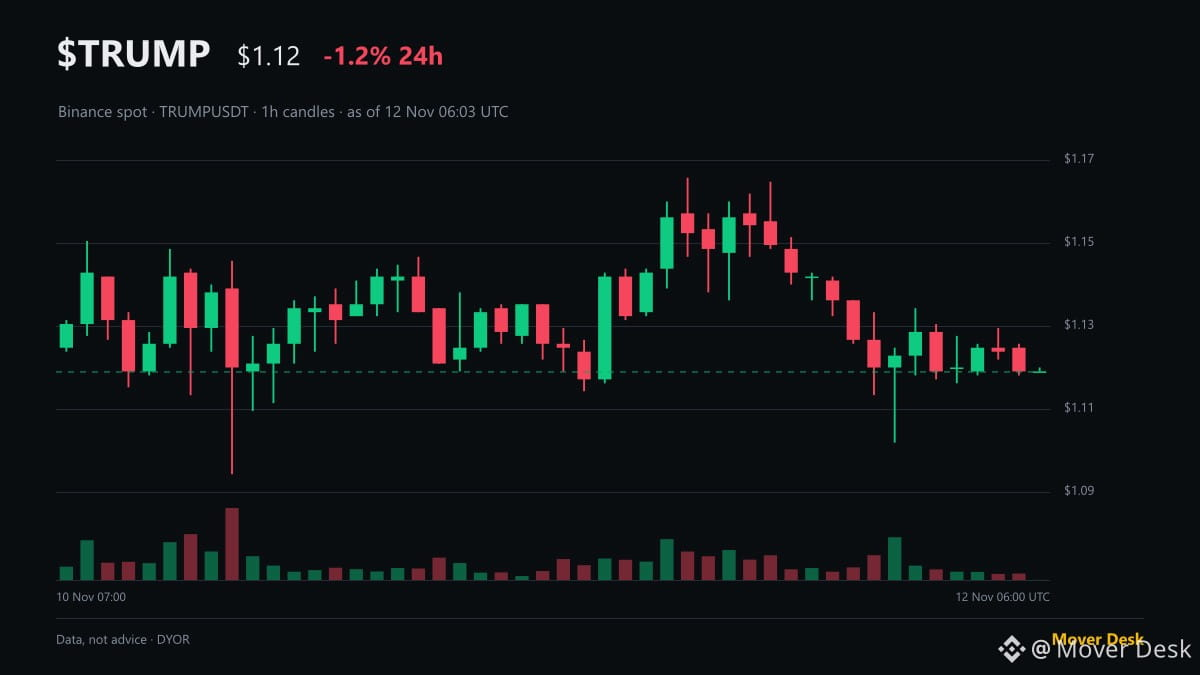
$TRUMP open interest fell -8% while price held near $1.12: what open interest really tells you (as of 06:01 UTC).
Open interest is the total count of active futures contracts that remain unsettled. Every contract has both a long and a short, so open interest never shows who is winning. It shows participation: rising open interest means new money is opening positions, while falling open interest means traders are closing contracts or getting liquidated.
Today's Binance data shows this clearly. TRUMP perpetual open interest fell -8% in 24 hours to $31.3M, while price slipped just -1.2% to $1.12 (-0.3% last hour) on $6.7M volume. With 60% of accounts long (1.49 ratio) paying a +0.0050% funding rate, the drop in open interest proves positions are closing, not growing.
Risk line: 24h volume is modest at $6.7M across a $1.10–$1.17 range, meaning lower contract depth can leave price exposed to sudden moves.
When open interest drops while price holds flat, do you see orderly de-risking or fading interest?
Mover Desk · numbers, not hype
#TRUMP #OpenInterest #Futures #Crypto
Not financial advice. DYOR.
$TRUMP open interest fell -8% while price held near $1.12: what open interest really tells you (as of 06:01 UTC).
Open interest is the total count of active futures contracts that remain unsettled. Every contract has both a long and a short, so open interest never shows who is winning. It shows participation: rising open interest means new money is opening positions, while falling open interest means traders are closing contracts or getting liquidated.
Today's Binance data shows this clearly. TRUMP perpetual open interest fell -8% in 24 hours to $31.3M, while price slipped just -1.2% to $1.12 (-0.3% last hour) on $6.7M volume. With 60% of accounts long (1.49 ratio) paying a +0.0050% funding rate, the drop in open interest proves positions are closing, not growing.
Risk line: 24h volume is modest at $6.7M across a $1.10–$1.17 range, meaning lower contract depth can leave price exposed to sudden moves.
When open interest drops while price holds flat, do you see orderly de-risking or fading interest?
Mover Desk · numbers, not hype
#TRUMP #OpenInterest #Futures #Crypto
Not financial advice. DYOR.
Open interest is the total count of active futures contracts that remain unsettled. Every contract has both a long and a short, so open interest never shows who is winning. It shows participation: rising open interest means new money is opening positions, while falling open interest means traders are closing contracts or getting liquidated.
Today's Binance data shows this clearly. TRUMP perpetual open interest fell -8% in 24 hours to $31.3M, while price slipped just -1.2% to $1.12 (-0.3% last hour) on $6.7M volume. With 60% of accounts long (1.49 ratio) paying a +0.0050% funding rate, the drop in open interest proves positions are closing, not growing.
Risk line: 24h volume is modest at $6.7M across a $1.10–$1.17 range, meaning lower contract depth can leave price exposed to sudden moves.
When open interest drops while price holds flat, do you see orderly de-risking or fading interest?
Mover Desk · numbers, not hype
#TRUMP #OpenInterest #Futures #Crypto
Not financial advice. DYOR.
1
529
SHELL futures open interest was estimated at approximately $3.8–4.3 million in recent aggregated snapshots, with a slight 24-hour decline. A reduction in OI means the total value of outstanding contracts has decreased. It may reflect position closures, but does not reveal whether the market is becoming bullish or bearish. Price movement and liquidation data are needed to understand the broader positioning picture.
#OpenInterest #Futures #SHELL
SHELL futures open interest was estimated at approximately $3.8–4.3 million in recent aggregated snapshots, with a slight 24-hour decline. A reduction in OI means the total value of outstanding contracts has decreased. It may reflect position closures, but does not reveal whether the market is becoming bullish or bearish. Price movement and liquidation data are needed to understand the broader positioning picture.
#OpenInterest #Futures #SHELL
#OpenInterest #Futures #SHELL
86

🚨 **$AGT — OPEN INTEREST EXPLODES!** 🔥
Something big is happening! 👀
{future}(AGTUSDT)
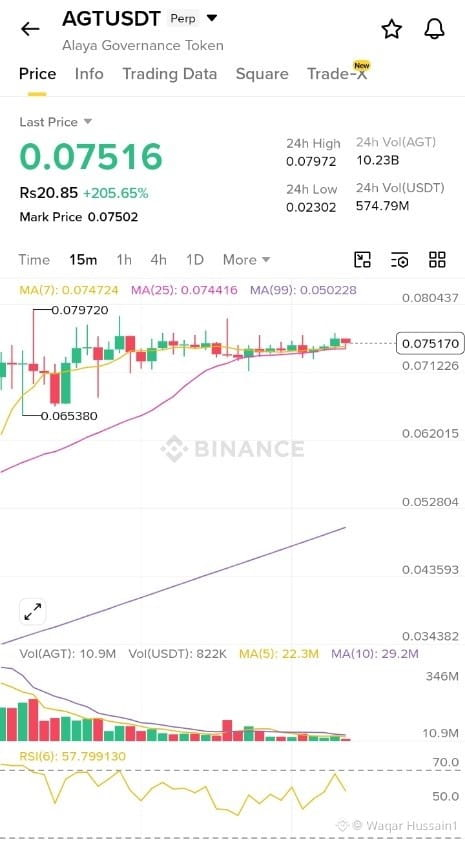
$AGT Open Interest has surged **800.3%**, jumping from **$7.3M to $66M**! 💥
This could mean increased market activity and major volatility ahead. The next move will be interesting! 🚀
Stay alert and DYOR! 💎
#AGT #CryptoTrading #OpenInterest
🚨 **$AGT — OPEN INTEREST EXPLODES!** 🔥
Something big is happening! 👀
$AGT Open Interest has surged **800.3%**, jumping from **$7.3M to $66M**! 💥
This could mean increased market activity and major volatility ahead. The next move will be interesting! 🚀
Stay alert and DYOR! 💎
#AGT #CryptoTrading #OpenInterest
Something big is happening! 👀
$AGT Open Interest has surged **800.3%**, jumping from **$7.3M to $66M**! 💥
This could mean increased market activity and major volatility ahead. The next move will be interesting! 🚀
Stay alert and DYOR! 💎
#AGT #CryptoTrading #OpenInterest
1
30
·
--
Bullish
$BTC
{future}(BTCUSDT)
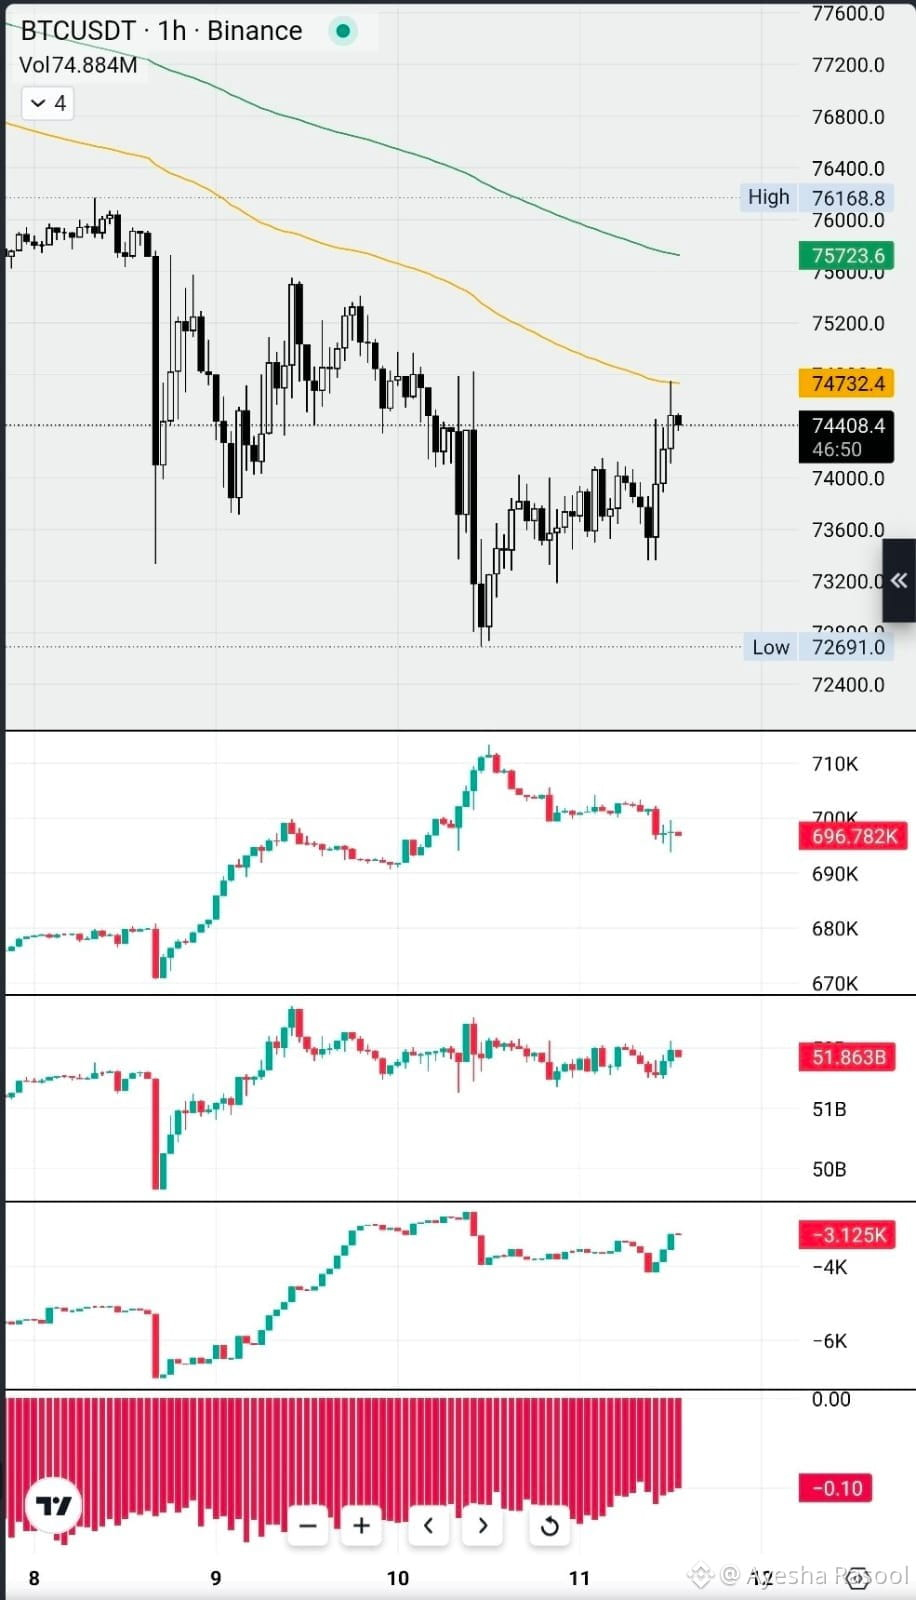
BTC short open interest keeps climbing.
More and more traders are betting against Bitcoin. Will market makers hunt these shorts next?
Soon...?
#BTC #Bitcoin #ShortSqueeze #OpenInterest
$BTC
BTC short open interest keeps climbing.
More and more traders are betting against Bitcoin. Will market makers hunt these shorts next?
Soon...?
#BTC #Bitcoin #ShortSqueeze #OpenInterest
BTC short open interest keeps climbing.
More and more traders are betting against Bitcoin. Will market makers hunt these shorts next?
Soon...?
#BTC #Bitcoin #ShortSqueeze #OpenInterest
1
50

Hyperliquid Surpasses Bybit, Kraken, and OKX in Open InterestOpen interest on Hyperliquid reached $18.1 billion on September 22, its all-time high, before ending the period at $16.8 billion. 📈 $HYPE
Open interest simply refers to the value of contracts that have not yet been settled. It was expected that major centralized exchanges such as Bybit, Kraken, and OKX would remain at the top—they’re the names most new traders know.
Hyperliquid Surpasses Bybit, Kraken, and OKX in Open Interest
Open interest on Hyperliquid reached $18.1 billion on September 22, its all-time high, before ending the period at $16.8 billion. 📈 $HYPE
Open interest simply refers to the value of contracts that have not yet been settled. It was expected that major centralized exchanges such as Bybit, Kraken, and OKX would remain at the top—they’re the names most new traders know.
Open interest simply refers to the value of contracts that have not yet been settled. It was expected that major centralized exchanges such as Bybit, Kraken, and OKX would remain at the top—they’re the names most new traders know.
399
OI and price are both falling: What might be happening?
According to CoinGlass data around November 13, 2026, SHELL Futures Open Interest stood at approximately $3.69 million, down about 7.29% over 24 hours.
OI represents the value of outstanding derivative contracts. When both price and OI fall, one possible interpretation is that existing positions are being closed.
In this context, the closing of some Long positions could help explain the market movement. However, OI does not indicate whether individual positions are Long or Short, so we cannot conclude that the entire decline was due to Long positions being closed.
It is worth watching whether OI continues to fall or stabilizes, and how price and trading volume respond.
#SHELL #OpenInterest #FuturesTrading
OI and price are both falling: What might be happening?
According to CoinGlass data around November 13, 2026, SHELL Futures Open Interest stood at approximately $3.69 million, down about 7.29% over 24 hours.
OI represents the value of outstanding derivative contracts. When both price and OI fall, one possible interpretation is that existing positions are being closed.
In this context, the closing of some Long positions could help explain the market movement. However, OI does not indicate whether individual positions are Long or Short, so we cannot conclude that the entire decline was due to Long positions being closed.
It is worth watching whether OI continues to fall or stabilizes, and how price and trading volume respond.
#SHELL #OpenInterest #FuturesTrading
According to CoinGlass data around November 13, 2026, SHELL Futures Open Interest stood at approximately $3.69 million, down about 7.29% over 24 hours.
OI represents the value of outstanding derivative contracts. When both price and OI fall, one possible interpretation is that existing positions are being closed.
In this context, the closing of some Long positions could help explain the market movement. However, OI does not indicate whether individual positions are Long or Short, so we cannot conclude that the entire decline was due to Long positions being closed.
It is worth watching whether OI continues to fall or stabilizes, and how price and trading volume respond.
#SHELL #OpenInterest #FuturesTrading
8
Recent CoinGlass readings placed SHELL open interest around $4.2 million, with funding near 0.01%. Open interest reflects outstanding futures positions, not confirmed buying demand. A relatively high OI compared with spot market capitalization can make price movements more sensitive when liquidity is limited. Still, OI alone cannot identify the next market direction.
#OpenInterest #FuturesTrading #SHELL
Recent CoinGlass readings placed SHELL open interest around $4.2 million, with funding near 0.01%. Open interest reflects outstanding futures positions, not confirmed buying demand. A relatively high OI compared with spot market capitalization can make price movements more sensitive when liquidity is limited. Still, OI alone cannot identify the next market direction.
#OpenInterest #FuturesTrading #SHELL
#OpenInterest #FuturesTrading #SHELL
54
A slight decline in OI while funding remains positive is not a contradictory signal. The two indicators measure different things: OI reflects the value of outstanding contracts, while funding represents the fee paid between Long and Short positions in the perpetual market. For $SHELL, funding of around 0.005–0.01% is slightly positive, according to aggregated data. There is not enough evidence to conclude that Long positions are overcrowded.
#FundingRate #OpenInterest #CryptoDerivatives
A slight decline in OI while funding remains positive is not a contradictory signal. The two indicators measure different things: OI reflects the value of outstanding contracts, while funding represents the fee paid between Long and Short positions in the perpetual market. For $SHELL , funding of around 0.005–0.01% is slightly positive, according to aggregated data. There is not enough evidence to conclude that Long positions are overcrowded.
#FundingRate #OpenInterest #CryptoDerivatives
#FundingRate #OpenInterest #CryptoDerivatives
68
Open Interest and Funding: A Positioning Snapshot
Third-party derivatives data placed SHELL open interest near $4.24 million around 10 November.
Funding remained mildly positive, reportedly around 0.005–0.01% per funding interval.
Positive funding generally means longs pay shorts. Combined with relatively stable or slightly declining OI, these figures do not indicate extreme positioning by themselves.
They describe market exposure, not a guaranteed direction.
#OpenInterest #FundingRate #CryptoEducation
Open Interest and Funding: A Positioning Snapshot
Third-party derivatives data placed SHELL open interest near $4.24 million around 10 November.
Funding remained mildly positive, reportedly around 0.005–0.01% per funding interval.
Positive funding generally means longs pay shorts. Combined with relatively stable or slightly declining OI, these figures do not indicate extreme positioning by themselves.
They describe market exposure, not a guaranteed direction.
#OpenInterest #FundingRate #CryptoEducation
Third-party derivatives data placed SHELL open interest near $4.24 million around 10 November.
Funding remained mildly positive, reportedly around 0.005–0.01% per funding interval.
Positive funding generally means longs pay shorts. Combined with relatively stable or slightly declining OI, these figures do not indicate extreme positioning by themselves.
They describe market exposure, not a guaranteed direction.
#OpenInterest #FundingRate #CryptoEducation
3

·
--
🔥
{future}(ANKRUSDT)
$ANKR DOWN 4.07% — SHORTS BUILDING?
💰 $0.00377 📊 Futures OI: ~$1.34M, rising
🟢 Above $0.00395 = recovery watch 🔴 Below $0.00372 = breakdown risk
⚠️ Rising OI doesn't confirm short positions.
SQUEEZE or SELLOFF? 👇
#ankr #OpenInterest #dyor
🔥
$ANKR DOWN 4.07% — SHORTS BUILDING?
💰 $0.00377 📊 Futures OI: ~$1.34M, rising
🟢 Above $0.00395 = recovery watch 🔴 Below $0.00372 = breakdown risk
⚠️ Rising OI doesn't confirm short positions.
SQUEEZE or SELLOFF? 👇
#ankr #OpenInterest #dyor
$ANKR DOWN 4.07% — SHORTS BUILDING?
💰 $0.00377 📊 Futures OI: ~$1.34M, rising
🟢 Above $0.00395 = recovery watch 🔴 Below $0.00372 = breakdown risk
⚠️ Rising OI doesn't confirm short positions.
SQUEEZE or SELLOFF? 👇
#ankr #OpenInterest #dyor
84
Log in to explore more content
Join global crypto users on Binance Square
⚡️ Get latest and useful information about crypto.
💬 Trusted by the world’s largest crypto exchange.
👍 Discover real insights from verified creators.
Email / Phone number
Trending Topics
1
#WhoWillSucceedJensenHuangatNvidia?
128,210 views
1,466 Discussing
2
#WhatWillDriveCryptoandStocks’NextRebound?
517,040 views
3,320 Discussing
3
#BitcoinActiveSupplyInProfitDropsBelow45%
54,054 views
598 Discussing
4
#KavaSaysAbnormalActivityLimitedToKavaLend
27,571 views
329 Discussing
5
#USSpotXRPETFsSeeLargestWeeklyOutflowIn8Months
21,112 views
284 Discussing
6
#USPPIMissMayEaseBTCPressure
260,097 views
2,183 Discussing
7
#WORPTLetsTouristsConvertCryptoToThaiBaht
7,565 views
79 Discussing
8
#TONStrategyReports$23.97MQ3NetLoss
8,017 views
41 Discussing
9
#PolkadotCommunityApprovesNewStrategyWith97%Vote
24,344 views
278 Discussing
10
#dYdXPlansV9.9UpgradeToShiftUSDCToInjective
19,805 views
231 Discussing