
#movingaverages
movingaverages
83,815 views
382 Discussing
Hot
Latest

📉 BTC MOVING AVERAGES: USE THEM AS CONTEXT, NOT CERTAINTY
Moving averages can help identify trend conditions and dynamic reaction zones.
In trending markets, BTC may react around major averages repeatedly. In choppy markets, those same indicators may produce mixed signals.
The stronger approach is confluence: • Moving averages
• Market structure
• Key horizontal zones
• Volume behavior
No single indicator should carry the entire decision.
#BTC #EMA #MovingAverages #BitcoinAnalysis $BTC
{future}(BTCUSDT)
📉 BTC MOVING AVERAGES: USE THEM AS CONTEXT, NOT CERTAINTY
Moving averages can help identify trend conditions and dynamic reaction zones.
In trending markets, BTC may react around major averages repeatedly. In choppy markets, those same indicators may produce mixed signals.
The stronger approach is confluence: • Moving averages
• Market structure
• Key horizontal zones
• Volume behavior
No single indicator should carry the entire decision.
#BTC #EMA #MovingAverages #BitcoinAnalysis $BTC
Moving averages can help identify trend conditions and dynamic reaction zones.
In trending markets, BTC may react around major averages repeatedly. In choppy markets, those same indicators may produce mixed signals.
The stronger approach is confluence: • Moving averages
• Market structure
• Key horizontal zones
• Volume behavior
No single indicator should carry the entire decision.
#BTC #EMA #MovingAverages #BitcoinAnalysis $BTC
6
BTC Moving Averages 📉 BTC MOVING AVERAGES: DYNAMIC LEVELS, NOT MAGIC LINES
Moving averages can help traders identify trend direction and potential areas of reaction.
During a strong uptrend, price may repeatedly respond around key averages. During a downtrend, the same averages can act as overhead pressure.
But no indicator works alone. Combine moving averages with: • Market structure
• Volume
• Key horizontal levels
• Volatility conditions
#BTC #MovingAverages #EMA #TechnicalAnalysis $BTC
{future}(BTCUSDT)
BTC Moving Averages 📉 BTC MOVING AVERAGES: DYNAMIC LEVELS, NOT MAGIC LINES
Moving averages can help traders identify trend direction and potential areas of reaction.
During a strong uptrend, price may repeatedly respond around key averages. During a downtrend, the same averages can act as overhead pressure.
But no indicator works alone. Combine moving averages with: • Market structure
• Volume
• Key horizontal levels
• Volatility conditions
#BTC #MovingAverages #EMA #TechnicalAnalysis $BTC
Moving averages can help traders identify trend direction and potential areas of reaction.
During a strong uptrend, price may repeatedly respond around key averages. During a downtrend, the same averages can act as overhead pressure.
But no indicator works alone. Combine moving averages with: • Market structure
• Volume
• Key horizontal levels
• Volatility conditions
#BTC #MovingAverages #EMA #TechnicalAnalysis $BTC
6
Moving Average Confluence
📊 $BTC MOVING AVERAGES: FINDING DYNAMIC SUPPORT!
Static lines are good, but dynamic moving averages (like the 50 or 200 EMA) often act as magnets during trending markets. When price respects these indicators cleanly, it signals strong institutional participation.
#TechnicalAnalysis #BTC #MovingAverages #CryptoEducation $BTC
{future}(BTCUSDT)
Moving Average Confluence
📊 $BTC MOVING AVERAGES: FINDING DYNAMIC SUPPORT!
Static lines are good, but dynamic moving averages (like the 50 or 200 EMA) often act as magnets during trending markets. When price respects these indicators cleanly, it signals strong institutional participation.
#TechnicalAnalysis #BTC #MovingAverages #CryptoEducation $BTC
📊 $BTC MOVING AVERAGES: FINDING DYNAMIC SUPPORT!
Static lines are good, but dynamic moving averages (like the 50 or 200 EMA) often act as magnets during trending markets. When price respects these indicators cleanly, it signals strong institutional participation.
#TechnicalAnalysis #BTC #MovingAverages #CryptoEducation $BTC
6

SHELL has been trading below several major moving averages in recent technical readings, while Bollinger Bands also reflect a weak broader structure. Moving averages summarize past prices and can help identify trend direction. Bollinger Bands measure price dispersion around a moving average. Both are lagging indicators, so neither should be treated as a standalone prediction tool.
#MovingAverages #BollingerBands #SHELL
SHELL has been trading below several major moving averages in recent technical readings, while Bollinger Bands also reflect a weak broader structure. Moving averages summarize past prices and can help identify trend direction. Bollinger Bands measure price dispersion around a moving average. Both are lagging indicators, so neither should be treated as a standalone prediction tool.
#MovingAverages #BollingerBands #SHELL
#MovingAverages #BollingerBands #SHELL
6
EMA: Why Price Below Moving Averages Matters
Exponential Moving Averages give more weight to recent prices than simple moving averages.
When price trades below key EMAs, it is commonly interpreted as a sign of short-term weakness.
The 10 November technical report described SHELL as trading below several moving averages. This supports a cautious trend assessment, although EMAs are lagging indicators and cannot predict the next move.
#EMA #MovingAverages #SHELL
EMA: Why Price Below Moving Averages Matters
Exponential Moving Averages give more weight to recent prices than simple moving averages.
When price trades below key EMAs, it is commonly interpreted as a sign of short-term weakness.
The 10 November technical report described SHELL as trading below several moving averages. This supports a cautious trend assessment, although EMAs are lagging indicators and cannot predict the next move.
#EMA #MovingAverages #SHELL
Exponential Moving Averages give more weight to recent prices than simple moving averages.
When price trades below key EMAs, it is commonly interpreted as a sign of short-term weakness.
The 10 November technical report described SHELL as trading below several moving averages. This supports a cautious trend assessment, although EMAs are lagging indicators and cannot predict the next move.
#EMA #MovingAverages #SHELL
1

·
--
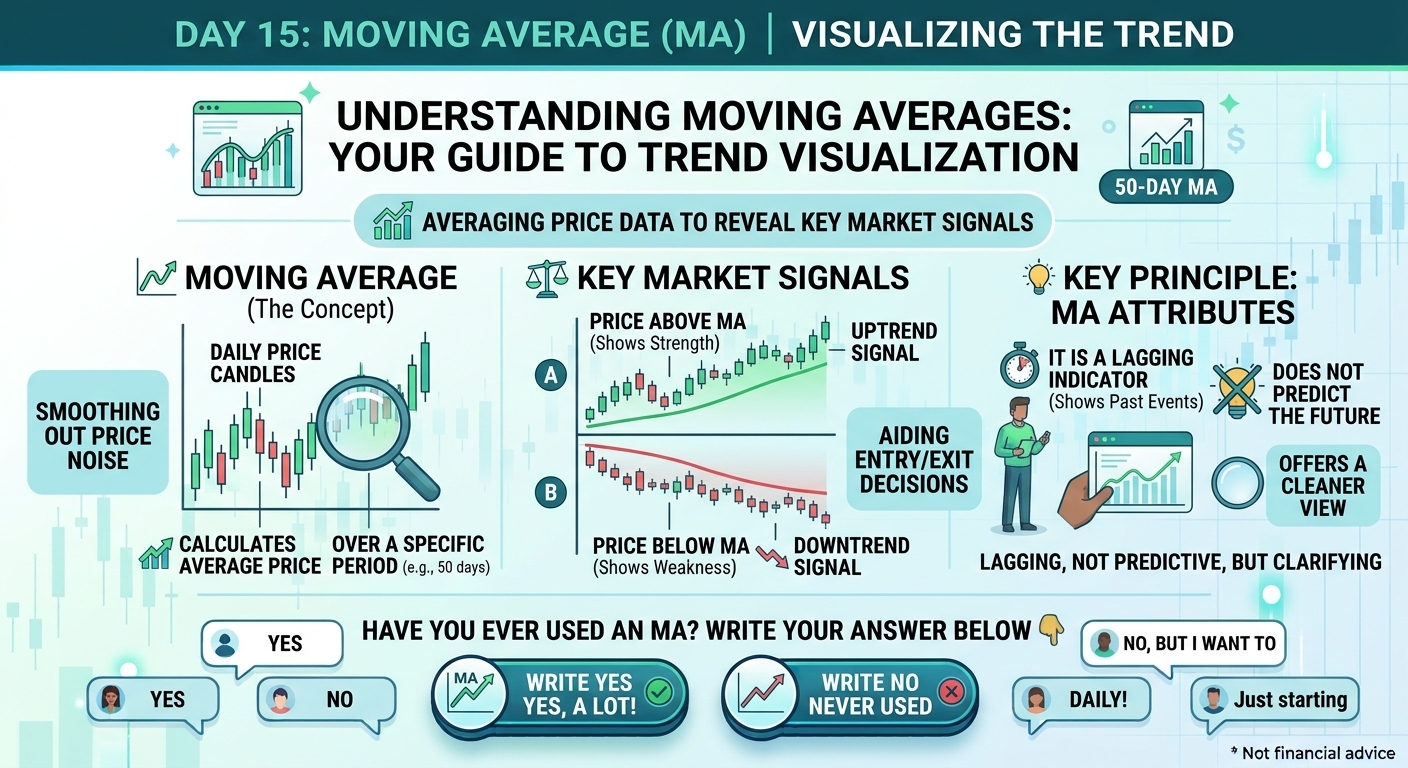
📌 Day 15: Moving Average (MA)
This one line helps you understand the trend easily. 📈
Moving Average: the average price over a certain period (for example, 50 days), drawn as a smooth line.
• Price above the MA: usually shows strength
• Price below the MA: usually shows weakness
It doesn't predict. It shows what has already happened.
Have you ever used an MA? Yes or No? 👇
#MovingAverages #DanATWO #trading
Not financial advice.
📌 Day 15: Moving Average (MA)
This one line helps you understand the trend easily. 📈
Moving Average: the average price over a certain period (for example, 50 days), drawn as a smooth line.
• Price above the MA: usually shows strength
• Price below the MA: usually shows weakness
It doesn't predict. It shows what has already happened.
Have you ever used an MA? Yes or No? 👇
#MovingAverages #DanATWO #trading
Not financial advice.
This one line helps you understand the trend easily. 📈
Moving Average: the average price over a certain period (for example, 50 days), drawn as a smooth line.
• Price above the MA: usually shows strength
• Price below the MA: usually shows weakness
It doesn't predict. It shows what has already happened.
Have you ever used an MA? Yes or No? 👇
#MovingAverages #DanATWO #trading
Not financial advice.
1
69
·
--
Article
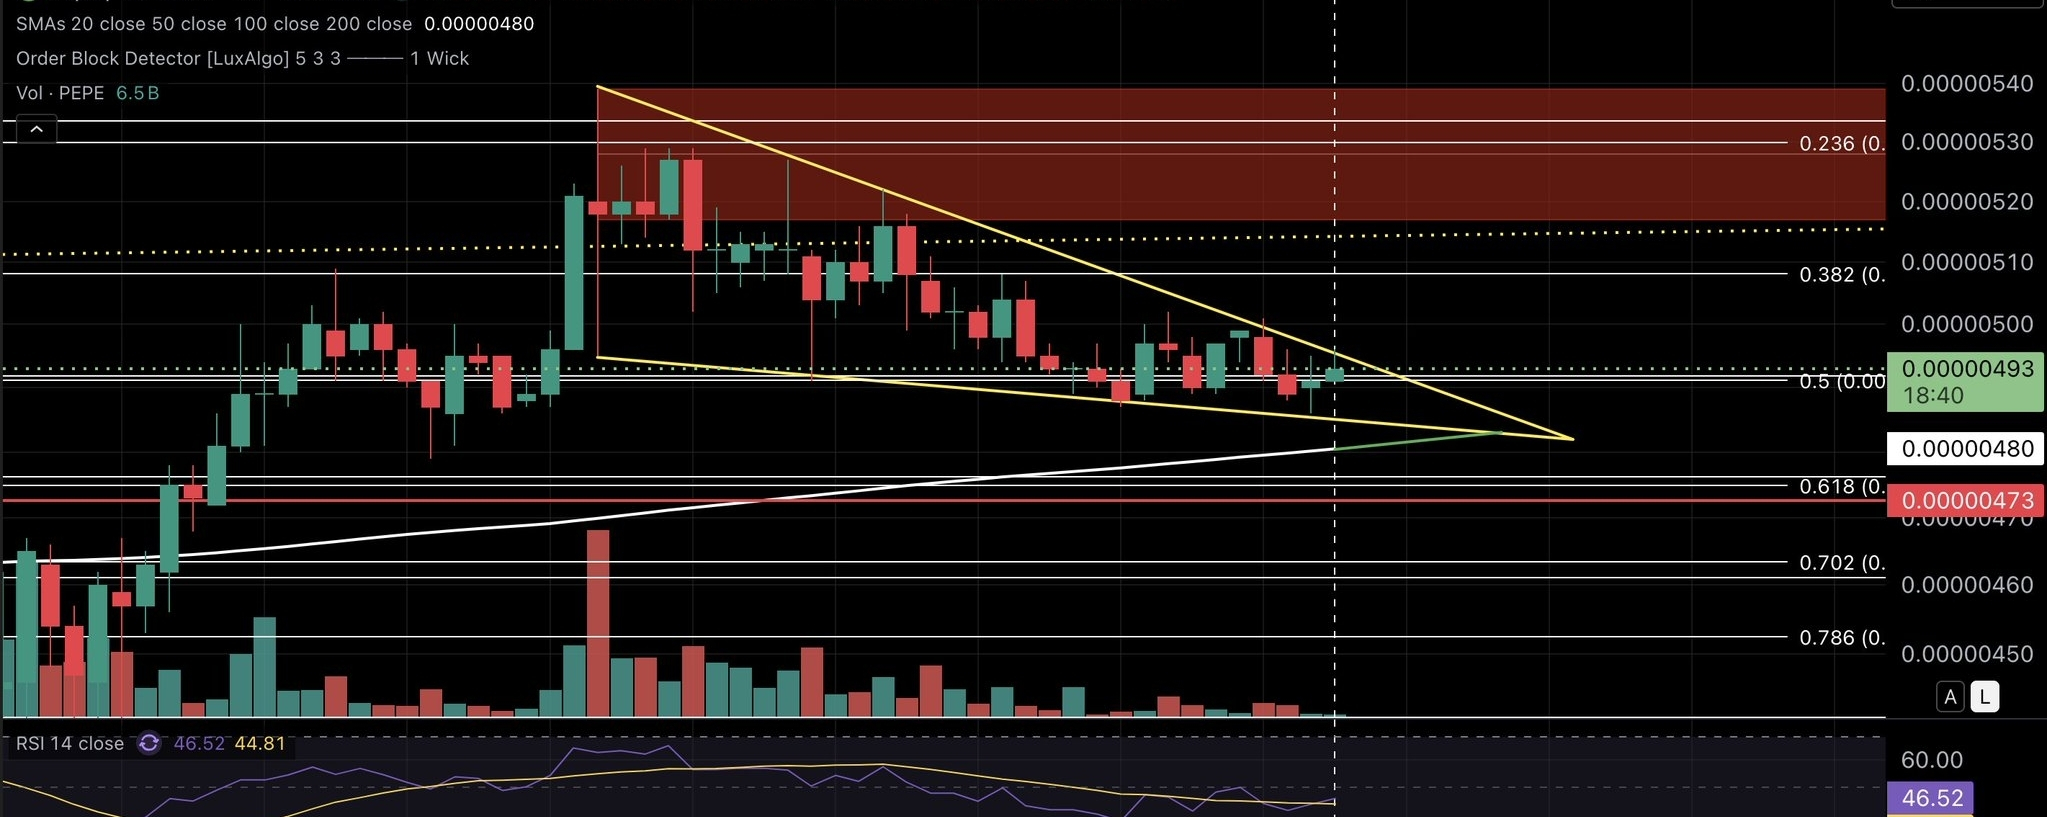
$PEPE is forming a very clean falling wedge on the 30M chart.What makes this setup especially interesting to me is the potential confluence developing near the end of the structure.
I extended the 200 SMA forward to see where it may intersect the wedge, and if price continues compressing, we could end up with the lower wedge rail + rising 200 SMA + nearby Fib support all meeting in roughly the same area.
That would be a very logical place for a reversal attempt.
The ideal scenario for me would be:
- Price works lower into the wedge.
- Touches or slightly sweeps the lower rail/200 SMA.
- Holds support.
Then breaks the upper wedge rail with acceptance.
That would give me both location and confirmation.
The RSI is still fairly neutral, so there’s room for price to continue using more of the wedge before making a decision. $PEPE
Of course, price does not have to touch the 200 SMA. It could front-run it and break out sooner.
{spot}(PEPEUSDT)
But if the 200 SMA and lower rail converge near the apex, that would create a very clean technical setup
#MovingAverages #Fibonacci #Marketstructure #PEPE #tradingview
$PEPE is forming a very clean falling wedge on the 30M chart.
What makes this setup especially interesting to me is the potential confluence developing near the end of the structure.
I extended the 200 SMA forward to see where it may intersect the wedge, and if price continues compressing, we could end up with the lower wedge rail + rising 200 SMA + nearby Fib support all meeting in roughly the same area.
That would be a very logical place for a reversal attempt.
The ideal scenario for me would be:
- Price works lower into the wedge.
- Touches or slightly sweeps the lower rail/200 SMA.
- Holds support.
Then breaks the upper wedge rail with acceptance.
That would give me both location and confirmation.
The RSI is still fairly neutral, so there’s room for price to continue using more of the wedge before making a decision. $PEPE
Of course, price does not have to touch the 200 SMA. It could front-run it and break out sooner.
But if the 200 SMA and lower rail converge near the apex, that would create a very clean technical setup
#MovingAverages #Fibonacci #Marketstructure #PEPE #tradingview
I extended the 200 SMA forward to see where it may intersect the wedge, and if price continues compressing, we could end up with the lower wedge rail + rising 200 SMA + nearby Fib support all meeting in roughly the same area.
That would be a very logical place for a reversal attempt.
The ideal scenario for me would be:
- Price works lower into the wedge.
- Touches or slightly sweeps the lower rail/200 SMA.
- Holds support.
Then breaks the upper wedge rail with acceptance.
That would give me both location and confirmation.
The RSI is still fairly neutral, so there’s room for price to continue using more of the wedge before making a decision. $PEPE
Of course, price does not have to touch the 200 SMA. It could front-run it and break out sooner.
But if the 200 SMA and lower rail converge near the apex, that would create a very clean technical setup
#MovingAverages #Fibonacci #Marketstructure #PEPE #tradingview
3
1k

·
--
#BitcoinDropsBelow$80K #PARTI
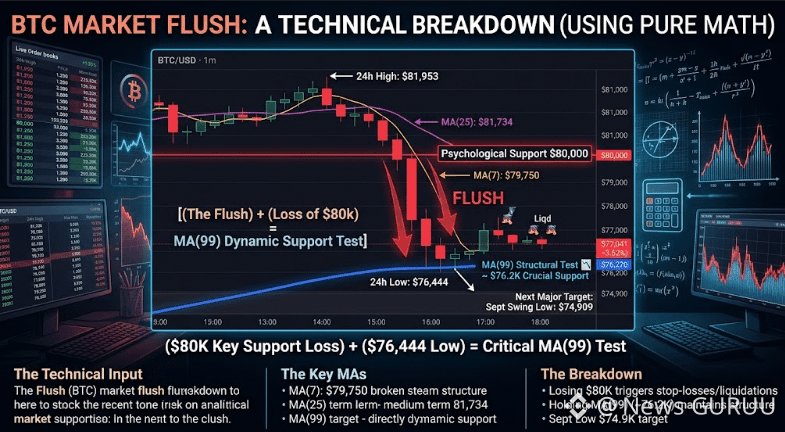
🚨 BTC — SHARP DROP! MA(99) SUPPORT UNDER PRESSURE!
Bitcoin lost the key $80K level, dropping to $76,444 before recovering near $77,041. 📉
📊 Key Levels to Watch:
MA(7): $79,750
MA(25): $81,734
MA(99) Support: $76,270
Major Support: $74,909
⚠️ Holding $76.2K could protect the current market structure, while a breakdown may open the door toward $74.9K.
👀 Is this a buying opportunity or another leg down?."CLICK ON THE BELOW YELLOW COIN TAG TO GO TO DESIRED TRADING PAGE TO GET BENEFIT TRADE"$BTC $PARTI $HYPE
{spot}(HYPEUSDT)
{spot}(PARTIUSDT)
{spot}(BTCUSDT)
#BTC #MovingAverages
#BitcoinDropsBelow$80K #PARTI
🚨 BTC — SHARP DROP! MA(99) SUPPORT UNDER PRESSURE!
Bitcoin lost the key $80K level, dropping to $76,444 before recovering near $77,041. 📉
📊 Key Levels to Watch:
MA(7): $79,750
MA(25): $81,734
MA(99) Support: $76,270
Major Support: $74,909
⚠️ Holding $76.2K could protect the current market structure, while a breakdown may open the door toward $74.9K.
👀 Is this a buying opportunity or another leg down?."CLICK ON THE BELOW YELLOW COIN TAG TO GO TO DESIRED TRADING PAGE TO GET BENEFIT TRADE"$BTC $PARTI $HYPE
#BTC #MovingAverages
🚨 BTC — SHARP DROP! MA(99) SUPPORT UNDER PRESSURE!
Bitcoin lost the key $80K level, dropping to $76,444 before recovering near $77,041. 📉
📊 Key Levels to Watch:
MA(7): $79,750
MA(25): $81,734
MA(99) Support: $76,270
Major Support: $74,909
⚠️ Holding $76.2K could protect the current market structure, while a breakdown may open the door toward $74.9K.
👀 Is this a buying opportunity or another leg down?."CLICK ON THE BELOW YELLOW COIN TAG TO GO TO DESIRED TRADING PAGE TO GET BENEFIT TRADE"$BTC $PARTI $HYPE
#BTC #MovingAverages
1
2
88

·
--
DOGE rebound hinges on moving averages
Dogecoin Traders Watch Moving Averages As DOGE Tries To Build A Cleaner Rebound
Traders are closely watching key moving averages as Dogecoin attempts to build momentum from a recent support hold. A successful rebound could lead to a trend reversal, while failure may result in another false start. The moving averages will be crucial in determining the direction of the cryptocurrency.
$DOGE
#Crypto #Dogecoin #MovingAverages #Rebound
DOGE rebound hinges on moving averages
Dogecoin Traders Watch Moving Averages As DOGE Tries To Build A Cleaner Rebound
Traders are closely watching key moving averages as Dogecoin attempts to build momentum from a recent support hold. A successful rebound could lead to a trend reversal, while failure may result in another false start. The moving averages will be crucial in determining the direction of the cryptocurrency.
$DOGE
#Crypto #Dogecoin #MovingAverages #Rebound
Dogecoin Traders Watch Moving Averages As DOGE Tries To Build A Cleaner Rebound
Traders are closely watching key moving averages as Dogecoin attempts to build momentum from a recent support hold. A successful rebound could lead to a trend reversal, while failure may result in another false start. The moving averages will be crucial in determining the direction of the cryptocurrency.
$DOGE
#Crypto #Dogecoin #MovingAverages #Rebound
56

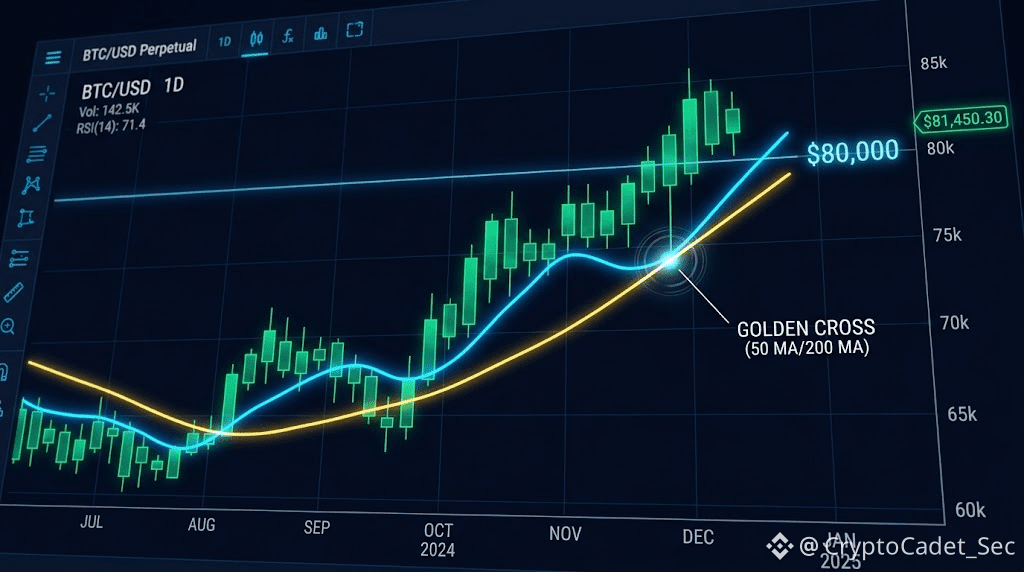
🚀 THE GOLDEN CROSS FLIPS THE SWITCH: IS THE SUPERCYCLE CONFIRMED? 📈✨
When trading macro volatility, watching the headline isn't enough—you have to watch the structural trend lines. Right now, a historic technical phenomenon is unfolding across the charts as $BTC consolidates firmly above the $80,000 zone.
🎯 The Ultimate Trend Indicator:
The 50-day Moving Average (MA) has aggressively crossed above the 200-day Moving Average on the daily chart, printing a textbook "Golden Cross." This is the ultimate institutional signal confirming a long-term macro trend reversal from bearish consolidation to structural expansion.
💡 How Professional Traders Play the MA:
• Dynamic Support: During a parabolic run, the 20-period Exponential Moving Average (EMA) acts as a moving floor. Smart capital treats retests of the 20 EMA as high-probability buy-the-dip zones.
• Invalidation Watch: A clean daily close below the 50 MA weakens the immediate bullish momentum, signaling a transition into a broader sideways range.
With $BNB and major altcoins mimicking this structural alignment, the moving averages suggest the path of least resistance remains heavily skewed to the upside. Don't fight the trend lines—trade the confluence.
#CryptoTrading #MovingAverages #TechnicalAnalysis #GoldenCross #Bitcoin #BNB #TradingStrategy #CryptoNews
🚀 THE GOLDEN CROSS FLIPS THE SWITCH: IS THE SUPERCYCLE CONFIRMED? 📈✨
When trading macro volatility, watching the headline isn't enough—you have to watch the structural trend lines. Right now, a historic technical phenomenon is unfolding across the charts as $BTC consolidates firmly above the $80,000 zone.
🎯 The Ultimate Trend Indicator:
The 50-day Moving Average (MA) has aggressively crossed above the 200-day Moving Average on the daily chart, printing a textbook "Golden Cross." This is the ultimate institutional signal confirming a long-term macro trend reversal from bearish consolidation to structural expansion.
💡 How Professional Traders Play the MA:
• Dynamic Support: During a parabolic run, the 20-period Exponential Moving Average (EMA) acts as a moving floor. Smart capital treats retests of the 20 EMA as high-probability buy-the-dip zones.
• Invalidation Watch: A clean daily close below the 50 MA weakens the immediate bullish momentum, signaling a transition into a broader sideways range.
With $BNB and major altcoins mimicking this structural alignment, the moving averages suggest the path of least resistance remains heavily skewed to the upside. Don't fight the trend lines—trade the confluence.
#CryptoTrading #MovingAverages #TechnicalAnalysis #GoldenCross #Bitcoin #BNB #TradingStrategy #CryptoNews
When trading macro volatility, watching the headline isn't enough—you have to watch the structural trend lines. Right now, a historic technical phenomenon is unfolding across the charts as $BTC consolidates firmly above the $80,000 zone.
🎯 The Ultimate Trend Indicator:
The 50-day Moving Average (MA) has aggressively crossed above the 200-day Moving Average on the daily chart, printing a textbook "Golden Cross." This is the ultimate institutional signal confirming a long-term macro trend reversal from bearish consolidation to structural expansion.
💡 How Professional Traders Play the MA:
• Dynamic Support: During a parabolic run, the 20-period Exponential Moving Average (EMA) acts as a moving floor. Smart capital treats retests of the 20 EMA as high-probability buy-the-dip zones.
• Invalidation Watch: A clean daily close below the 50 MA weakens the immediate bullish momentum, signaling a transition into a broader sideways range.
With $BNB and major altcoins mimicking this structural alignment, the moving averages suggest the path of least resistance remains heavily skewed to the upside. Don't fight the trend lines—trade the confluence.
#CryptoTrading #MovingAverages #TechnicalAnalysis #GoldenCross #Bitcoin #BNB #TradingStrategy #CryptoNews
78

·
--
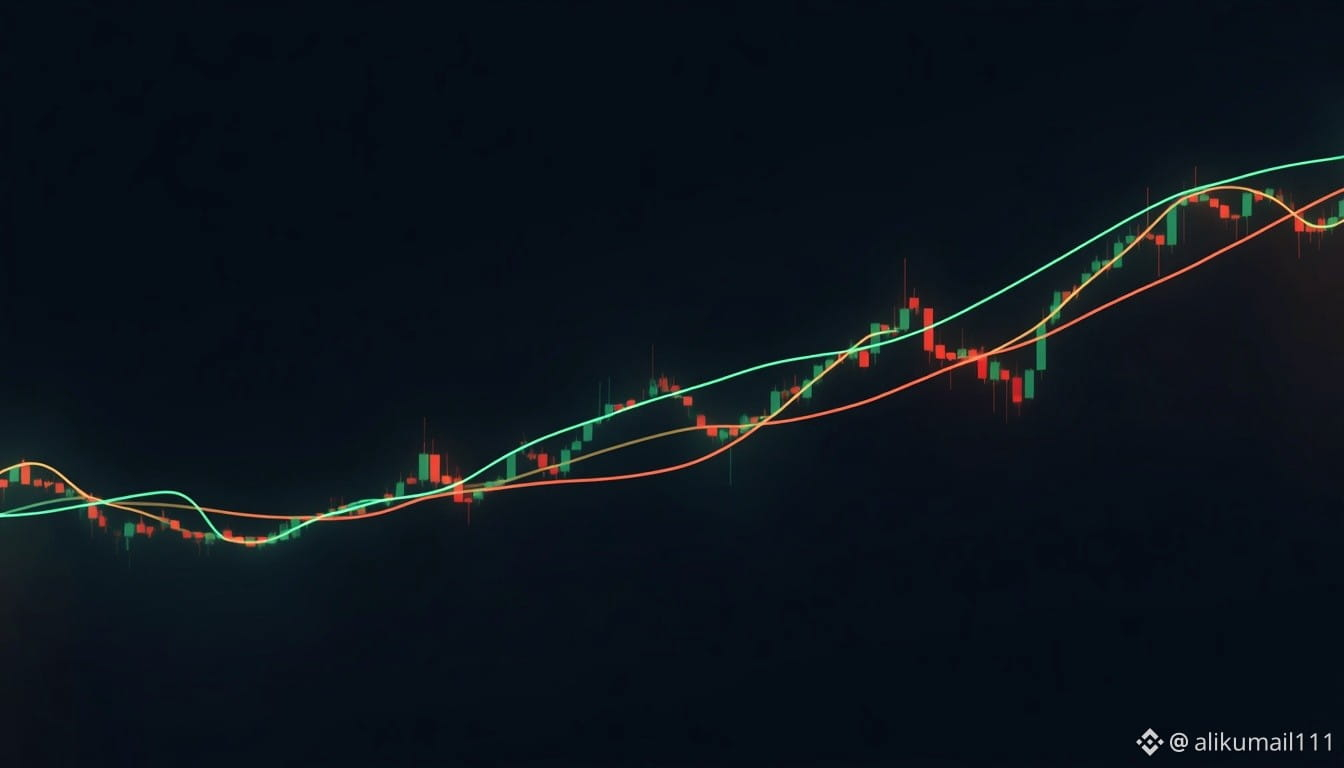
📚 Trading Tip of the Day
$BTC
{future}(BTCUSDT)
— What Are Moving Averages (EMA)?
You saw me mention "20-day EMA," "50-day EMA," and "200-day EMA" in the ETH analysis. Here's what these actually mean and why traders watch them.
🔍 What is a Moving Average?
A line that smooths out price data by calculating the average price over a specific period (20 days, 50 days, etc.), updating as new data comes in. It filters out day-to-day noise to show the underlying trend more clearly.
📊 EMA vs. SMA (quick note):
EMA (Exponential Moving Average) weights recent prices more heavily than older ones, making it react faster to new price action compared to a Simple Moving Average (SMA). This is why EMA is often preferred for shorter-term trading decisions.
🔑 Why different timeframes matter:
🟢 Short-term EMAs (20-day) = react quickly, show near-term trend
🟡 Medium-term EMAs (50-day) = smooth out noise, show intermediate trend
🔴 Long-term EMAs (200-day) = show the big-picture, major trend
🔍 Key concept — Support/Resistance flip:
When price is trading ABOVE a moving average, that average often acts as support (like ETH's current setup). When price is BELOW it, the same average often acts as resistance. This is why "reclaiming" an EMA is often seen as bullish — it's flipping from resistance to support.
❌ Common mistake beginners make:
Treating a single EMA cross as a guaranteed buy/sell signal. In choppy markets, price can whipsaw across an EMA repeatedly without a real trend forming.
📌 Golden rule: Look at multiple EMAs together (20/50/200-day) to understand short, medium, and long-term trend alignment — not just one line in isolation.
⚠️ This is educational content, not financial advice.
#CryptoEducation #TradingTips #MovingAverages #BinanceSquare
📚 Trading Tip of the Day
$BTC
— What Are Moving Averages (EMA)?
You saw me mention "20-day EMA," "50-day EMA," and "200-day EMA" in the ETH analysis. Here's what these actually mean and why traders watch them.
🔍 What is a Moving Average?
A line that smooths out price data by calculating the average price over a specific period (20 days, 50 days, etc.), updating as new data comes in. It filters out day-to-day noise to show the underlying trend more clearly.
📊 EMA vs. SMA (quick note):
EMA (Exponential Moving Average) weights recent prices more heavily than older ones, making it react faster to new price action compared to a Simple Moving Average (SMA). This is why EMA is often preferred for shorter-term trading decisions.
🔑 Why different timeframes matter:
🟢 Short-term EMAs (20-day) = react quickly, show near-term trend
🟡 Medium-term EMAs (50-day) = smooth out noise, show intermediate trend
🔴 Long-term EMAs (200-day) = show the big-picture, major trend
🔍 Key concept — Support/Resistance flip:
When price is trading ABOVE a moving average, that average often acts as support (like ETH's current setup). When price is BELOW it, the same average often acts as resistance. This is why "reclaiming" an EMA is often seen as bullish — it's flipping from resistance to support.
❌ Common mistake beginners make:
Treating a single EMA cross as a guaranteed buy/sell signal. In choppy markets, price can whipsaw across an EMA repeatedly without a real trend forming.
📌 Golden rule: Look at multiple EMAs together (20/50/200-day) to understand short, medium, and long-term trend alignment — not just one line in isolation.
⚠️ This is educational content, not financial advice.
#CryptoEducation #TradingTips #MovingAverages #BinanceSquare
$BTC
— What Are Moving Averages (EMA)?
You saw me mention "20-day EMA," "50-day EMA," and "200-day EMA" in the ETH analysis. Here's what these actually mean and why traders watch them.
🔍 What is a Moving Average?
A line that smooths out price data by calculating the average price over a specific period (20 days, 50 days, etc.), updating as new data comes in. It filters out day-to-day noise to show the underlying trend more clearly.
📊 EMA vs. SMA (quick note):
EMA (Exponential Moving Average) weights recent prices more heavily than older ones, making it react faster to new price action compared to a Simple Moving Average (SMA). This is why EMA is often preferred for shorter-term trading decisions.
🔑 Why different timeframes matter:
🟢 Short-term EMAs (20-day) = react quickly, show near-term trend
🟡 Medium-term EMAs (50-day) = smooth out noise, show intermediate trend
🔴 Long-term EMAs (200-day) = show the big-picture, major trend
🔍 Key concept — Support/Resistance flip:
When price is trading ABOVE a moving average, that average often acts as support (like ETH's current setup). When price is BELOW it, the same average often acts as resistance. This is why "reclaiming" an EMA is often seen as bullish — it's flipping from resistance to support.
❌ Common mistake beginners make:
Treating a single EMA cross as a guaranteed buy/sell signal. In choppy markets, price can whipsaw across an EMA repeatedly without a real trend forming.
📌 Golden rule: Look at multiple EMAs together (20/50/200-day) to understand short, medium, and long-term trend alignment — not just one line in isolation.
⚠️ This is educational content, not financial advice.
#CryptoEducation #TradingTips #MovingAverages #BinanceSquare
63

·
--
Bullish
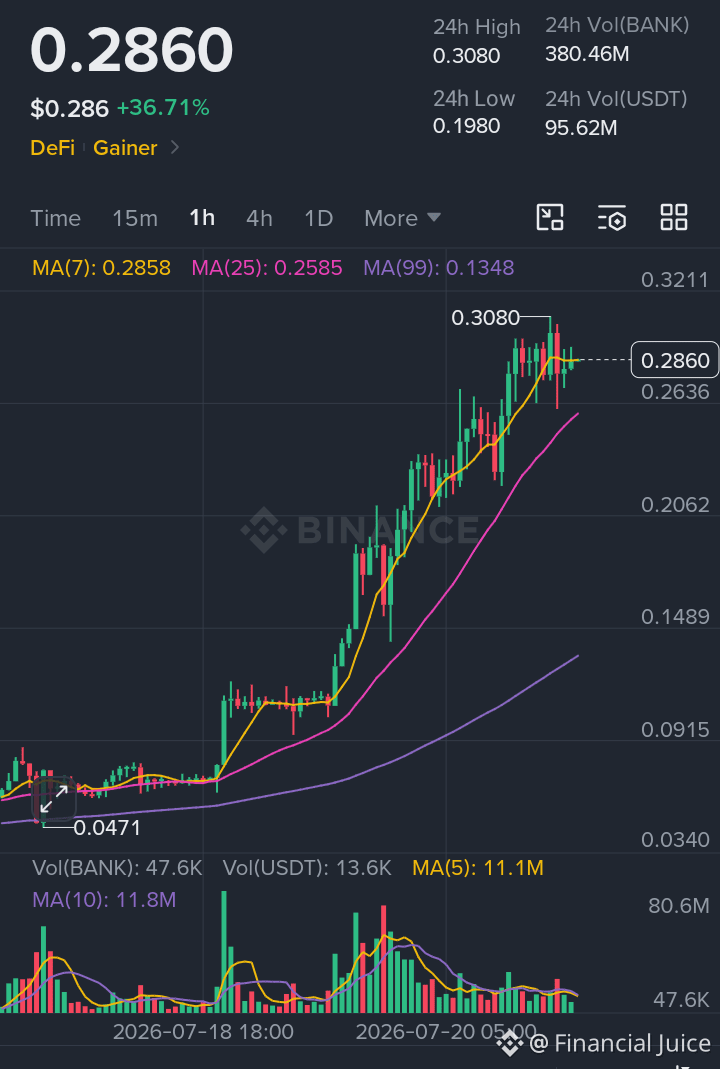
$BANK MA(7) at 0.2858 sitting just below spot price — short-term trend still intact. MA(25) at 0.2585 is the first support zone to watch on any pullback.
#BANK #MovingAverages #CryptoAnalysis #DeFi #BinanceSquare
{spot}(BANKUSDT)
$BANK MA(7) at 0.2858 sitting just below spot price — short-term trend still intact. MA(25) at 0.2585 is the first support zone to watch on any pullback.
#BANK #MovingAverages #CryptoAnalysis #DeFi #BinanceSquare
#BANK #MovingAverages #CryptoAnalysis #DeFi #BinanceSquare
1
114
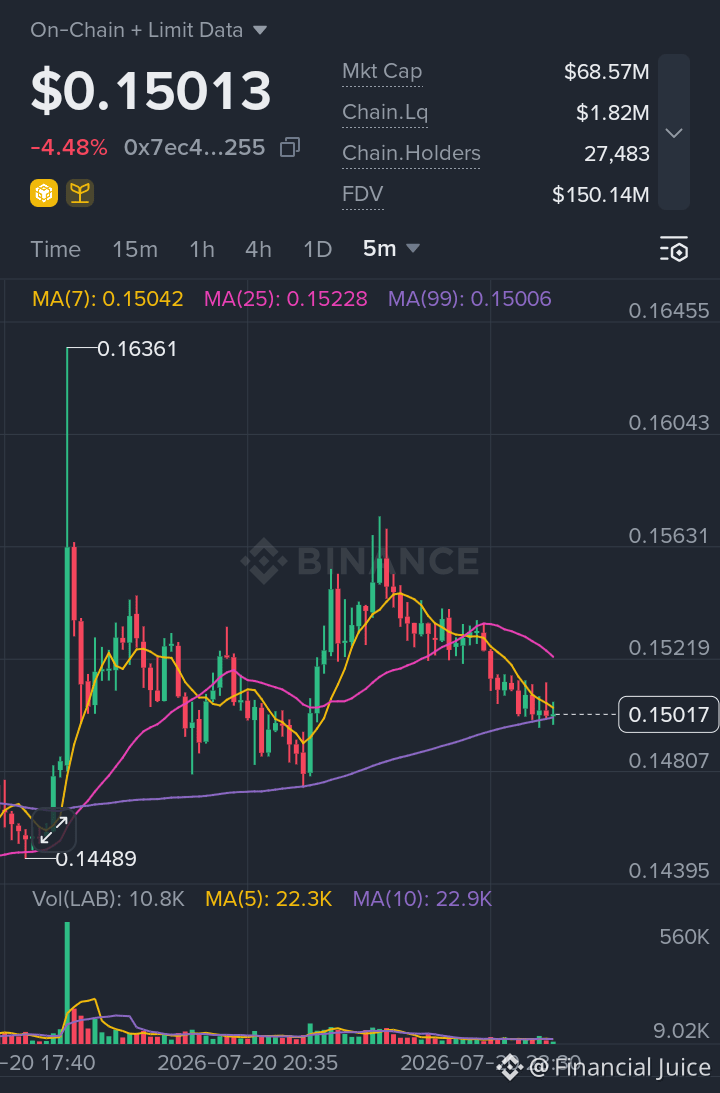
$LAB MA(7) $0.15042 has crossed below MA(25) $0.15228 — a short-term bearish crossover worth watching for continued downside.
#LAB #MovingAverages #CryptoSignals #TrendAnalysis #BinanceSquare
{future}(LABUSDT)
$LAB MA(7) $0.15042 has crossed below MA(25) $0.15228 — a short-term bearish crossover worth watching for continued downside.
#LAB #MovingAverages #CryptoSignals #TrendAnalysis #BinanceSquare
#LAB #MovingAverages #CryptoSignals #TrendAnalysis #BinanceSquare
1
67


The 200-Day Moving Average: Bitcoin is testing key long-term moving averages. Staying above the 200-day EMA keeps the structural bull market alive. Pullbacks to this line are traditionally prime buy-the-dip regions. #MovingAverages #TechnicalAnalysis
The 200-Day Moving Average: Bitcoin is testing key long-term moving averages. Staying above the 200-day EMA keeps the structural bull market alive. Pullbacks to this line are traditionally prime buy-the-dip regions. #MovingAverages #TechnicalAnalysis
61

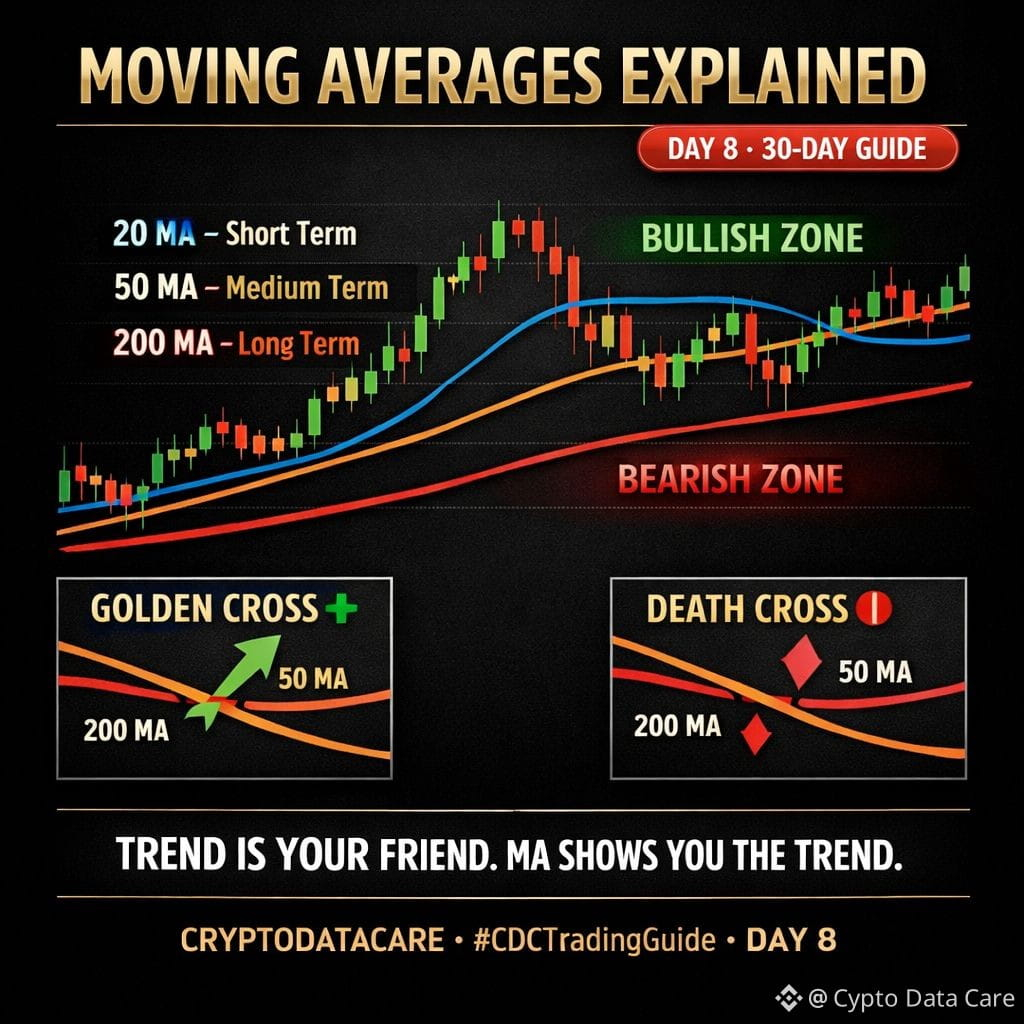
📚 30-DAY TRADING GUIDE | Day 8 of 30
#CDCTradingGuide
━━━━━━━━━━━━━━━
📈 MOVING AVERAGES — THE TREND FILTER
Most traders lose because they fight the trend.
Moving Averages stop you from doing that.
━━━━━━━━━━━━━━━
🧠 WHAT IS A MOVING AVERAGE?
A Moving Average (MA) smooths out price action
by averaging closing prices over X periods.
It removes the noise.
It shows you the actual trend direction.
Nothing more. Nothing less.
━━━━━━━━━━━━━━━
📊 THE 3 MAs EVERY TRADER MUST KNOW:
1️⃣ 20 MA — Short term trend
Price above it = short term bullish
Price below it = short term bearish
2️⃣ 50 MA — Medium term trend
The most watched level by traders globally
Break above = momentum shift confirmed
3️⃣ 200 MA — Long term trend
The big one. Institutions watch this.
Above 200 MA = bull market territory
Below 200 MA = bear market territory
━━━━━━━━━━━━━━━
🔑 2 GOLDEN SIGNALS:
📗 GOLDEN CROSS — 50 MA crosses ABOVE 200 MA
→ One of the strongest bull signals in trading
→ BTC Golden Cross in 2024 → price 5x'd after
📕 DEATH CROSS — 50 MA crosses BELOW 200 MA
→ Strong bear signal. Reduce exposure.
→ BTC Death Cross in 2022 → price dropped -60%
━━━━━━━━━━━━━━━
🔑 PRO TIP:
Never use MA alone. Use it to define trend.
Then use other indicators to time your entry.
MA = direction. Not a buy/sell signal by itself.
━━━━━━━━━━━━━━━
Tomorrow — Day 9:
RSI — How to Spot Overbought & Oversold 📊
🔔 Follow @CryptoDataCare — don't miss it!
💬 Which MA do you use most?
20 · 50 · 200 — comment below 👇
⚠️ Not financial advice. DYOR.
#CDCTradingGuide #Day8 #MovingAverages $
#TechnicalAnalysis $BTC $ETH $SOL
📚 30-DAY TRADING GUIDE | Day 8 of 30
#CDCTradingGuide
━━━━━━━━━━━━━━━
📈 MOVING AVERAGES — THE TREND FILTER
Most traders lose because they fight the trend.
Moving Averages stop you from doing that.
━━━━━━━━━━━━━━━
🧠 WHAT IS A MOVING AVERAGE?
A Moving Average (MA) smooths out price action
by averaging closing prices over X periods.
It removes the noise.
It shows you the actual trend direction.
Nothing more. Nothing less.
━━━━━━━━━━━━━━━
📊 THE 3 MAs EVERY TRADER MUST KNOW:
1️⃣ 20 MA — Short term trend
Price above it = short term bullish
Price below it = short term bearish
2️⃣ 50 MA — Medium term trend
The most watched level by traders globally
Break above = momentum shift confirmed
3️⃣ 200 MA — Long term trend
The big one. Institutions watch this.
Above 200 MA = bull market territory
Below 200 MA = bear market territory
━━━━━━━━━━━━━━━
🔑 2 GOLDEN SIGNALS:
📗 GOLDEN CROSS — 50 MA crosses ABOVE 200 MA
→ One of the strongest bull signals in trading
→ BTC Golden Cross in 2024 → price 5x'd after
📕 DEATH CROSS — 50 MA crosses BELOW 200 MA
→ Strong bear signal. Reduce exposure.
→ BTC Death Cross in 2022 → price dropped -60%
━━━━━━━━━━━━━━━
🔑 PRO TIP:
Never use MA alone. Use it to define trend.
Then use other indicators to time your entry.
MA = direction. Not a buy/sell signal by itself.
━━━━━━━━━━━━━━━
Tomorrow — Day 9:
RSI — How to Spot Overbought & Oversold 📊
🔔 Follow @CryptoDataCare — don't miss it!
💬 Which MA do you use most?
20 · 50 · 200 — comment below 👇
⚠️ Not financial advice. DYOR.
#CDCTradingGuide #Day8 #MovingAverages $
#TechnicalAnalysis $BTC $ETH $SOL
#CDCTradingGuide
━━━━━━━━━━━━━━━
📈 MOVING AVERAGES — THE TREND FILTER
Most traders lose because they fight the trend.
Moving Averages stop you from doing that.
━━━━━━━━━━━━━━━
🧠 WHAT IS A MOVING AVERAGE?
A Moving Average (MA) smooths out price action
by averaging closing prices over X periods.
It removes the noise.
It shows you the actual trend direction.
Nothing more. Nothing less.
━━━━━━━━━━━━━━━
📊 THE 3 MAs EVERY TRADER MUST KNOW:
1️⃣ 20 MA — Short term trend
Price above it = short term bullish
Price below it = short term bearish
2️⃣ 50 MA — Medium term trend
The most watched level by traders globally
Break above = momentum shift confirmed
3️⃣ 200 MA — Long term trend
The big one. Institutions watch this.
Above 200 MA = bull market territory
Below 200 MA = bear market territory
━━━━━━━━━━━━━━━
🔑 2 GOLDEN SIGNALS:
📗 GOLDEN CROSS — 50 MA crosses ABOVE 200 MA
→ One of the strongest bull signals in trading
→ BTC Golden Cross in 2024 → price 5x'd after
📕 DEATH CROSS — 50 MA crosses BELOW 200 MA
→ Strong bear signal. Reduce exposure.
→ BTC Death Cross in 2022 → price dropped -60%
━━━━━━━━━━━━━━━
🔑 PRO TIP:
Never use MA alone. Use it to define trend.
Then use other indicators to time your entry.
MA = direction. Not a buy/sell signal by itself.
━━━━━━━━━━━━━━━
Tomorrow — Day 9:
RSI — How to Spot Overbought & Oversold 📊
🔔 Follow @CryptoDataCare — don't miss it!
💬 Which MA do you use most?
20 · 50 · 200 — comment below 👇
⚠️ Not financial advice. DYOR.
#CDCTradingGuide #Day8 #MovingAverages $
#TechnicalAnalysis $BTC $ETH $SOL
1
146


Article
MA COMPRESSION STRATEGIESOne of the most powerful setups in trading often looks boring at first.
No massive candles.
No breakout headlines.
No excitement.
Just a group of Moving Averages slowly squeezing together.
This is called MA Compression.
And it's often the calm before a major move.
📊 What Is MA Compression?
MA Compression occurs when MA7, MA25, MA99, and sometimes even MA200 begin moving closer together.
The gap between them shrinks.
Price volatility decreases.
The market enters a state of balance where buyers and sellers are temporarily matched.
Many traders ignore this phase because nothing appears to be happening.
In reality, energy is building.
🔹️ Tight MA Alignment
Think of Moving Averages as trend indicators across different timeframes.
When they compress together, it tells us:
▫️ Momentum is slowing
▫️ Trend direction is undecided
▫️ Volatility is contracting
▫️ A larger move may be approaching
The tighter the compression, the more important the next breakout often becomes.
🚀 Volatility Expansion
Markets move in cycles.
Low volatility is usually followed by high volatility.
Once #BTC breaks away from compressed MAs, expansion often follows.
This is where traders suddenly see:
▫️ Large candles
▫️ Increased volume
▫️ Strong directional movement
▫️ Momentum acceleration
The move itself isn't random.
It's the release of pressure that was building during consolidation.
📈 Momentum Release
The best breakouts don't just move above an MA.
They separate from them.
When MA7 pulls sharply away from MA25 and both begin expanding above MA99, momentum is often entering the market aggressively.
This is where trend traders become interested.
🎯 Entry Confirmation
Professional traders don't enter simply because MAs are compressed.
They wait for confirmation:
▪️ Strong breakout candle
▪️ Volume expansion
▪️ RSI strength above key levels
▪️ Market structure break
▪️ Successful retest of the breakout zone
📌 MA Compression is not the trade.
It's the warning that a trade may be coming.
The smartest traders don't chase volatility.
They identify it before everyone else sees it.
#MovingAverages
MA COMPRESSION STRATEGIES
One of the most powerful setups in trading often looks boring at first.
No massive candles.
No breakout headlines.
No excitement.
Just a group of Moving Averages slowly squeezing together.
This is called MA Compression.
And it's often the calm before a major move.
📊 What Is MA Compression?
MA Compression occurs when MA7, MA25, MA99, and sometimes even MA200 begin moving closer together.
The gap between them shrinks.
Price volatility decreases.
The market enters a state of balance where buyers and sellers are temporarily matched.
Many traders ignore this phase because nothing appears to be happening.
In reality, energy is building.
🔹️ Tight MA Alignment
Think of Moving Averages as trend indicators across different timeframes.
When they compress together, it tells us:
▫️ Momentum is slowing
▫️ Trend direction is undecided
▫️ Volatility is contracting
▫️ A larger move may be approaching
The tighter the compression, the more important the next breakout often becomes.
🚀 Volatility Expansion
Markets move in cycles.
Low volatility is usually followed by high volatility.
Once #BTC breaks away from compressed MAs, expansion often follows.
This is where traders suddenly see:
▫️ Large candles
▫️ Increased volume
▫️ Strong directional movement
▫️ Momentum acceleration
The move itself isn't random.
It's the release of pressure that was building during consolidation.
📈 Momentum Release
The best breakouts don't just move above an MA.
They separate from them.
When MA7 pulls sharply away from MA25 and both begin expanding above MA99, momentum is often entering the market aggressively.
This is where trend traders become interested.
🎯 Entry Confirmation
Professional traders don't enter simply because MAs are compressed.
They wait for confirmation:
▪️ Strong breakout candle
▪️ Volume expansion
▪️ RSI strength above key levels
▪️ Market structure break
▪️ Successful retest of the breakout zone
📌 MA Compression is not the trade.
It's the warning that a trade may be coming.
The smartest traders don't chase volatility.
They identify it before everyone else sees it.
#MovingAverages
No massive candles.
No breakout headlines.
No excitement.
Just a group of Moving Averages slowly squeezing together.
This is called MA Compression.
And it's often the calm before a major move.
📊 What Is MA Compression?
MA Compression occurs when MA7, MA25, MA99, and sometimes even MA200 begin moving closer together.
The gap between them shrinks.
Price volatility decreases.
The market enters a state of balance where buyers and sellers are temporarily matched.
Many traders ignore this phase because nothing appears to be happening.
In reality, energy is building.
🔹️ Tight MA Alignment
Think of Moving Averages as trend indicators across different timeframes.
When they compress together, it tells us:
▫️ Momentum is slowing
▫️ Trend direction is undecided
▫️ Volatility is contracting
▫️ A larger move may be approaching
The tighter the compression, the more important the next breakout often becomes.
🚀 Volatility Expansion
Markets move in cycles.
Low volatility is usually followed by high volatility.
Once #BTC breaks away from compressed MAs, expansion often follows.
This is where traders suddenly see:
▫️ Large candles
▫️ Increased volume
▫️ Strong directional movement
▫️ Momentum acceleration
The move itself isn't random.
It's the release of pressure that was building during consolidation.
📈 Momentum Release
The best breakouts don't just move above an MA.
They separate from them.
When MA7 pulls sharply away from MA25 and both begin expanding above MA99, momentum is often entering the market aggressively.
This is where trend traders become interested.
🎯 Entry Confirmation
Professional traders don't enter simply because MAs are compressed.
They wait for confirmation:
▪️ Strong breakout candle
▪️ Volume expansion
▪️ RSI strength above key levels
▪️ Market structure break
▪️ Successful retest of the breakout zone
📌 MA Compression is not the trade.
It's the warning that a trade may be coming.
The smartest traders don't chase volatility.
They identify it before everyone else sees it.
#MovingAverages
1
101

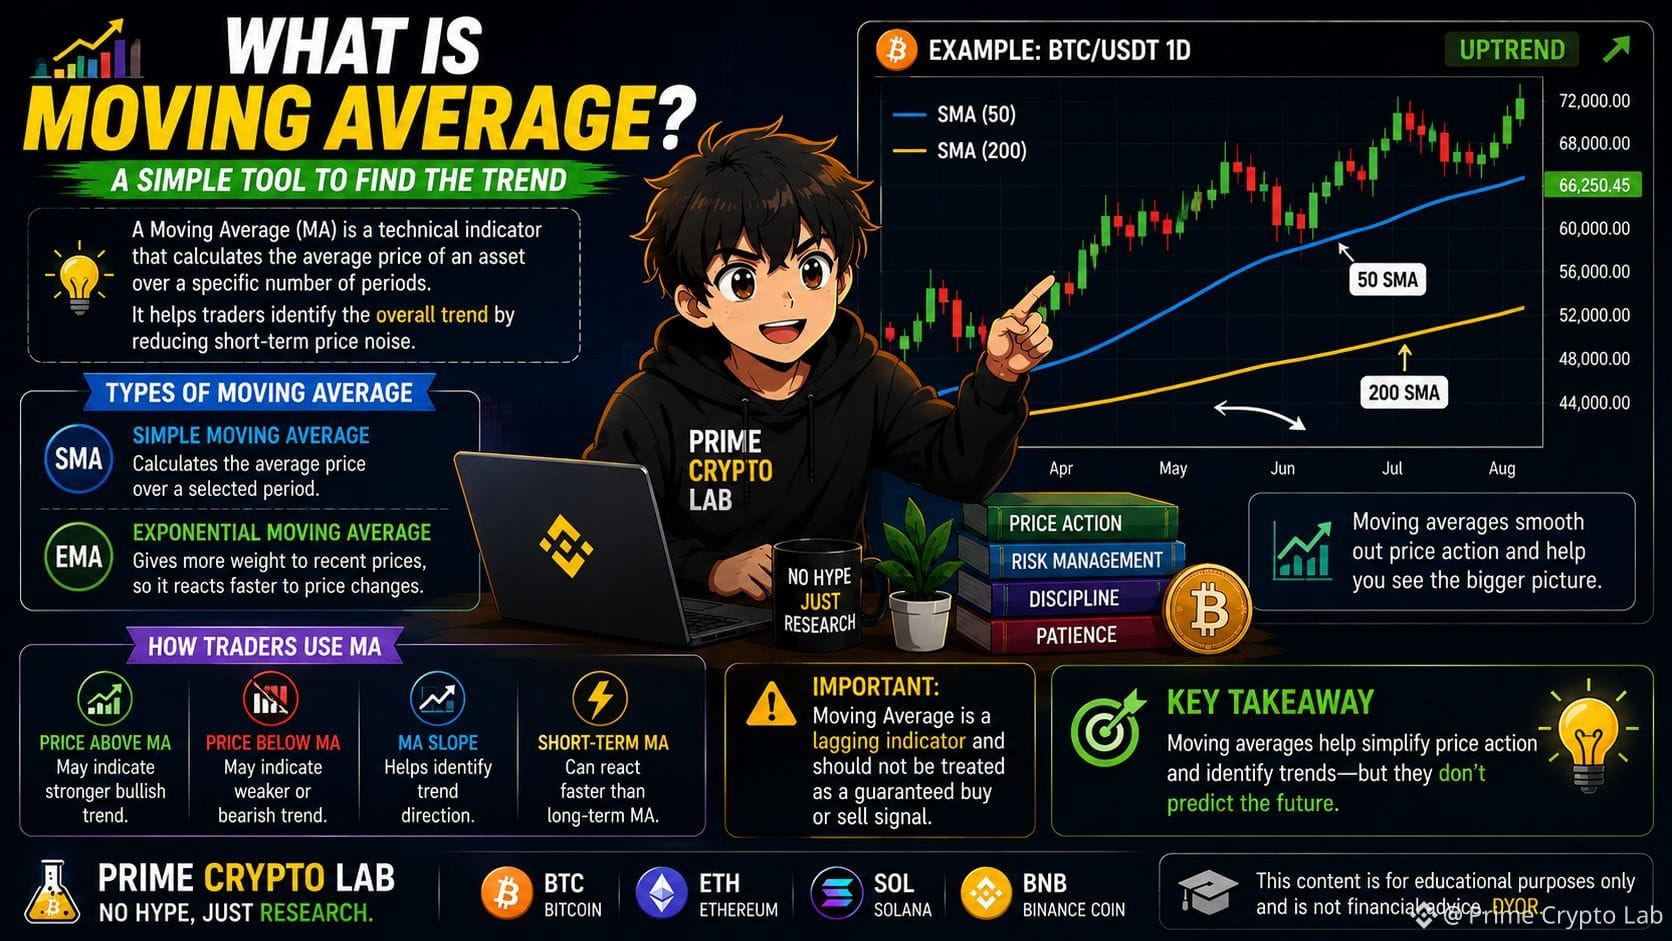
📈 What Is a Moving Average?
A Moving Average (MA) is a technical indicator that calculates the average price of an asset over a specific number of periods. It helps traders identify the overall trend by reducing short-term price noise.
🔹 Common Moving Averages
SMA (Simple Moving Average):
Calculates the average price over a selected period.
EMA (Exponential Moving Average):
Gives more weight to recent prices, so it reacts faster to price changes.
📊 How Traders Use MA
🟢 Price above MA → may indicate stronger bullish trend
🔴 Price below MA → may indicate weaker or bearish trend
📈 MA slope → can help identify trend direction
⚡ Short-term MAs can react faster than long-term MAs.
For assets like Bitcoin $BTC , Ethereum $ETH , and Solana $SOL , traders often combine moving averages with price action, volume and support/resistance.
⚠️ Important: A moving average is a lagging indicator and should not be treated as a guaranteed buy or sell signal.
📚 Key takeaway:
Moving averages help simplify price action and identify trends—but they don't predict the future.
Prime Crypto Lab — No Hype, Just Research. 📚📊
#MovingAverages #BTC☀️ #ETH🔥🔥🔥🔥🔥🔥
📈 What Is a Moving Average?
A Moving Average (MA) is a technical indicator that calculates the average price of an asset over a specific number of periods. It helps traders identify the overall trend by reducing short-term price noise.
🔹 Common Moving Averages
SMA (Simple Moving Average):
Calculates the average price over a selected period.
EMA (Exponential Moving Average):
Gives more weight to recent prices, so it reacts faster to price changes.
📊 How Traders Use MA
🟢 Price above MA → may indicate stronger bullish trend
🔴 Price below MA → may indicate weaker or bearish trend
📈 MA slope → can help identify trend direction
⚡ Short-term MAs can react faster than long-term MAs.
For assets like Bitcoin $BTC , Ethereum $ETH , and Solana $SOL , traders often combine moving averages with price action, volume and support/resistance.
⚠️ Important: A moving average is a lagging indicator and should not be treated as a guaranteed buy or sell signal.
📚 Key takeaway:
Moving averages help simplify price action and identify trends—but they don't predict the future.
Prime Crypto Lab — No Hype, Just Research. 📚📊
#MovingAverages #BTC☀️ #ETH🔥🔥🔥🔥🔥🔥
A Moving Average (MA) is a technical indicator that calculates the average price of an asset over a specific number of periods. It helps traders identify the overall trend by reducing short-term price noise.
🔹 Common Moving Averages
SMA (Simple Moving Average):
Calculates the average price over a selected period.
EMA (Exponential Moving Average):
Gives more weight to recent prices, so it reacts faster to price changes.
📊 How Traders Use MA
🟢 Price above MA → may indicate stronger bullish trend
🔴 Price below MA → may indicate weaker or bearish trend
📈 MA slope → can help identify trend direction
⚡ Short-term MAs can react faster than long-term MAs.
For assets like Bitcoin $BTC , Ethereum $ETH , and Solana $SOL , traders often combine moving averages with price action, volume and support/resistance.
⚠️ Important: A moving average is a lagging indicator and should not be treated as a guaranteed buy or sell signal.
📚 Key takeaway:
Moving averages help simplify price action and identify trends—but they don't predict the future.
Prime Crypto Lab — No Hype, Just Research. 📚📊
#MovingAverages #BTC☀️ #ETH🔥🔥🔥🔥🔥🔥
141

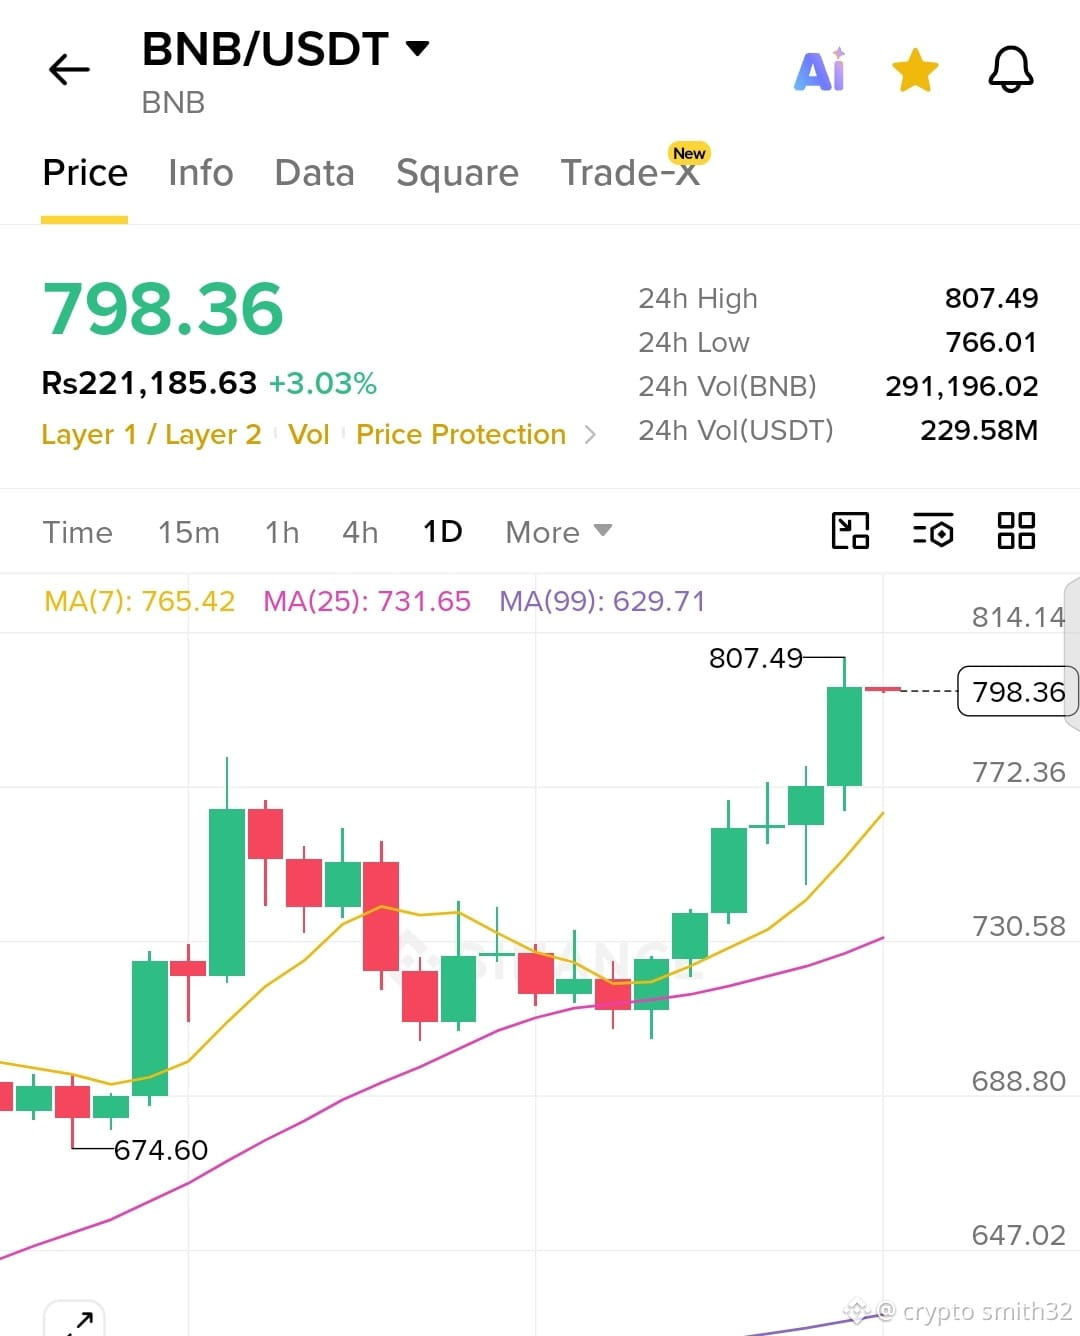
📖 Crypto 101: Understanding the Moving Averages on BNB 📉
Confused by the lines on the chart? Let’s simplify it:
💛 Yellow Line (MA7): Tracks short-term momentum ($765.42).
💜 Pink Line (MA25): Tracks medium-term trend ($731.65).
💙 Purple Line (MA99): Tracks long-term baseline ($629.71).
When the price stays firmly above all three—like BNB is doing right now at $798.36—the market structure is highly bullish!
#write2earn🌐💹 #CryptoEducation #learntrading #BNB #MovingAverages
$BNB
{spot}(BNBUSDT)
📖 Crypto 101: Understanding the Moving Averages on BNB 📉
Confused by the lines on the chart? Let’s simplify it:
💛 Yellow Line (MA7): Tracks short-term momentum ($765.42).
💜 Pink Line (MA25): Tracks medium-term trend ($731.65).
💙 Purple Line (MA99): Tracks long-term baseline ($629.71).
When the price stays firmly above all three—like BNB is doing right now at $798.36—the market structure is highly bullish!
#write2earn🌐💹 #CryptoEducation #learntrading #BNB #MovingAverages
$BNB
Confused by the lines on the chart? Let’s simplify it:
💛 Yellow Line (MA7): Tracks short-term momentum ($765.42).
💜 Pink Line (MA25): Tracks medium-term trend ($731.65).
💙 Purple Line (MA99): Tracks long-term baseline ($629.71).
When the price stays firmly above all three—like BNB is doing right now at $798.36—the market structure is highly bullish!
#write2earn🌐💹 #CryptoEducation #learntrading #BNB #MovingAverages
$BNB
1
49

·
--
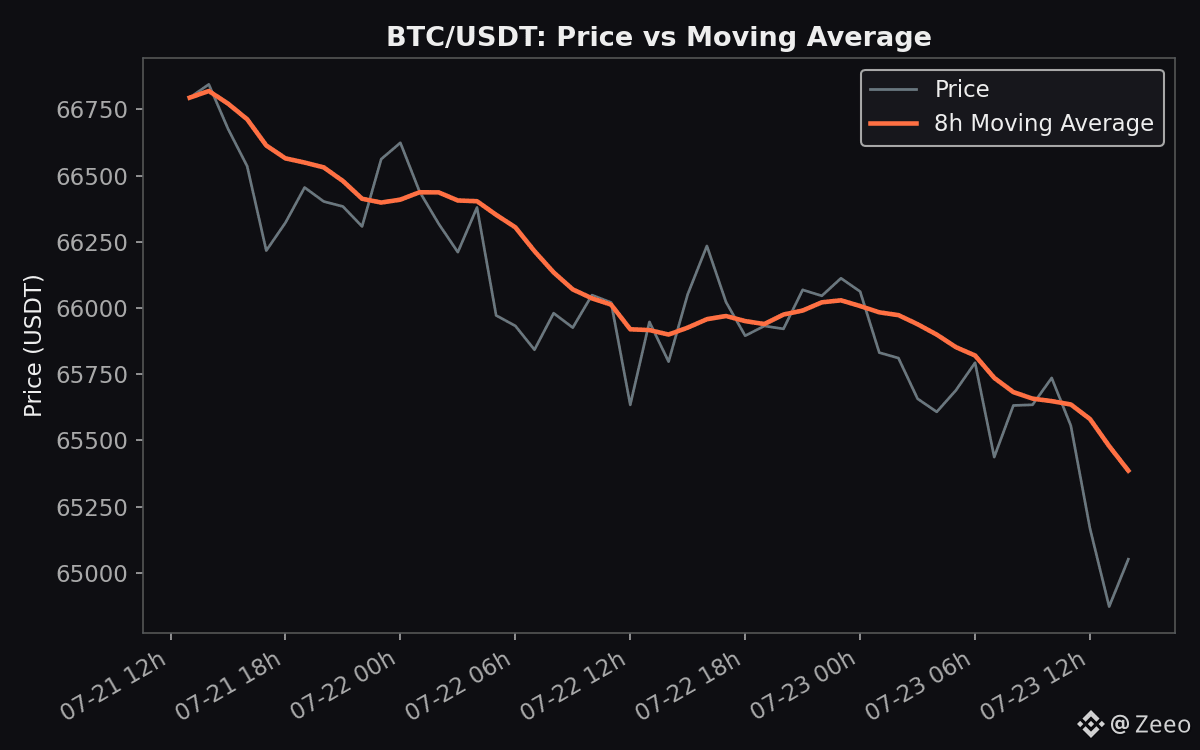
Moving Averages (p5)
📚 Crypto Basics: Moving Averages
The orange line smooths out hourly noise to show the underlying trend.
Price above the average = short-term strength. Price below = short-term weakness.
It's a lagging tool — great for context, not for predicting the next candle. #cryptoeducation #MovingAverages #BTC
Moving Averages (p5)
📚 Crypto Basics: Moving Averages
The orange line smooths out hourly noise to show the underlying trend.
Price above the average = short-term strength. Price below = short-term weakness.
It's a lagging tool — great for context, not for predicting the next candle. #cryptoeducation #MovingAverages #BTC
📚 Crypto Basics: Moving Averages
The orange line smooths out hourly noise to show the underlying trend.
Price above the average = short-term strength. Price below = short-term weakness.
It's a lagging tool — great for context, not for predicting the next candle. #cryptoeducation #MovingAverages #BTC
42

Moving Average Check
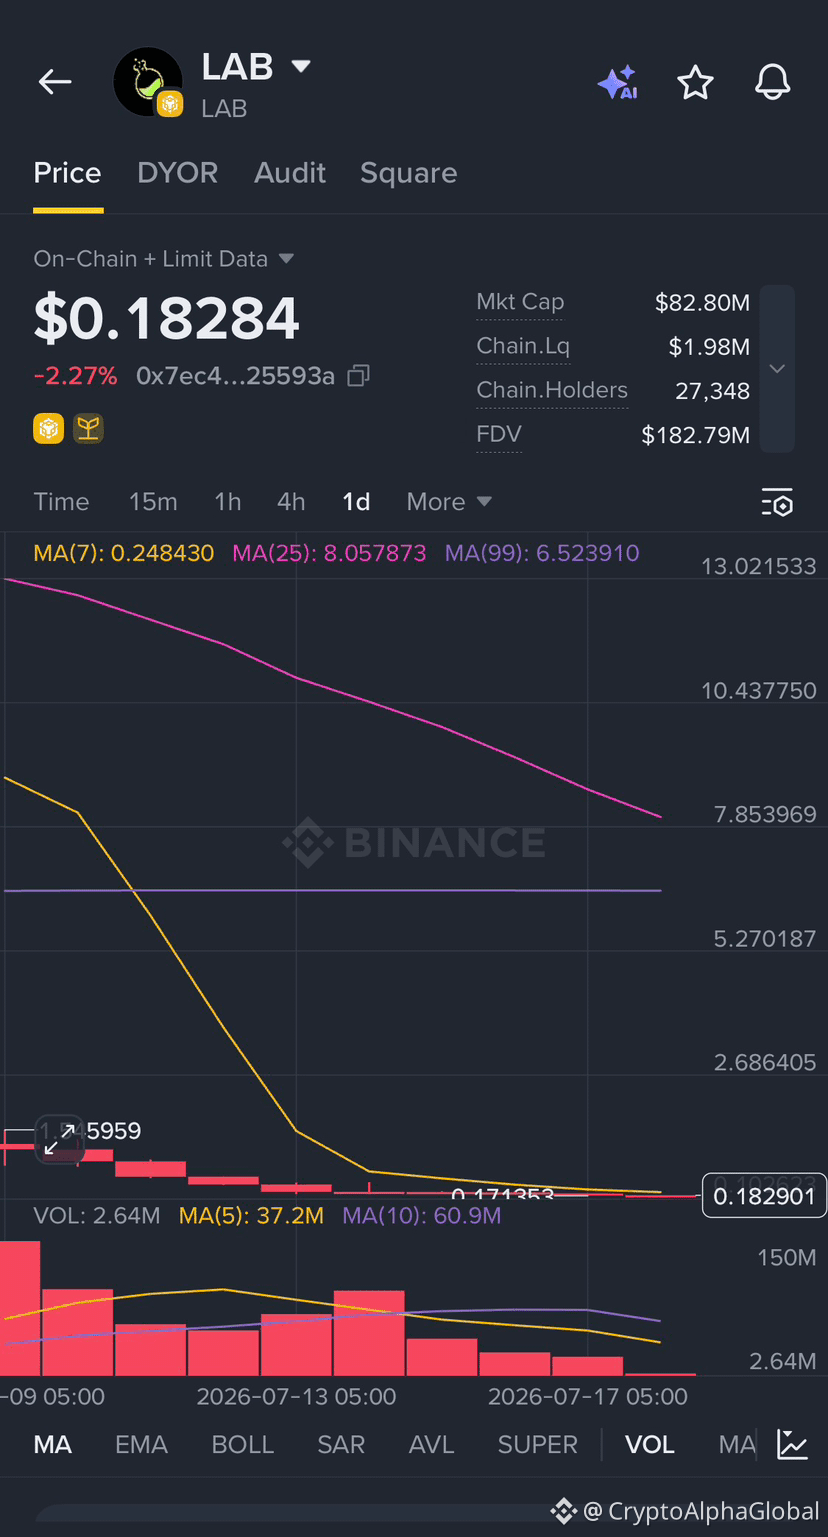
The MA(7) for $LAB is at 0.248, still sitting above current spot price. Short-term trend structure remains under pressure until price reclaims that level.
#LAB #TechnicalAnalysis #MovingAverages
{future}(LABUSDT)
Moving Average Check
The MA(7) for $LAB is at 0.248, still sitting above current spot price. Short-term trend structure remains under pressure until price reclaims that level.
#LAB #TechnicalAnalysis #MovingAverages
The MA(7) for $LAB is at 0.248, still sitting above current spot price. Short-term trend structure remains under pressure until price reclaims that level.
#LAB #TechnicalAnalysis #MovingAverages
1
72
Log in to explore more content
Join global crypto users on Binance Square
⚡️ Get latest and useful information about crypto.
💬 Trusted by the world’s largest crypto exchange.
👍 Discover real insights from verified creators.
Email / Phone number
Trending Topics
1
#WhoWillSucceedJensenHuangatNvidia?
87,627 views
1,149 Discussing
2
#WhatWillDriveCryptoandStocks’NextRebound?
443,192 views
3,055 Discussing
3
#BitcoinActiveSupplyInProfitDropsBelow45%
26,051 views
365 Discussing
4
#KavaSaysAbnormalActivityLimitedToKavaLend
10,638 views
183 Discussing
5
#USSpotXRPETFsSeeLargestWeeklyOutflowIn8Months
9,738 views
175 Discussing
6
#USPPIMissMayEaseBTCPressure
213,404 views
2,065 Discussing
7
#WORPTLetsTouristsConvertCryptoToThaiBaht
2,831 views
51 Discussing
8
#TONStrategyReports$23.97MQ3NetLoss
3,714 views
41 Discussing
9
#PolkadotCommunityApprovesNewStrategyWith97%Vote
19,491 views
249 Discussing
10
#dYdXPlansV9.9UpgradeToShiftUSDCToInjective
12,350 views
200 Discussing