
#trendanalysis
trendanalysis
96,242 views
760 Discussing
Hot
Latest

·
--
🧭 $BTC TREND DIRECTION: FOLLOW THE EVIDENCE!
Bullish and bearish opinions are everywhere. The chart provides evidence through structure, momentum, volume, and support or resistance reactions. Build your view around observable conditions rather than online hype.
{spot}(BTCUSDT)
#BTC #TrendAnalysis #CryptoCharts #TradingTips
🧭 $BTC TREND DIRECTION: FOLLOW THE EVIDENCE!
Bullish and bearish opinions are everywhere. The chart provides evidence through structure, momentum, volume, and support or resistance reactions. Build your view around observable conditions rather than online hype.
#BTC #TrendAnalysis #CryptoCharts #TradingTips
Bullish and bearish opinions are everywhere. The chart provides evidence through structure, momentum, volume, and support or resistance reactions. Build your view around observable conditions rather than online hype.
#BTC #TrendAnalysis #CryptoCharts #TradingTips
1
1

·
--
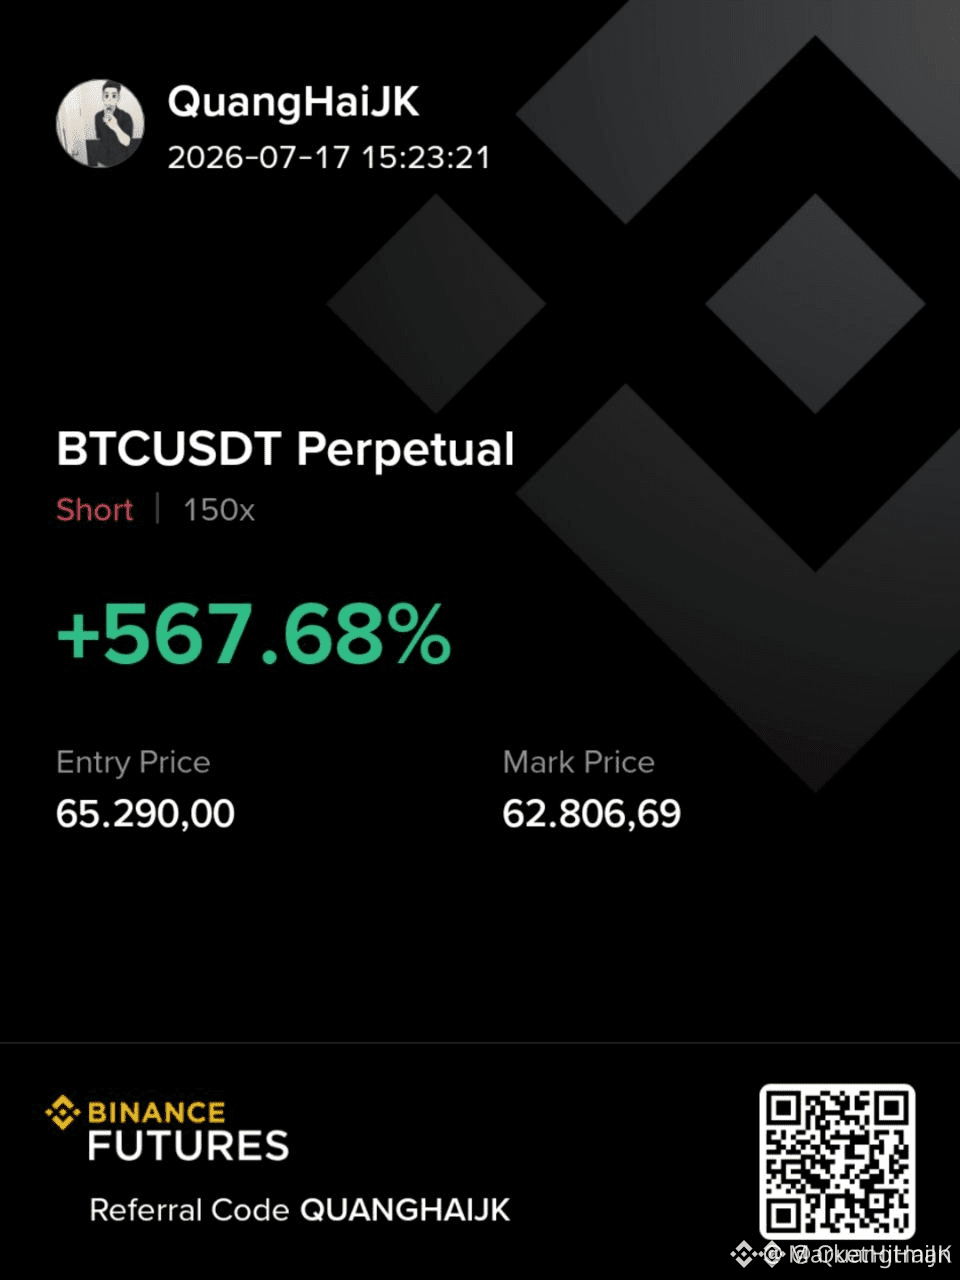
$BTC TREND ALIGNMENT REMAINS ACCURATE — ARE YOU TRADING IT? 🔥
The structure we laid out has been respected to the tick. Price is holding above the key support zone while volume divergence on the 1H signals a potential shift in momentum. The window for the optimal continuation entry is narrowing as liquidity builds.
Are you following the structure or fighting it?
Not financial advice. Always manage your risk.
#BTC #MarketStructure #TrendAnalysis #Crypto
⚡
$BTC TREND ALIGNMENT REMAINS ACCURATE — ARE YOU TRADING IT? 🔥
The structure we laid out has been respected to the tick. Price is holding above the key support zone while volume divergence on the 1H signals a potential shift in momentum. The window for the optimal continuation entry is narrowing as liquidity builds.
Are you following the structure or fighting it?
Not financial advice. Always manage your risk.
#BTC #MarketStructure #TrendAnalysis #Crypto
⚡
The structure we laid out has been respected to the tick. Price is holding above the key support zone while volume divergence on the 1H signals a potential shift in momentum. The window for the optimal continuation entry is narrowing as liquidity builds.
Are you following the structure or fighting it?
Not financial advice. Always manage your risk.
#BTC #MarketStructure #TrendAnalysis #Crypto
⚡
29

·
--
Bullish
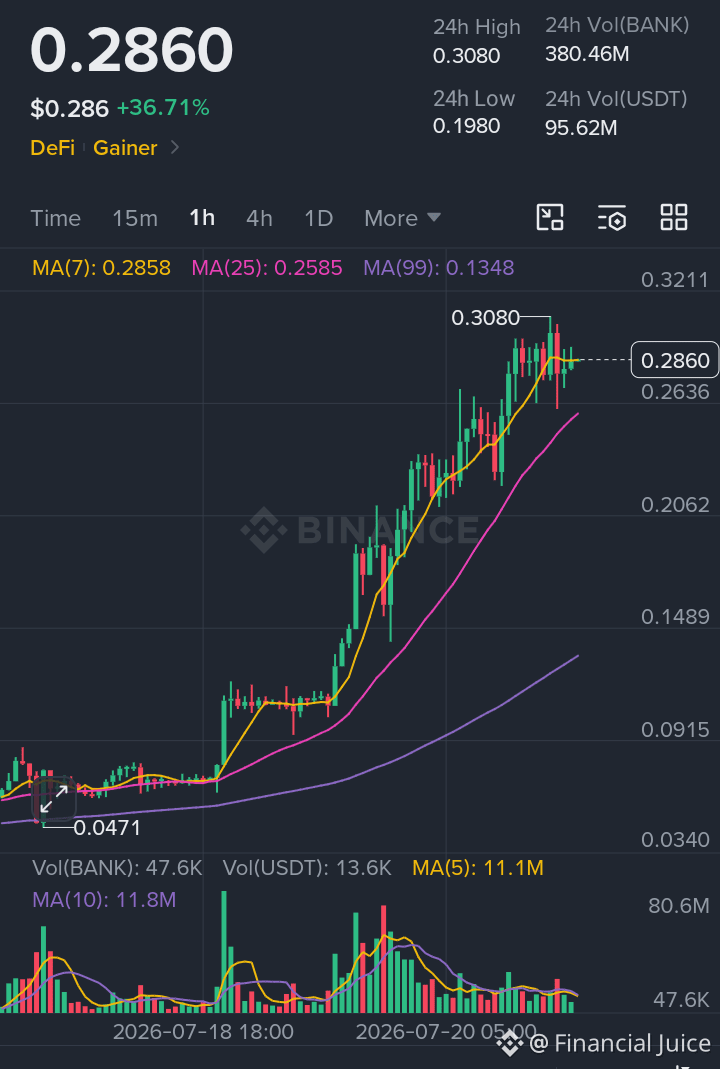
$BANK long bias structure: support building near MA25 ($0.2585), invalidation below MA99 ($0.1348) — that's the macro trend line for this move.
#BANK #TrendAnalysis #CryptoLongs #DeFiSeason #BinanceSquare
{spot}(BANKUSDT)
$BANK long bias structure: support building near MA25 ($0.2585), invalidation below MA99 ($0.1348) — that's the macro trend line for this move.
#BANK #TrendAnalysis #CryptoLongs #DeFiSeason #BinanceSquare
#BANK #TrendAnalysis #CryptoLongs #DeFiSeason #BinanceSquare
1
98

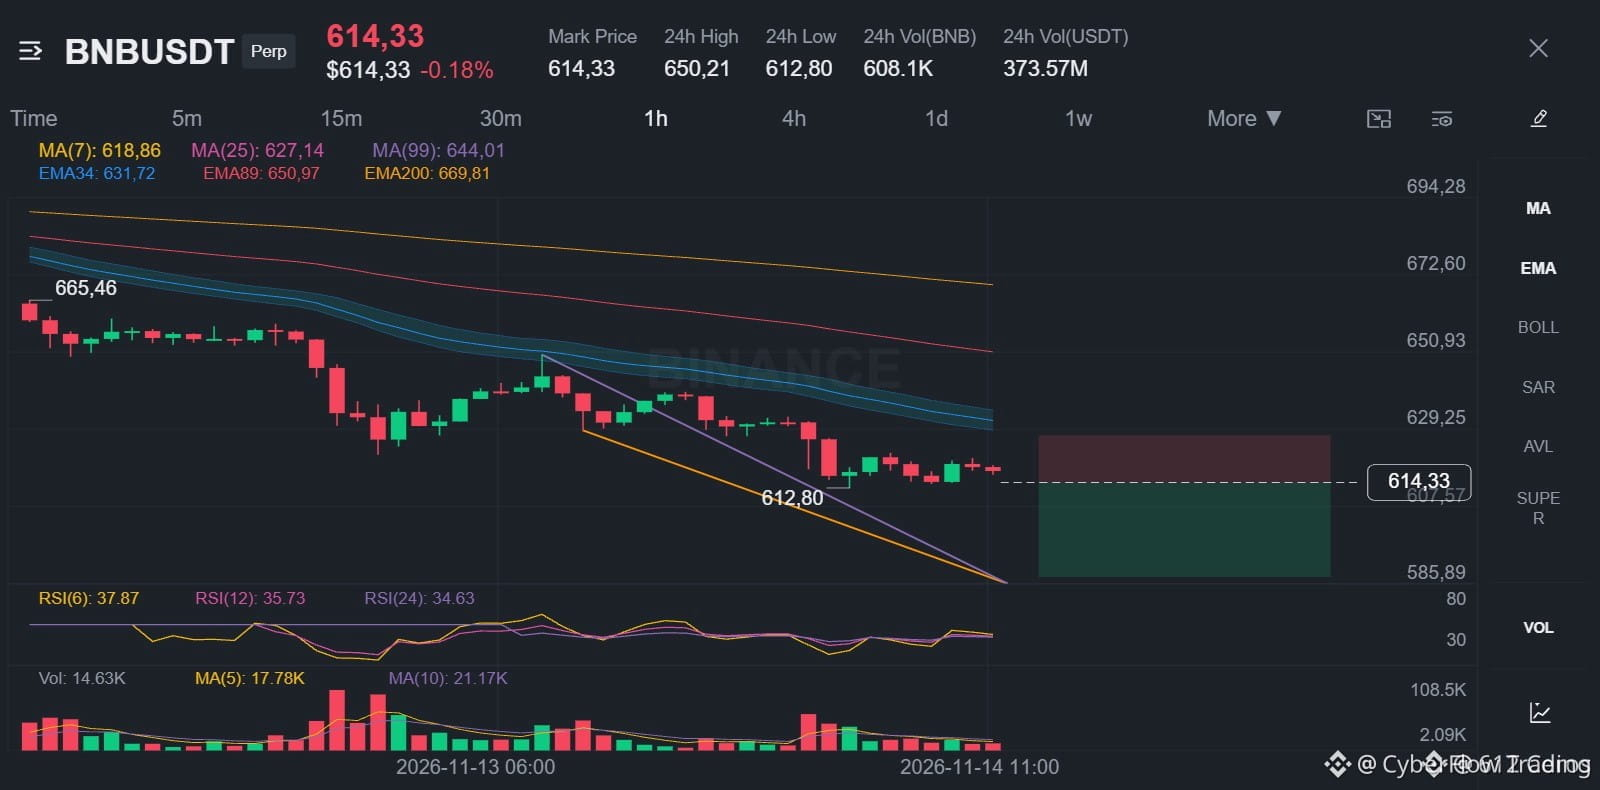
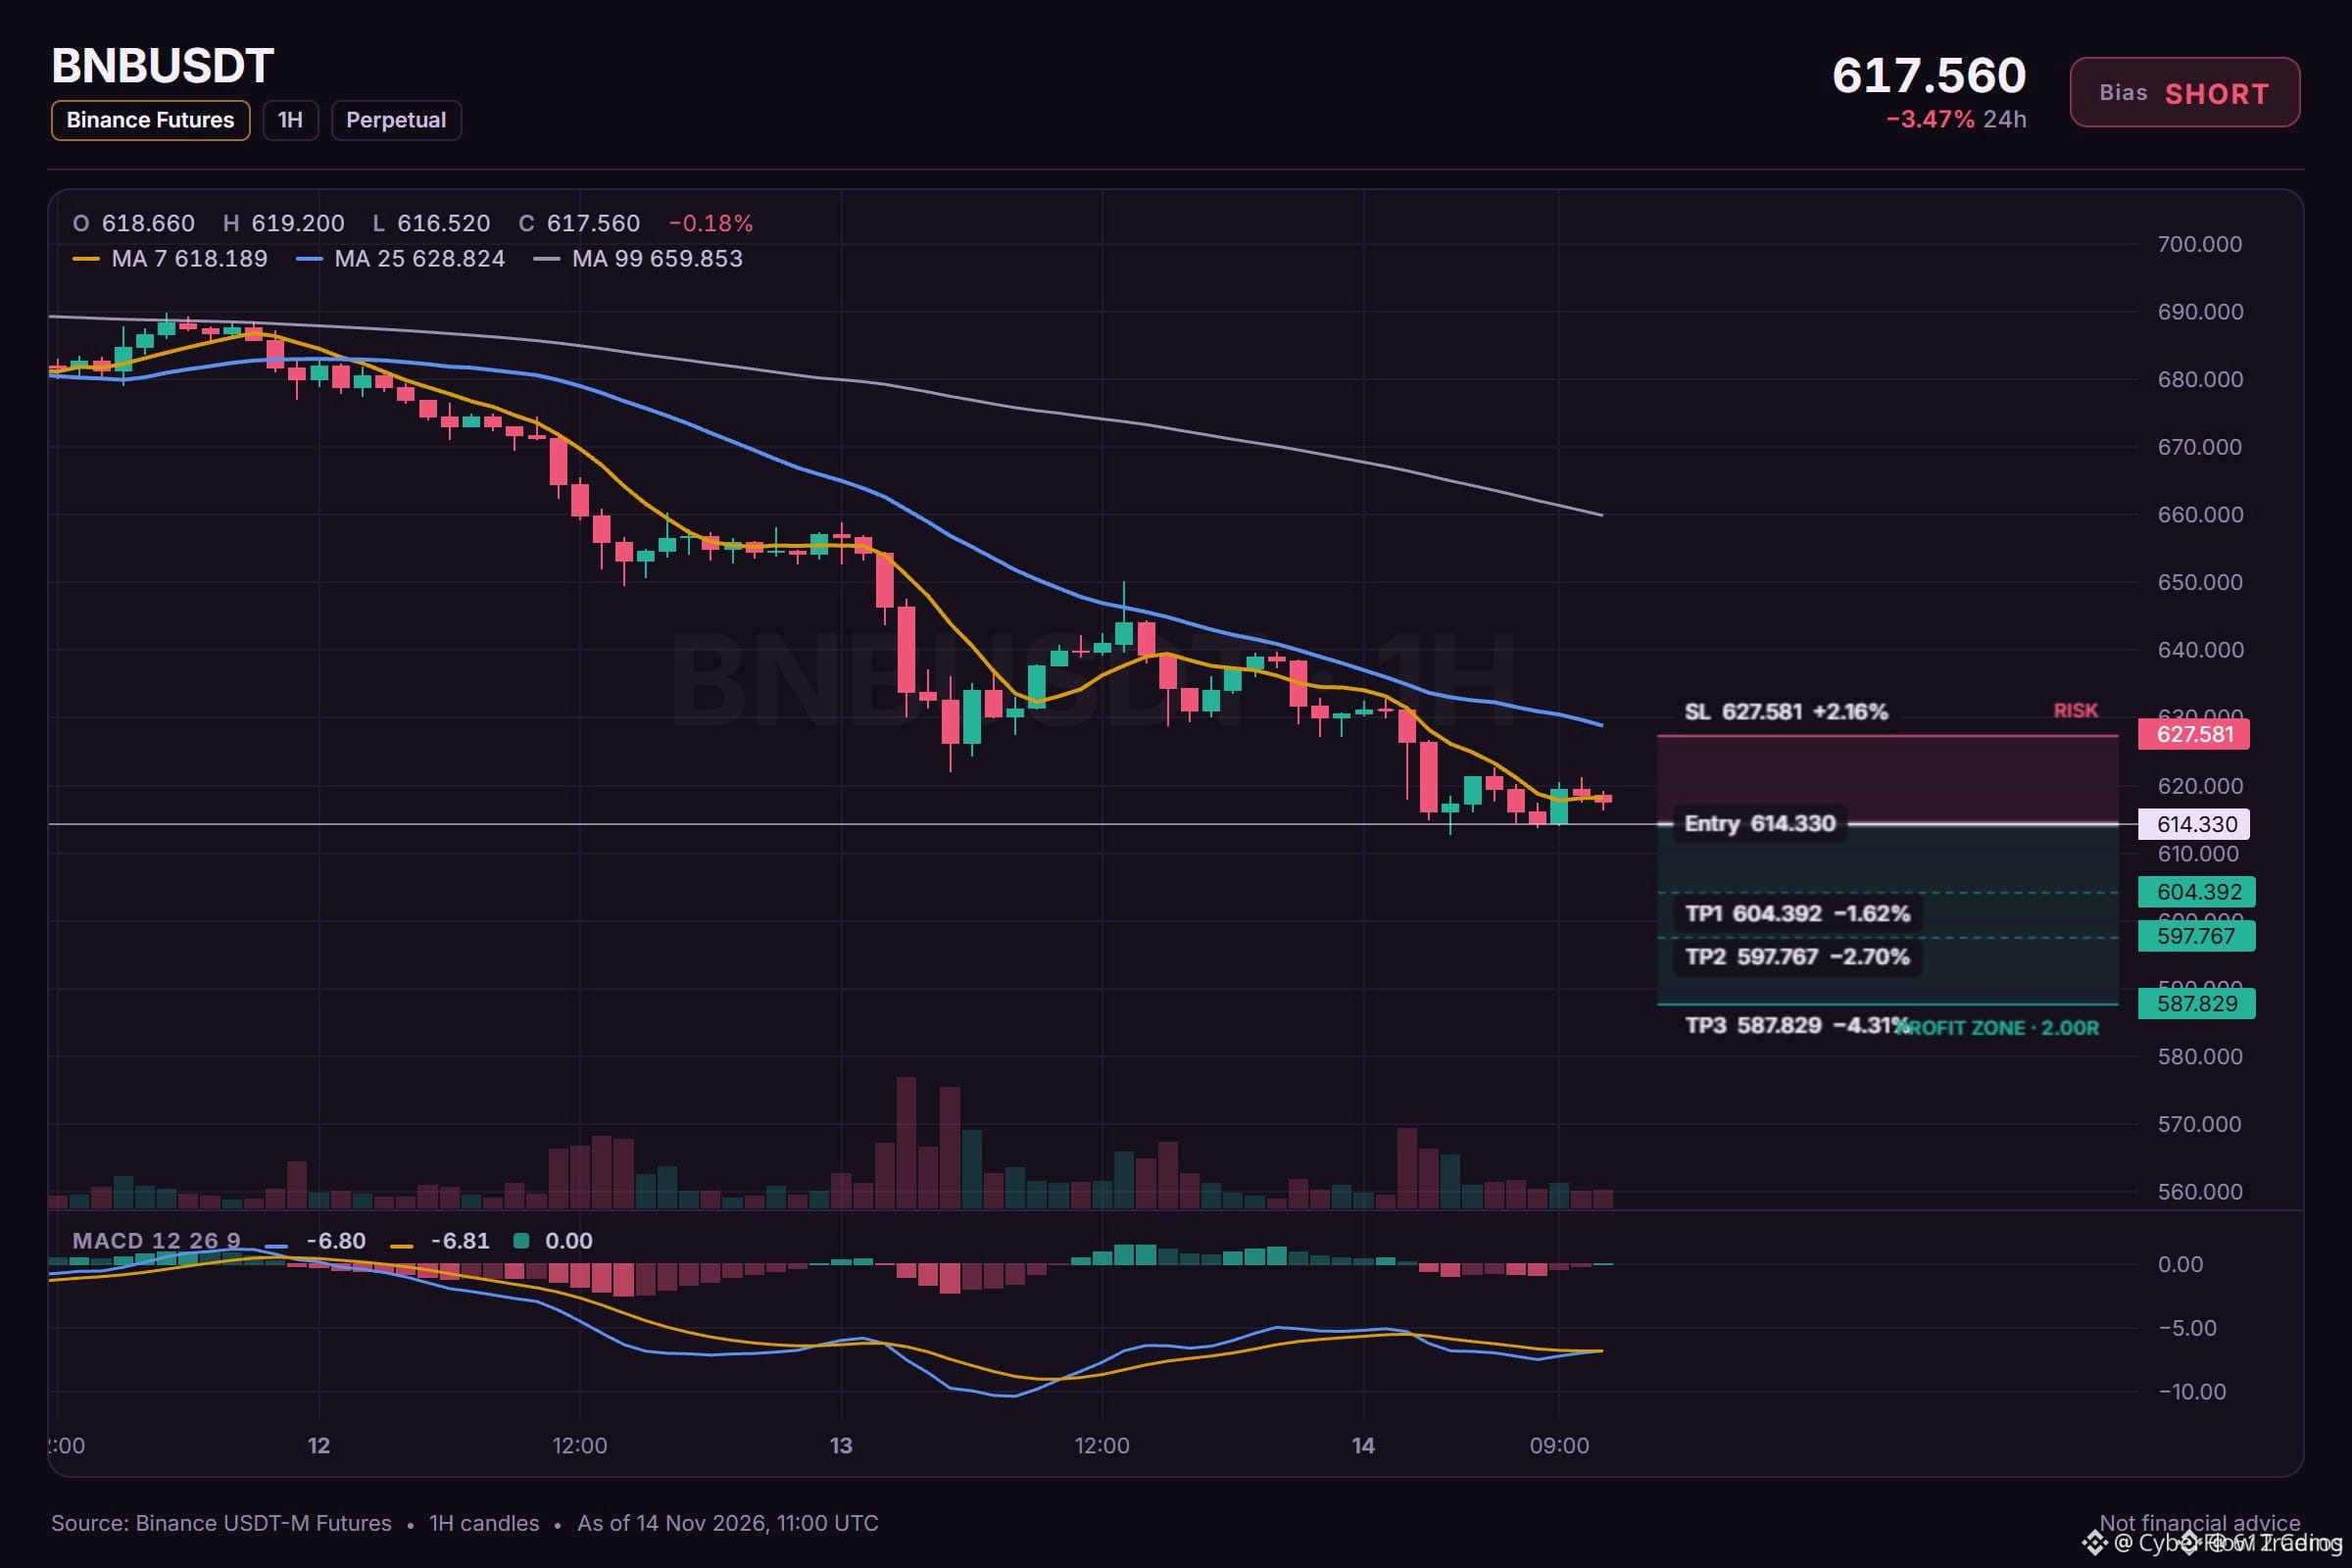
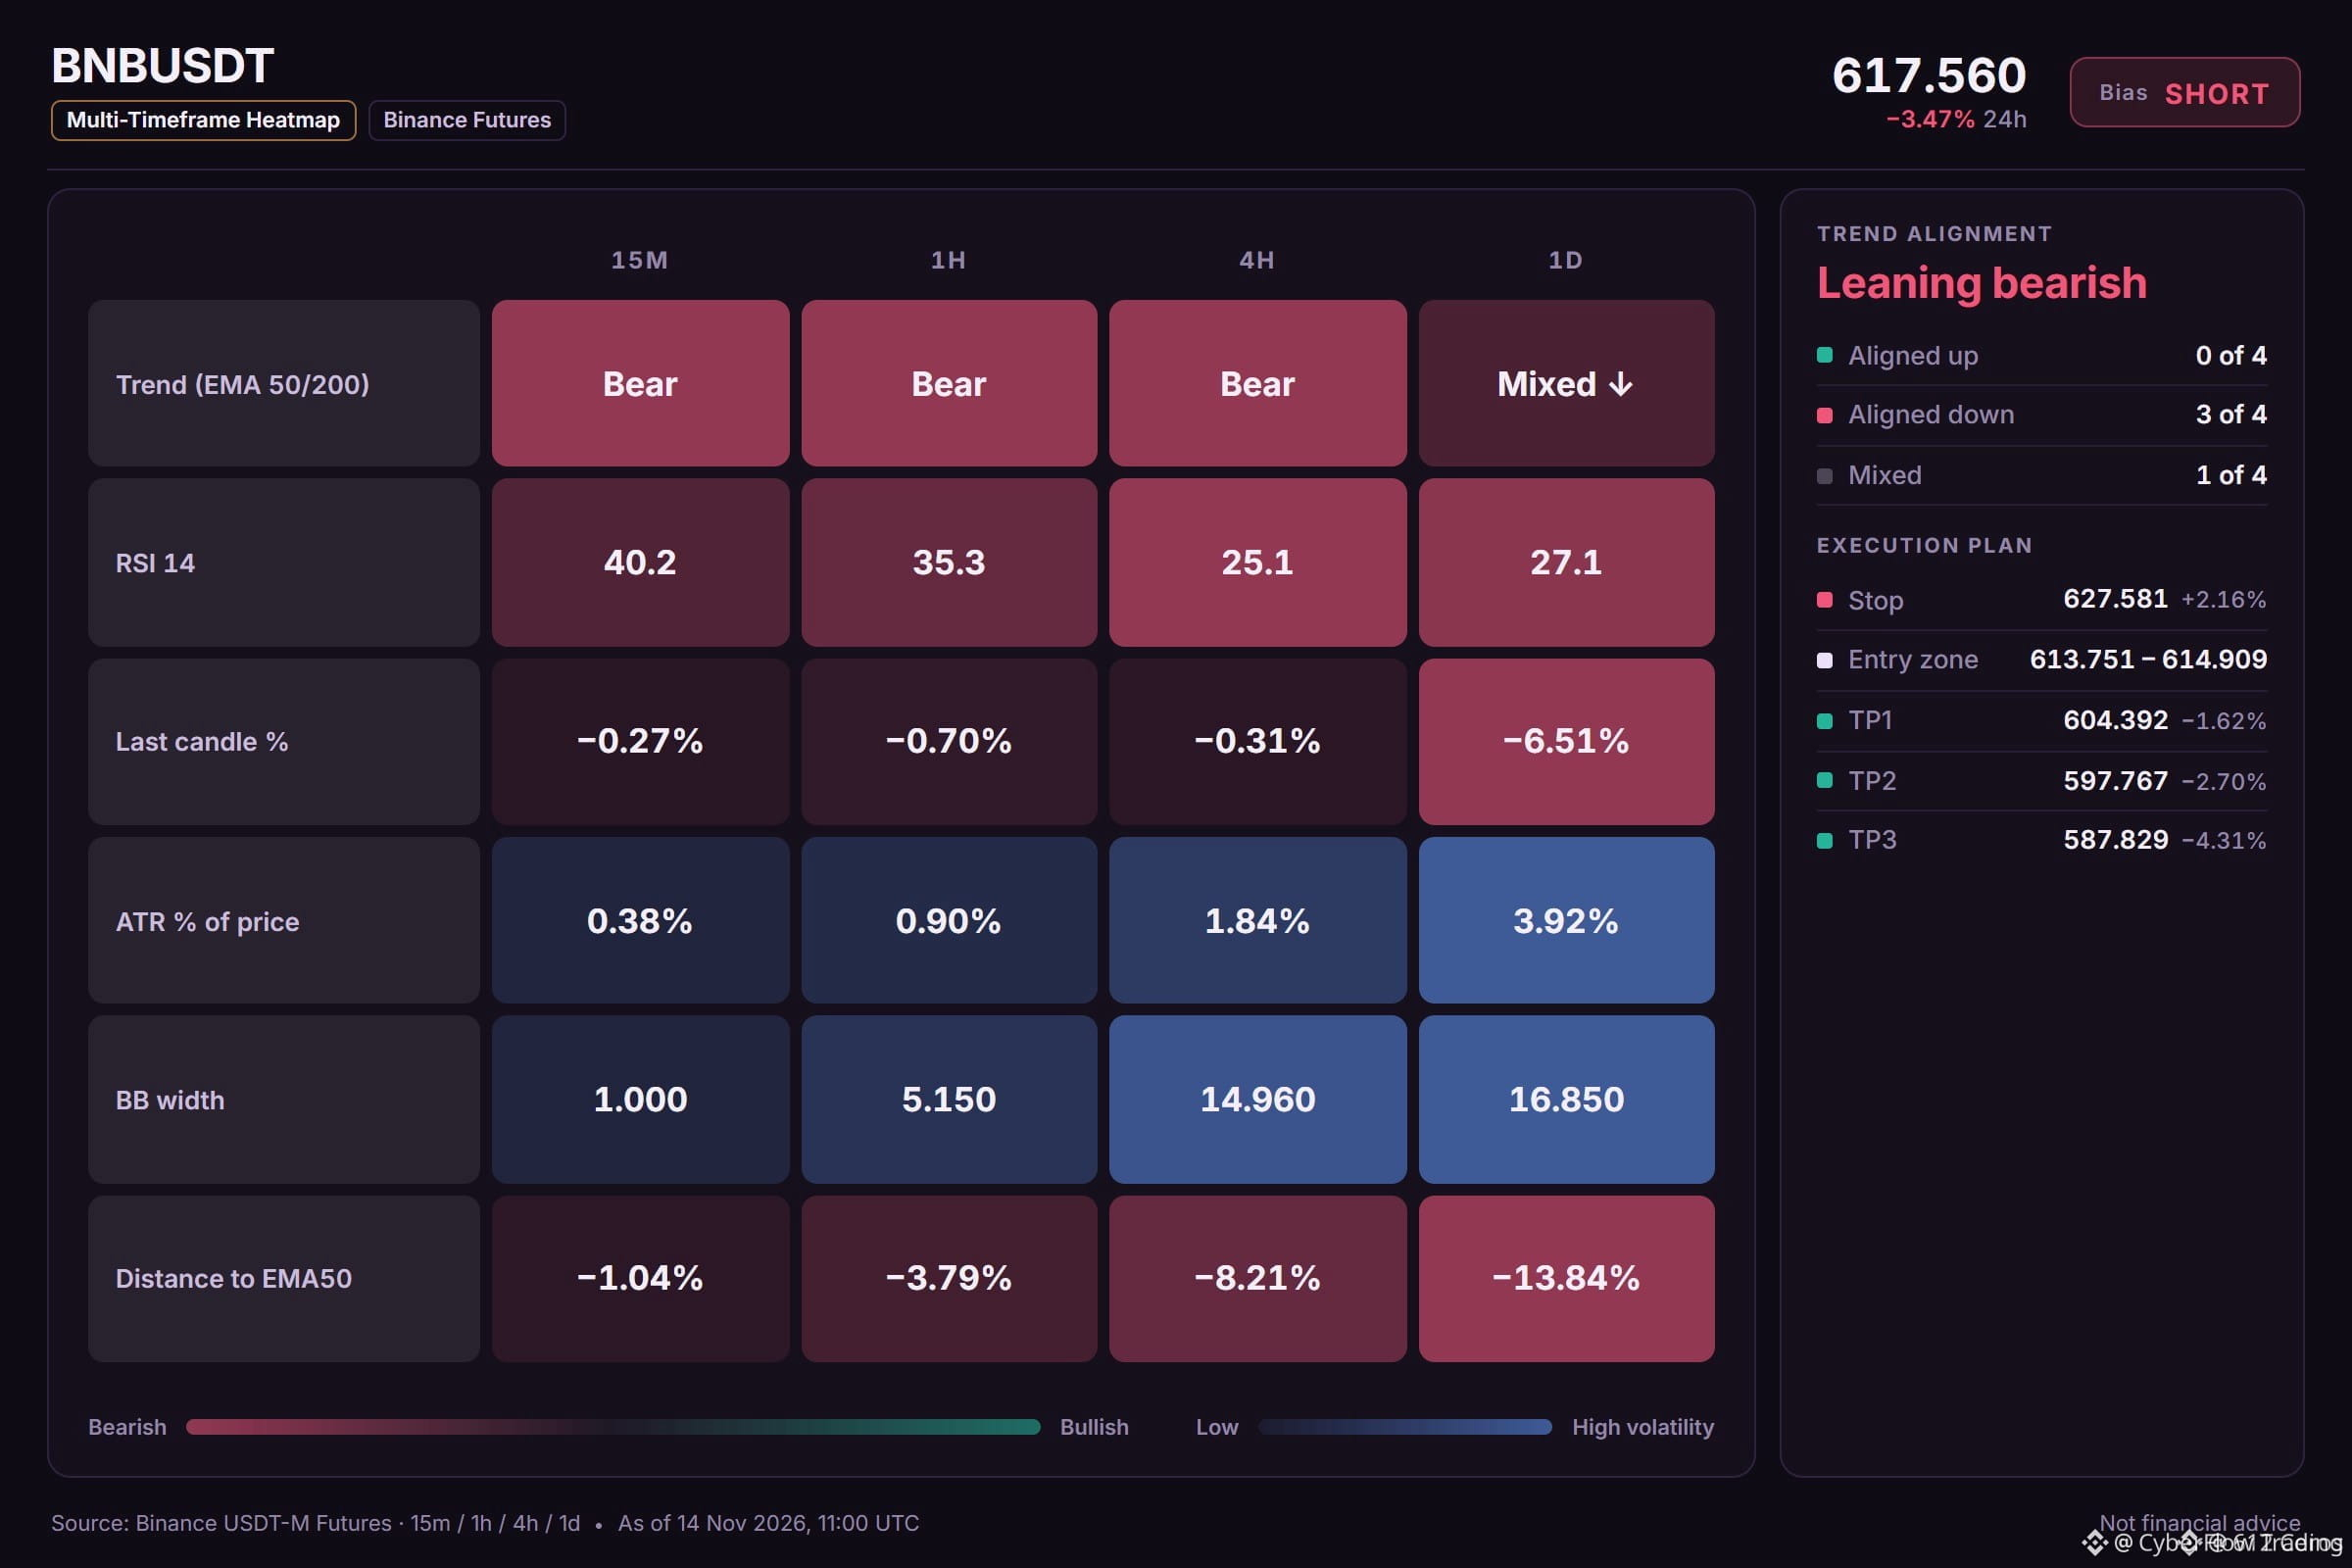
🔴 $BNB BEARS CRUSHING THE STACKED EMAS AS DOWNTREND MOMENTUM ACCELERATES 📉
Entry: 613.751 – 614.909 ⚡
Target: 604.392 🎯
Stop Loss: 627.581 🛑
Sellers are firmly guarding the lower boundaries as price action struggles below the stacked EMAs across both the four-hour and one-hour timeframes. 📊 The macro swing trend remains heavily compromised with downside pressure dictating every bounce. ⚡
While the current extension sits slightly off average norms, momentum order flow points directly toward continued retests of lower structural floors. 💡
💬 Are you positioning ahead of the continuation or waiting for confirmation? 👇
⚠️ Not financial advice. Always manage your risk. 🛡️
🏷️ #BNB #ShortSetup #CryptoTrading #TrendAnalysis
📉 🦈
🔴 $BNB BEARS CRUSHING THE STACKED EMAS AS DOWNTREND MOMENTUM ACCELERATES 📉
Entry: 613.751 – 614.909 ⚡
Target: 604.392 🎯
Stop Loss: 627.581 🛑
Sellers are firmly guarding the lower boundaries as price action struggles below the stacked EMAs across both the four-hour and one-hour timeframes. 📊 The macro swing trend remains heavily compromised with downside pressure dictating every bounce. ⚡
While the current extension sits slightly off average norms, momentum order flow points directly toward continued retests of lower structural floors. 💡
💬 Are you positioning ahead of the continuation or waiting for confirmation? 👇
⚠️ Not financial advice. Always manage your risk. 🛡️
🏷️ #BNB #ShortSetup #CryptoTrading #TrendAnalysis
📉 🦈
Entry: 613.751 – 614.909 ⚡
Target: 604.392 🎯
Stop Loss: 627.581 🛑
Sellers are firmly guarding the lower boundaries as price action struggles below the stacked EMAs across both the four-hour and one-hour timeframes. 📊 The macro swing trend remains heavily compromised with downside pressure dictating every bounce. ⚡
While the current extension sits slightly off average norms, momentum order flow points directly toward continued retests of lower structural floors. 💡
💬 Are you positioning ahead of the continuation or waiting for confirmation? 👇
⚠️ Not financial advice. Always manage your risk. 🛡️
🏷️ #BNB #ShortSetup #CryptoTrading #TrendAnalysis
📉 🦈
6
·
--
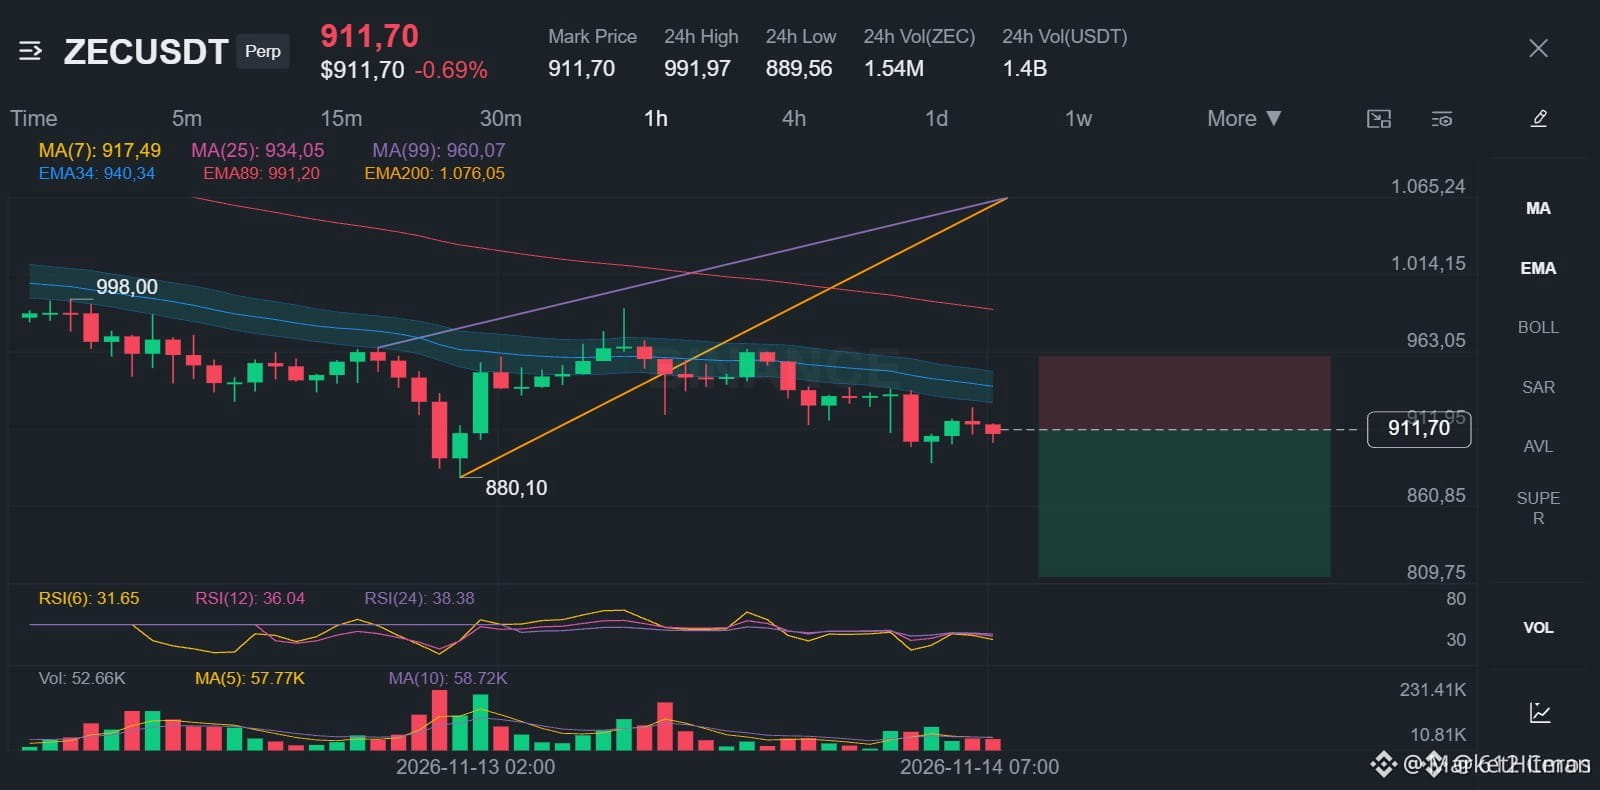
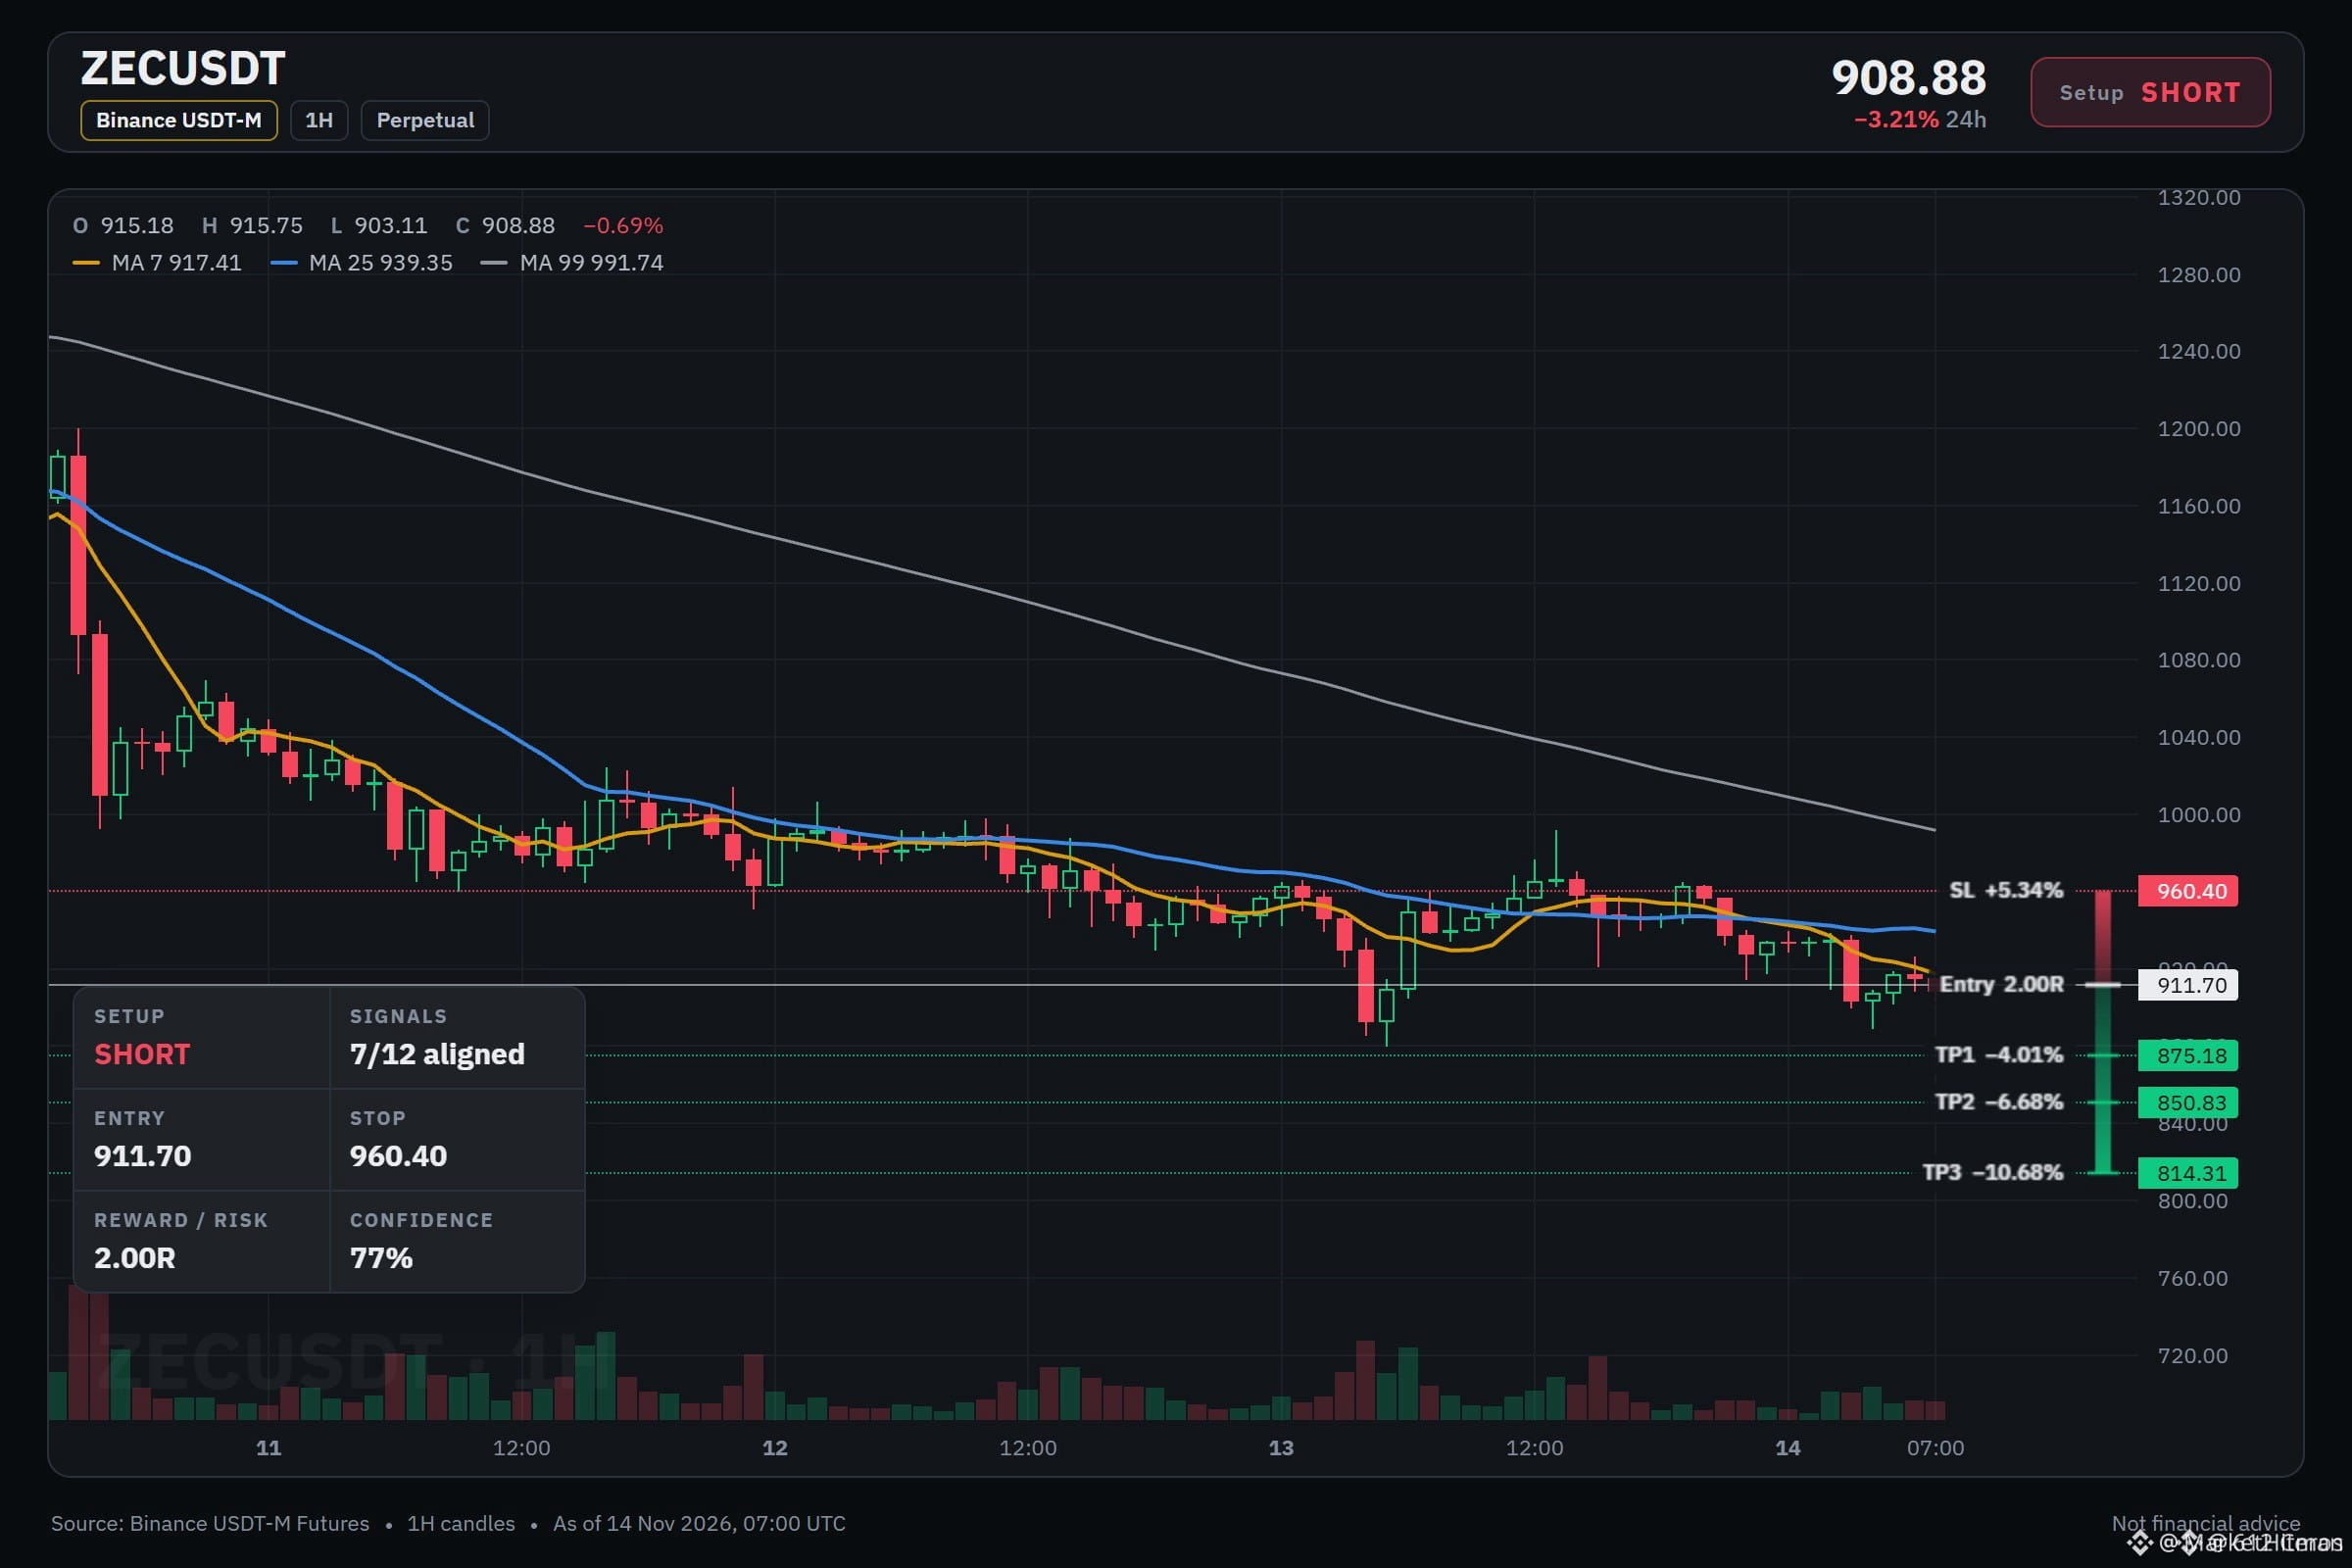
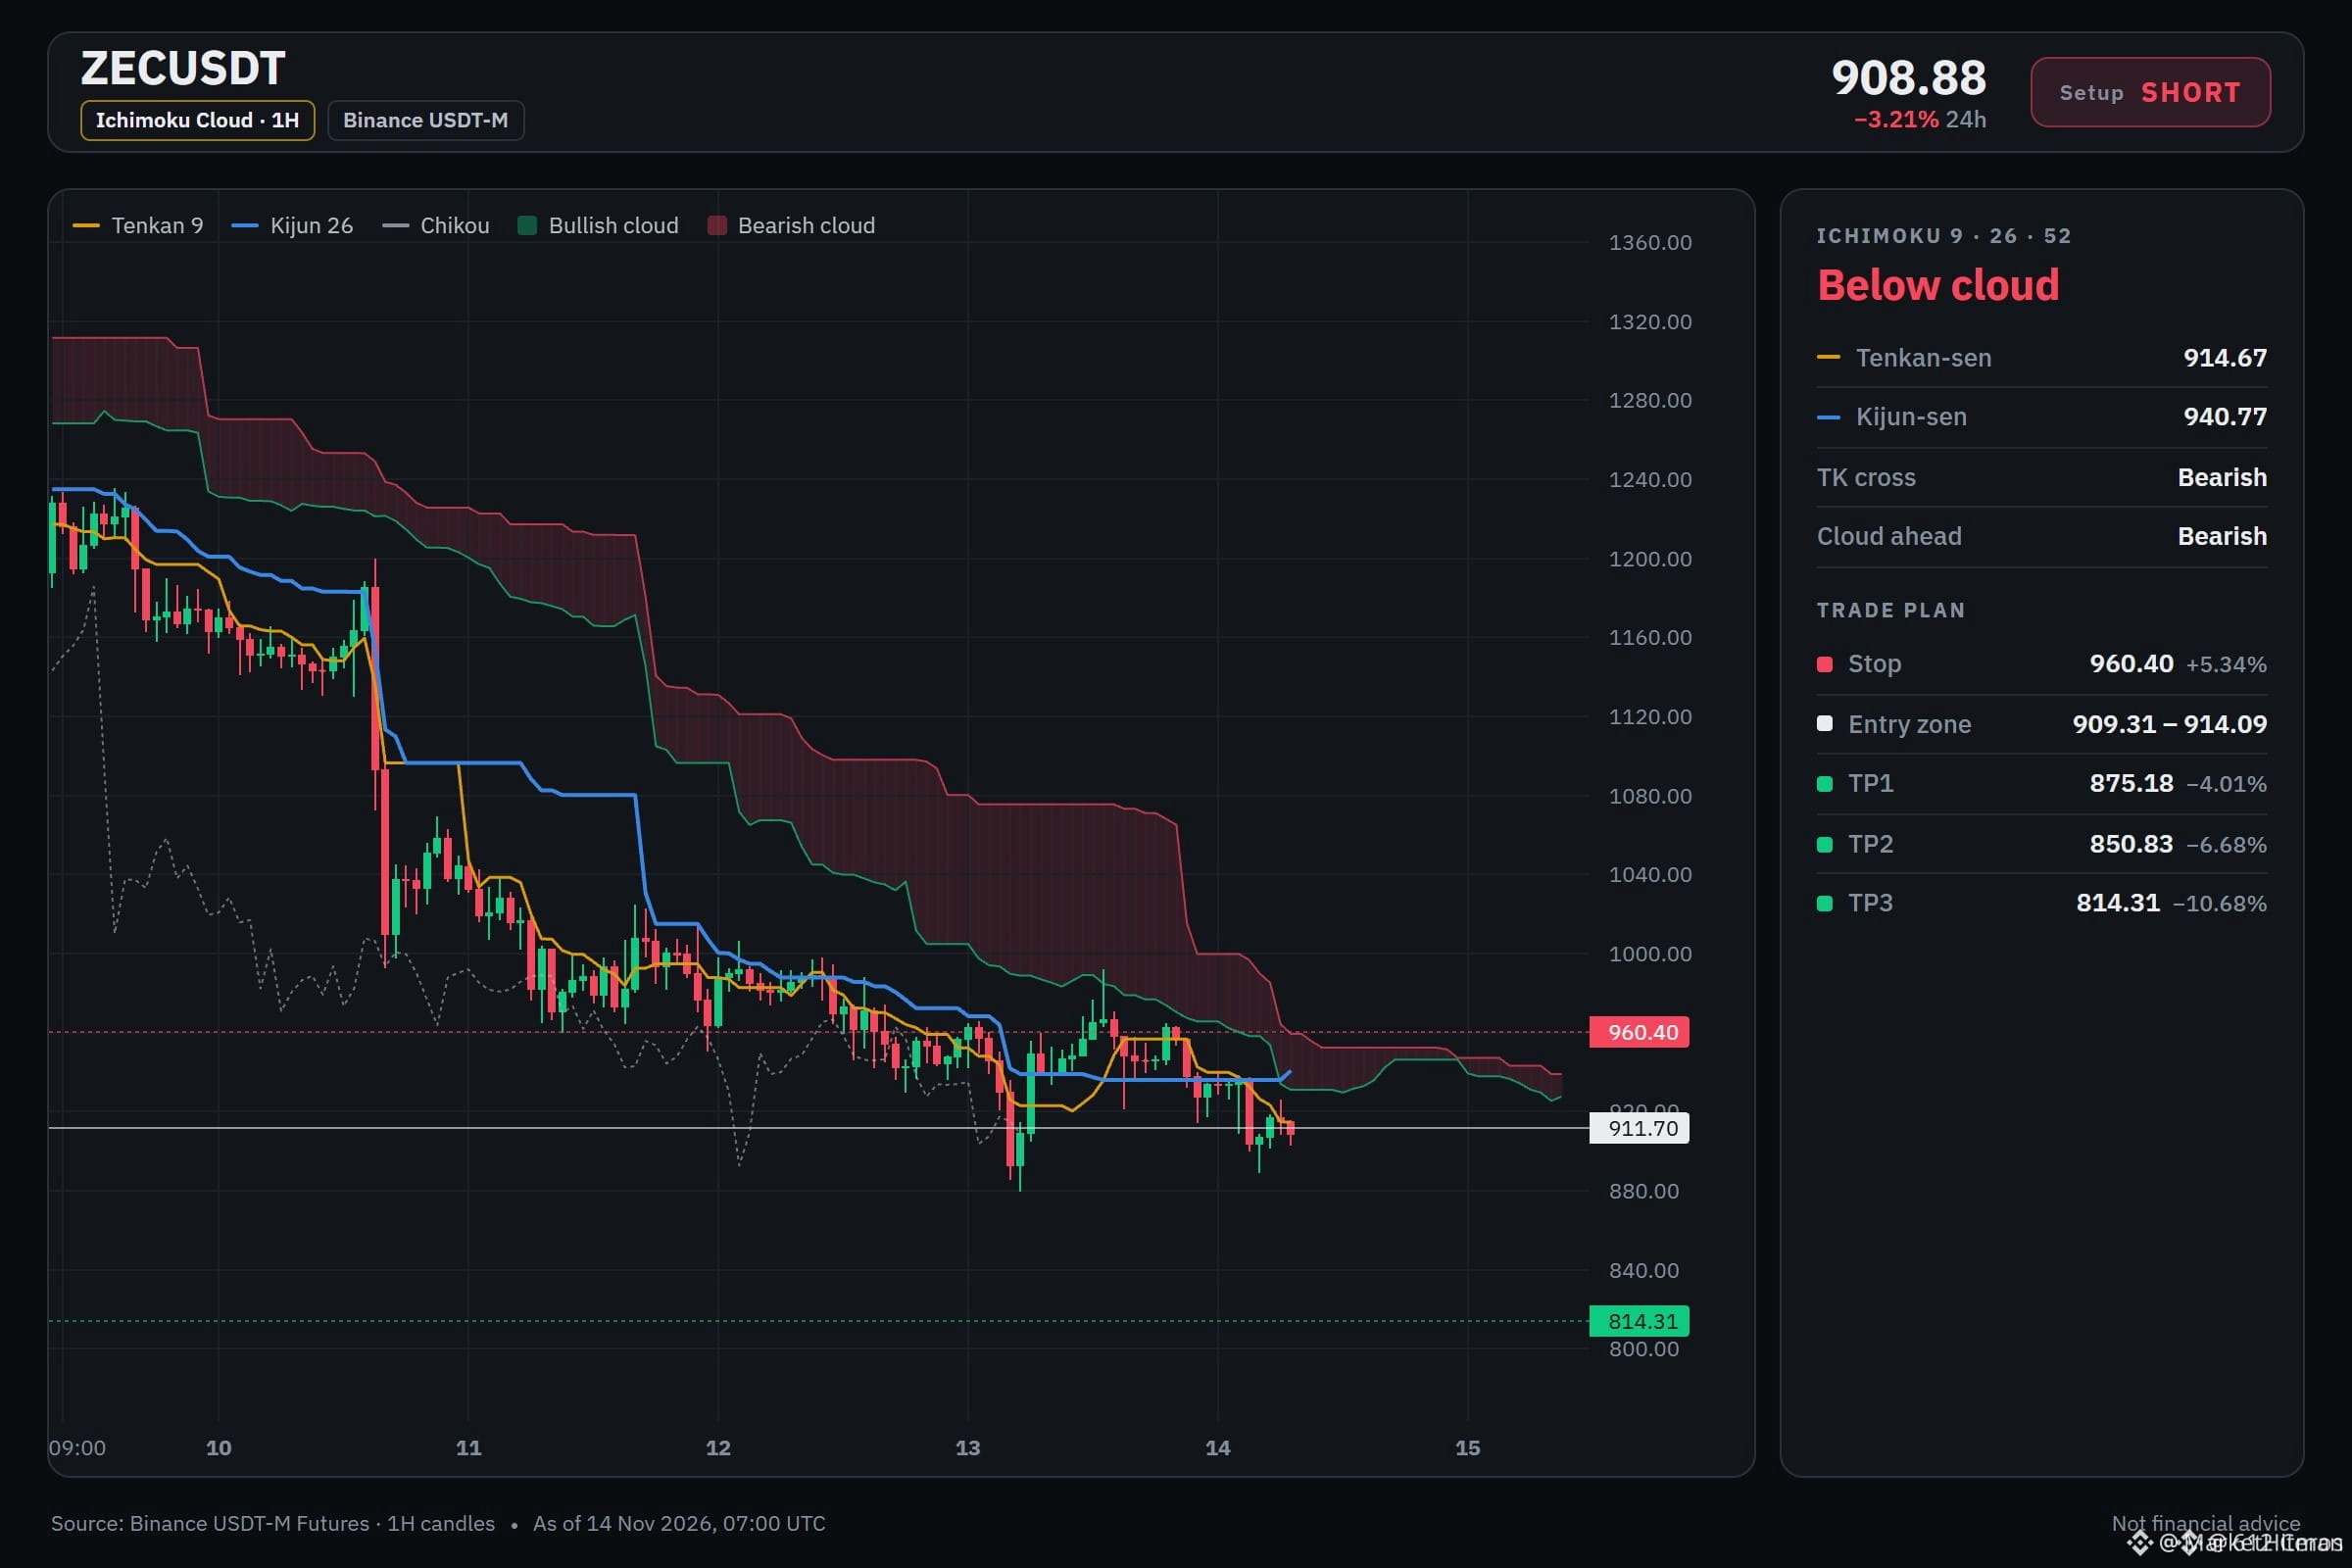
🔴 $ZEC BEARS CRUSHING THE MOVING AVERAGES FOR A CLEAN SHORT CONTINUATION! 📉
Entry: 909.31 – 914.09 ⚡
Target: 875.18 🚀
Stop Loss: 960.40 ⚠️
Price is pinned tightly beneath stacked 4h and 1h exponential moving averages, confirming sellers are firmly in control of the tape. Momentum indicators show zero relief for buyers as supply zones act like concrete ceilings. 📊
Execution is about scaling out cleanly at predefined targets while trailing protection upward as the breakdown accelerates. ⚡
💬 Are you riding this downward wave or waiting for a deeper flush? 👇
⚠️ Not financial advice. Always manage your risk. 🛡️
🏷️ #ZEC #ShortSetup #CryptoTrading #TrendAnalysis
🐻 📉
🔴 $ZEC BEARS CRUSHING THE MOVING AVERAGES FOR A CLEAN SHORT CONTINUATION! 📉
Entry: 909.31 – 914.09 ⚡
Target: 875.18 🚀
Stop Loss: 960.40 ⚠️
Price is pinned tightly beneath stacked 4h and 1h exponential moving averages, confirming sellers are firmly in control of the tape. Momentum indicators show zero relief for buyers as supply zones act like concrete ceilings. 📊
Execution is about scaling out cleanly at predefined targets while trailing protection upward as the breakdown accelerates. ⚡
💬 Are you riding this downward wave or waiting for a deeper flush? 👇
⚠️ Not financial advice. Always manage your risk. 🛡️
🏷️ #ZEC #ShortSetup #CryptoTrading #TrendAnalysis
🐻 📉
Entry: 909.31 – 914.09 ⚡
Target: 875.18 🚀
Stop Loss: 960.40 ⚠️
Price is pinned tightly beneath stacked 4h and 1h exponential moving averages, confirming sellers are firmly in control of the tape. Momentum indicators show zero relief for buyers as supply zones act like concrete ceilings. 📊
Execution is about scaling out cleanly at predefined targets while trailing protection upward as the breakdown accelerates. ⚡
💬 Are you riding this downward wave or waiting for a deeper flush? 👇
⚠️ Not financial advice. Always manage your risk. 🛡️
🏷️ #ZEC #ShortSetup #CryptoTrading #TrendAnalysis
🐻 📉
10
·
--
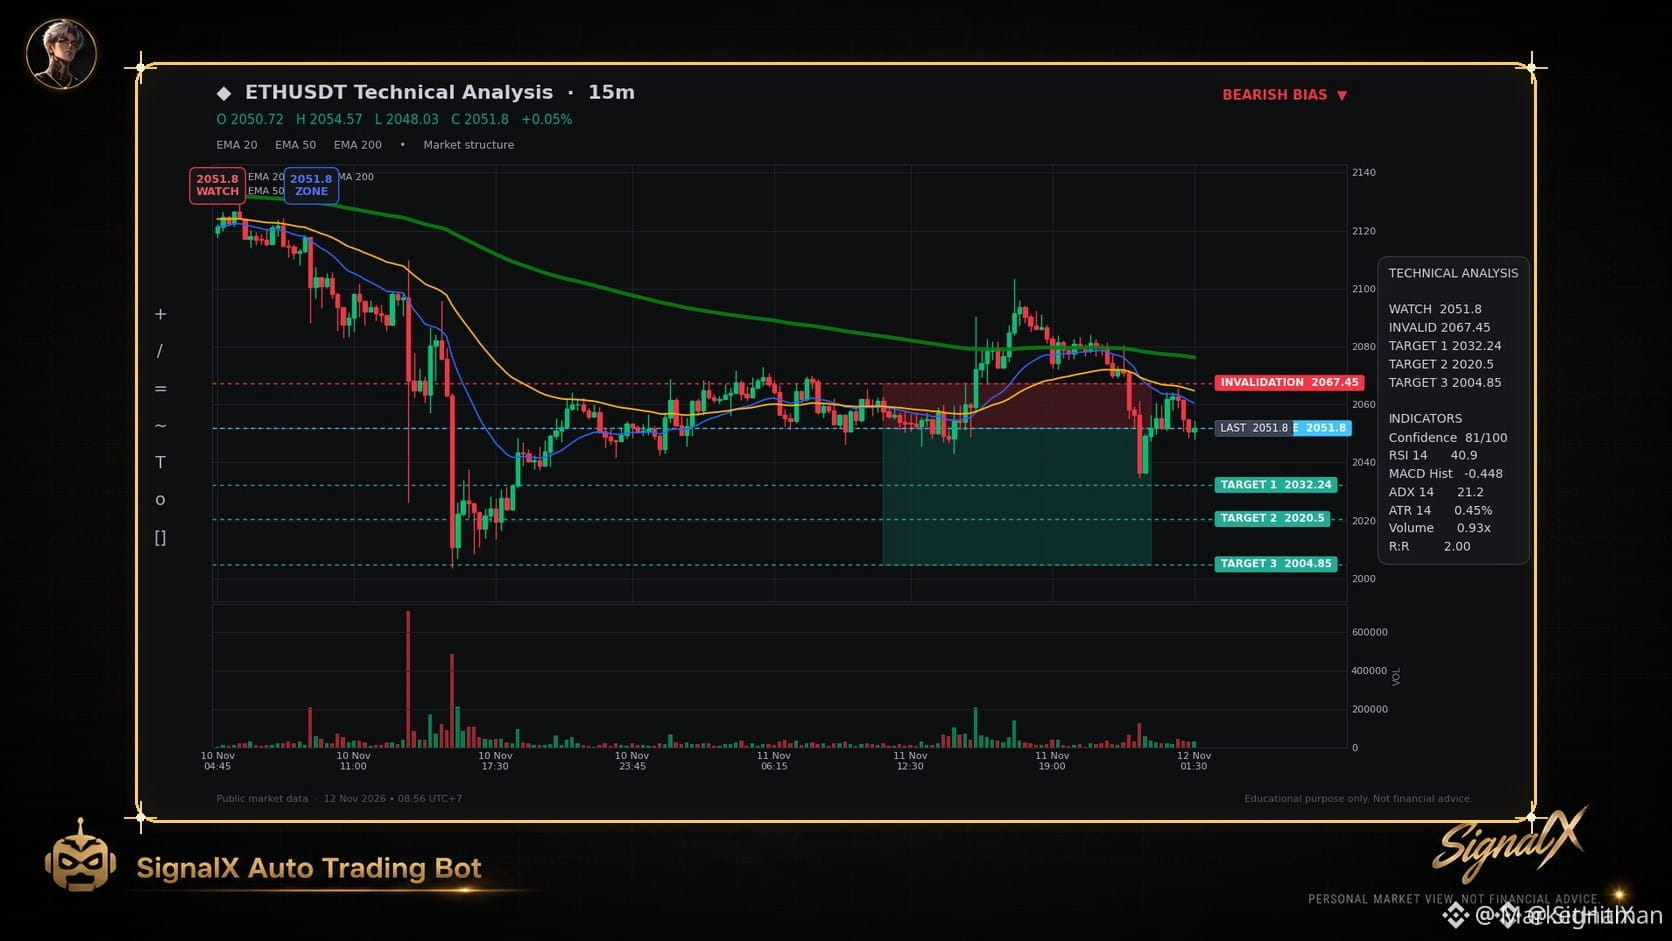
🔴 $ETH BEARS CRUSHING THE EMA STACK AS MOMENTUM SLIDES SOUTH! 📉
Entry: 2051.8 ⚡
Target: 2020.5 🚀
Stop Loss: 2067.45 ⚠️
Sellers are firmly guarding the upper bounds as price slips cleanly beneath the crucial 200 moving average. The short-term moving average cascade confirms structural weakness while momentum oscillators hover in deeply defensive territory. 📊
With volume gently fading and negative histogram expansion pressing down hard, continuation lower remains the path of least resistance. ⚡ Are you fading this minor pullback or waiting for a breakdown confirmation below current support? 👇
⚠️ Not financial advice. Always manage your risk. 🛡️
🏷️ #ETH #ShortSetup #CryptoTrading #TrendAnalysis
🔴 📉
🔴 $ETH BEARS CRUSHING THE EMA STACK AS MOMENTUM SLIDES SOUTH! 📉
Entry: 2051.8 ⚡
Target: 2020.5 🚀
Stop Loss: 2067.45 ⚠️
Sellers are firmly guarding the upper bounds as price slips cleanly beneath the crucial 200 moving average. The short-term moving average cascade confirms structural weakness while momentum oscillators hover in deeply defensive territory. 📊
With volume gently fading and negative histogram expansion pressing down hard, continuation lower remains the path of least resistance. ⚡ Are you fading this minor pullback or waiting for a breakdown confirmation below current support? 👇
⚠️ Not financial advice. Always manage your risk. 🛡️
🏷️ #ETH #ShortSetup #CryptoTrading #TrendAnalysis
🔴 📉
Entry: 2051.8 ⚡
Target: 2020.5 🚀
Stop Loss: 2067.45 ⚠️
Sellers are firmly guarding the upper bounds as price slips cleanly beneath the crucial 200 moving average. The short-term moving average cascade confirms structural weakness while momentum oscillators hover in deeply defensive territory. 📊
With volume gently fading and negative histogram expansion pressing down hard, continuation lower remains the path of least resistance. ⚡ Are you fading this minor pullback or waiting for a breakdown confirmation below current support? 👇
⚠️ Not financial advice. Always manage your risk. 🛡️
🏷️ #ETH #ShortSetup #CryptoTrading #TrendAnalysis
🔴 📉
10

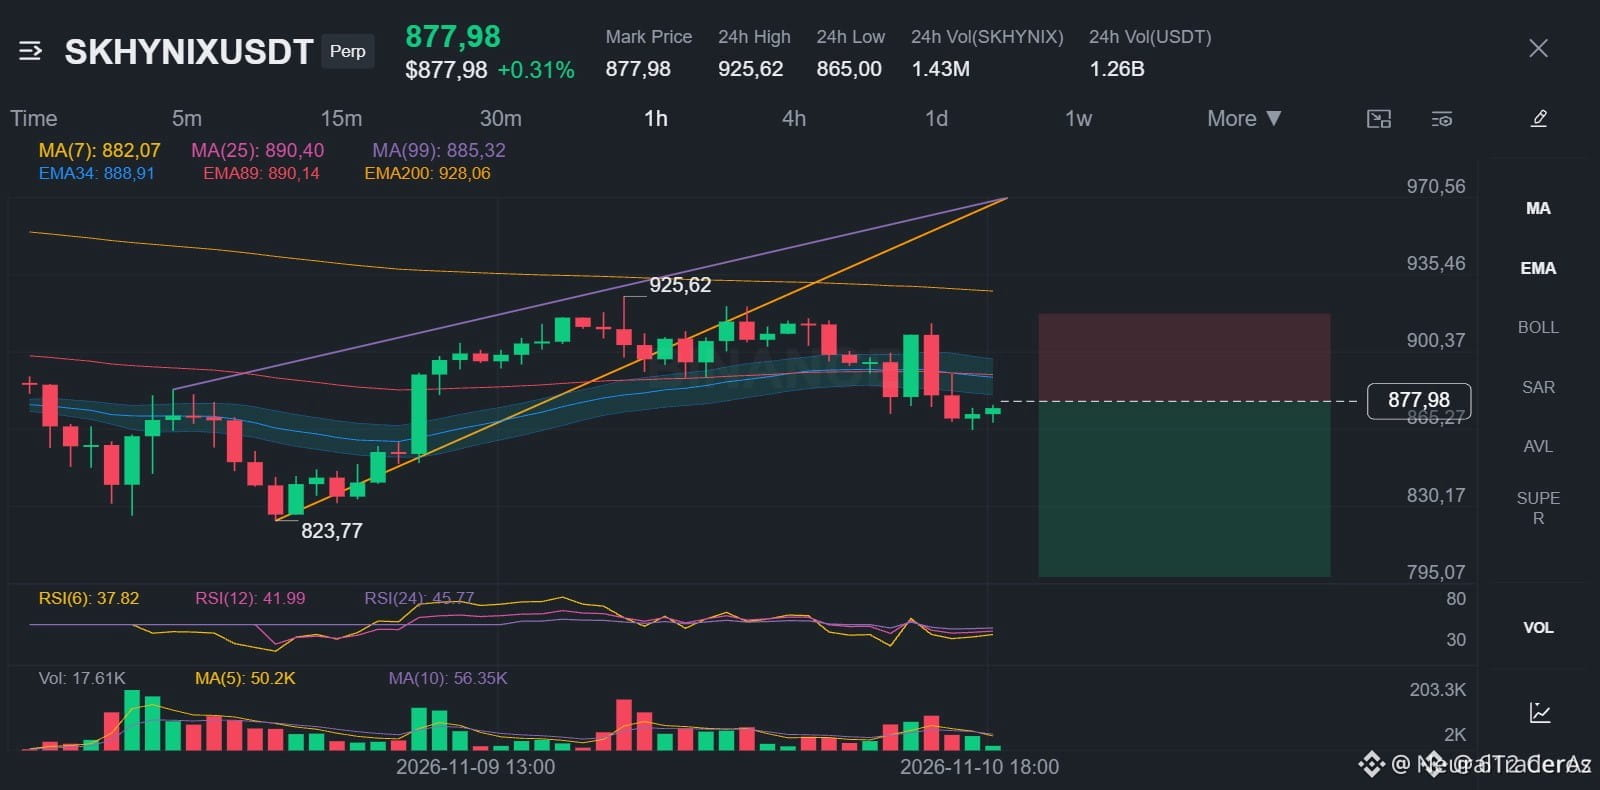
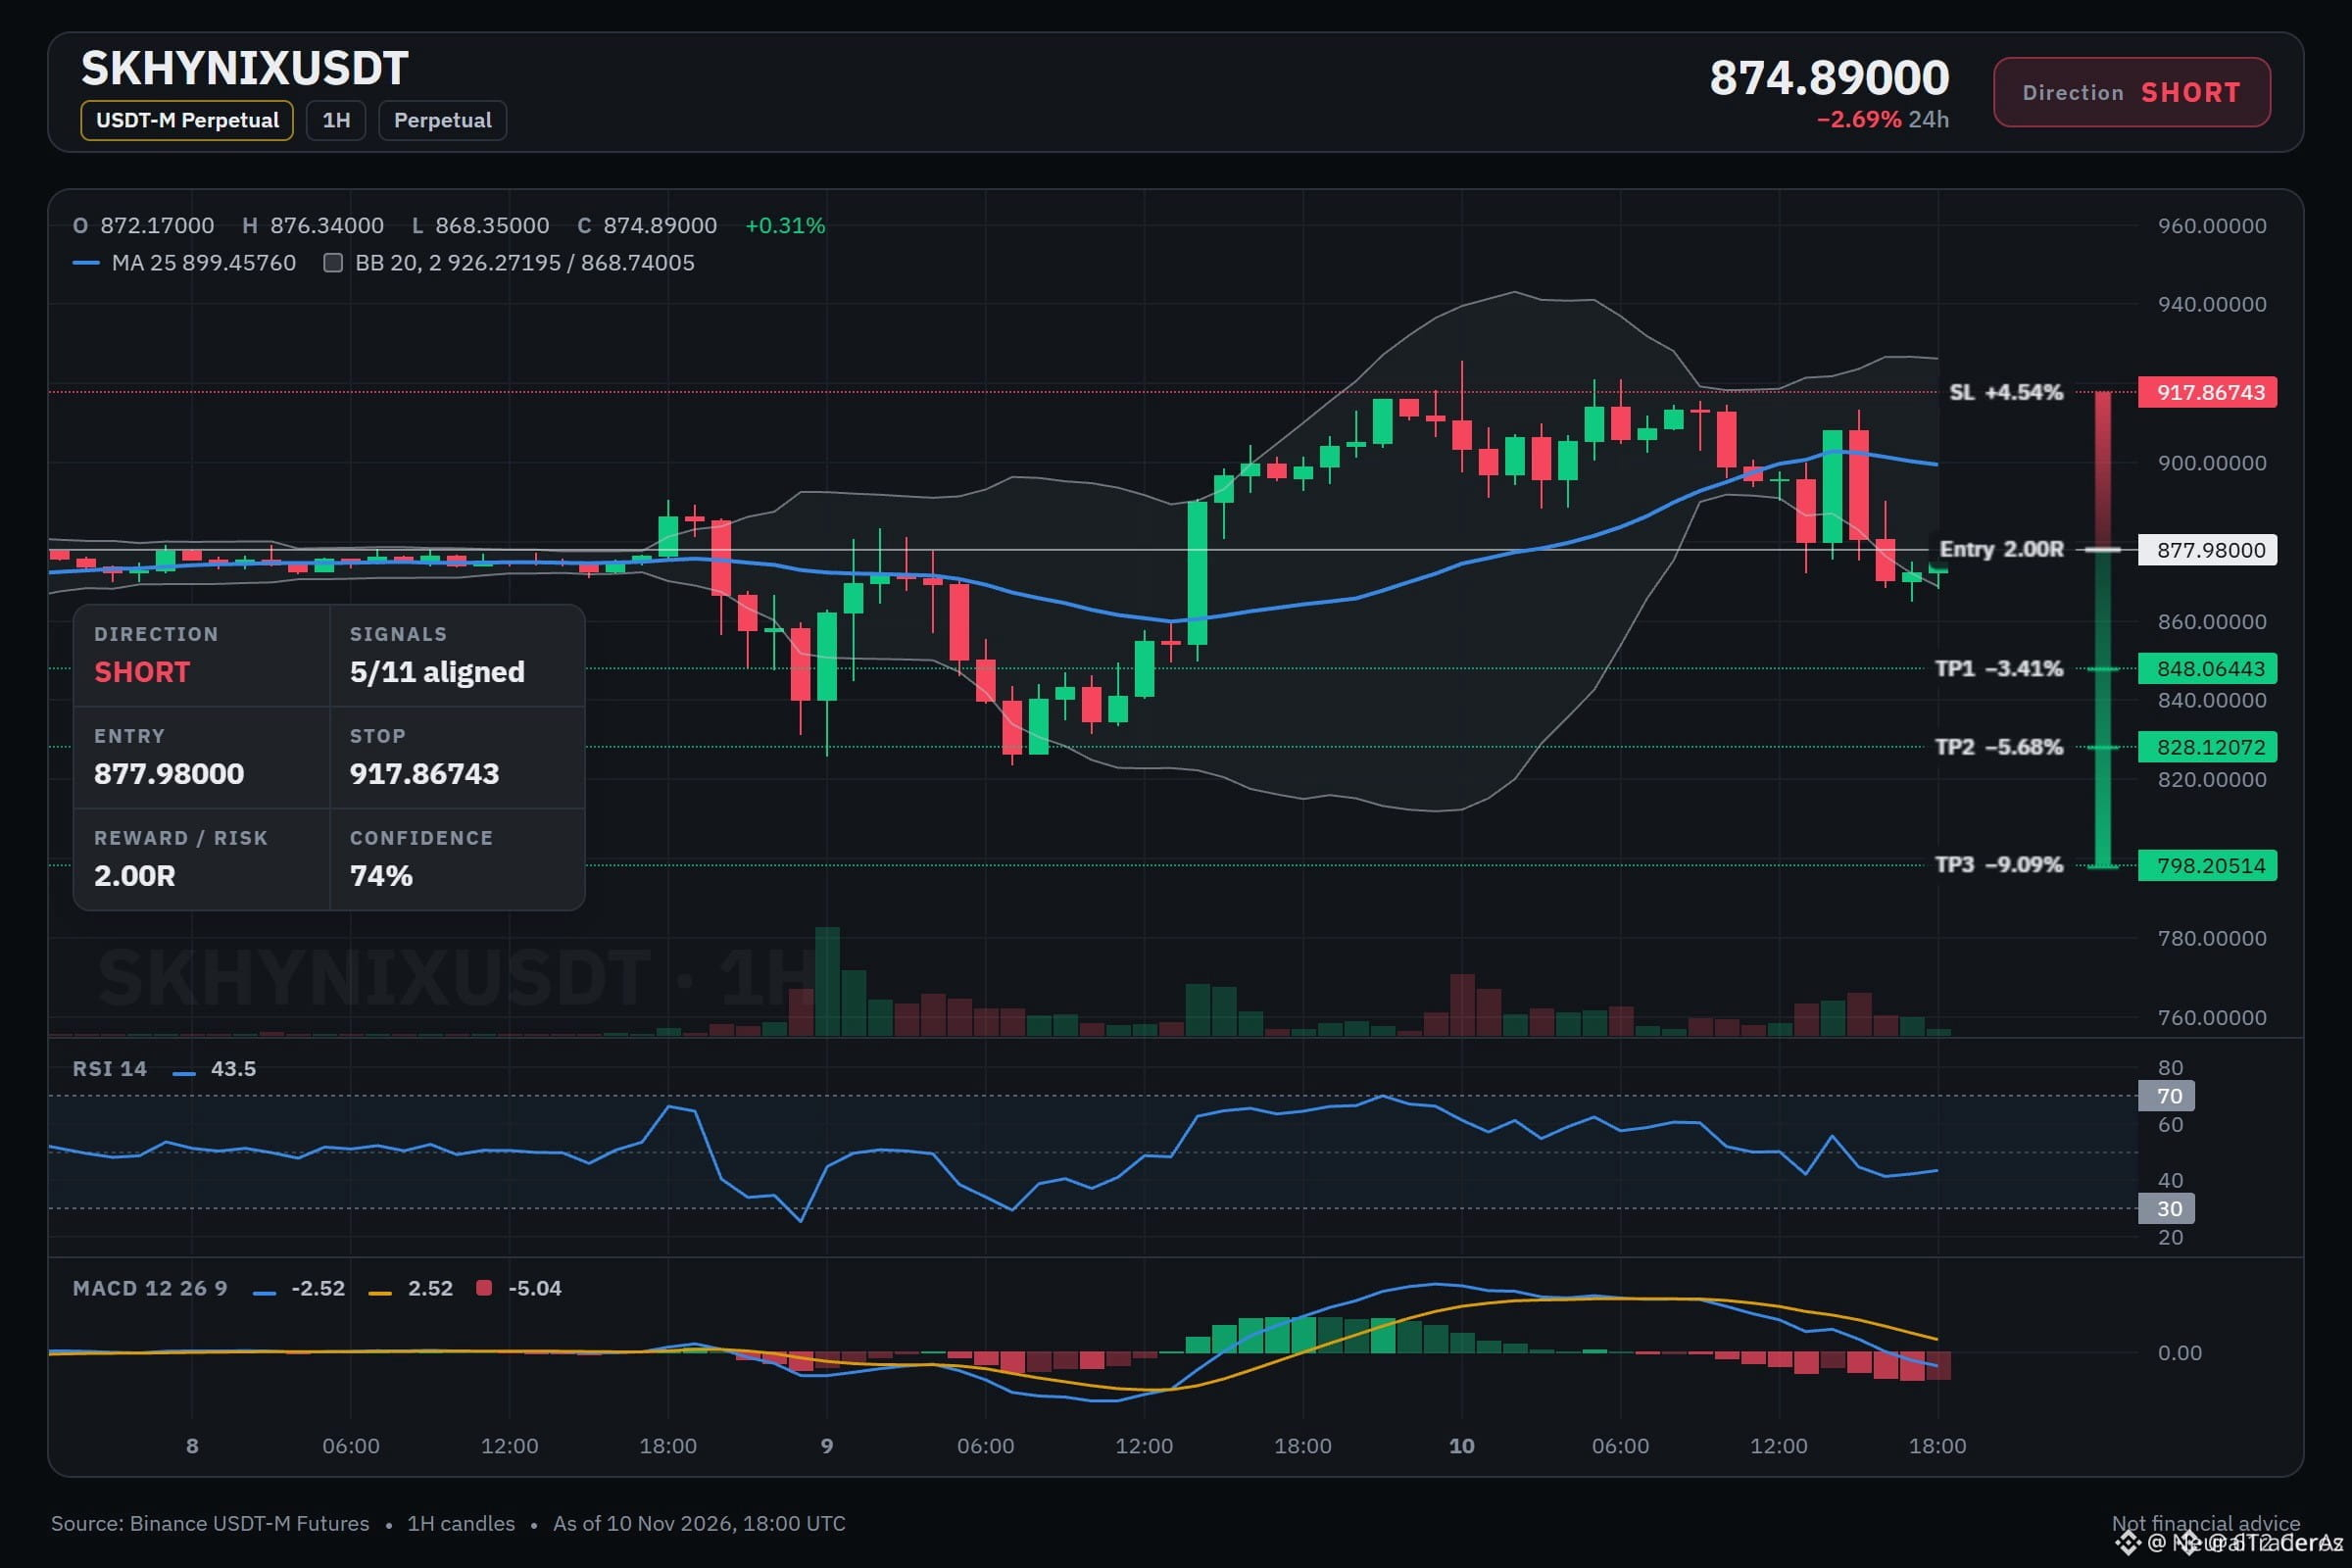
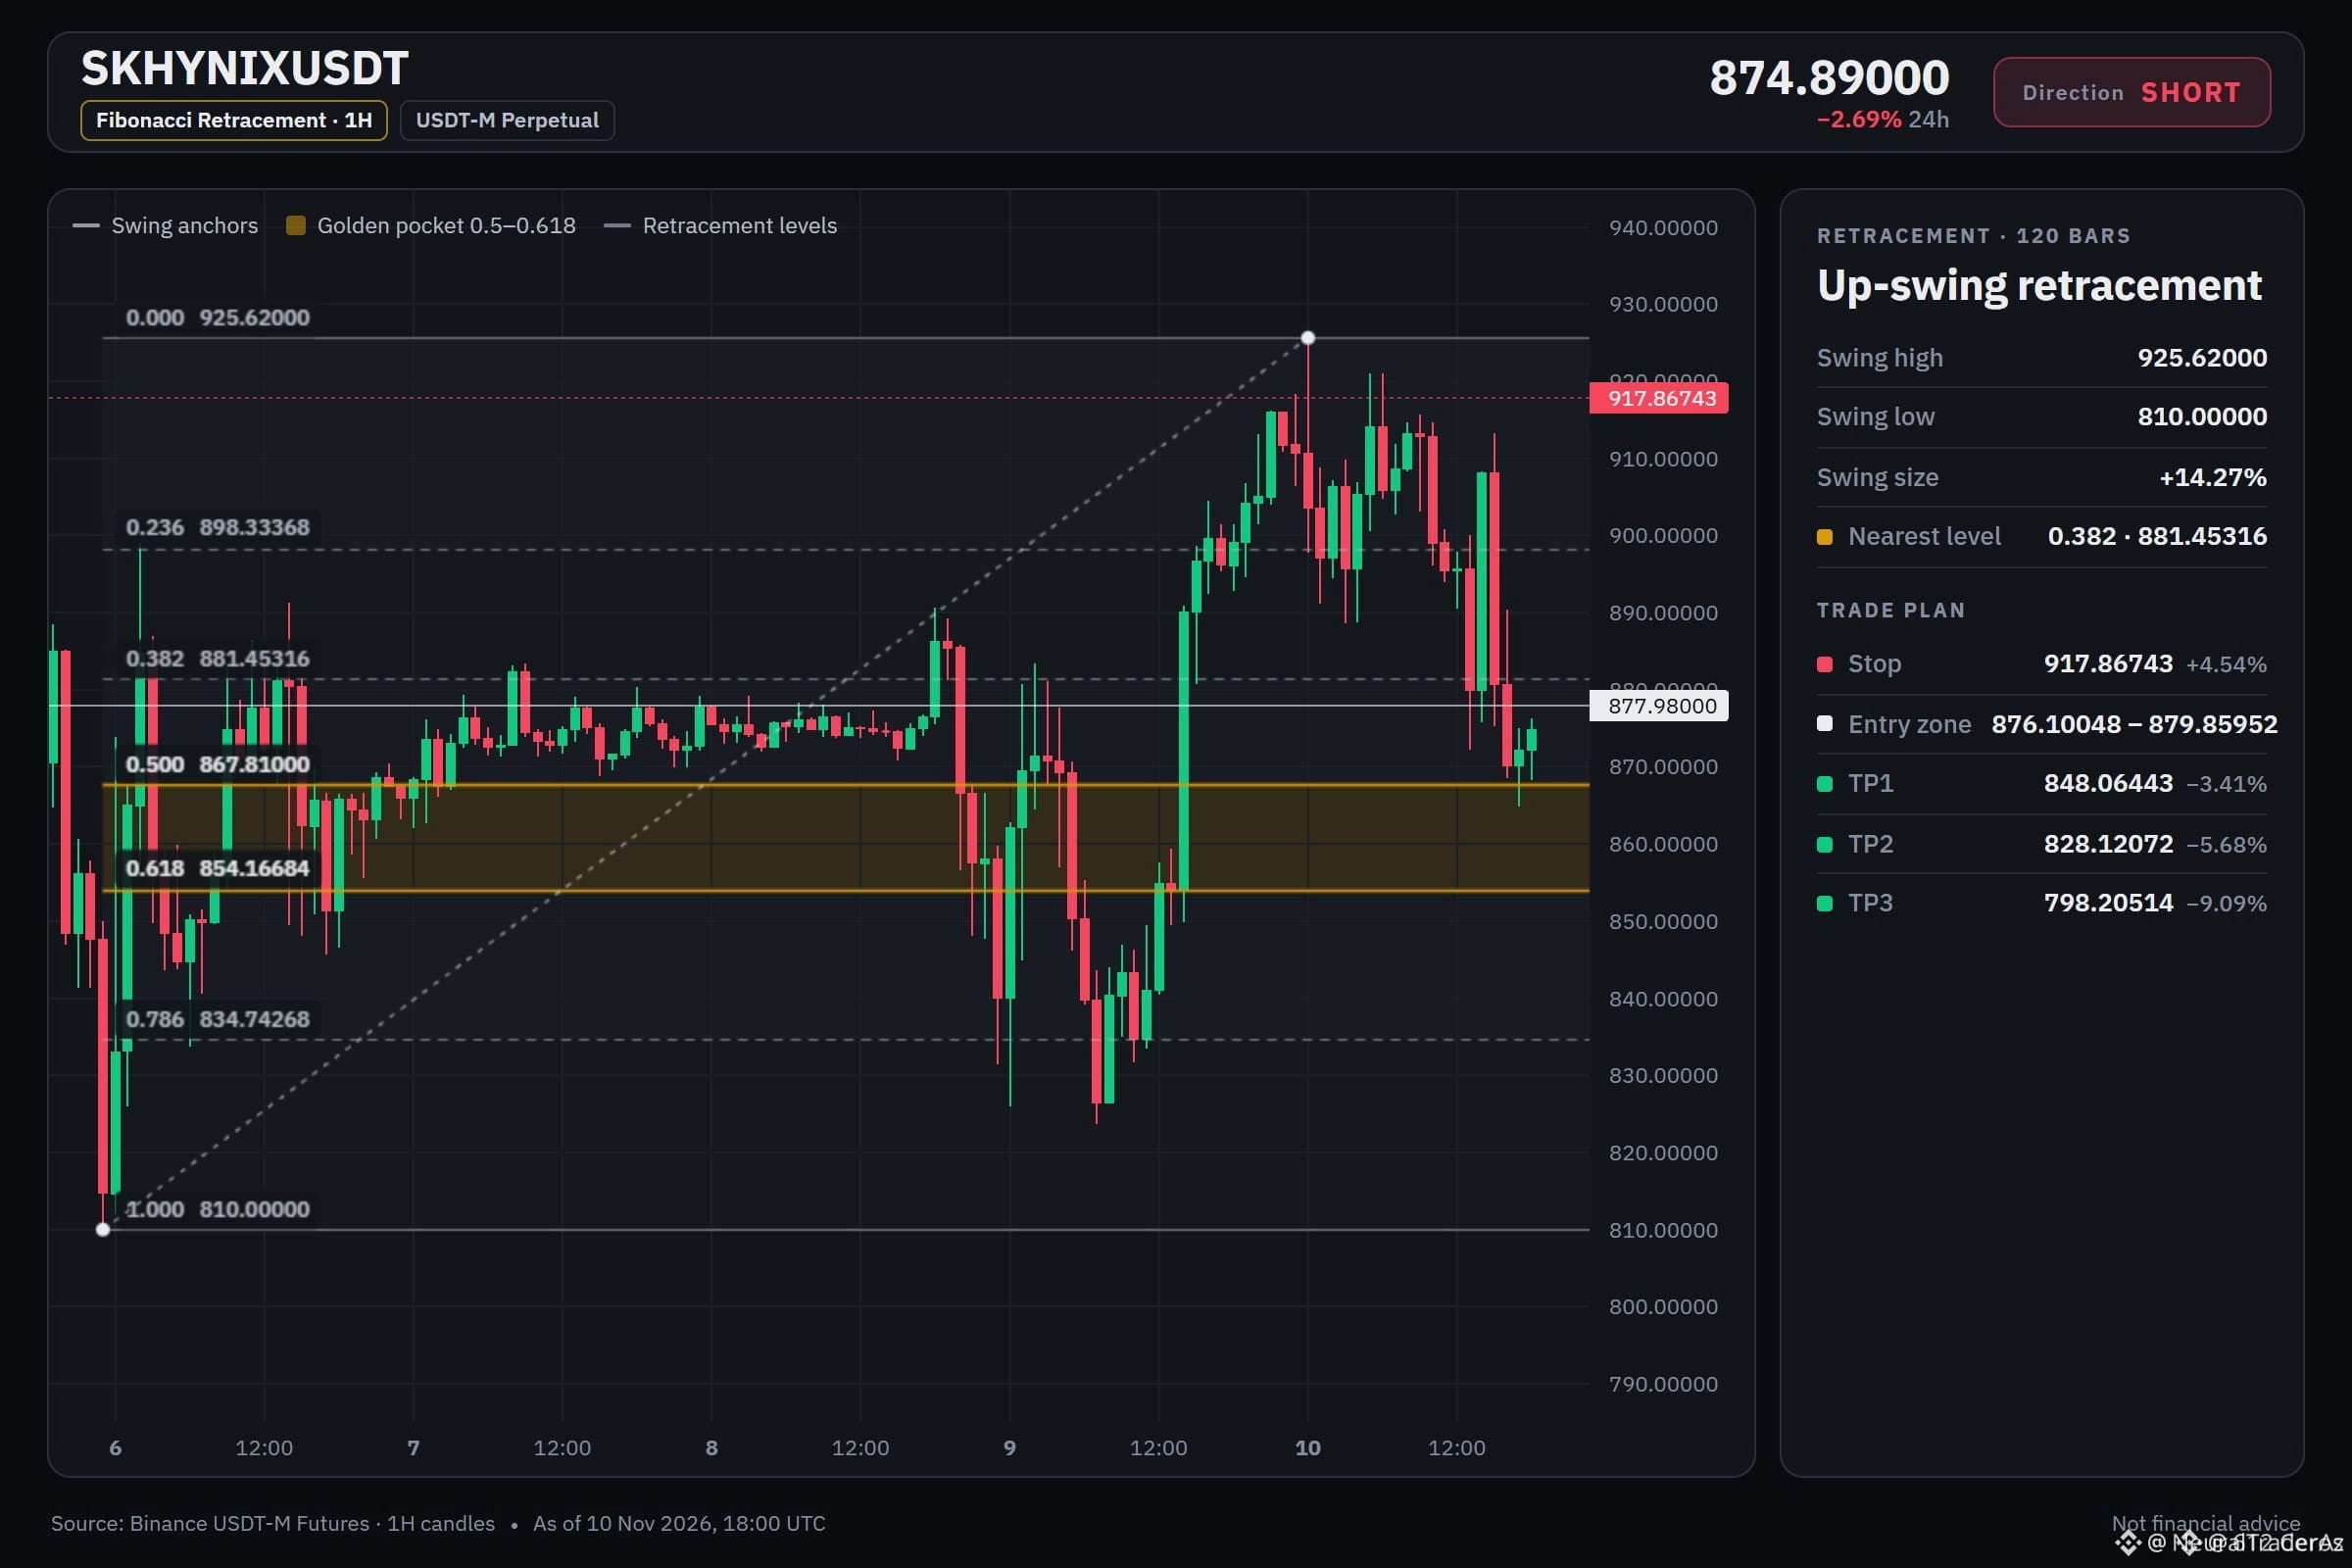
🔴 $SKHYNIX LOSING KEY STRUCTURAL SUPPORT BENEATH BEARISH INSTITUTIONAL MOVING AVERAGE STACKS 📉
Entry: 876.10048 – 879.85952 ⚡
Target: 848.06443 🎯
Stop Loss: 917.86743 ⚠️
Price action on the higher timeframe reveals a textbook bearish distribution as quotes remain pinned below the crucial exponential averages. 📊 Institutional order flow continues to favor supply retests for continuation lower into previous liquidity pools. 💡
Given the moderate structural conviction, position sizing should remain conservative while managing risk tightly above the invalidation barrier. 📌 Do you see more room to the downside from the entry zone? 👇
⚠️ Not financial advice. Always manage your risk. 🛡️
🏷️ #SKHYNIX #ShortSetup #TrendAnalysis #Crypto
📉 🐻
🔴 $SKHYNIX LOSING KEY STRUCTURAL SUPPORT BENEATH BEARISH INSTITUTIONAL MOVING AVERAGE STACKS 📉
Entry: 876.10048 – 879.85952 ⚡
Target: 848.06443 🎯
Stop Loss: 917.86743 ⚠️
Price action on the higher timeframe reveals a textbook bearish distribution as quotes remain pinned below the crucial exponential averages. 📊 Institutional order flow continues to favor supply retests for continuation lower into previous liquidity pools. 💡
Given the moderate structural conviction, position sizing should remain conservative while managing risk tightly above the invalidation barrier. 📌 Do you see more room to the downside from the entry zone? 👇
⚠️ Not financial advice. Always manage your risk. 🛡️
🏷️ #SKHYNIX #ShortSetup #TrendAnalysis #Crypto
📉 🐻
Entry: 876.10048 – 879.85952 ⚡
Target: 848.06443 🎯
Stop Loss: 917.86743 ⚠️
Price action on the higher timeframe reveals a textbook bearish distribution as quotes remain pinned below the crucial exponential averages. 📊 Institutional order flow continues to favor supply retests for continuation lower into previous liquidity pools. 💡
Given the moderate structural conviction, position sizing should remain conservative while managing risk tightly above the invalidation barrier. 📌 Do you see more room to the downside from the entry zone? 👇
⚠️ Not financial advice. Always manage your risk. 🛡️
🏷️ #SKHYNIX #ShortSetup #TrendAnalysis #Crypto
📉 🐻
8
🚨 $NVDA TITANS SHAKE OFF THE NOISE AS BUYERS DEFEND THE TRENDLINE! ⚡
📊 Market giants live under a relentless microscope where every personal headline tries to dent structural momentum. 💡 True institutional leaders weather cyclical storms by staying focused on execution while weak hands panic at the noise.
🌊 When visionary founders own the narrative and keep building, smart money steps in to scoop the dip before the next structural leg up. 💬 Are you letting short-term FUD shake your conviction, or tracking the bigger trend? 👇
⚠️ Not financial advice. Always manage your risk. 🛡️
🏷️ #NVDA #MarketPsychology #Momentum #TrendAnalysis
🔥 💎
🚨 $NVDA TITANS SHAKE OFF THE NOISE AS BUYERS DEFEND THE TRENDLINE! ⚡
📊 Market giants live under a relentless microscope where every personal headline tries to dent structural momentum. 💡 True institutional leaders weather cyclical storms by staying focused on execution while weak hands panic at the noise.
🌊 When visionary founders own the narrative and keep building, smart money steps in to scoop the dip before the next structural leg up. 💬 Are you letting short-term FUD shake your conviction, or tracking the bigger trend? 👇
⚠️ Not financial advice. Always manage your risk. 🛡️
🏷️ #NVDA #MarketPsychology #Momentum #TrendAnalysis
🔥 💎
📊 Market giants live under a relentless microscope where every personal headline tries to dent structural momentum. 💡 True institutional leaders weather cyclical storms by staying focused on execution while weak hands panic at the noise.
🌊 When visionary founders own the narrative and keep building, smart money steps in to scoop the dip before the next structural leg up. 💬 Are you letting short-term FUD shake your conviction, or tracking the bigger trend? 👇
⚠️ Not financial advice. Always manage your risk. 🛡️
🏷️ #NVDA #MarketPsychology #Momentum #TrendAnalysis
🔥 💎

19

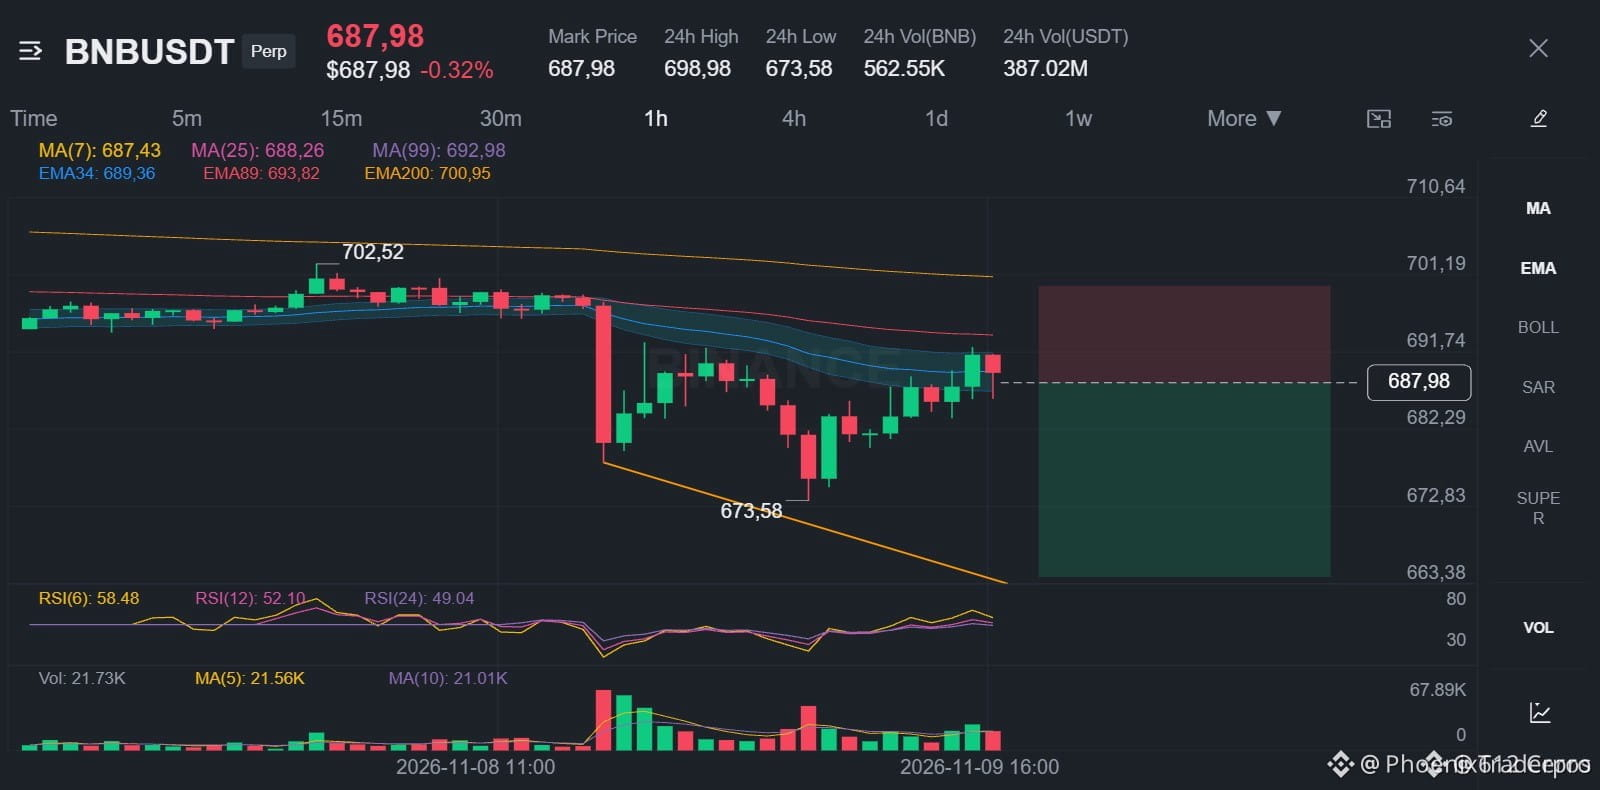
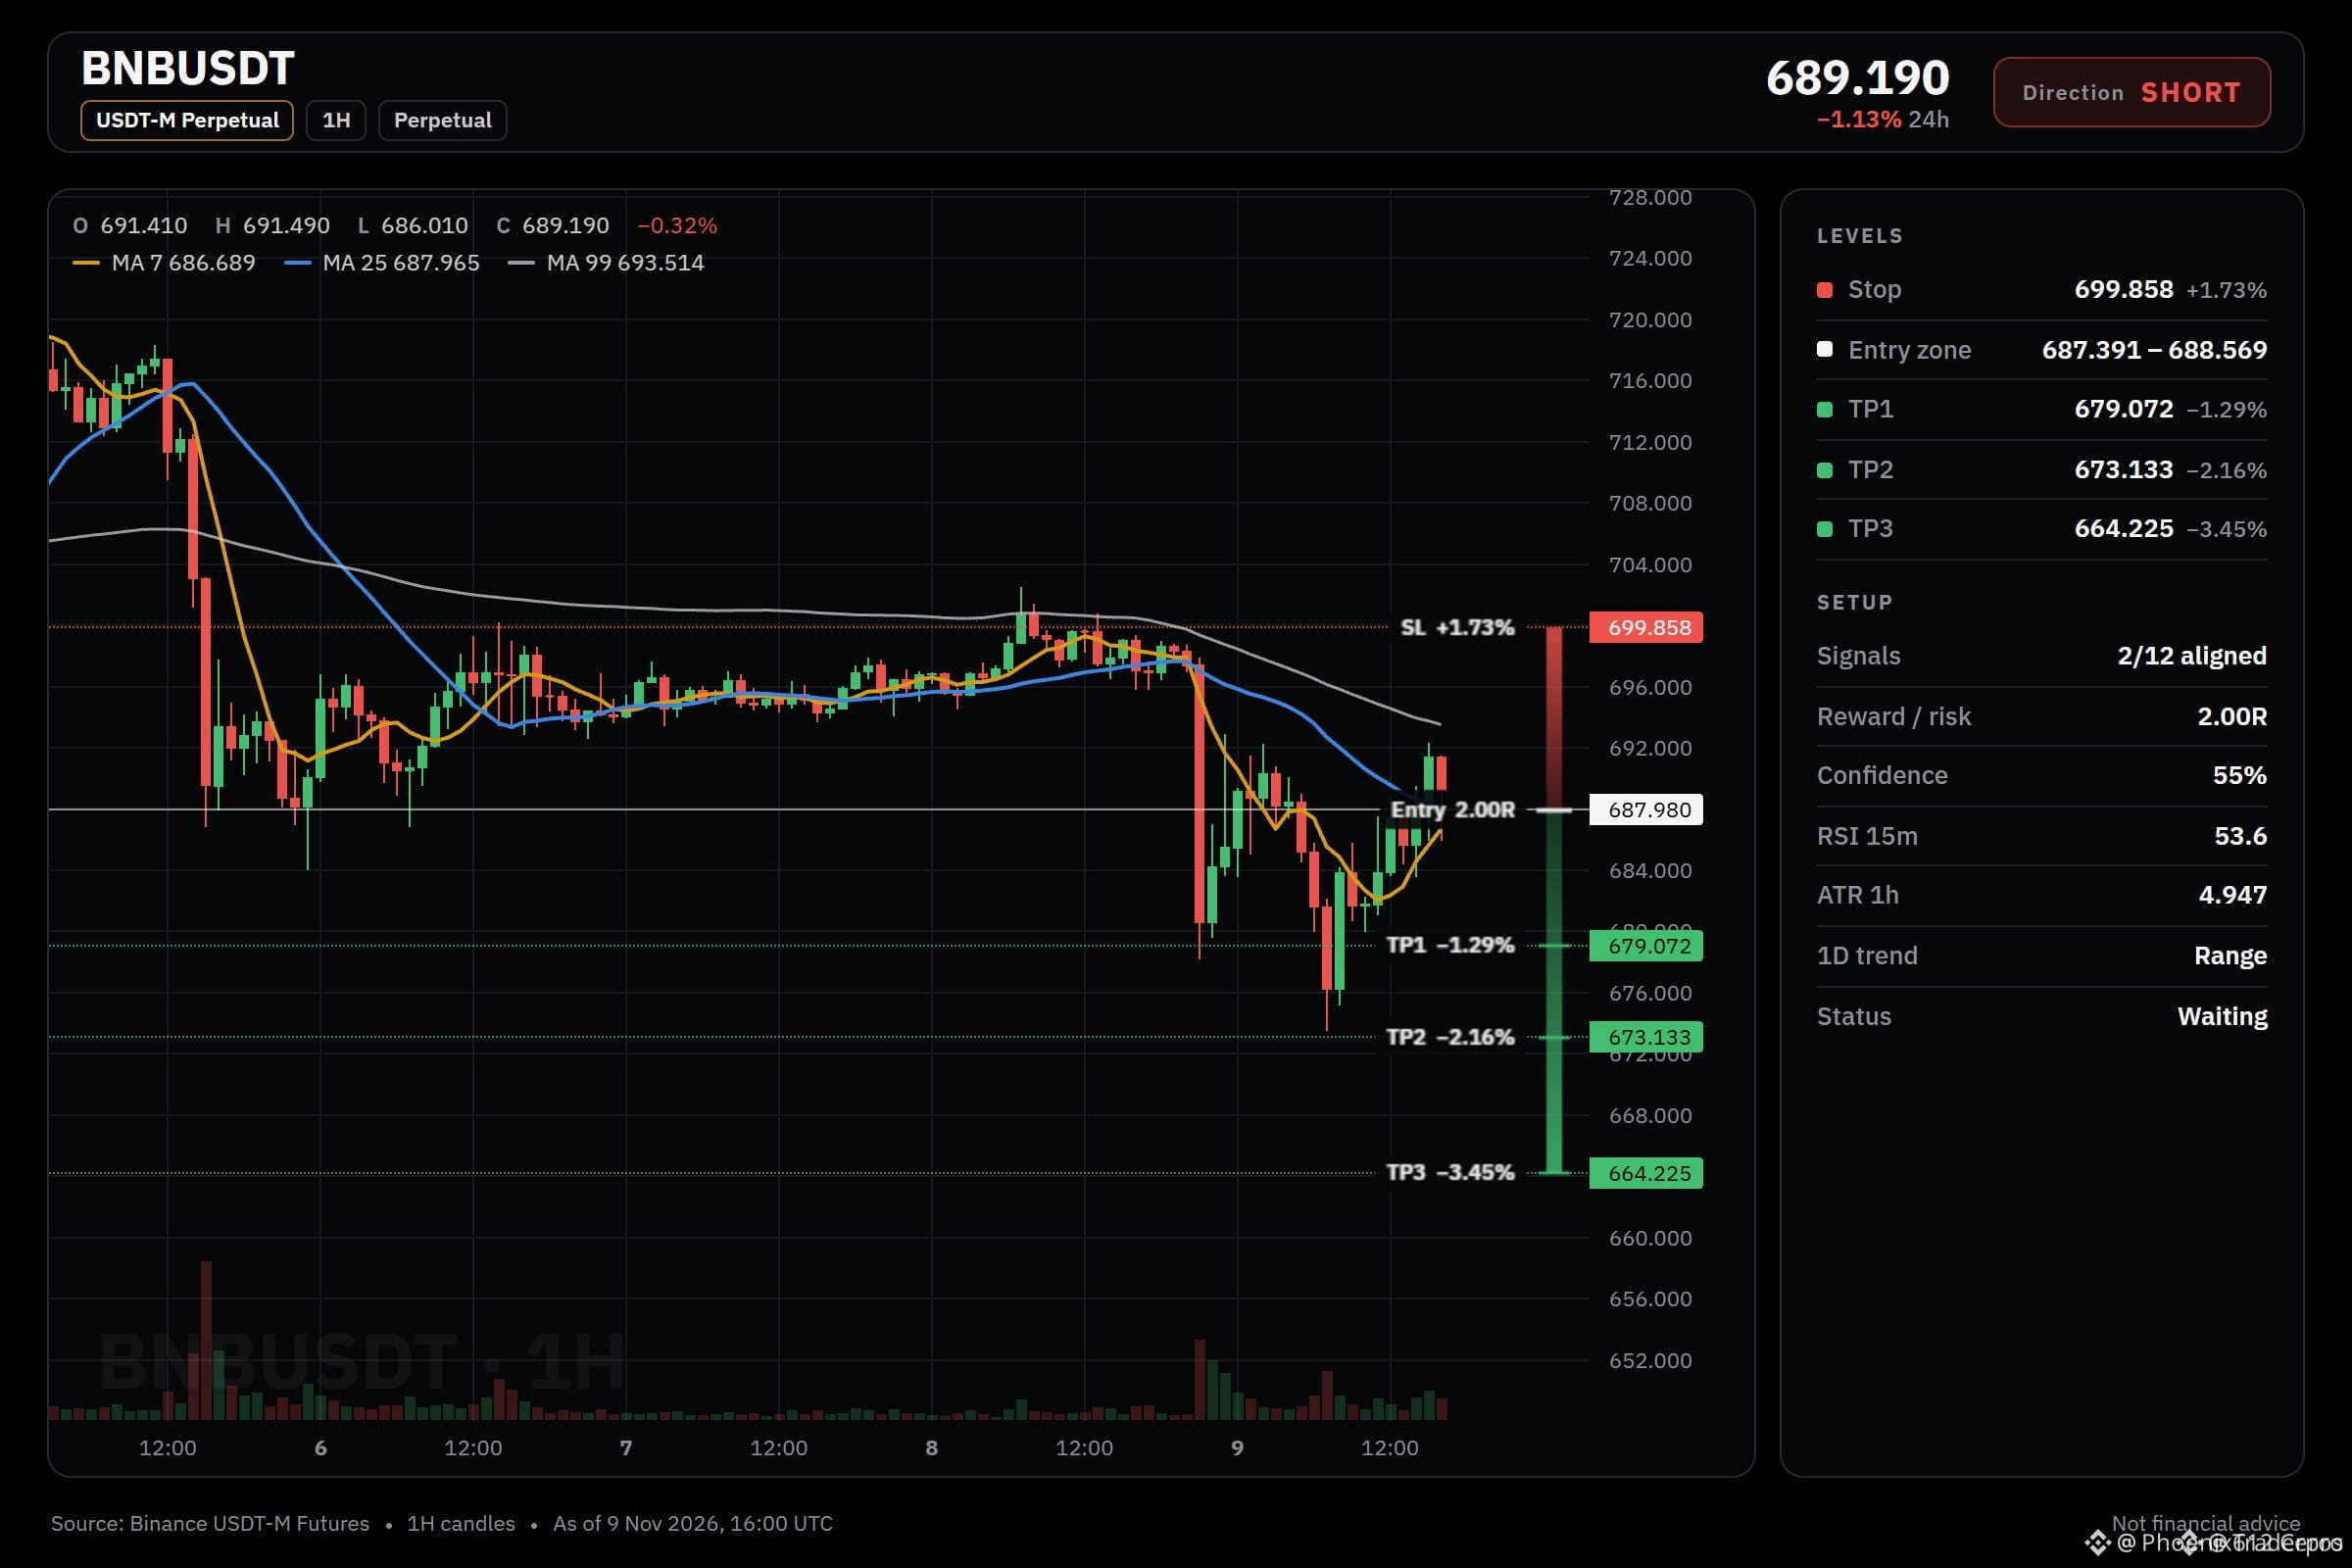
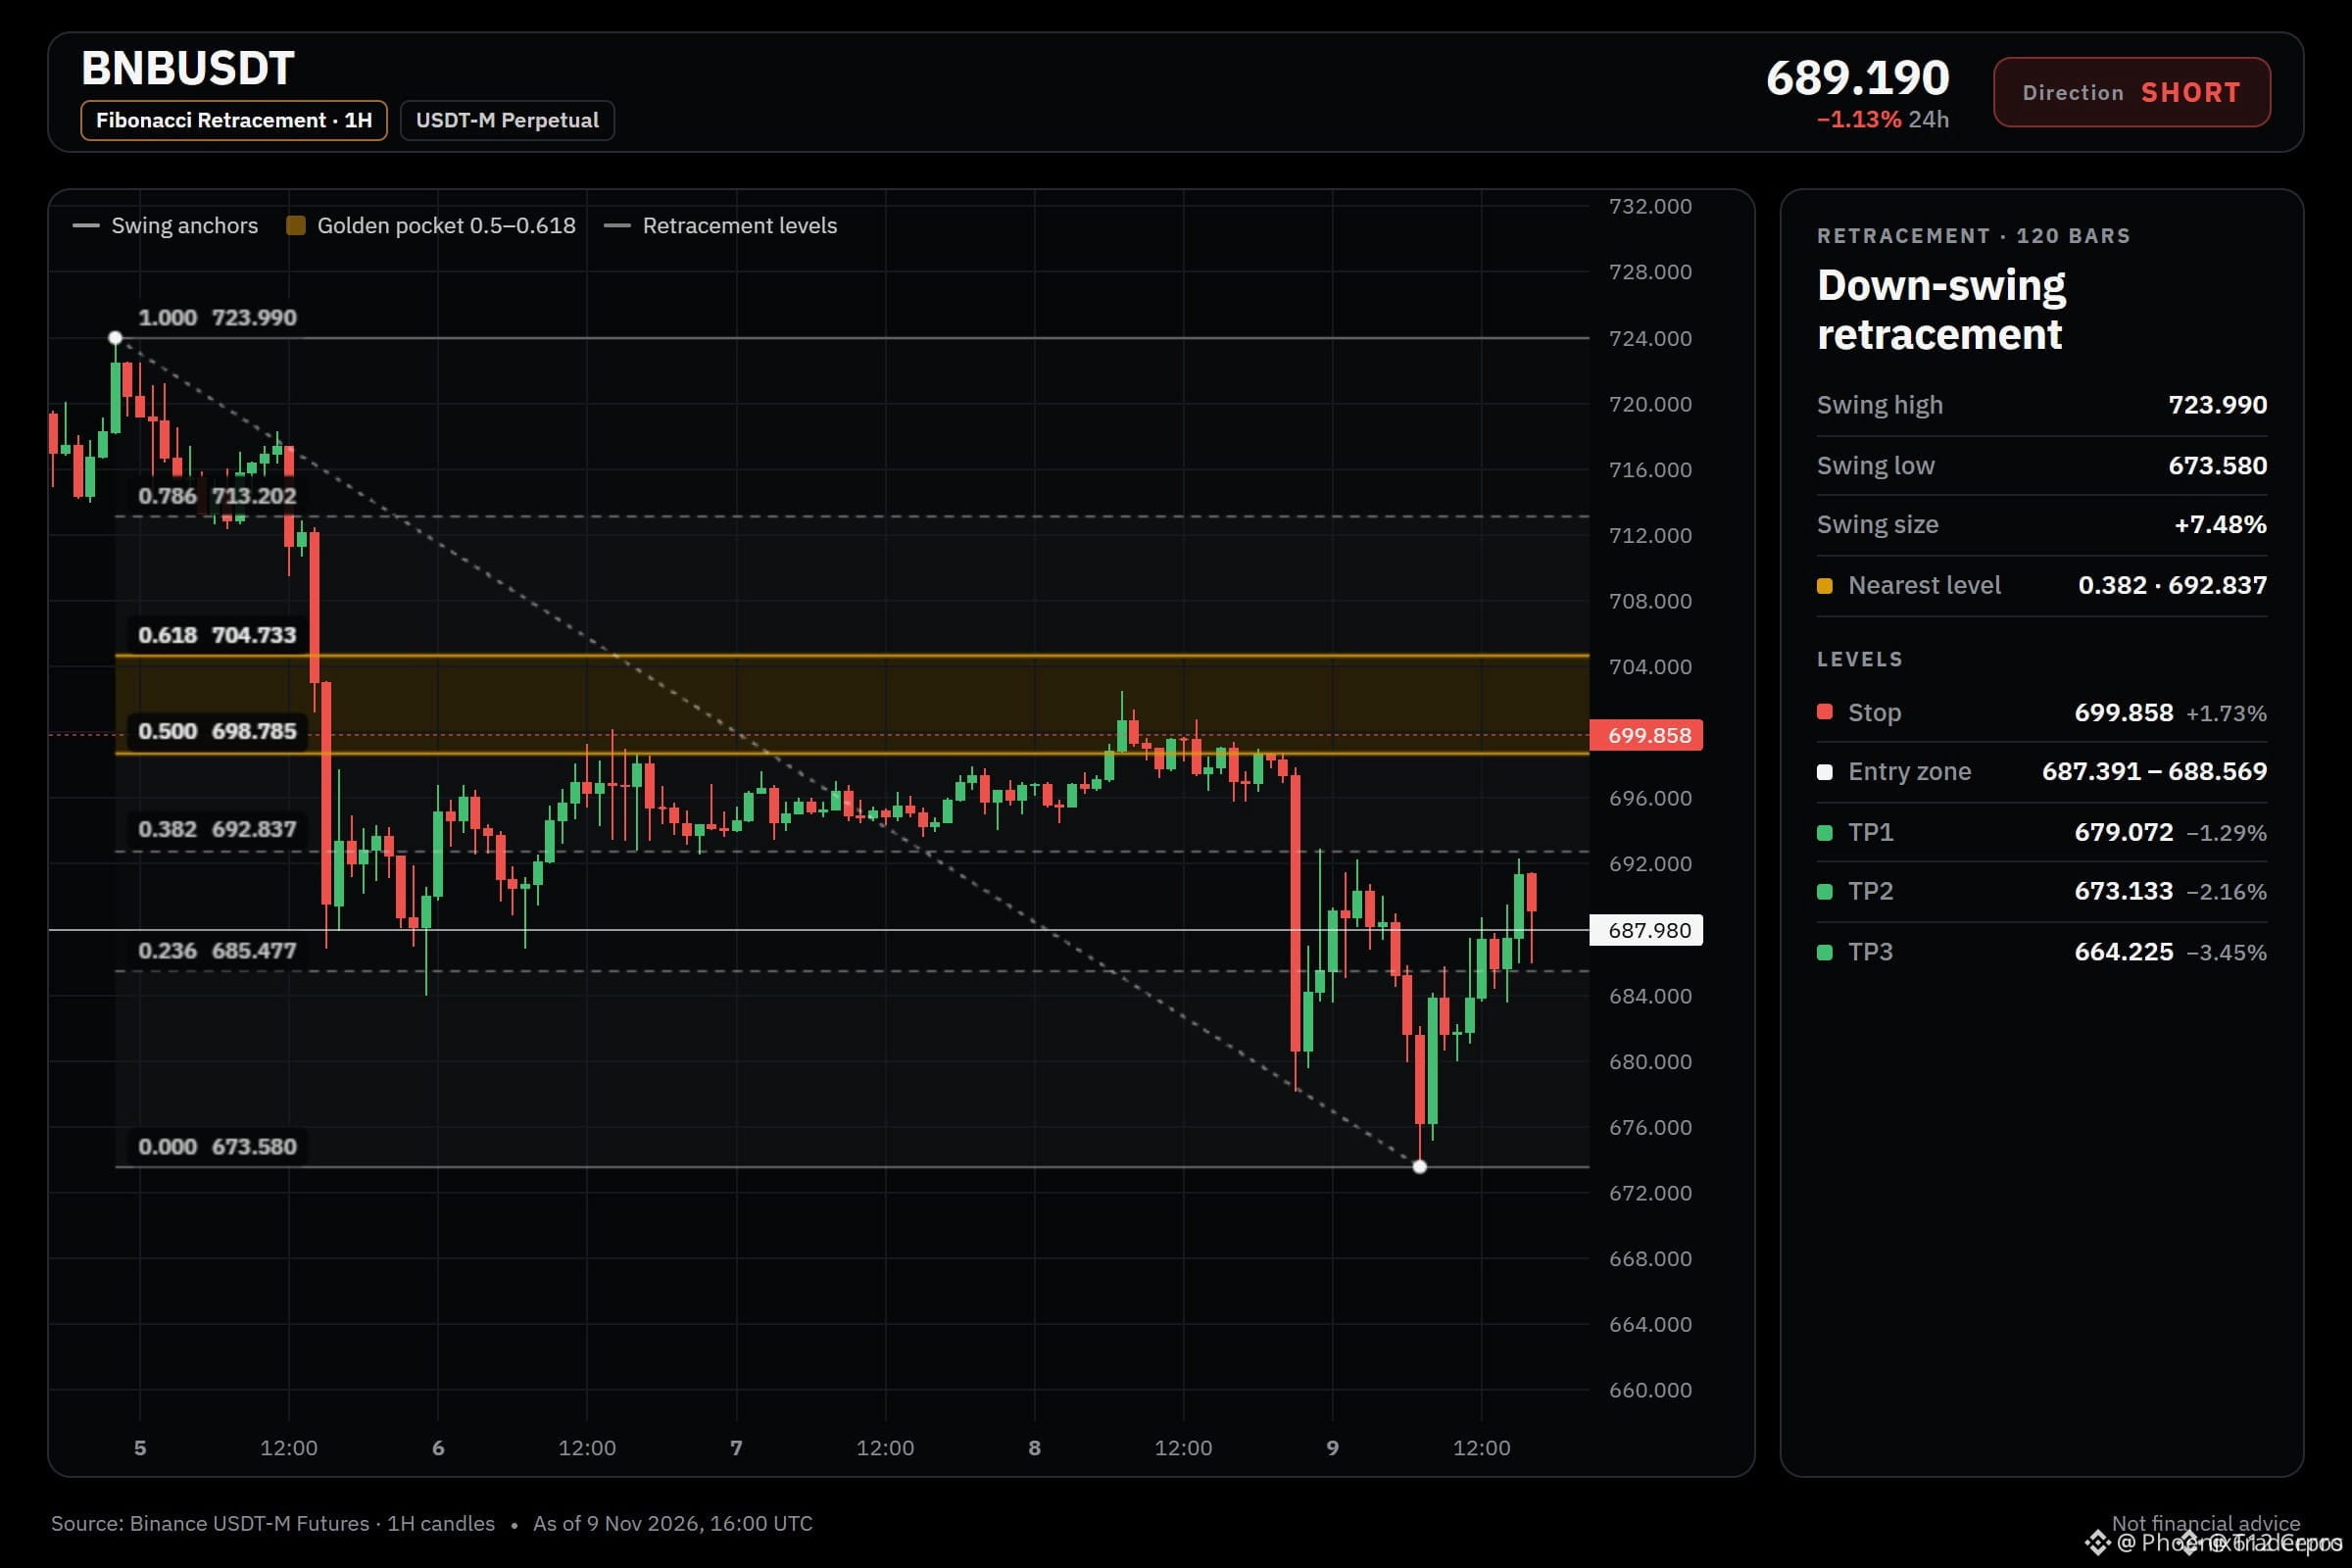
BEARISH STACK ON $BNB AS SELLERS DEFEND MAJOR RESISTANCE ZONES! 📉🐻
Entry: 687.391 – 688.569 ⚡
Target: 664.225 🚀
Stop Loss: 699.858 ⚠️
The four-hour trend is printing a clean bearish stack with price pinned strictly below both the fifty and two-hundred EMA levels. 📊 Momentum favors the sell-side here, though keep position sizing light given the strong correlation with a rising broader market. ⚡
Manage this setup with strict discipline by scaling out at targets and trailing risk aggressively once the initial profit level cracks. 💡 Are you taking this short continuation or sitting on hands while correlation tests your patience? 👇
⚠️ Not financial advice. Always manage your risk. 🛡️
🏷️ #BNB #ShortSetup #CryptoTrading #TrendAnalysis
📉 🦈
BEARISH STACK ON $BNB AS SELLERS DEFEND MAJOR RESISTANCE ZONES! 📉🐻
Entry: 687.391 – 688.569 ⚡
Target: 664.225 🚀
Stop Loss: 699.858 ⚠️
The four-hour trend is printing a clean bearish stack with price pinned strictly below both the fifty and two-hundred EMA levels. 📊 Momentum favors the sell-side here, though keep position sizing light given the strong correlation with a rising broader market. ⚡
Manage this setup with strict discipline by scaling out at targets and trailing risk aggressively once the initial profit level cracks. 💡 Are you taking this short continuation or sitting on hands while correlation tests your patience? 👇
⚠️ Not financial advice. Always manage your risk. 🛡️
🏷️ #BNB #ShortSetup #CryptoTrading #TrendAnalysis
📉 🦈
Entry: 687.391 – 688.569 ⚡
Target: 664.225 🚀
Stop Loss: 699.858 ⚠️
The four-hour trend is printing a clean bearish stack with price pinned strictly below both the fifty and two-hundred EMA levels. 📊 Momentum favors the sell-side here, though keep position sizing light given the strong correlation with a rising broader market. ⚡
Manage this setup with strict discipline by scaling out at targets and trailing risk aggressively once the initial profit level cracks. 💡 Are you taking this short continuation or sitting on hands while correlation tests your patience? 👇
⚠️ Not financial advice. Always manage your risk. 🛡️
🏷️ #BNB #ShortSetup #CryptoTrading #TrendAnalysis
📉 🦈
6
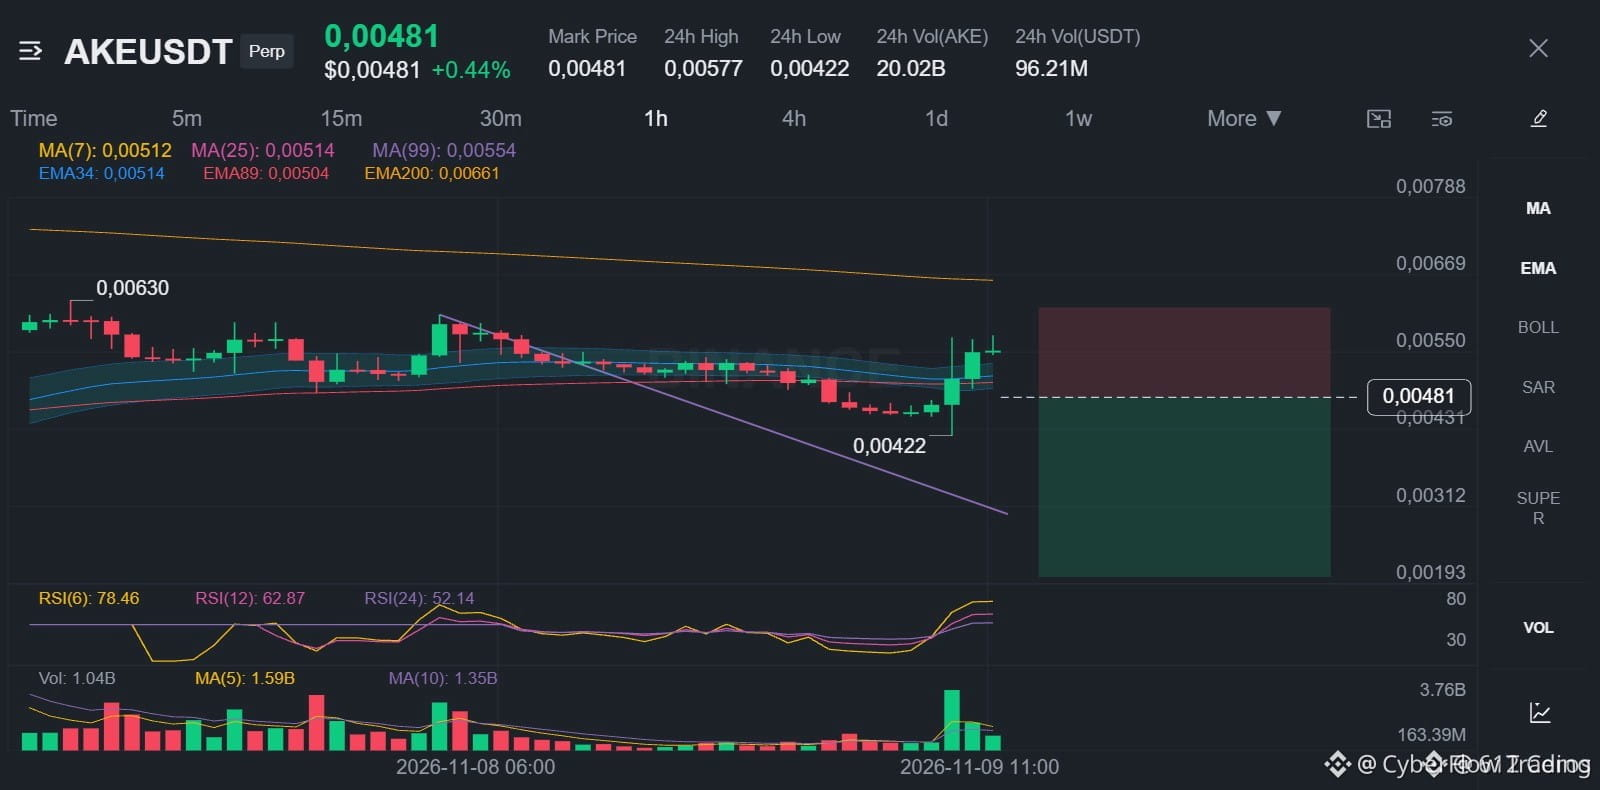
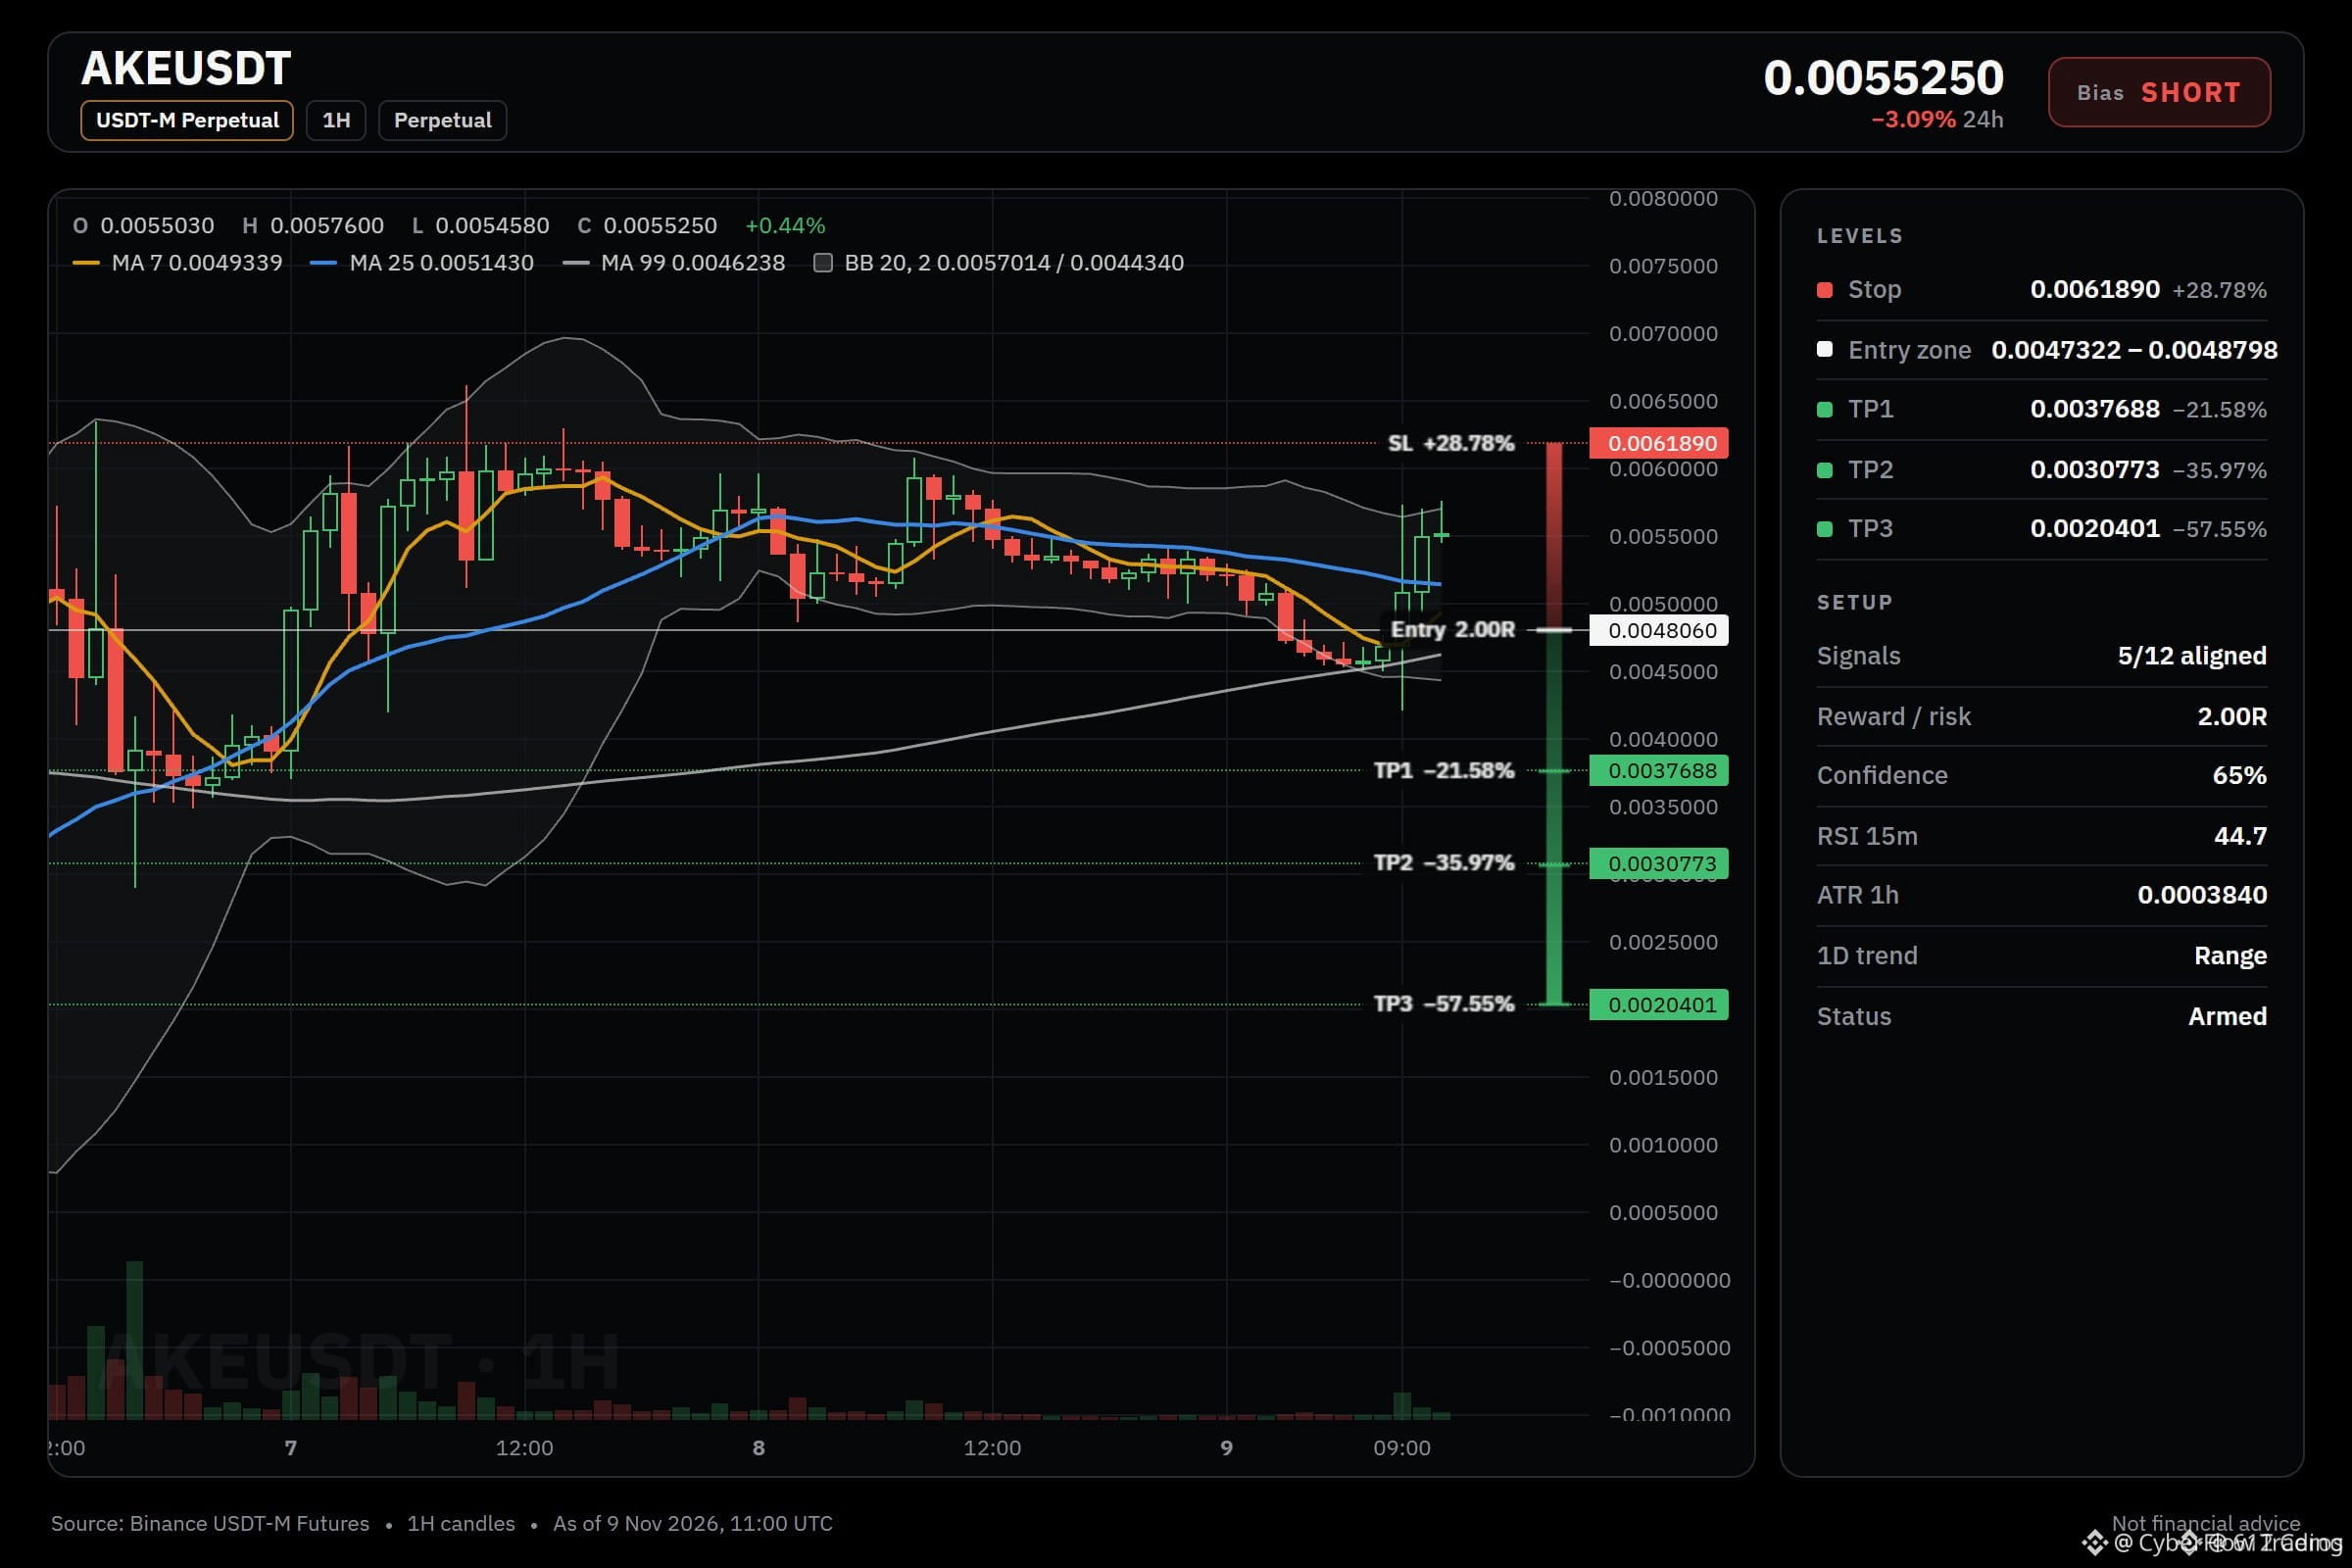
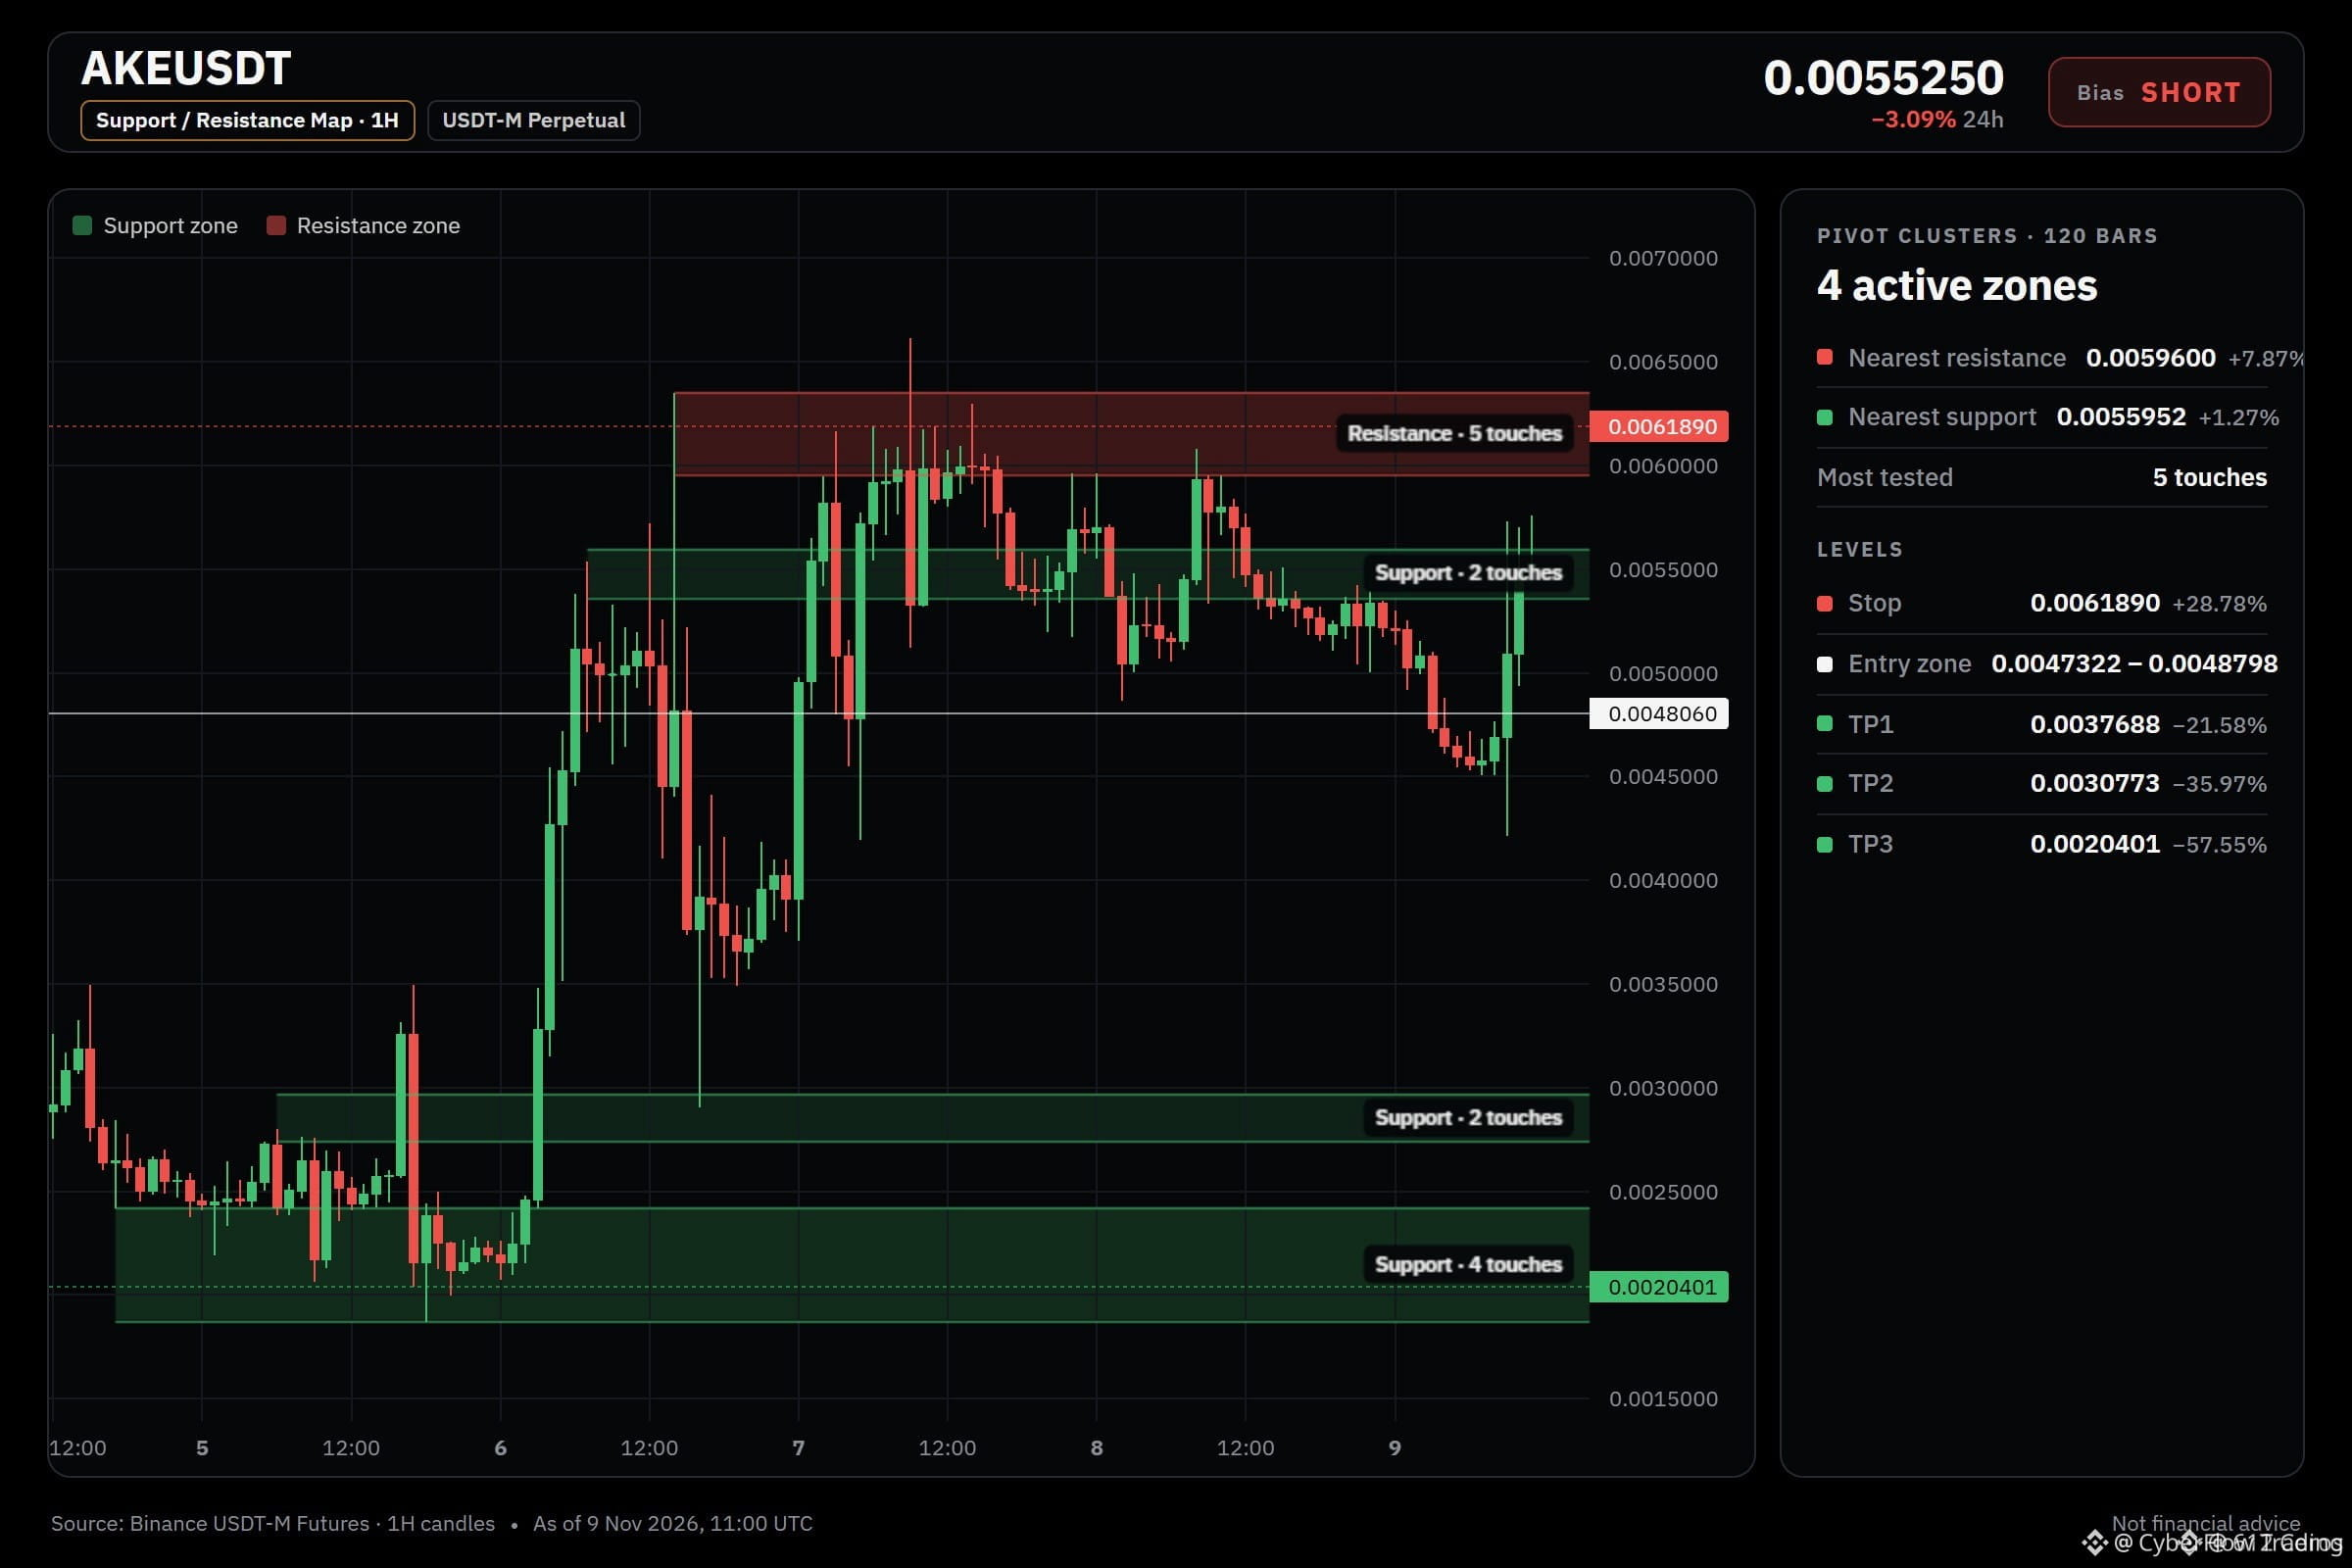
🔴 $AKE SLIPPING BELOW KEY 4H MOVING AVERAGES AS SELLERS STEP IN 📉
Entry: 0.0047322 – 0.0048798 ⚡
Target: 0.0037688 🚀
Stop Loss: 0.0061890 ⚠️
The macro swing trend remains firmly under seller control with price lingering below both the 4h EMA50 and EMA200. 📊 Momentum on the lower timeframe shows a brief counter-trend bounce with 1h RSI touching 60.8, creating an ideal window to scale into short positions near resistance. ⚡
Keep your position sizing measured and light since buyers are putting up a temporary fight. 💡 We will scale out across our targets while sliding stops to entry once the initial objective is secured.
💬 Are you fading this short-term bounce or waiting for a deeper structural breakdown? 👇
⚠️ Not financial advice. Always manage your risk. 🛡️
🏷️ #AKE #ShortSetup #CryptoTrading #TrendAnalysis
🔴 🐻
🔴 $AKE SLIPPING BELOW KEY 4H MOVING AVERAGES AS SELLERS STEP IN 📉
Entry: 0.0047322 – 0.0048798 ⚡
Target: 0.0037688 🚀
Stop Loss: 0.0061890 ⚠️
The macro swing trend remains firmly under seller control with price lingering below both the 4h EMA50 and EMA200. 📊 Momentum on the lower timeframe shows a brief counter-trend bounce with 1h RSI touching 60.8, creating an ideal window to scale into short positions near resistance. ⚡
Keep your position sizing measured and light since buyers are putting up a temporary fight. 💡 We will scale out across our targets while sliding stops to entry once the initial objective is secured.
💬 Are you fading this short-term bounce or waiting for a deeper structural breakdown? 👇
⚠️ Not financial advice. Always manage your risk. 🛡️
🏷️ #AKE #ShortSetup #CryptoTrading #TrendAnalysis
🔴 🐻
Entry: 0.0047322 – 0.0048798 ⚡
Target: 0.0037688 🚀
Stop Loss: 0.0061890 ⚠️
The macro swing trend remains firmly under seller control with price lingering below both the 4h EMA50 and EMA200. 📊 Momentum on the lower timeframe shows a brief counter-trend bounce with 1h RSI touching 60.8, creating an ideal window to scale into short positions near resistance. ⚡
Keep your position sizing measured and light since buyers are putting up a temporary fight. 💡 We will scale out across our targets while sliding stops to entry once the initial objective is secured.
💬 Are you fading this short-term bounce or waiting for a deeper structural breakdown? 👇
⚠️ Not financial advice. Always manage your risk. 🛡️
🏷️ #AKE #ShortSetup #CryptoTrading #TrendAnalysis
🔴 🐻
20

$SHELL | Why Timeframes Can Tell Different Stories
A technical summary dated October 27 showed a more positive bias on the 4-hour chart, while the weekly outlook remained neutral to weak. Some calculations also placed the 50-day average below the 200-day average.
Short-term strength does not automatically confirm a long-term trend change.
#MultiTimeframe #TrendAnalysis #PriceAction
$SHELL | Why Timeframes Can Tell Different Stories
A technical summary dated October 27 showed a more positive bias on the 4-hour chart, while the weekly outlook remained neutral to weak. Some calculations also placed the 50-day average below the 200-day average.
Short-term strength does not automatically confirm a long-term trend change.
#MultiTimeframe #TrendAnalysis #PriceAction
A technical summary dated October 27 showed a more positive bias on the 4-hour chart, while the weekly outlook remained neutral to weak. Some calculations also placed the 50-day average below the 200-day average.
Short-term strength does not automatically confirm a long-term trend change.
#MultiTimeframe #TrendAnalysis #PriceAction

30

Examining current momentum across top trending assets reveals significant divergences in volume and price action. $STREAM leads the attention with a massive 1552.15 percent 24h change and 22,613,229 USDT volume, sitting at market cap rank 742 with a price of 0.025 USDT. Such extreme volatility requires careful observation of volume confirmation before establishing directional bias, as immediate pullbacks near current support are common following parabolic moves. Meanwhile, $IGNITION registers an 87.80 percent gain with 15,199,647 USDT volume at a rank of 882, trading at 0.018 USDT. In the higher-cap tier, $INJ demonstrates sustained institutional interest, holding rank 84 with 288,341,926 USDT volume and a 24.84 percent increase to 9.12 USDT, setting up a clear test of upper resistance zones.
#TrendAnalysis #VolumeSurge #AltcoinMomentum
Examining current momentum across top trending assets reveals significant divergences in volume and price action. $STREAM leads the attention with a massive 1552.15 percent 24h change and 22,613,229 USDT volume, sitting at market cap rank 742 with a price of 0.025 USDT. Such extreme volatility requires careful observation of volume confirmation before establishing directional bias, as immediate pullbacks near current support are common following parabolic moves. Meanwhile, $IGNITION registers an 87.80 percent gain with 15,199,647 USDT volume at a rank of 882, trading at 0.018 USDT. In the higher-cap tier, $INJ demonstrates sustained institutional interest, holding rank 84 with 288,341,926 USDT volume and a 24.84 percent increase to 9.12 USDT, setting up a clear test of upper resistance zones.
#TrendAnalysis #VolumeSurge #AltcoinMomentum
#TrendAnalysis #VolumeSurge #AltcoinMomentum
109
Analyzing current market momentum reveals notable activity across several prominent assets. $STREAM leads attention with a staggering 1552.15 percent 24h change, backed by 22,613,229 USDT in volume, indicating intense speculative interest near its 742 market rank. Meanwhile, $INJ shows solid continuation, advancing 24.84 percent with a robust 288,341,926 USDT volume profile, reflecting sustained spot demand around the 84 rank. In parallel, $NEAR demonstrates steady mid-cap strength, gaining 11.95 percent while commanding heavy liquidity via 1,167,183,536 USDT volume as a rank 20 asset. Traders should monitor volume confirmation around current support and resistance levels to gauge whether momentum sustains or retraces.
#TrendAnalysis #MarketMomentum #AltcoinVolume
Analyzing current market momentum reveals notable activity across several prominent assets. $STREAM leads attention with a staggering 1552.15 percent 24h change, backed by 22,613,229 USDT in volume, indicating intense speculative interest near its 742 market rank. Meanwhile, $INJ shows solid continuation, advancing 24.84 percent with a robust 288,341,926 USDT volume profile, reflecting sustained spot demand around the 84 rank. In parallel, $NEAR demonstrates steady mid-cap strength, gaining 11.95 percent while commanding heavy liquidity via 1,167,183,536 USDT volume as a rank 20 asset. Traders should monitor volume confirmation around current support and resistance levels to gauge whether momentum sustains or retraces.
#TrendAnalysis #MarketMomentum #AltcoinVolume
#TrendAnalysis #MarketMomentum #AltcoinVolume
119
SHELLUSDT.P | October 13, 2026: Rebound or Trend Reversal?
The supplied analysis describes a mixed timeframe picture: the daily chart is bullish, while the weekly and 4H charts remain bearish. These conditions can coexist because each timeframe reflects a different window of market activity.
A rebound on the 4H chart would not automatically mean that the short-term trend has reversed. In the supplied snapshot, SHELL is at $0.02261, below EMA20 and EMA200, while RSI stands at 41.4. These readings do not yet provide clear confirmation of stronger short-term momentum.
The first resistance zone is $0.02307–$0.02314, with 0.02468 as the more significant swing-high reference. If price approaches these levels, its reaction can help assess the strength of the rebound. A few rising candles alone would not be enough to establish a durable reversal.
A rebound describes a move upward; a reversal requires evidence that the prior market structure is changing. Keeping those concepts separate helps make the analysis more disciplined.
#SHELL #TrendAnalysis #MultiTimeframe PriceAction SHELLUSDT CryptoMarkets BinanceSquare
SHELLUSDT.P | October 13, 2026: Rebound or Trend Reversal?
The supplied analysis describes a mixed timeframe picture: the daily chart is bullish, while the weekly and 4H charts remain bearish. These conditions can coexist because each timeframe reflects a different window of market activity.
A rebound on the 4H chart would not automatically mean that the short-term trend has reversed. In the supplied snapshot, SHELL is at $0.02261, below EMA20 and EMA200, while RSI stands at 41.4. These readings do not yet provide clear confirmation of stronger short-term momentum.
The first resistance zone is $0.02307–$0.02314, with 0.02468 as the more significant swing-high reference. If price approaches these levels, its reaction can help assess the strength of the rebound. A few rising candles alone would not be enough to establish a durable reversal.
A rebound describes a move upward; a reversal requires evidence that the prior market structure is changing. Keeping those concepts separate helps make the analysis more disciplined.
#SHELL #TrendAnalysis #MultiTimeframe PriceAction SHELLUSDT CryptoMarkets BinanceSquare
The supplied analysis describes a mixed timeframe picture: the daily chart is bullish, while the weekly and 4H charts remain bearish. These conditions can coexist because each timeframe reflects a different window of market activity.
A rebound on the 4H chart would not automatically mean that the short-term trend has reversed. In the supplied snapshot, SHELL is at $0.02261, below EMA20 and EMA200, while RSI stands at 41.4. These readings do not yet provide clear confirmation of stronger short-term momentum.
The first resistance zone is $0.02307–$0.02314, with 0.02468 as the more significant swing-high reference. If price approaches these levels, its reaction can help assess the strength of the rebound. A few rising candles alone would not be enough to establish a durable reversal.
A rebound describes a move upward; a reversal requires evidence that the prior market structure is changing. Keeping those concepts separate helps make the analysis more disciplined.
#SHELL #TrendAnalysis #MultiTimeframe PriceAction SHELLUSDT CryptoMarkets BinanceSquare
32
SHELLUSDT.P | 13/10/2026: A rebound is different from a trend reversal
The analysis you provided describes SHELL as bullish on the daily timeframe, while the weekly and 4H timeframes remain bearish. This is noteworthy because trends across different timeframes do not necessarily have to be fully aligned.
A rebound on the 4H timeframe can occur while the short-term structure remains weak. At the reference price of 0.02261, the price is currently below the EMA20 and EMA200, and the RSI is 41.4. These data points do not yet confirm a clear bullish reversal.
The 0.02307–0.02314 zone is identified as nearby resistance in the analysis, while 0.02468 is a more significant swing high. If the price moves toward these levels, its actual reaction will help assess the strength of the rebound. A few bullish candles alone should not be enough to conclude that the trend has reversed.
A rebound describes the price rising from a lower area; a reversal requires evidence that the previous trend structure is changing. Distinguishing between these two concepts helps avoid getting ahead of yourself.
#SHELLUSDT #TrendAnalysis #MultiTimeframe PriceAction CryptoMarket PhanTichKyThuat BinanceSquare
SHELLUSDT.P | 13/10/2026: A rebound is different from a trend reversal
The analysis you provided describes SHELL as bullish on the daily timeframe, while the weekly and 4H timeframes remain bearish. This is noteworthy because trends across different timeframes do not necessarily have to be fully aligned.
A rebound on the 4H timeframe can occur while the short-term structure remains weak. At the reference price of 0.02261, the price is currently below the EMA20 and EMA200, and the RSI is 41.4. These data points do not yet confirm a clear bullish reversal.
The 0.02307–0.02314 zone is identified as nearby resistance in the analysis, while 0.02468 is a more significant swing high. If the price moves toward these levels, its actual reaction will help assess the strength of the rebound. A few bullish candles alone should not be enough to conclude that the trend has reversed.
A rebound describes the price rising from a lower area; a reversal requires evidence that the previous trend structure is changing. Distinguishing between these two concepts helps avoid getting ahead of yourself.
#SHELLUSDT #TrendAnalysis #MultiTimeframe PriceAction CryptoMarket PhanTichKyThuat BinanceSquare
The analysis you provided describes SHELL as bullish on the daily timeframe, while the weekly and 4H timeframes remain bearish. This is noteworthy because trends across different timeframes do not necessarily have to be fully aligned.
A rebound on the 4H timeframe can occur while the short-term structure remains weak. At the reference price of 0.02261, the price is currently below the EMA20 and EMA200, and the RSI is 41.4. These data points do not yet confirm a clear bullish reversal.
The 0.02307–0.02314 zone is identified as nearby resistance in the analysis, while 0.02468 is a more significant swing high. If the price moves toward these levels, its actual reaction will help assess the strength of the rebound. A few bullish candles alone should not be enough to conclude that the trend has reversed.
A rebound describes the price rising from a lower area; a reversal requires evidence that the previous trend structure is changing. Distinguishing between these two concepts helps avoid getting ahead of yourself.
#SHELLUSDT #TrendAnalysis #MultiTimeframe PriceAction CryptoMarket PhanTichKyThuat BinanceSquare
26

·
--
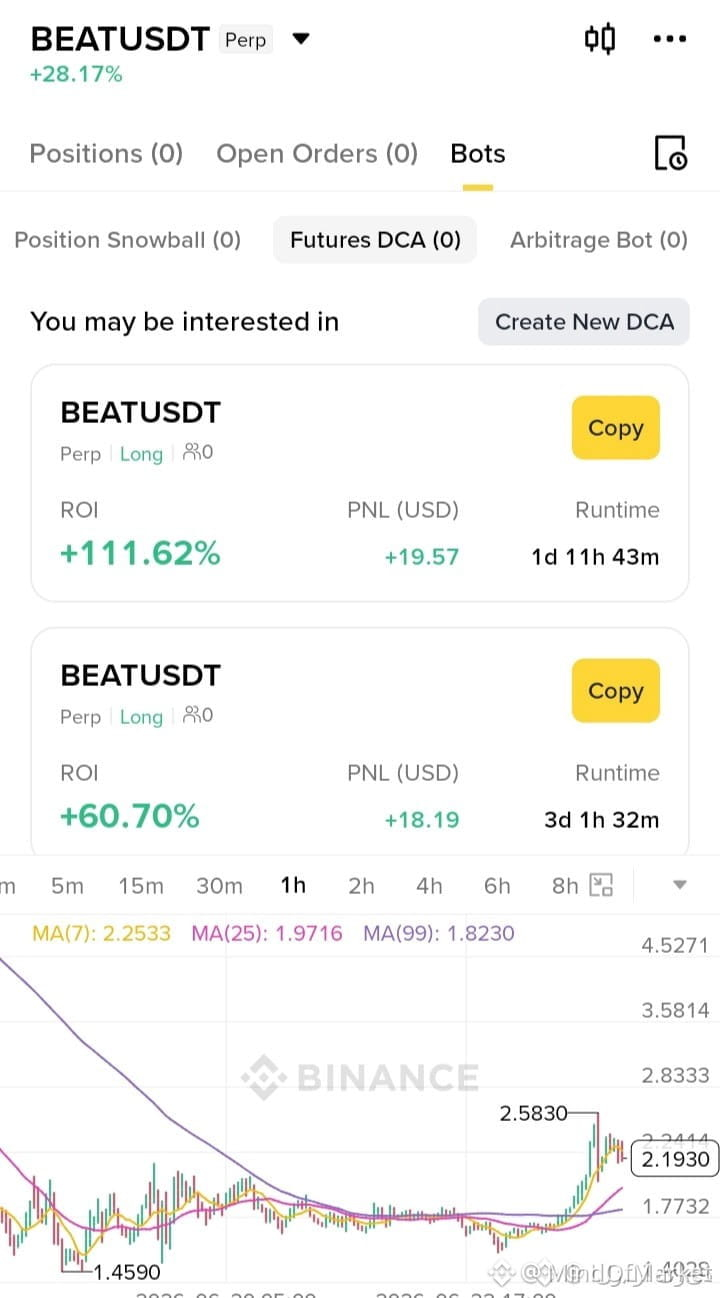
$BEAT SHOWS CLEAR BULLISH ALIGNMENT ACROSS KEY MOVING AVERAGES 📈
$BEAT is currently exhibiting a distinct bullish structure with the MA(7) at 2.2533, MA(25) at 1.9716, and MA(99) at 1.8230. This cascading alignment of moving averages confirms a sustained upward trend that has supported recent automated DCA strategies with significant ROI performance.
The current price action remains well above the long-term MA(99) support level, indicating that buyers are maintaining control of the trend. With the short-term moving average leading the pack, the momentum appears to be favoring further upside potential.
Are you monitoring the MA(7) as a dynamic support level for this trend?
Not financial advice. Always manage your risk.
#BEAT #TechnicalAnalysis #TrendAnalysis #Crypto
🎯
$BEAT SHOWS CLEAR BULLISH ALIGNMENT ACROSS KEY MOVING AVERAGES 📈
$BEAT is currently exhibiting a distinct bullish structure with the MA(7) at 2.2533, MA(25) at 1.9716, and MA(99) at 1.8230. This cascading alignment of moving averages confirms a sustained upward trend that has supported recent automated DCA strategies with significant ROI performance.
The current price action remains well above the long-term MA(99) support level, indicating that buyers are maintaining control of the trend. With the short-term moving average leading the pack, the momentum appears to be favoring further upside potential.
Are you monitoring the MA(7) as a dynamic support level for this trend?
Not financial advice. Always manage your risk.
#BEAT #TechnicalAnalysis #TrendAnalysis #Crypto
🎯
$BEAT is currently exhibiting a distinct bullish structure with the MA(7) at 2.2533, MA(25) at 1.9716, and MA(99) at 1.8230. This cascading alignment of moving averages confirms a sustained upward trend that has supported recent automated DCA strategies with significant ROI performance.
The current price action remains well above the long-term MA(99) support level, indicating that buyers are maintaining control of the trend. With the short-term moving average leading the pack, the momentum appears to be favoring further upside potential.
Are you monitoring the MA(7) as a dynamic support level for this trend?
Not financial advice. Always manage your risk.
#BEAT #TechnicalAnalysis #TrendAnalysis #Crypto
🎯
46

·
--
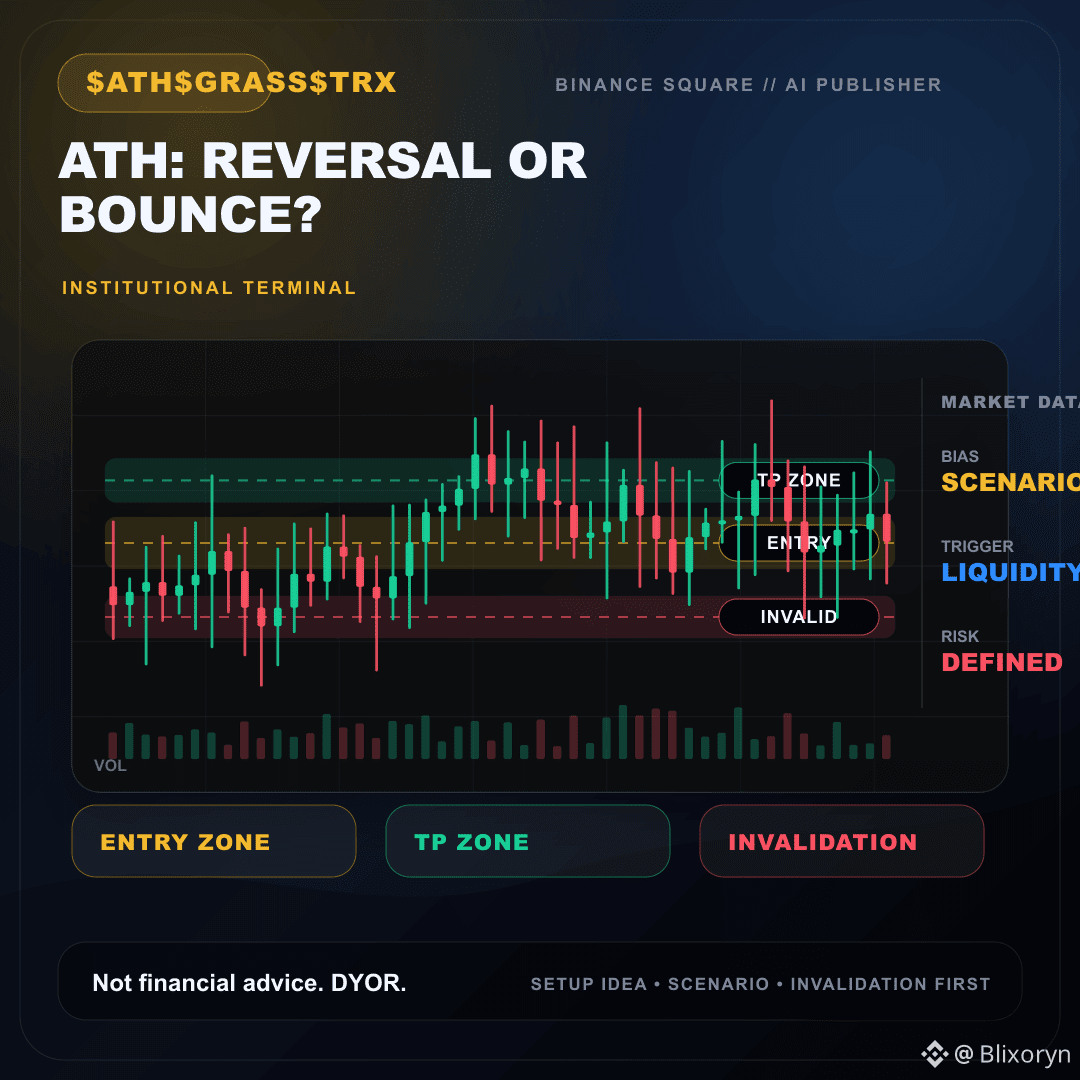
$ATH$GRASS$TRX $ATH just bounced off a key level. Is this a true reversal or dead cat bounce? A genuine reversal often comes with strong volume, retests of previous resistance as support, and a change in market structure. A dead cat bounce usually lacks conviction and fizzles out quickly. Watch closely. Not financial advice. DYOR.
#ReversalSignals #TrendAnalysis #CryptoCharts #PriceAction
What's your go-to indicator for trend reversals?
$ATH $GRASS $TRX $ATH just bounced off a key level. Is this a true reversal or dead cat bounce? A genuine reversal often comes with strong volume, retests of previous resistance as support, and a change in market structure. A dead cat bounce usually lacks conviction and fizzles out quickly. Watch closely. Not financial advice. DYOR.
#ReversalSignals #TrendAnalysis #CryptoCharts #PriceAction
What's your go-to indicator for trend reversals?
#ReversalSignals #TrendAnalysis #CryptoCharts #PriceAction
What's your go-to indicator for trend reversals?
1
86
·
--
🐂 $BTC BULLISH REVERSAL: WHAT SHOULD YOU WATCH?
A potential bullish reversal becomes more convincing when price starts forming higher lows, reclaims important resistance, and attracts stronger volume. No single signal guarantees a trend change.
Keep confirmation at the center of your strategy! 🚀
{spot}(BTCUSDT)
#BTC #BullishReversal #TrendAnalysis #CryptoCharts #BTCTrading
🐂 $BTC BULLISH REVERSAL: WHAT SHOULD YOU WATCH?
A potential bullish reversal becomes more convincing when price starts forming higher lows, reclaims important resistance, and attracts stronger volume. No single signal guarantees a trend change.
Keep confirmation at the center of your strategy! 🚀
#BTC #BullishReversal #TrendAnalysis #CryptoCharts #BTCTrading
A potential bullish reversal becomes more convincing when price starts forming higher lows, reclaims important resistance, and attracts stronger volume. No single signal guarantees a trend change.
Keep confirmation at the center of your strategy! 🚀
#BTC #BullishReversal #TrendAnalysis #CryptoCharts #BTCTrading

2
2
A nearly flat 24-hour move does not erase a weaker performance across a longer timeframe. Recent SHELL snapshots showed a small daily gain near $0.0201, while several trackers still reflected negative performance over broader periods. Looking at multiple timeframes helps separate short-lived stabilization from a meaningful trend change.
#TrendAnalysis #SHELL #CryptoResearch
A nearly flat 24-hour move does not erase a weaker performance across a longer timeframe. Recent SHELL snapshots showed a small daily gain near $0.0201, while several trackers still reflected negative performance over broader periods. Looking at multiple timeframes helps separate short-lived stabilization from a meaningful trend change.
#TrendAnalysis #SHELL #CryptoResearch
#TrendAnalysis #SHELL #CryptoResearch
16
·
--
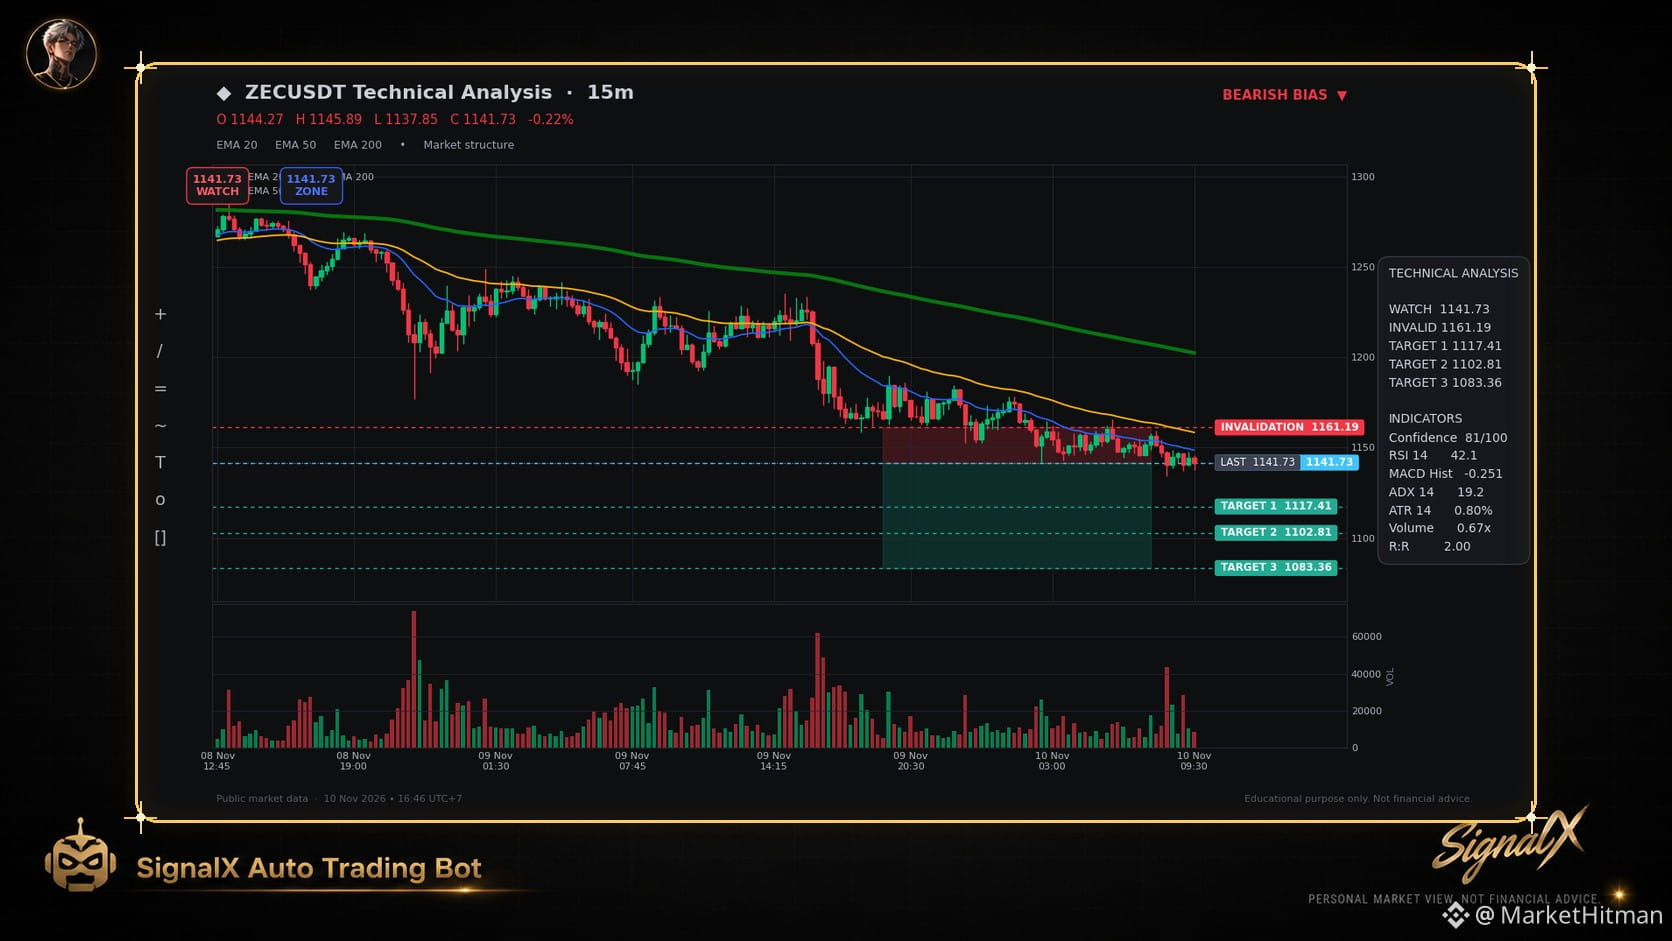
🚨 $ZEC VENDETTA CONTINUES AS SELLERS DEFEND THE MOVING AVERAGE WALL 📉
Entry: 1141.73 ⚡
Target: 1117.41 🚀
Stop Loss: 1161.19 ⚠️
Momentum is leaking out of $ZEC as price action remains pinned firmly beneath the heavy shadow of the declining EMA ribbon. Sellers are smoothly executing a textbook trend continuation, stepping in on every minor relief bounce without breaking a sweat. 📊
With the MACD histogram printing negative expansion and volume tapering off to 0.67x the average baseline, buyers lack the firepower to mount a meaningful defense. The path of least resistance points straight toward deeper liquidity pools below. ⚡
Are you looking to ride this continuation leg down or waiting for a volatile shakeout? 🤔
⚠️ Not financial advice. Always manage your risk. 🛡️
🏷️ #ZEC #ShortSetup #CryptoTrading #TrendAnalysis #Bearish
🔴 📉
🚨 $ZEC VENDETTA CONTINUES AS SELLERS DEFEND THE MOVING AVERAGE WALL 📉
Entry: 1141.73 ⚡
Target: 1117.41 🚀
Stop Loss: 1161.19 ⚠️
Momentum is leaking out of $ZEC as price action remains pinned firmly beneath the heavy shadow of the declining EMA ribbon. Sellers are smoothly executing a textbook trend continuation, stepping in on every minor relief bounce without breaking a sweat. 📊
With the MACD histogram printing negative expansion and volume tapering off to 0.67x the average baseline, buyers lack the firepower to mount a meaningful defense. The path of least resistance points straight toward deeper liquidity pools below. ⚡
Are you looking to ride this continuation leg down or waiting for a volatile shakeout? 🤔
⚠️ Not financial advice. Always manage your risk. 🛡️
🏷️ #ZEC #ShortSetup #CryptoTrading #TrendAnalysis #Bearish
🔴 📉
Entry: 1141.73 ⚡
Target: 1117.41 🚀
Stop Loss: 1161.19 ⚠️
Momentum is leaking out of $ZEC as price action remains pinned firmly beneath the heavy shadow of the declining EMA ribbon. Sellers are smoothly executing a textbook trend continuation, stepping in on every minor relief bounce without breaking a sweat. 📊
With the MACD histogram printing negative expansion and volume tapering off to 0.67x the average baseline, buyers lack the firepower to mount a meaningful defense. The path of least resistance points straight toward deeper liquidity pools below. ⚡
Are you looking to ride this continuation leg down or waiting for a volatile shakeout? 🤔
⚠️ Not financial advice. Always manage your risk. 🛡️
🏷️ #ZEC #ShortSetup #CryptoTrading #TrendAnalysis #Bearish
🔴 📉
3
Log in to explore more content
Join global crypto users on Binance Square
⚡️ Get latest and useful information about crypto.
💬 Trusted by the world’s largest crypto exchange.
👍 Discover real insights from verified creators.
Email / Phone number
Trending Topics
1
#WhoWillSucceedJensenHuangatNvidia?
97,400 views
1,236 Discussing
2
#WhatWillDriveCryptoandStocks’NextRebound?
462,243 views
3,142 Discussing
3
#BitcoinActiveSupplyInProfitDropsBelow45%
33,085 views
444 Discussing
4
#KavaSaysAbnormalActivityLimitedToKavaLend
14,140 views
226 Discussing
5
#USSpotXRPETFsSeeLargestWeeklyOutflowIn8Months
12,625 views
209 Discussing
6
#USPPIMissMayEaseBTCPressure
224,612 views
2,095 Discussing
7
#WORPTLetsTouristsConvertCryptoToThaiBaht
3,535 views
57 Discussing
8
#TONStrategyReports$23.97MQ3NetLoss
4,680 views
41 Discussing
9
#PolkadotCommunityApprovesNewStrategyWith97%Vote
20,734 views
252 Discussing
10
#dYdXPlansV9.9UpgradeToShiftUSDCToInjective
13,837 views
207 Discussing