
#ar
ar
2.2M views
6,640 Discussing
Hot
Latest

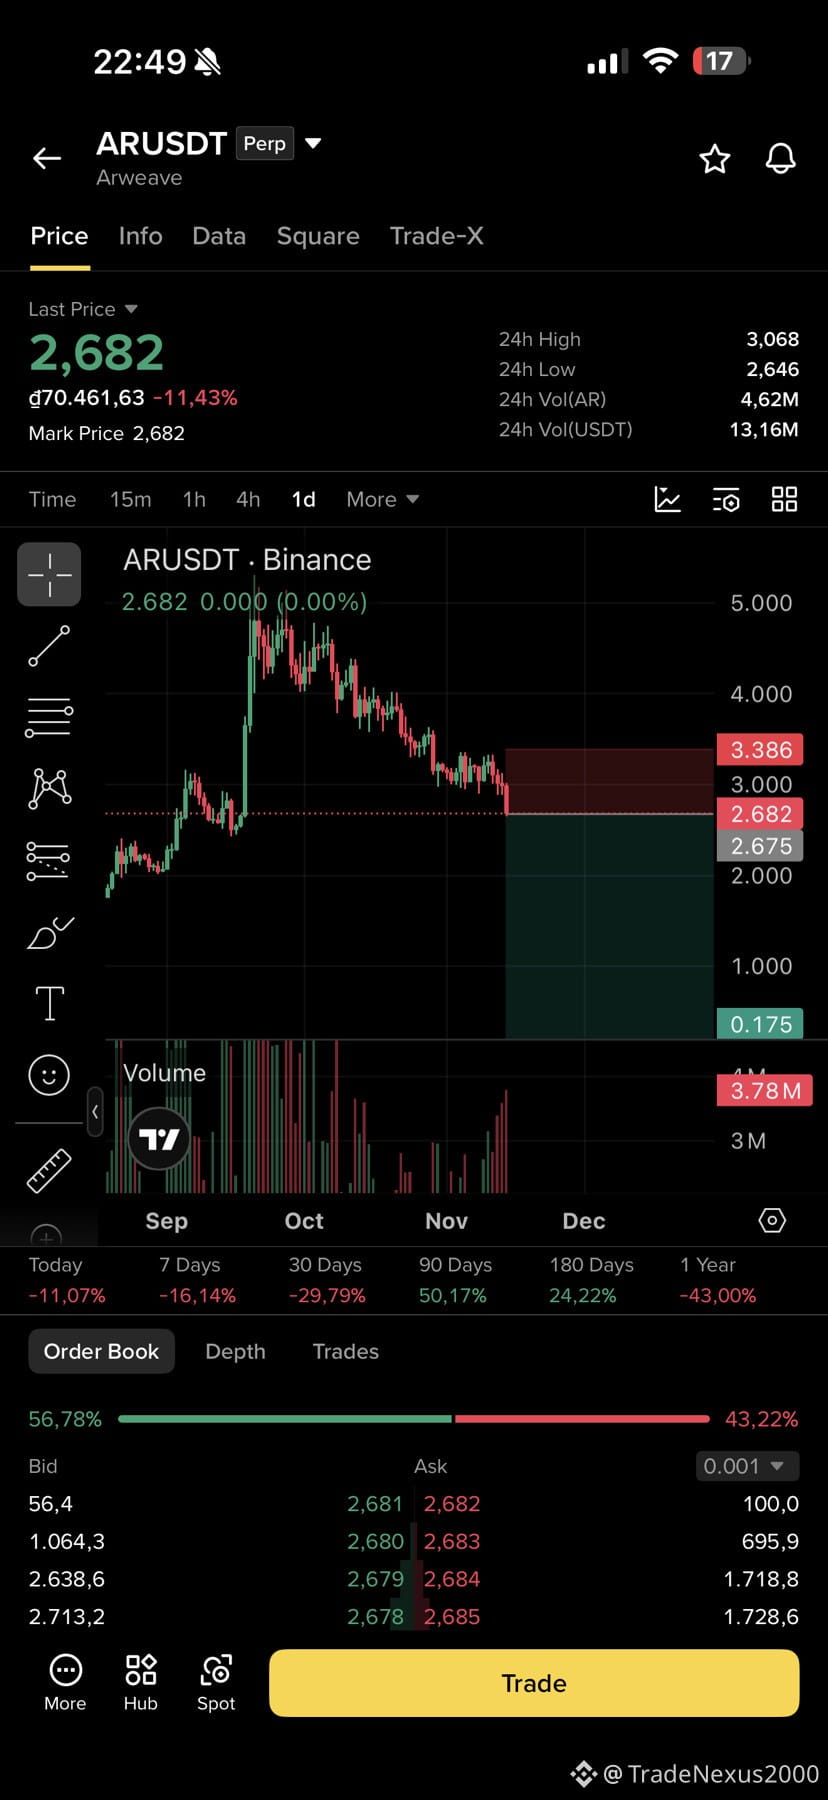
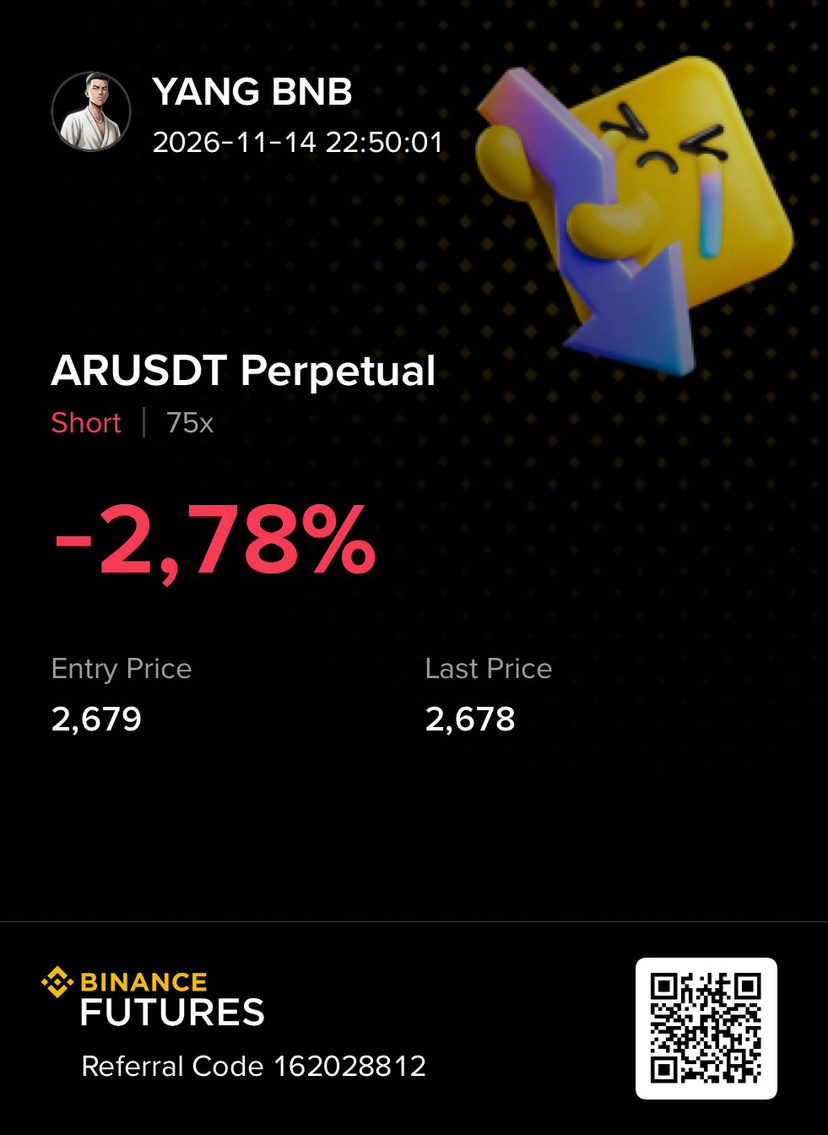
🦈 $AR SWEEPING INSTITUTIONAL LIQUIDITY AT SUPPORT BEFORE THE EXPANSION UPWARD! 💥
Entry: 2.675 ⚡
Target: 3.386 🚀
Retail order flow is trapped trying to short a pristine institutional demand block right here. Smart money is quietly absorbing sell-side pressure at the 2.675 floor, engineering a clean base for markup. 📊
Volume profiles confirm aggressive accumulation while market makers hunt late shorts before repricing higher. The path of least resistance points directly toward the 3.386 liquidity pool overhead. ⚡
Are you positioning alongside institutional accumulation here or waiting for confirmation above range resistance? 🤔
⚠️ Not financial advice. Always manage your risk. 🛡️
🏷️ #AR #SmartMoney #OrderBlock #Crypto #Trading
🔥 💎
🦈 $AR SWEEPING INSTITUTIONAL LIQUIDITY AT SUPPORT BEFORE THE EXPANSION UPWARD! 💥
Entry: 2.675 ⚡
Target: 3.386 🚀
Retail order flow is trapped trying to short a pristine institutional demand block right here. Smart money is quietly absorbing sell-side pressure at the 2.675 floor, engineering a clean base for markup. 📊
Volume profiles confirm aggressive accumulation while market makers hunt late shorts before repricing higher. The path of least resistance points directly toward the 3.386 liquidity pool overhead. ⚡
Are you positioning alongside institutional accumulation here or waiting for confirmation above range resistance? 🤔
⚠️ Not financial advice. Always manage your risk. 🛡️
🏷️ #AR #SmartMoney #OrderBlock #Crypto #Trading
🔥 💎
Entry: 2.675 ⚡
Target: 3.386 🚀
Retail order flow is trapped trying to short a pristine institutional demand block right here. Smart money is quietly absorbing sell-side pressure at the 2.675 floor, engineering a clean base for markup. 📊
Volume profiles confirm aggressive accumulation while market makers hunt late shorts before repricing higher. The path of least resistance points directly toward the 3.386 liquidity pool overhead. ⚡
Are you positioning alongside institutional accumulation here or waiting for confirmation above range resistance? 🤔
⚠️ Not financial advice. Always manage your risk. 🛡️
🏷️ #AR #SmartMoney #OrderBlock #Crypto #Trading
🔥 💎
19
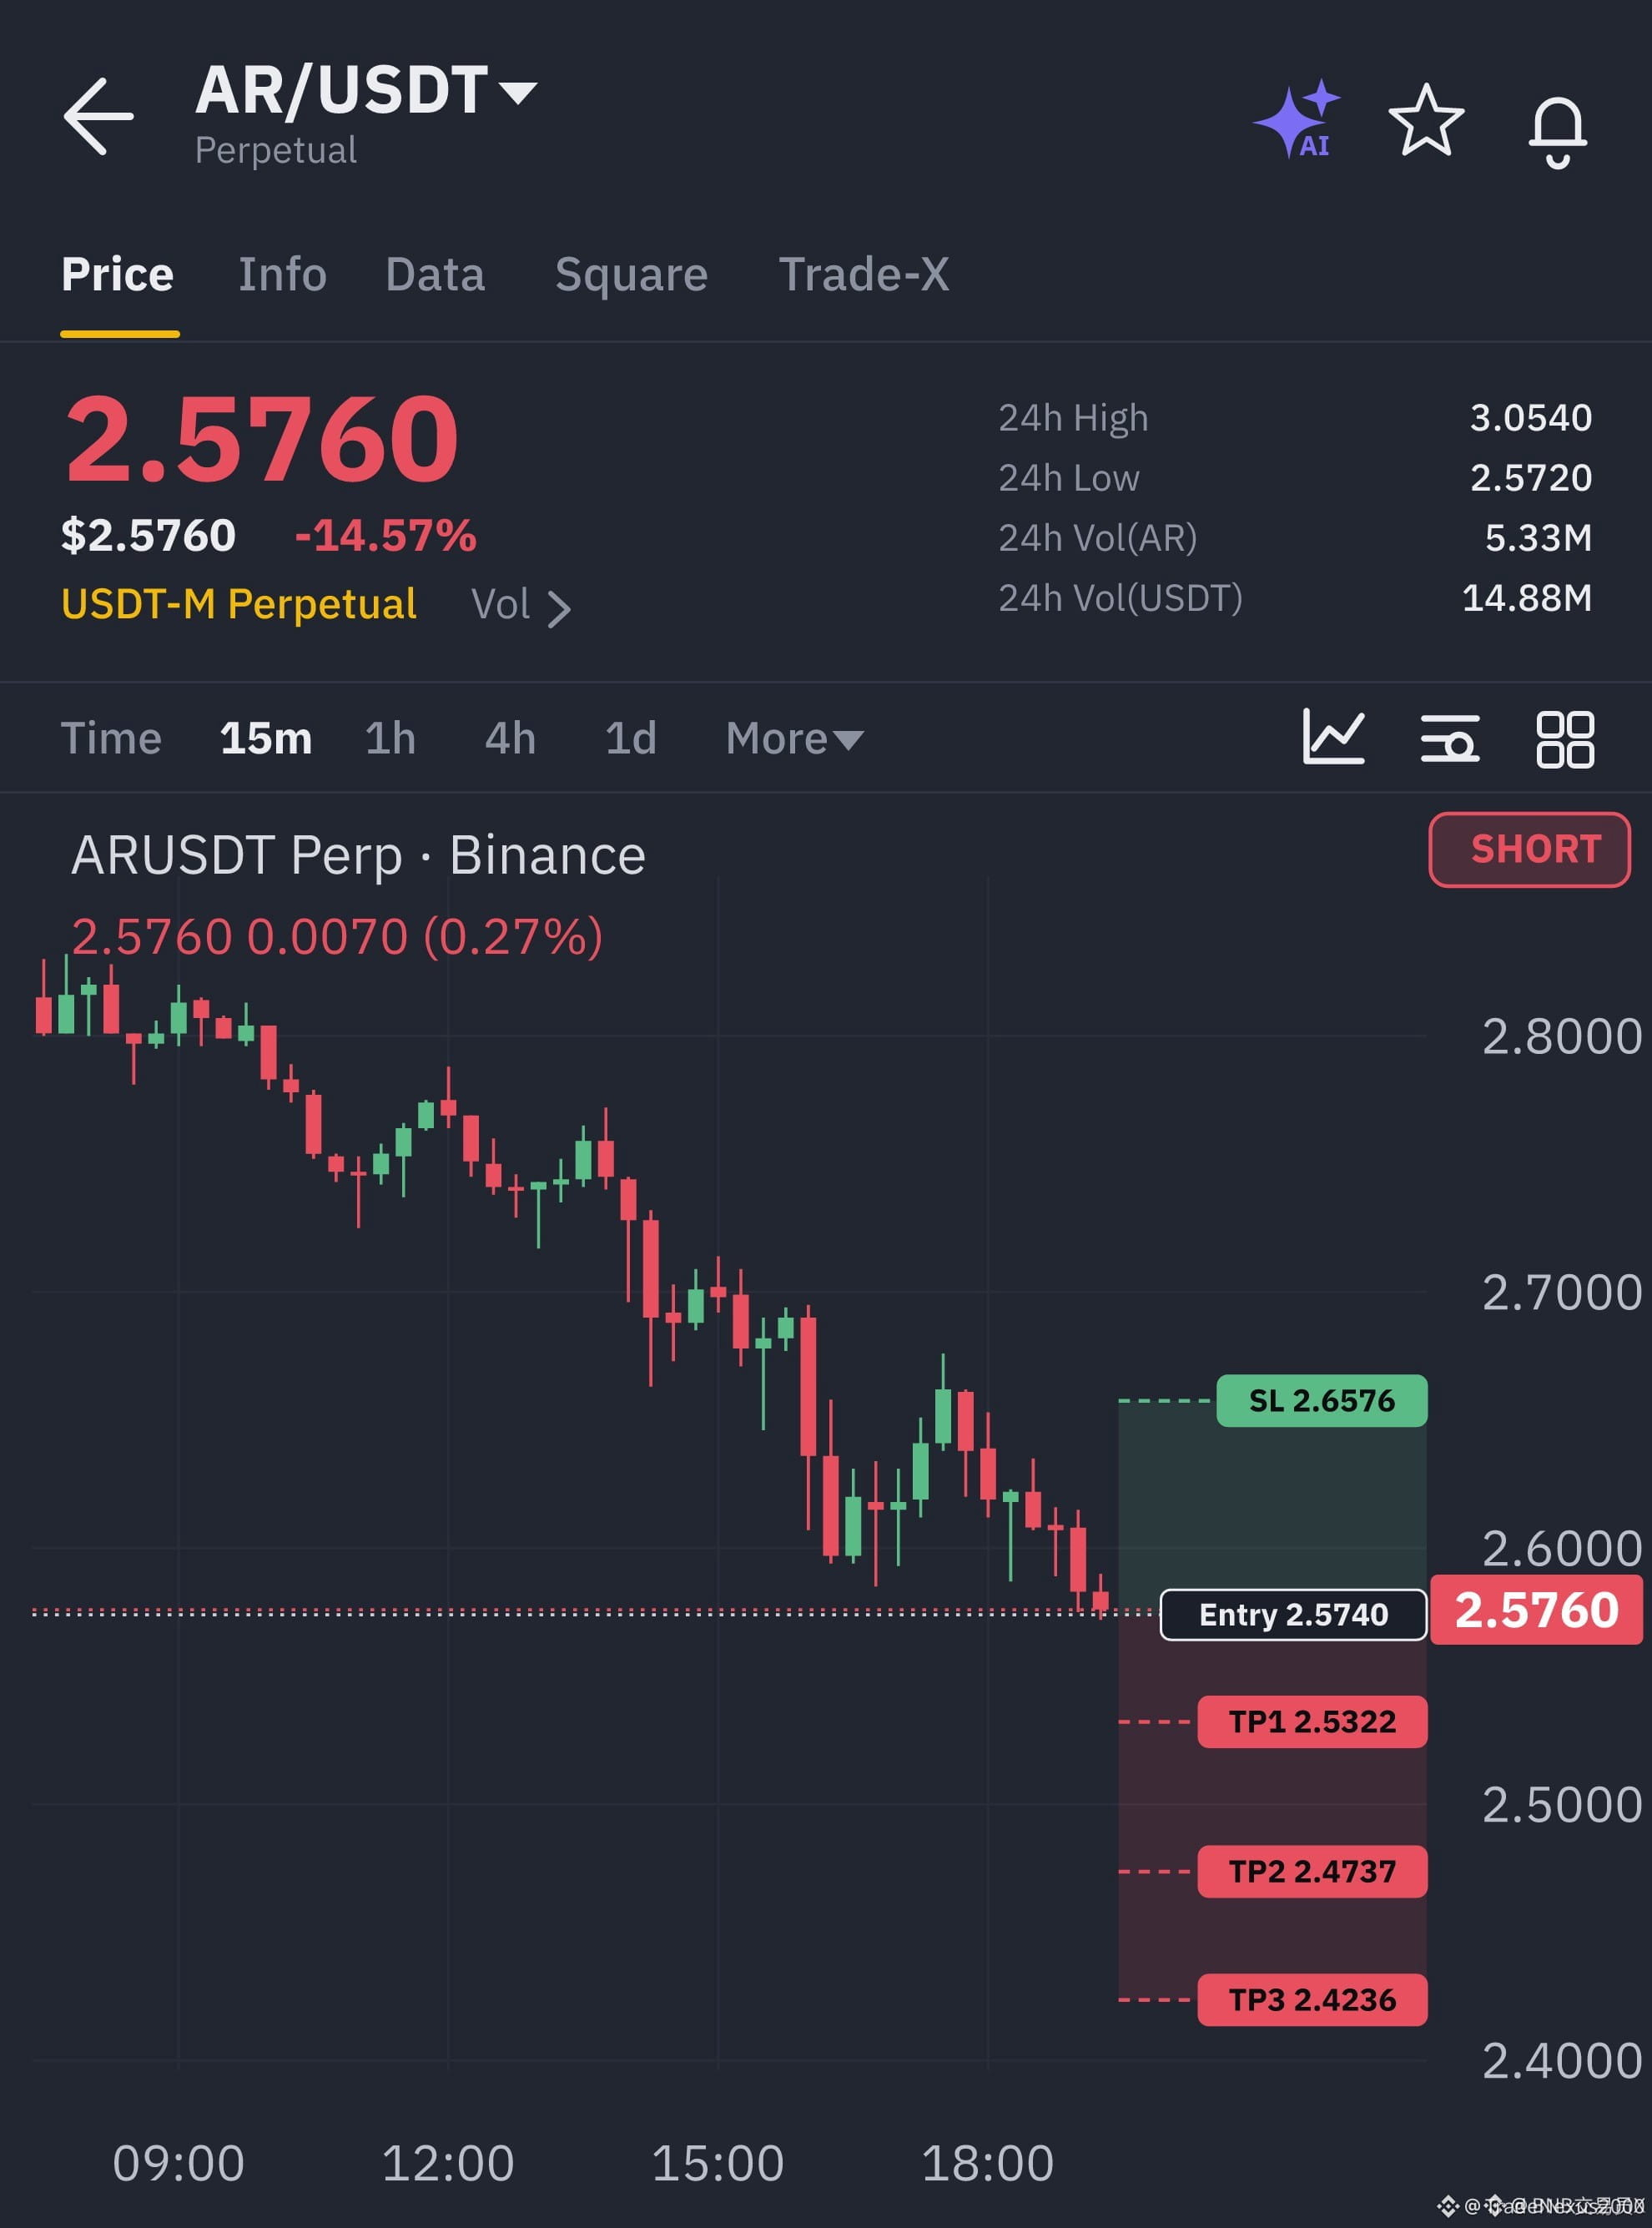
📉 $AR LOSING STRUCTURAL SUPPORT AS SELLERS REJECT THE 2.7140 INEFFICIENCY ZONE 🔴
Entry: 2.5636-2.5844 ⚡
Target: 2.5322 🚀
Stop Loss: 2.6576 ⚠️
Price action on the lower timeframes reveals persistent distribution below the 2.7140 supply threshold, with smart money aggressively capping upward momentum. 📊 Order flow metrics confirm sellers are in control as bids thin out ahead of the 2.5720 structural pivot. ⚡
If this local distribution range yields, expect an acceleration toward our downside liquidity targets as weak longs face liquidation. 🔍 Are you positioning for this continuation or waiting for a deeper sweep? 👇
⚠️ Not financial advice. Always manage your risk. 🛡️
🏷️ #AR #TRX #JUP #ShortSetup
🦈 📉
📉 $AR LOSING STRUCTURAL SUPPORT AS SELLERS REJECT THE 2.7140 INEFFICIENCY ZONE 🔴
Entry: 2.5636-2.5844 ⚡
Target: 2.5322 🚀
Stop Loss: 2.6576 ⚠️
Price action on the lower timeframes reveals persistent distribution below the 2.7140 supply threshold, with smart money aggressively capping upward momentum. 📊 Order flow metrics confirm sellers are in control as bids thin out ahead of the 2.5720 structural pivot. ⚡
If this local distribution range yields, expect an acceleration toward our downside liquidity targets as weak longs face liquidation. 🔍 Are you positioning for this continuation or waiting for a deeper sweep? 👇
⚠️ Not financial advice. Always manage your risk. 🛡️
🏷️ #AR #TRX #JUP #ShortSetup
🦈 📉
Entry: 2.5636-2.5844 ⚡
Target: 2.5322 🚀
Stop Loss: 2.6576 ⚠️
Price action on the lower timeframes reveals persistent distribution below the 2.7140 supply threshold, with smart money aggressively capping upward momentum. 📊 Order flow metrics confirm sellers are in control as bids thin out ahead of the 2.5720 structural pivot. ⚡
If this local distribution range yields, expect an acceleration toward our downside liquidity targets as weak longs face liquidation. 🔍 Are you positioning for this continuation or waiting for a deeper sweep? 👇
⚠️ Not financial advice. Always manage your risk. 🛡️
🏷️ #AR #TRX #JUP #ShortSetup
🦈 📉
15

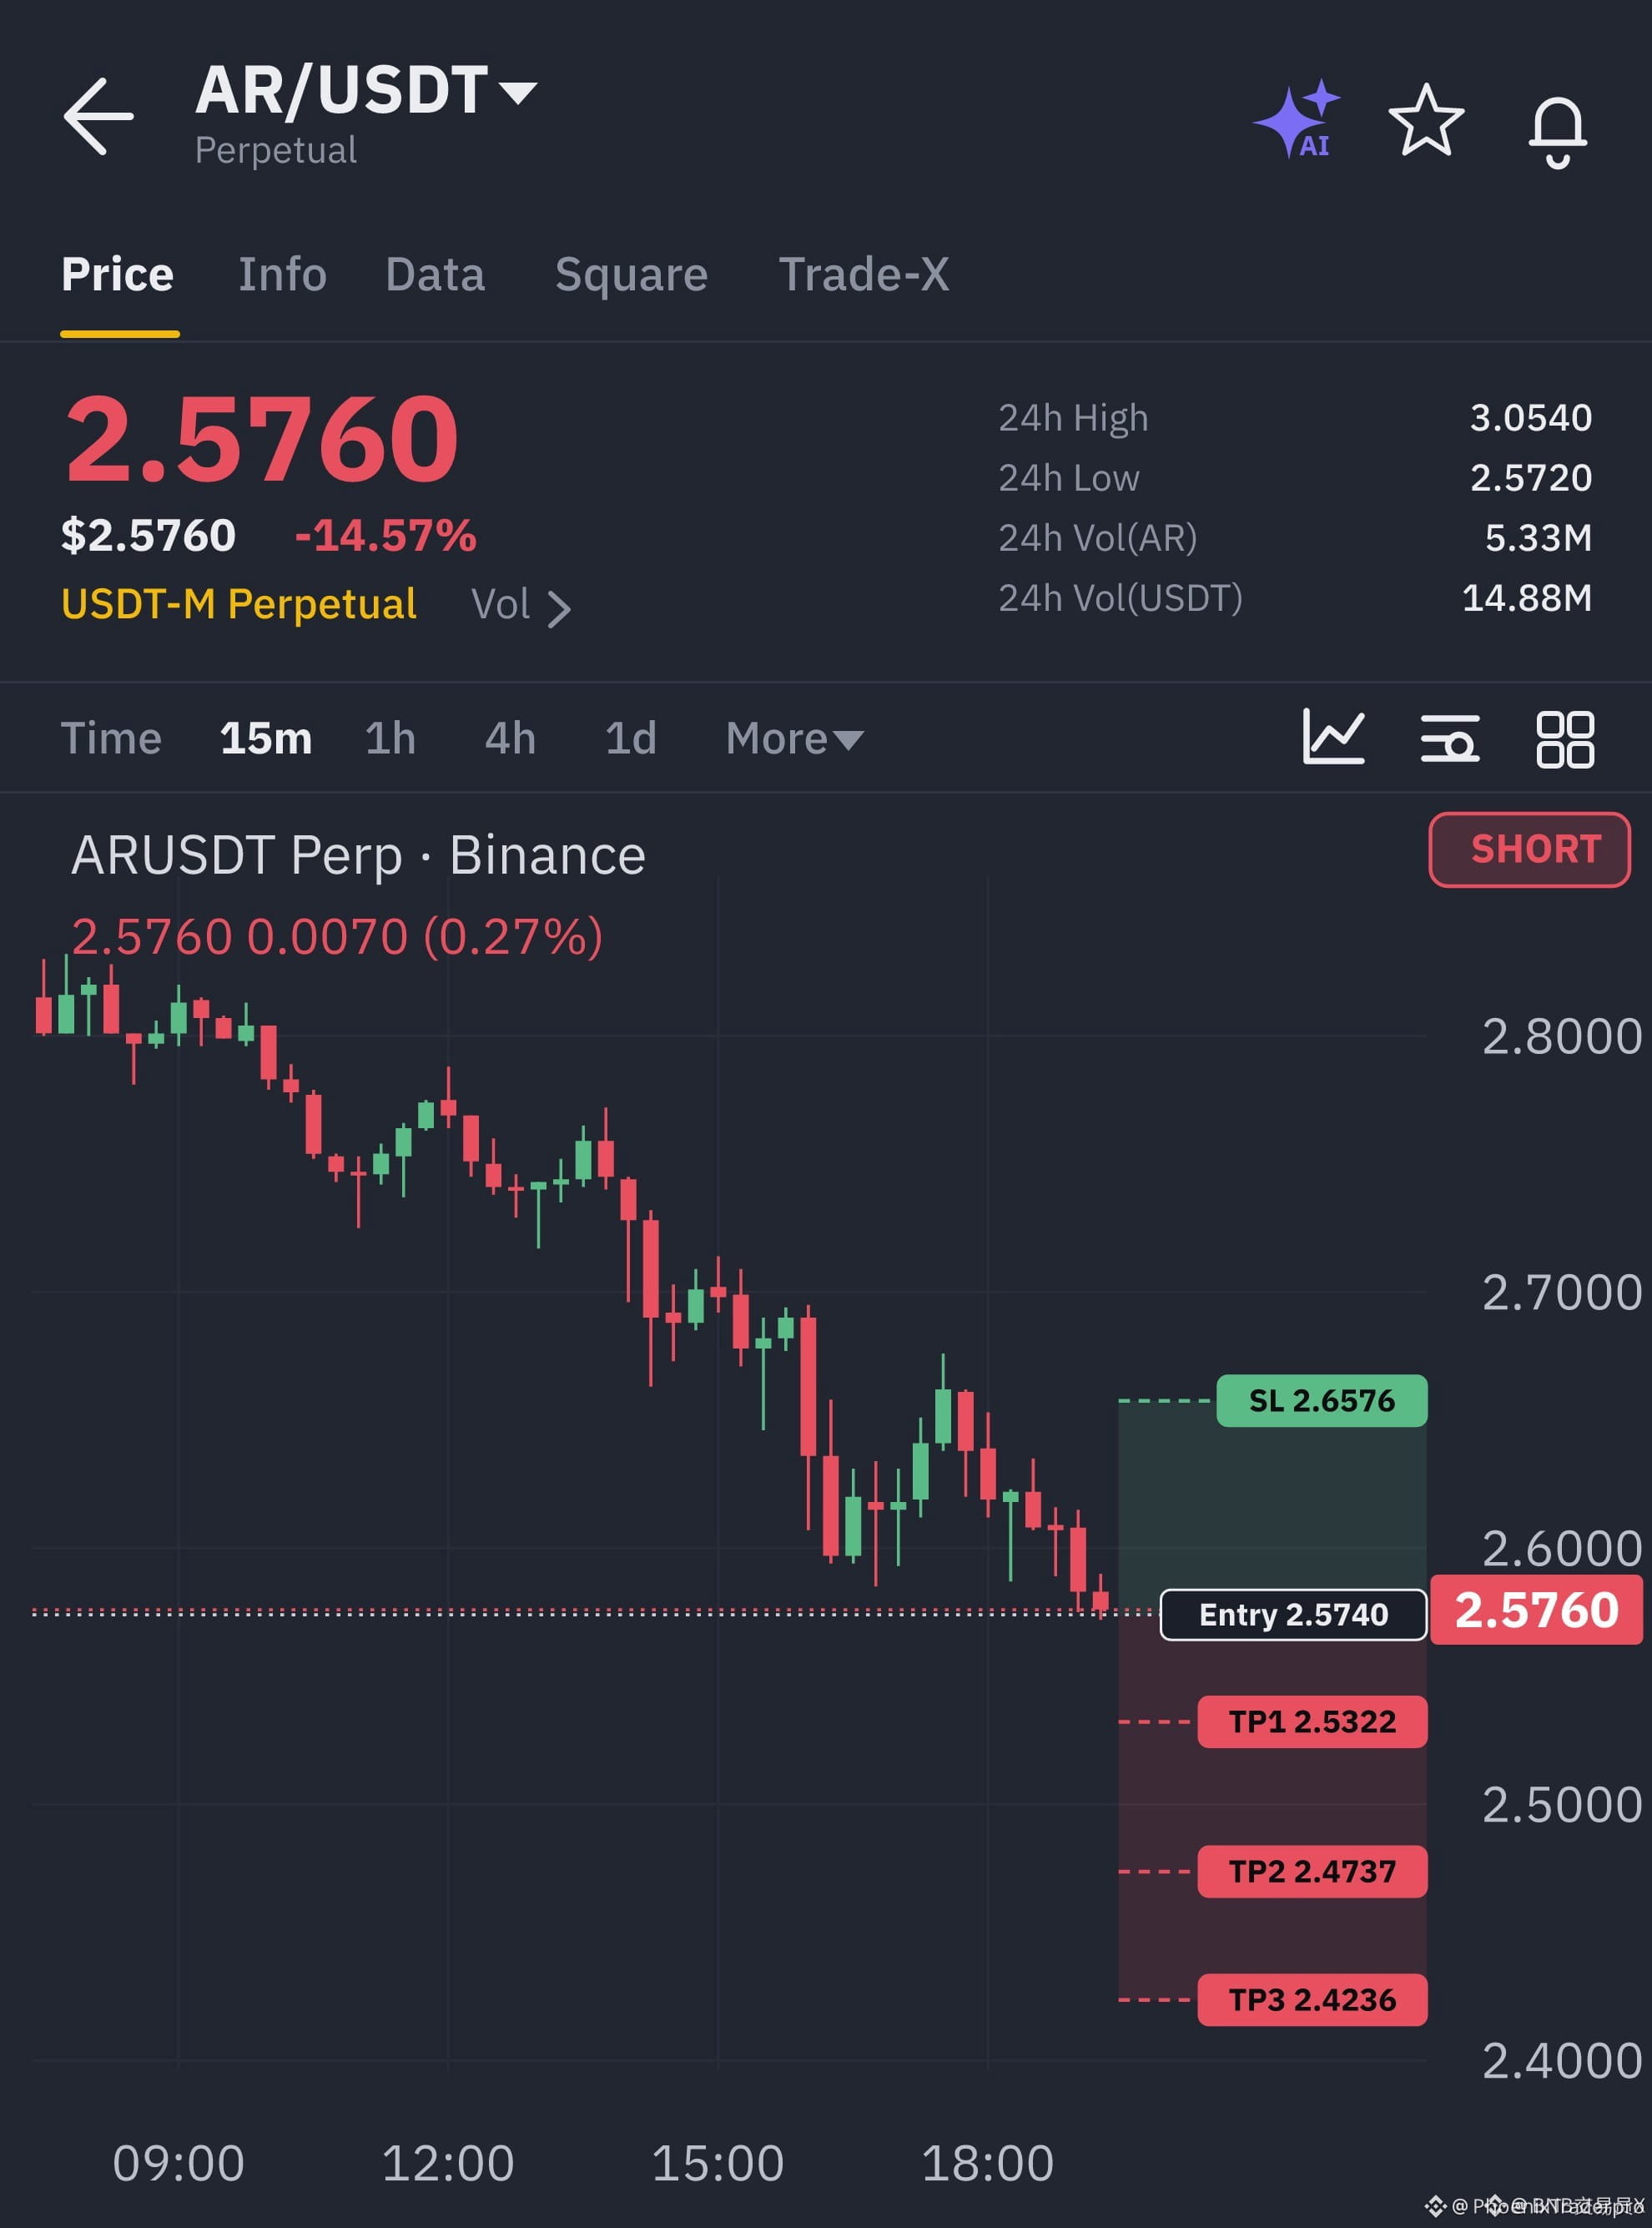
🚨 $AR SELLERS DOMINATE ORDER FLOW AS MOMENTUM BREAKS DOWN BELOW RESISTANCE! 📉
Entry: 2.5636 - 2.5844 ⚡
Target: 2.5322 / 2.4737 / 2.4236 🚀
Stop Loss: 2.6576 ⚠️
Sellers are aggressively defending the 2.7140 ceiling, suffocating any bullish relief attempts before they can gather steam. 📊 Order books show persistent distribution as heavy supply caps upside momentum and bends the short-term trend downward. ⚡
Patience remains the ultimate edge here while price navigates toward the 2.5720 demand shelf. 🔍 Are you positioning for the continuation downward or waiting for a deeper flush before stepping in? 👇
⚠️ Not financial advice. Always manage your risk. 🛡️
🏷️ #AR #ShortSetup #PriceAction #Crypto
🐻 🩸
🚨 $AR SELLERS DOMINATE ORDER FLOW AS MOMENTUM BREAKS DOWN BELOW RESISTANCE! 📉
Entry: 2.5636 - 2.5844 ⚡
Target: 2.5322 / 2.4737 / 2.4236 🚀
Stop Loss: 2.6576 ⚠️
Sellers are aggressively defending the 2.7140 ceiling, suffocating any bullish relief attempts before they can gather steam. 📊 Order books show persistent distribution as heavy supply caps upside momentum and bends the short-term trend downward. ⚡
Patience remains the ultimate edge here while price navigates toward the 2.5720 demand shelf. 🔍 Are you positioning for the continuation downward or waiting for a deeper flush before stepping in? 👇
⚠️ Not financial advice. Always manage your risk. 🛡️
🏷️ #AR #ShortSetup #PriceAction #Crypto
🐻 🩸
Entry: 2.5636 - 2.5844 ⚡
Target: 2.5322 / 2.4737 / 2.4236 🚀
Stop Loss: 2.6576 ⚠️
Sellers are aggressively defending the 2.7140 ceiling, suffocating any bullish relief attempts before they can gather steam. 📊 Order books show persistent distribution as heavy supply caps upside momentum and bends the short-term trend downward. ⚡
Patience remains the ultimate edge here while price navigates toward the 2.5720 demand shelf. 🔍 Are you positioning for the continuation downward or waiting for a deeper flush before stepping in? 👇
⚠️ Not financial advice. Always manage your risk. 🛡️
🏷️ #AR #ShortSetup #PriceAction #Crypto
🐻 🩸
24

·
--
Bearish
🚨 $AR
{future}(ARUSDT)
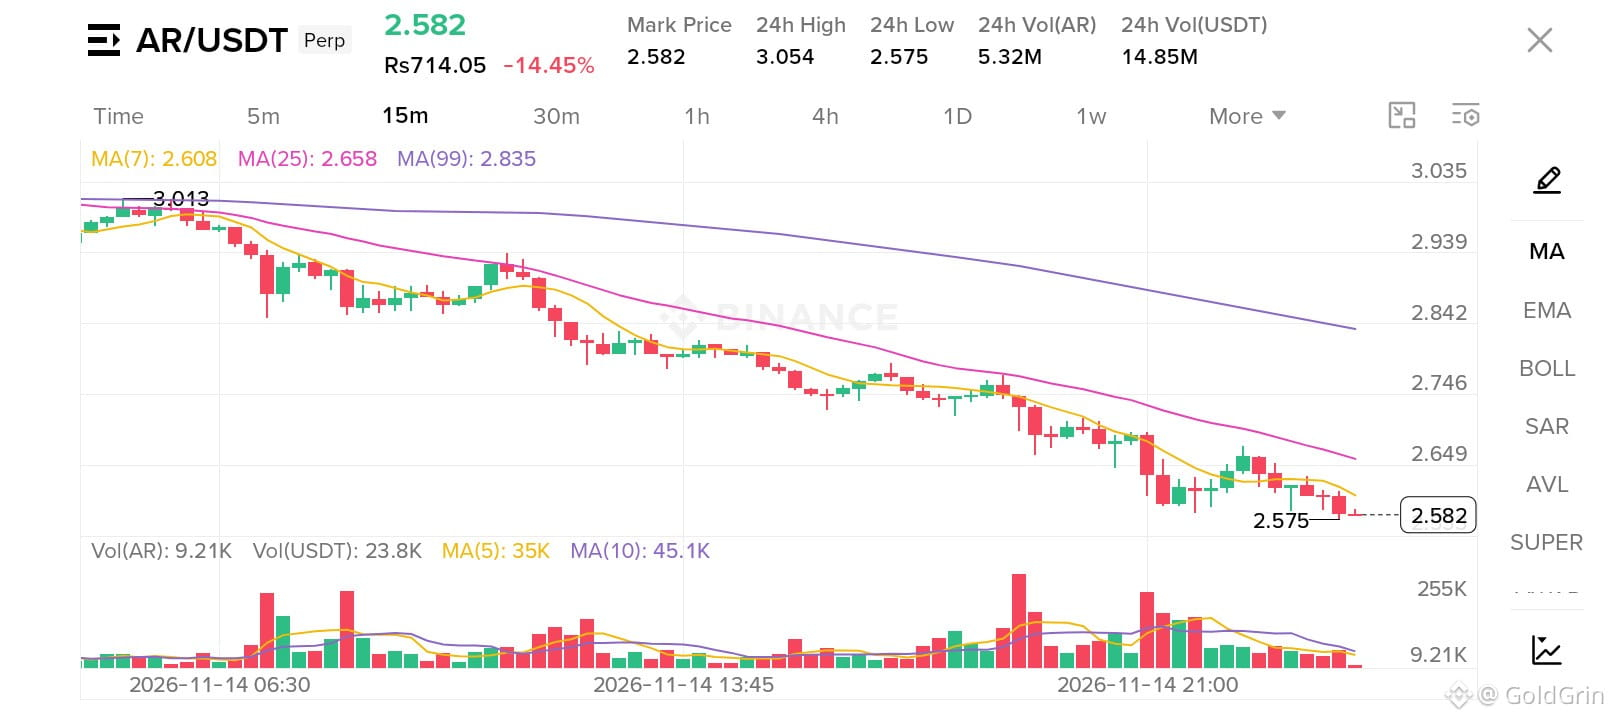
SHORT SETUP — BEARS EYE A MOVE TOWARD $2.675! 🐻📉
A bearish opportunity is on the radar for $AR!
Sellers may be preparing for another downside move, with $2.675 marked as the potential target.
📊 SHORT TRADE SETUP
🔴 Pair: AR/USDT
📉 Direction: SHORT
🎯 Entry Price: $3.386
💰 Target Price: $2.675
🐻 BEARISH OUTLOOK
If selling pressure continues, $AR could move lower toward the $2.675 target.
⚠️ Wait for confirmation before entering. A sudden bullish reversal could invalidate the setup.
💰 Trade with $10–$100 and always manage your risk.
DYOR | Not Financial Advice.
#AR #ARUSDT #ShortSetup #BearishTrade #CryptoTrading #BinanceSquare
🚨 $AR
SHORT SETUP — BEARS EYE A MOVE TOWARD $2.675! 🐻📉
A bearish opportunity is on the radar for $AR !
Sellers may be preparing for another downside move, with $2.675 marked as the potential target.
📊 SHORT TRADE SETUP
🔴 Pair: AR/USDT
📉 Direction: SHORT
🎯 Entry Price: $3.386
💰 Target Price: $2.675
🐻 BEARISH OUTLOOK
If selling pressure continues, $AR could move lower toward the $2.675 target.
⚠️ Wait for confirmation before entering. A sudden bullish reversal could invalidate the setup.
💰 Trade with $10–$100 and always manage your risk.
DYOR | Not Financial Advice.
#AR #ARUSDT #ShortSetup #BearishTrade #CryptoTrading #BinanceSquare
SHORT SETUP — BEARS EYE A MOVE TOWARD $2.675! 🐻📉
A bearish opportunity is on the radar for $AR !
Sellers may be preparing for another downside move, with $2.675 marked as the potential target.
📊 SHORT TRADE SETUP
🔴 Pair: AR/USDT
📉 Direction: SHORT
🎯 Entry Price: $3.386
💰 Target Price: $2.675
🐻 BEARISH OUTLOOK
If selling pressure continues, $AR could move lower toward the $2.675 target.
⚠️ Wait for confirmation before entering. A sudden bullish reversal could invalidate the setup.
💰 Trade with $10–$100 and always manage your risk.
DYOR | Not Financial Advice.
#AR #ARUSDT #ShortSetup #BearishTrade #CryptoTrading #BinanceSquare
1
344

·
--
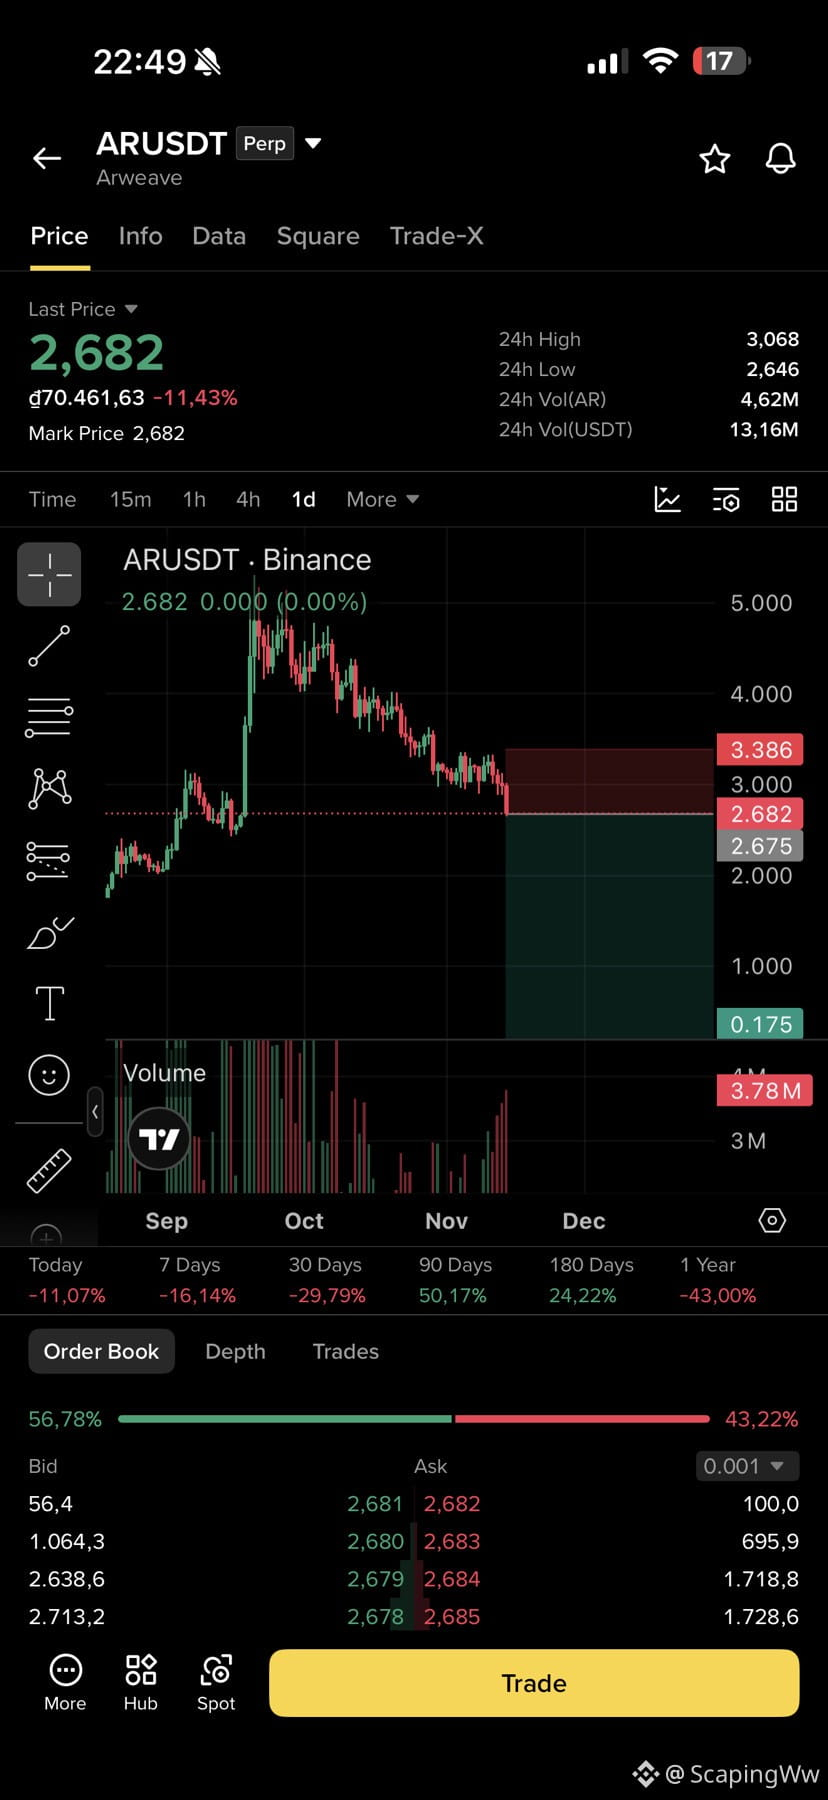
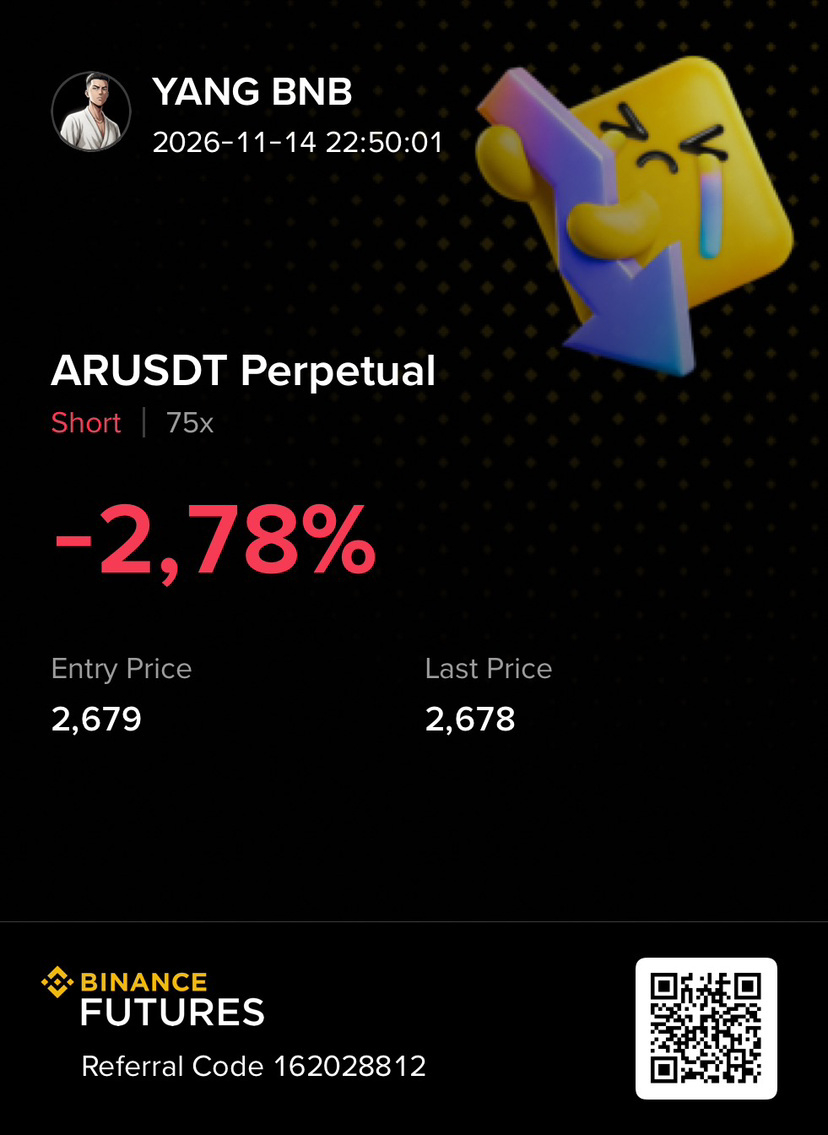
🚨 $AR IS IGNITING A MASSIVE MOMENTUM SURGE ACROSS THE ORDER BOOKS! 🚀
Entry: 2.675 ⚡
Target: 3.386 🚀
📊 Price is compressing tightly right above local support as aggressive buyers step in to absorb the lingering sell wall. Volume profiles show heavy accumulation building across the lower timeframes, signaling a potent volatility expansion toward key overhead levels. ⚡
Smart money absorption patterns indicate that patient bidders are quietly defending their turf before the next leg higher. 🤔 Are you positioned for this breakout expansion yet? 👇
⚠️ Not financial advice. Always manage your risk. 🛡️
🏷️ #AR #Momentum #Breakout #Crypto
🔥 💎
🚨 $AR IS IGNITING A MASSIVE MOMENTUM SURGE ACROSS THE ORDER BOOKS! 🚀
Entry: 2.675 ⚡
Target: 3.386 🚀
📊 Price is compressing tightly right above local support as aggressive buyers step in to absorb the lingering sell wall. Volume profiles show heavy accumulation building across the lower timeframes, signaling a potent volatility expansion toward key overhead levels. ⚡
Smart money absorption patterns indicate that patient bidders are quietly defending their turf before the next leg higher. 🤔 Are you positioned for this breakout expansion yet? 👇
⚠️ Not financial advice. Always manage your risk. 🛡️
🏷️ #AR #Momentum #Breakout #Crypto
🔥 💎
Entry: 2.675 ⚡
Target: 3.386 🚀
📊 Price is compressing tightly right above local support as aggressive buyers step in to absorb the lingering sell wall. Volume profiles show heavy accumulation building across the lower timeframes, signaling a potent volatility expansion toward key overhead levels. ⚡
Smart money absorption patterns indicate that patient bidders are quietly defending their turf before the next leg higher. 🤔 Are you positioned for this breakout expansion yet? 👇
⚠️ Not financial advice. Always manage your risk. 🛡️
🏷️ #AR #Momentum #Breakout #Crypto
🔥 💎
33


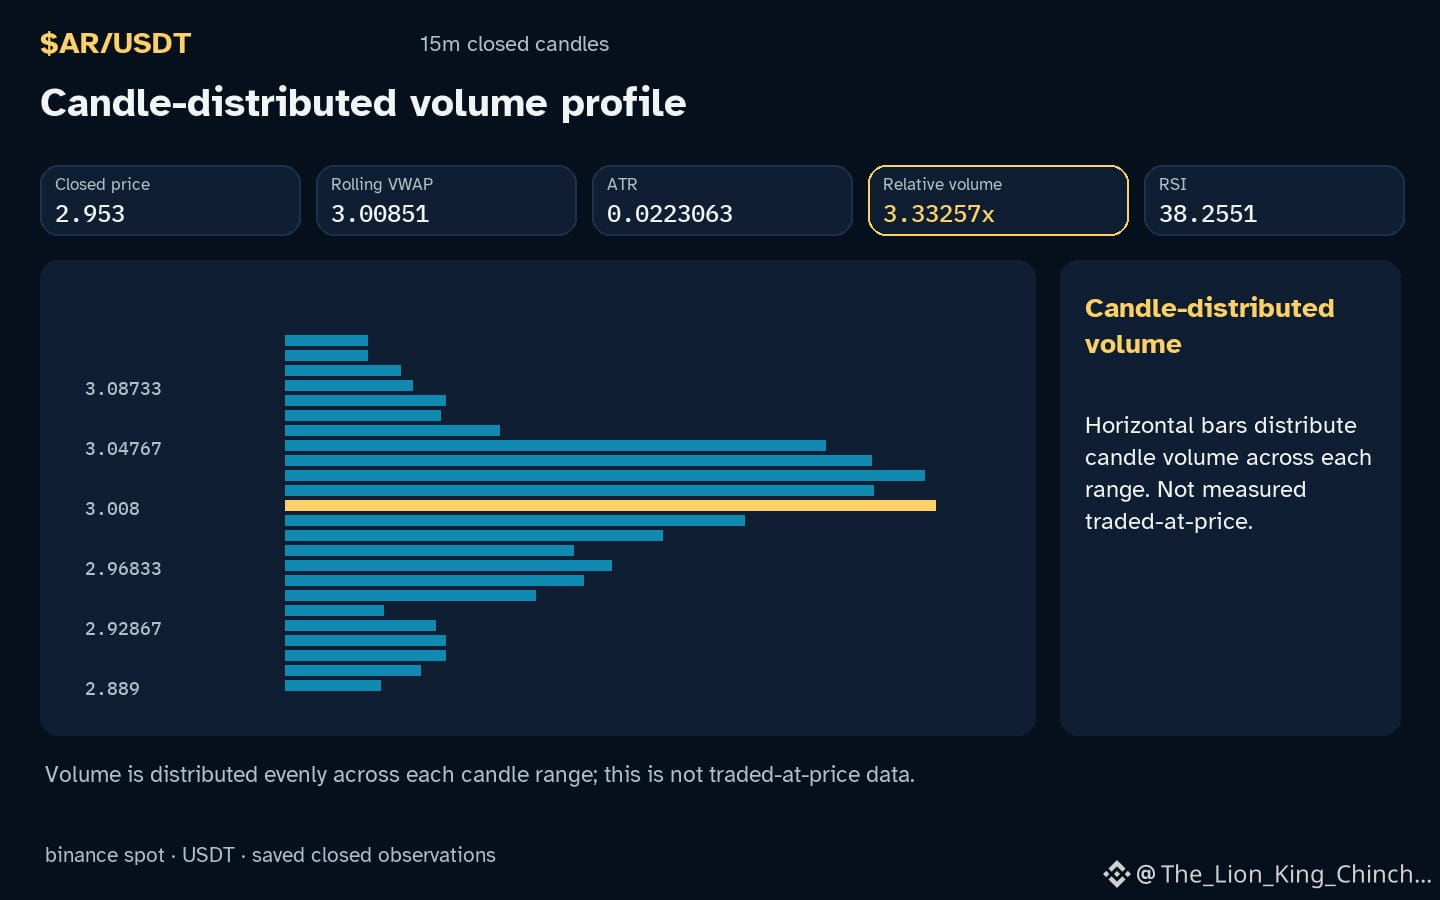
$AR: Interpreting Asymmetric Volume on Down Bars
Why does $AR show a down hourly direction while volume sits above baseline? One possible clue comes from the tape across a twenty‑bar window, where the larger bars tend to carry higher relative volume 3.33x the recent baseline. If the down moves consistently align with heavier volume, a reader might infer that sellers are more aggressive in the short term. An alternative reading is that the volume spike reflects a transient imbalance, perhaps a single large market order that does not represent a sustained trend, especially when the RSI 38.3 remains neutral and the price stays inside the recorded range.
The first scenario leans on the idea that volume on down bars signals stronger downward pressure. This interpretation would weaken if subsequent bars show light volume on further declines or if the next up‑bars regain volume parity, suggesting the heavy down‑bar volume was an isolated event. Conversely, the second scenario assumes the volume spike is a blip; it would lose credibility if the next ten bars maintain elevated volume on down moves and the RSI begins to trend lower, indicating momentum building on the downside.
Both hypotheses acknowledge limits: only closed candles are observable, and no order‑book or participant intent is available. A concrete reassessment point arrives when the next closed bar either repeats the high‑volume down pattern or shows a reversal with low volume on up moves, at which moment the initial reading should be revisited.
Probabilistic market research, not a recommendation or guaranteed return.
#AR #MarketAnalysis
$AR : Interpreting Asymmetric Volume on Down Bars
Why does $AR show a down hourly direction while volume sits above baseline? One possible clue comes from the tape across a twenty‑bar window, where the larger bars tend to carry higher relative volume 3.33x the recent baseline. If the down moves consistently align with heavier volume, a reader might infer that sellers are more aggressive in the short term. An alternative reading is that the volume spike reflects a transient imbalance, perhaps a single large market order that does not represent a sustained trend, especially when the RSI 38.3 remains neutral and the price stays inside the recorded range.
The first scenario leans on the idea that volume on down bars signals stronger downward pressure. This interpretation would weaken if subsequent bars show light volume on further declines or if the next up‑bars regain volume parity, suggesting the heavy down‑bar volume was an isolated event. Conversely, the second scenario assumes the volume spike is a blip; it would lose credibility if the next ten bars maintain elevated volume on down moves and the RSI begins to trend lower, indicating momentum building on the downside.
Both hypotheses acknowledge limits: only closed candles are observable, and no order‑book or participant intent is available. A concrete reassessment point arrives when the next closed bar either repeats the high‑volume down pattern or shows a reversal with low volume on up moves, at which moment the initial reading should be revisited.
Probabilistic market research, not a recommendation or guaranteed return.
#AR #MarketAnalysis
Why does $AR show a down hourly direction while volume sits above baseline? One possible clue comes from the tape across a twenty‑bar window, where the larger bars tend to carry higher relative volume 3.33x the recent baseline. If the down moves consistently align with heavier volume, a reader might infer that sellers are more aggressive in the short term. An alternative reading is that the volume spike reflects a transient imbalance, perhaps a single large market order that does not represent a sustained trend, especially when the RSI 38.3 remains neutral and the price stays inside the recorded range.
The first scenario leans on the idea that volume on down bars signals stronger downward pressure. This interpretation would weaken if subsequent bars show light volume on further declines or if the next up‑bars regain volume parity, suggesting the heavy down‑bar volume was an isolated event. Conversely, the second scenario assumes the volume spike is a blip; it would lose credibility if the next ten bars maintain elevated volume on down moves and the RSI begins to trend lower, indicating momentum building on the downside.
Both hypotheses acknowledge limits: only closed candles are observable, and no order‑book or participant intent is available. A concrete reassessment point arrives when the next closed bar either repeats the high‑volume down pattern or shows a reversal with low volume on up moves, at which moment the initial reading should be revisited.
Probabilistic market research, not a recommendation or guaranteed return.
#AR #MarketAnalysis
107
$AR: Rethinking Volume as a One‑Way Signal
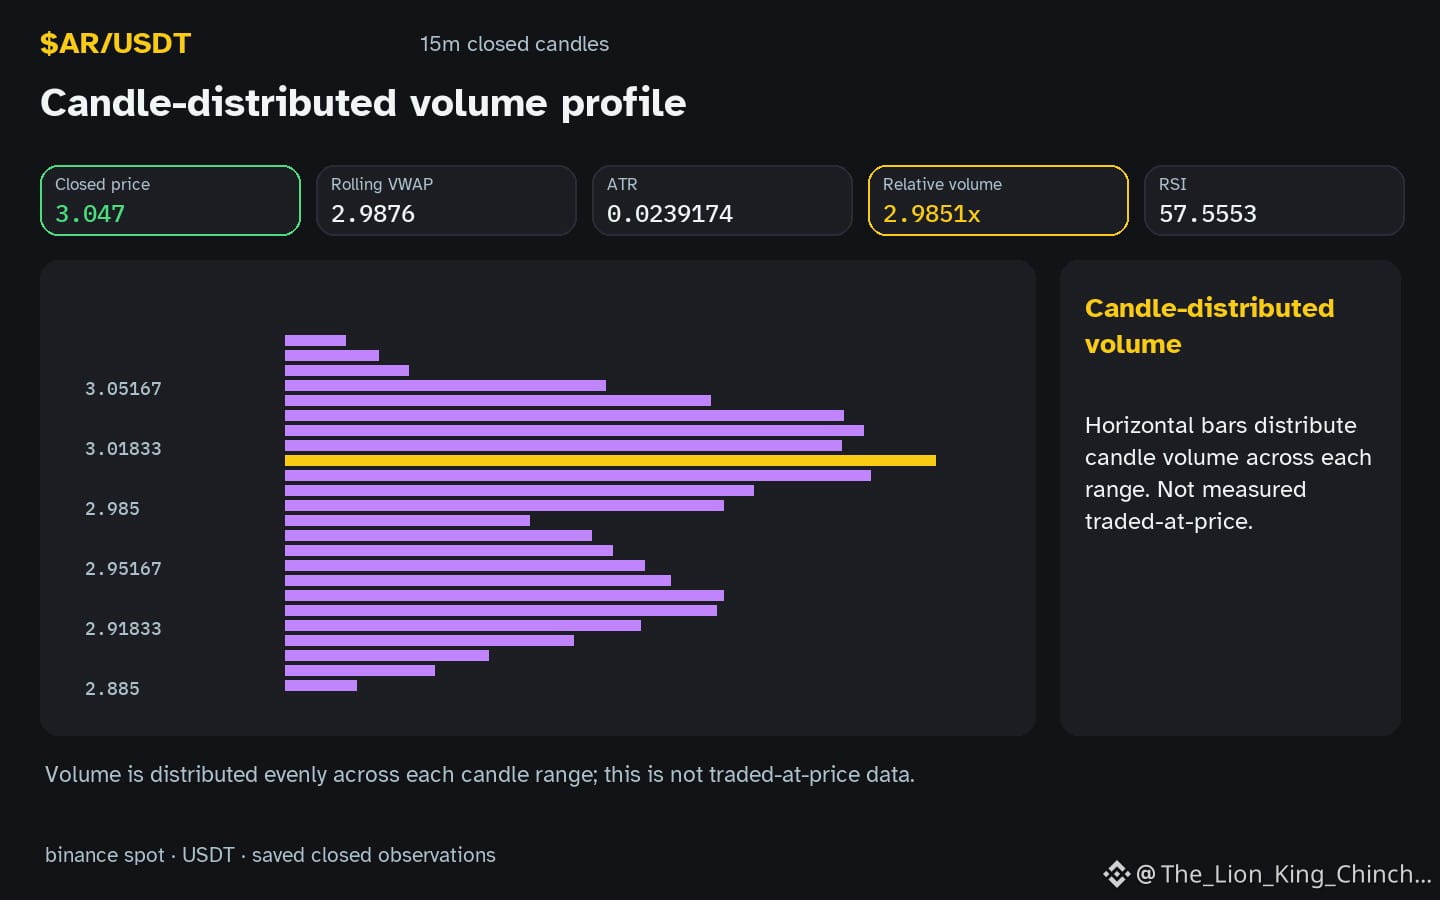
When I glance at $AR and see the candle pointing down while the volume gauge reads 2.99x baseline, a tiny voice in my research notebook wonders if the old rule – "more volume always means bullish accumulation" – still applies. The tempting shortcut is to label any above‑baseline volume as buying pressure, but that ignores the directional context.
A more careful interpretation asks: could the heightened volume simply reflect heightened trading activity on a down move, perhaps driven by stop‑losses or short covering? In this scenario the volume is a neutral amplifier, not a directional cue. The observation that the hourly direction is down while volume is above baseline supports this alternative reading.
A useful next observation would be to watch the next closed candle. If the price rebounds and RSI 57.6 rises toward neutral, the earlier volume spike may have been a precursor to accumulation. Conversely, if the down trend continues and RSI stays low, the volume likely represented distribution. By pairing direction with volume and a single momentum metric, we avoid the one‑way myth and keep our analysis grounded in what the charts actually show. 😊
Probabilistic market research, not a recommendation or guaranteed return.
The comparison to keep in mind: $BTC has hourly direction down and volume not above its baseline; $SOPH has hourly direction up and volume above its baseline. This alone does not establish correlation.
#AR #BTC #SOPH #LearnCrypto
$AR : Rethinking Volume as a One‑Way Signal
When I glance at $AR and see the candle pointing down while the volume gauge reads 2.99x baseline, a tiny voice in my research notebook wonders if the old rule – "more volume always means bullish accumulation" – still applies. The tempting shortcut is to label any above‑baseline volume as buying pressure, but that ignores the directional context.
A more careful interpretation asks: could the heightened volume simply reflect heightened trading activity on a down move, perhaps driven by stop‑losses or short covering? In this scenario the volume is a neutral amplifier, not a directional cue. The observation that the hourly direction is down while volume is above baseline supports this alternative reading.
A useful next observation would be to watch the next closed candle. If the price rebounds and RSI 57.6 rises toward neutral, the earlier volume spike may have been a precursor to accumulation. Conversely, if the down trend continues and RSI stays low, the volume likely represented distribution. By pairing direction with volume and a single momentum metric, we avoid the one‑way myth and keep our analysis grounded in what the charts actually show. 😊
Probabilistic market research, not a recommendation or guaranteed return.
The comparison to keep in mind: $BTC has hourly direction down and volume not above its baseline; $SOPH has hourly direction up and volume above its baseline. This alone does not establish correlation.
#AR #BTC #SOPH #LearnCrypto
When I glance at $AR and see the candle pointing down while the volume gauge reads 2.99x baseline, a tiny voice in my research notebook wonders if the old rule – "more volume always means bullish accumulation" – still applies. The tempting shortcut is to label any above‑baseline volume as buying pressure, but that ignores the directional context.
A more careful interpretation asks: could the heightened volume simply reflect heightened trading activity on a down move, perhaps driven by stop‑losses or short covering? In this scenario the volume is a neutral amplifier, not a directional cue. The observation that the hourly direction is down while volume is above baseline supports this alternative reading.
A useful next observation would be to watch the next closed candle. If the price rebounds and RSI 57.6 rises toward neutral, the earlier volume spike may have been a precursor to accumulation. Conversely, if the down trend continues and RSI stays low, the volume likely represented distribution. By pairing direction with volume and a single momentum metric, we avoid the one‑way myth and keep our analysis grounded in what the charts actually show. 😊
Probabilistic market research, not a recommendation or guaranteed return.
The comparison to keep in mind: $BTC has hourly direction down and volume not above its baseline; $SOPH has hourly direction up and volume above its baseline. This alone does not establish correlation.
#AR #BTC #SOPH #LearnCrypto
26


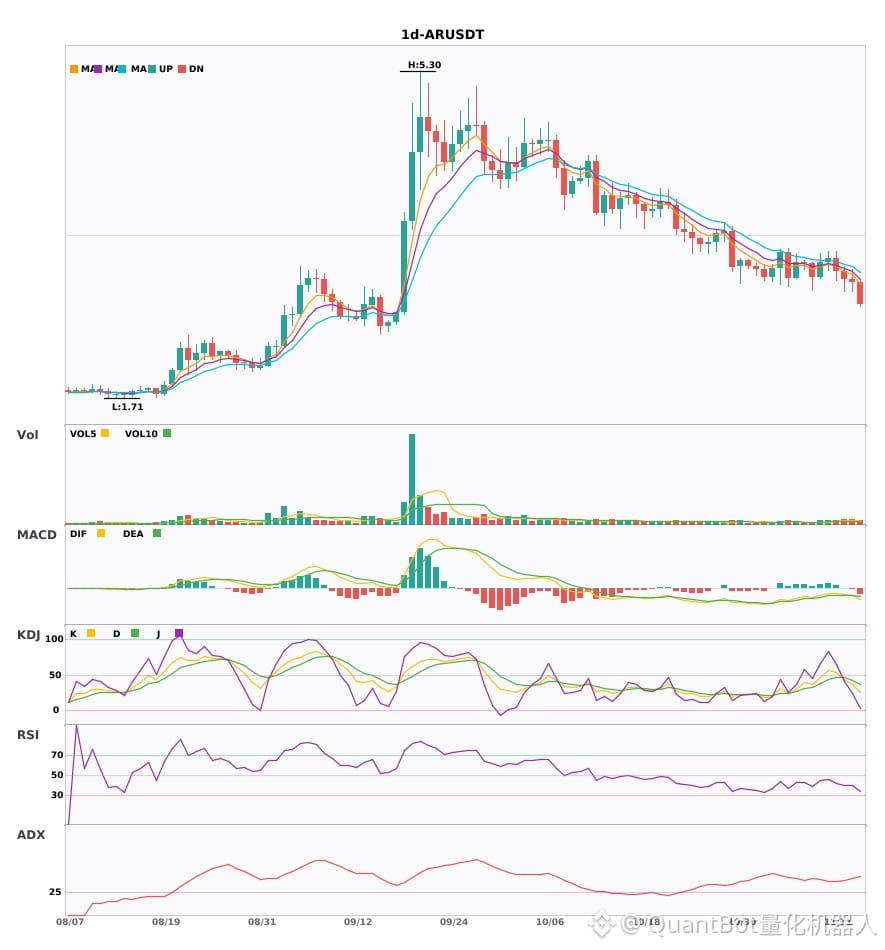
$AR Daily bearish signal alert released
📉 $AR | Daily bearish signal
━━━━━━━━━━━━━━━━━━
Technical analysis: ADX40 indicates a significant trend; MACD has formed a death cross below zero, with bearish momentum strengthening; EMA5<8<13 are in bearish alignment; KDJ is weak; volume is 1.5x normal.
Price change: -0.8000%
━━━━━━━━━━━━━━━━━━
#技术分析 #AR
📌 The above content is for reference only and does not constitute investment advice
$AR Daily bearish signal alert released
📉 $AR | Daily bearish signal
━━━━━━━━━━━━━━━━━━
Technical analysis: ADX40 indicates a significant trend; MACD has formed a death cross below zero, with bearish momentum strengthening; EMA5<8<13 are in bearish alignment; KDJ is weak; volume is 1.5x normal.
Price change: -0.8000%
━━━━━━━━━━━━━━━━━━
#技术分析 #AR
📌 The above content is for reference only and does not constitute investment advice
📉 $AR | Daily bearish signal
━━━━━━━━━━━━━━━━━━
Technical analysis: ADX40 indicates a significant trend; MACD has formed a death cross below zero, with bearish momentum strengthening; EMA5<8<13 are in bearish alignment; KDJ is weak; volume is 1.5x normal.
Price change: -0.8000%
━━━━━━━━━━━━━━━━━━
#技术分析 #AR
📌 The above content is for reference only and does not constitute investment advice
1

·
--
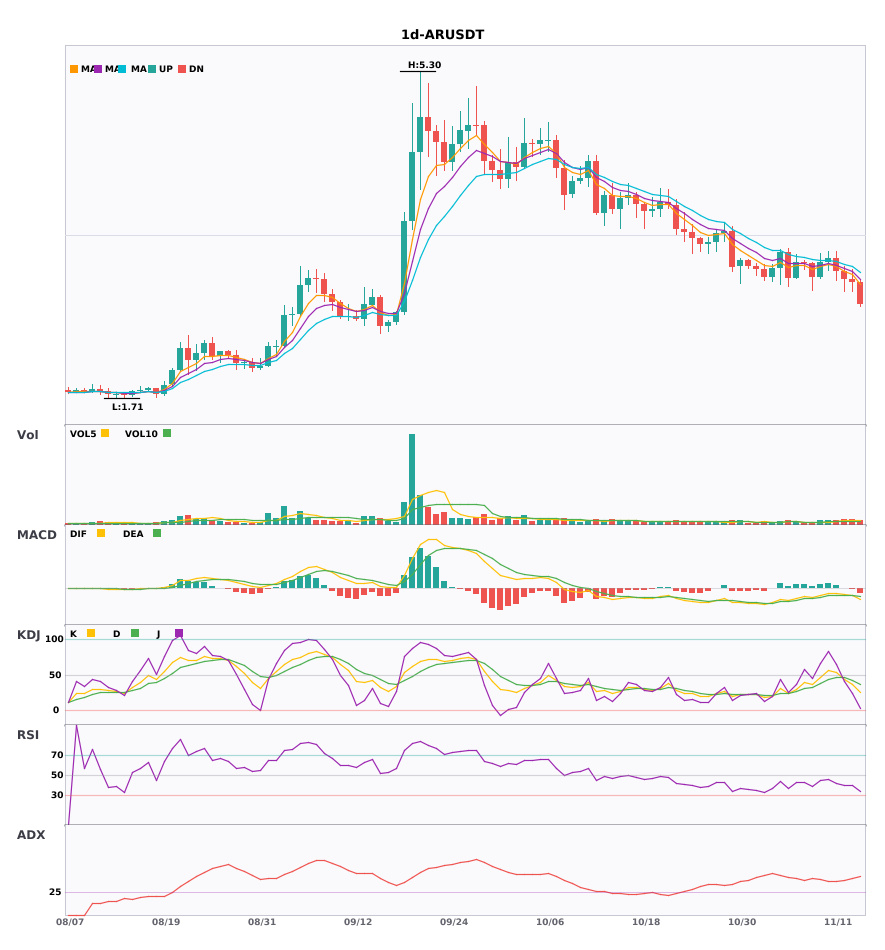
$AR daily moving averages are turning downward, signaling weakness. Be alert to risk 🔥
════════════════════
🟢 $AR Daily bearish signal
⚠️ Technical analysis: ADX is above 40, indicating a fairly clear trend. MACD has formed a death cross below zero, and bearish momentum is accelerating. The moving averages are in bearish alignment: EMA5<8<13. KDJ is weak, with K below D, favoring the bears. Volume is 1.5x, which is normal.
════════════════════
🔔 Follow for first-hand market updates 🔔
#技术分析 #AR
📌 When trading, pay attention to whether the candlestick patterns confirm the signal.
$AR daily moving averages are turning downward, signaling weakness. Be alert to risk 🔥
════════════════════
🟢 $AR Daily bearish signal
⚠️ Technical analysis: ADX is above 40, indicating a fairly clear trend. MACD has formed a death cross below zero, and bearish momentum is accelerating. The moving averages are in bearish alignment: EMA5<8<13. KDJ is weak, with K below D, favoring the bears. Volume is 1.5x, which is normal.
════════════════════
🔔 Follow for first-hand market updates 🔔
#技术分析 #AR
📌 When trading, pay attention to whether the candlestick patterns confirm the signal.
════════════════════
🟢 $AR Daily bearish signal
⚠️ Technical analysis: ADX is above 40, indicating a fairly clear trend. MACD has formed a death cross below zero, and bearish momentum is accelerating. The moving averages are in bearish alignment: EMA5<8<13. KDJ is weak, with K below D, favoring the bears. Volume is 1.5x, which is normal.
════════════════════
🔔 Follow for first-hand market updates 🔔
#技术分析 #AR
📌 When trading, pay attention to whether the candlestick patterns confirm the signal.
34

·
--
Checking the market in the evening, $AR broke below the 30-day low: 2.764 (previous low: 2.781).
I decided to go wash my face first and face it when I get back.
Only after the selling pressure has been cleared will there be a decent rebound.
#AR
Checking the market in the evening, $AR broke below the 30-day low: 2.764 (previous low: 2.781).
I decided to go wash my face first and face it when I get back.
Only after the selling pressure has been cleared will there be a decent rebound.
#AR
I decided to go wash my face first and face it when I get back.
Only after the selling pressure has been cleared will there be a decent rebound.
#AR
2

·
--
Watch the money, not the talk:
$AR 30 hit a new low today. Current price: 2.765; previous low: 2.781; 24h: -8.47%.
There’s little sign of buying support near the new low for now. Money is mostly flowing out, so there’s no rush to buy the dip.
What confirmation are you waiting for before making a move?
#AR
Watch the money, not the talk:
$AR 30 hit a new low today. Current price: 2.765; previous low: 2.781; 24h: -8.47%.
There’s little sign of buying support near the new low for now. Money is mostly flowing out, so there’s no rush to buy the dip.
What confirmation are you waiting for before making a move?
#AR
$AR 30 hit a new low today. Current price: 2.765; previous low: 2.781; 24h: -8.47%.
There’s little sign of buying support near the new low for now. Money is mostly flowing out, so there’s no rush to buy the dip.
What confirmation are you waiting for before making a move?
#AR
16

·
--
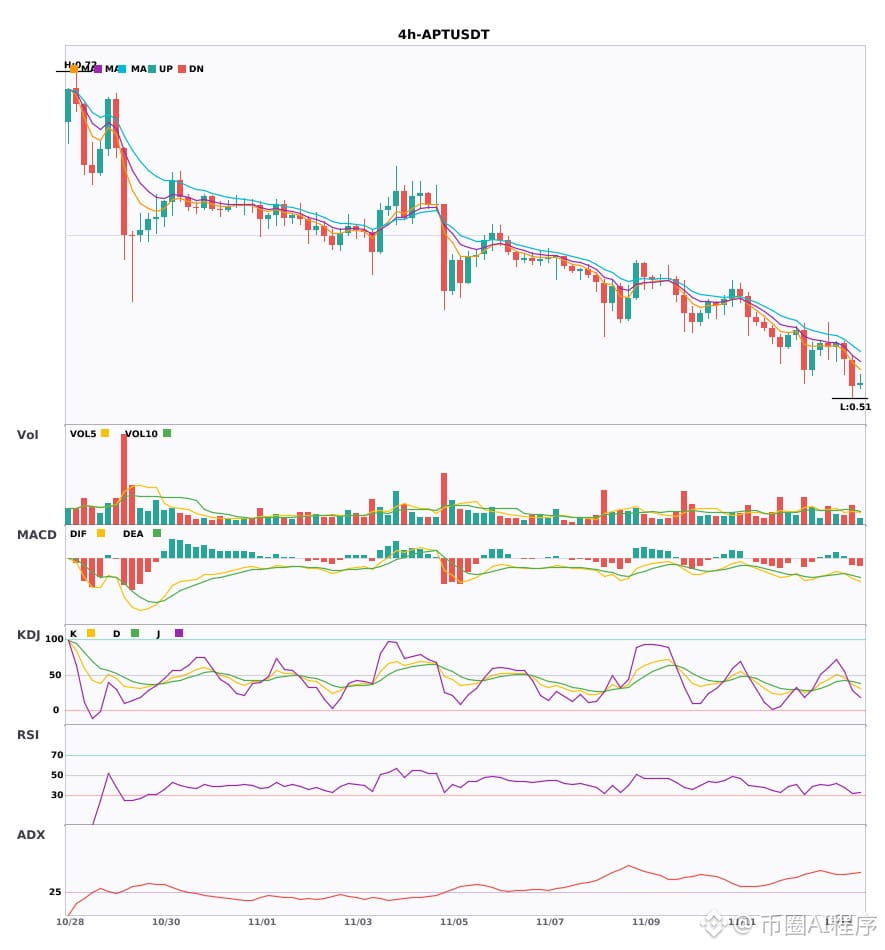
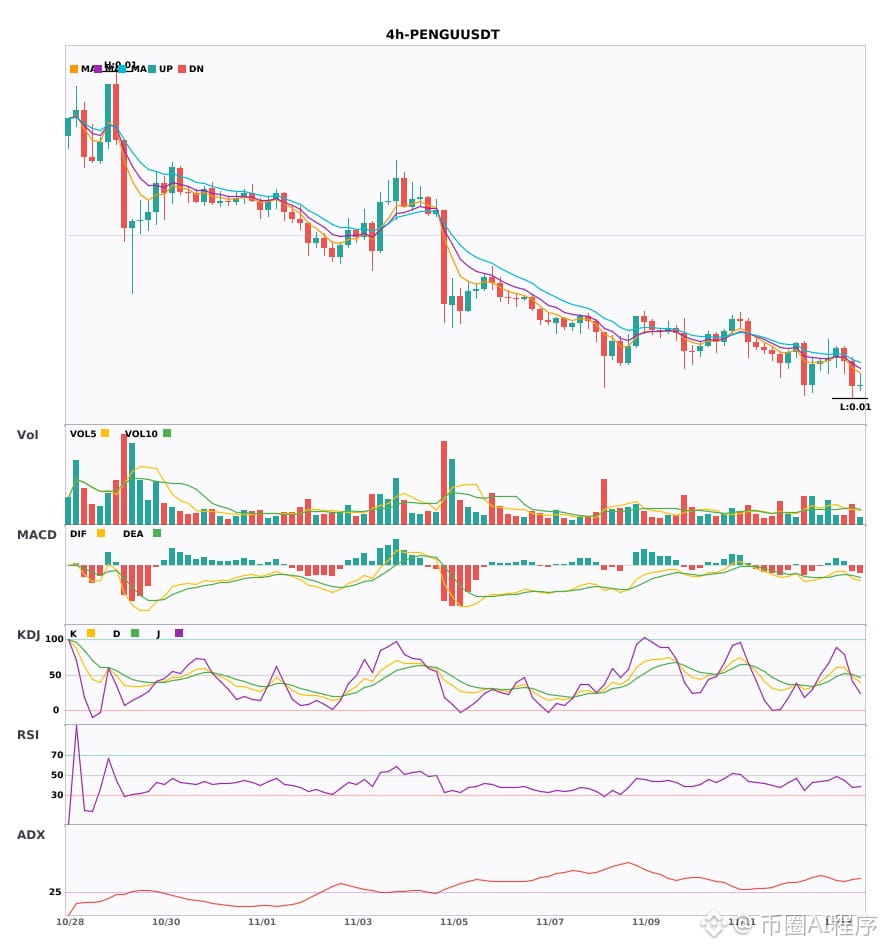
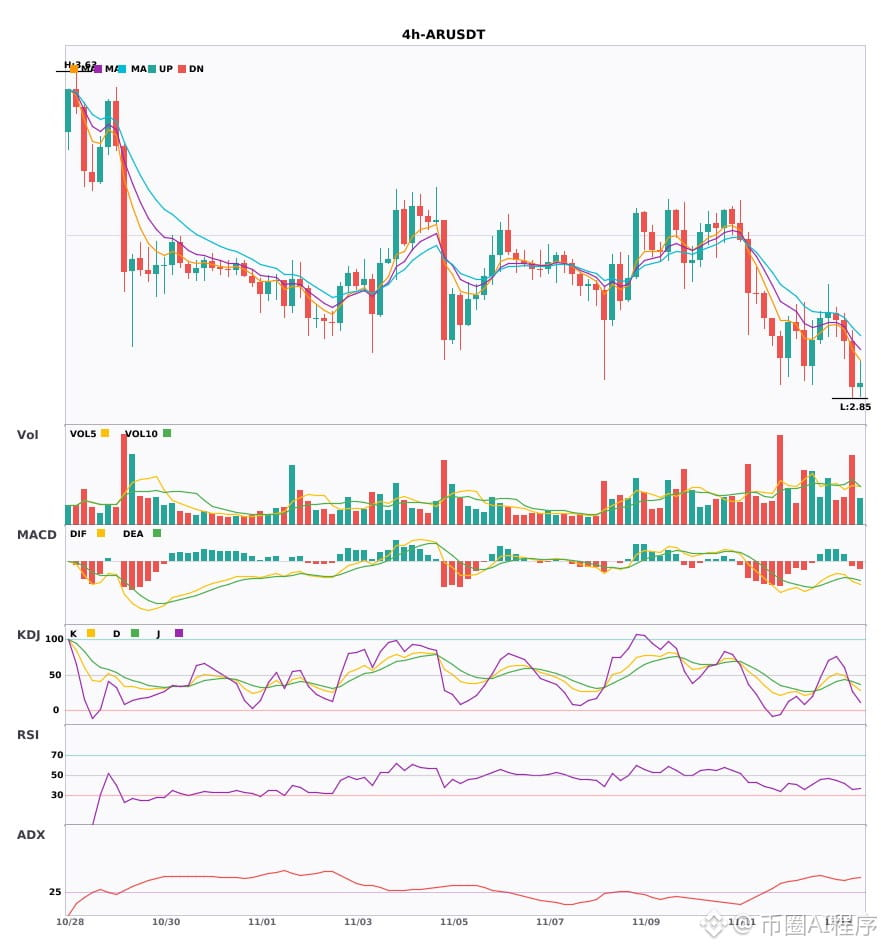
Three assets are bearish on both the 4-hour and daily charts—bearish trend confirmed by both timeframes 🔥
════════════════════
🟢 $APT 4 4-hour bearish signal
⚠️ Technical analysis: Multi-timeframe convergence favors a short position: the 4-hour MACD has a bearish crossover with expanding green bars, moving averages are bearishly aligned and sloping downward, and the KDJ has crossed bearishly without entering oversold territory. The daily chart confirms the bearish convergence; near-term outlook is bearish.
════════════════════
🟢 $PENGU 4 4-hour bearish signal
⚠️ Technical analysis: Bearish convergence confirmed on both the daily and 4-hour charts! MACD has crossed bearishly below zero with rising volume; moving averages are bearishly aligned and sloping downward; KDJ has crossed bearishly without becoming oversold (K47.4/D50.4). Volume is 1.2× average. Bearish outlook.
════════════════════
🟢 $AR 4 4-hour bearish signal
⚠️ Technical analysis: Bearish convergence on the daily and 4-hour charts! The 4-hour MACD has crossed bearishly below zero with rising volume, moving averages are bearishly aligned and sloping downward, and KDJ has crossed bearishly without becoming oversold. The daily chart confirms the same direction, reinforcing the bearish outlook.
════════════════════
🔔 Follow for first-hand market updates 🔔
#多周期共振 #APT #PENGU #AR
📌 When trading, pay attention to whether the candlestick patterns align
Three assets are bearish on both the 4-hour and daily charts—bearish trend confirmed by both timeframes 🔥
════════════════════
🟢 $APT 4 4-hour bearish signal
⚠️ Technical analysis: Multi-timeframe convergence favors a short position: the 4-hour MACD has a bearish crossover with expanding green bars, moving averages are bearishly aligned and sloping downward, and the KDJ has crossed bearishly without entering oversold territory. The daily chart confirms the bearish convergence; near-term outlook is bearish.
════════════════════
🟢 $PENGU 4 4-hour bearish signal
⚠️ Technical analysis: Bearish convergence confirmed on both the daily and 4-hour charts! MACD has crossed bearishly below zero with rising volume; moving averages are bearishly aligned and sloping downward; KDJ has crossed bearishly without becoming oversold (K47.4/D50.4). Volume is 1.2× average. Bearish outlook.
════════════════════
🟢 $AR 4 4-hour bearish signal
⚠️ Technical analysis: Bearish convergence on the daily and 4-hour charts! The 4-hour MACD has crossed bearishly below zero with rising volume, moving averages are bearishly aligned and sloping downward, and KDJ has crossed bearishly without becoming oversold. The daily chart confirms the same direction, reinforcing the bearish outlook.
════════════════════
🔔 Follow for first-hand market updates 🔔
#多周期共振 #APT #PENGU #AR
📌 When trading, pay attention to whether the candlestick patterns align
════════════════════
🟢 $APT 4 4-hour bearish signal
⚠️ Technical analysis: Multi-timeframe convergence favors a short position: the 4-hour MACD has a bearish crossover with expanding green bars, moving averages are bearishly aligned and sloping downward, and the KDJ has crossed bearishly without entering oversold territory. The daily chart confirms the bearish convergence; near-term outlook is bearish.
════════════════════
🟢 $PENGU 4 4-hour bearish signal
⚠️ Technical analysis: Bearish convergence confirmed on both the daily and 4-hour charts! MACD has crossed bearishly below zero with rising volume; moving averages are bearishly aligned and sloping downward; KDJ has crossed bearishly without becoming oversold (K47.4/D50.4). Volume is 1.2× average. Bearish outlook.
════════════════════
🟢 $AR 4 4-hour bearish signal
⚠️ Technical analysis: Bearish convergence on the daily and 4-hour charts! The 4-hour MACD has crossed bearishly below zero with rising volume, moving averages are bearishly aligned and sloping downward, and KDJ has crossed bearishly without becoming oversold. The daily chart confirms the same direction, reinforcing the bearish outlook.
════════════════════
🔔 Follow for first-hand market updates 🔔
#多周期共振 #APT #PENGU #AR
📌 When trading, pay attention to whether the candlestick patterns align
28
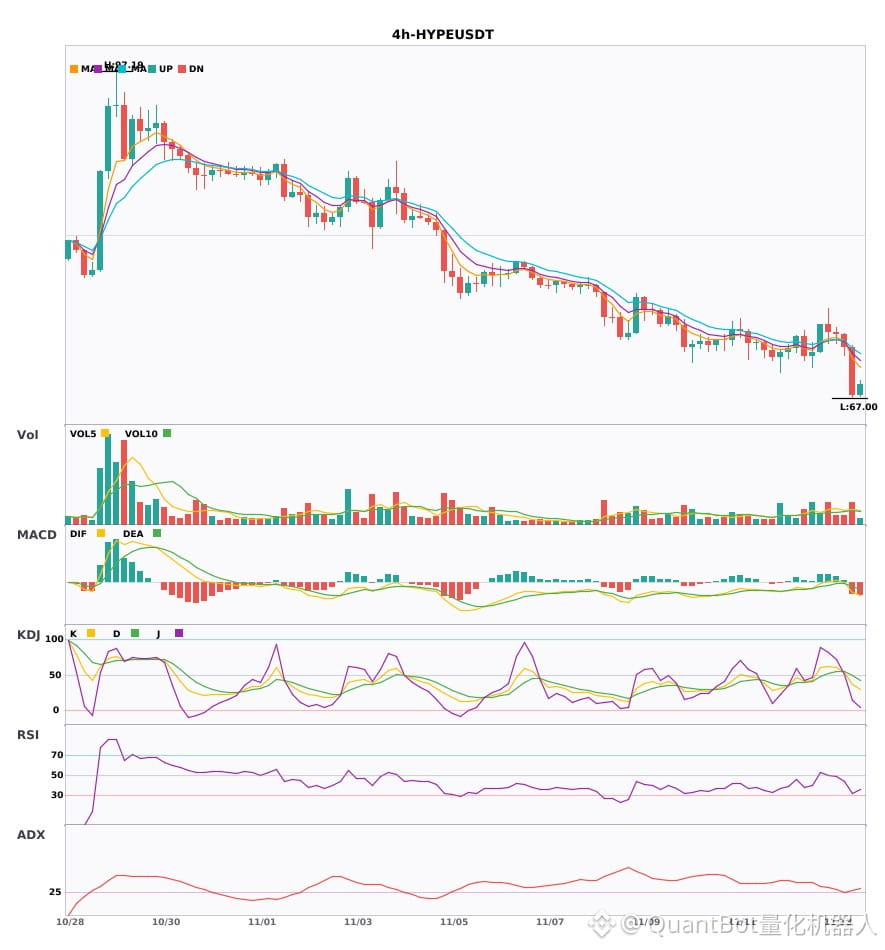
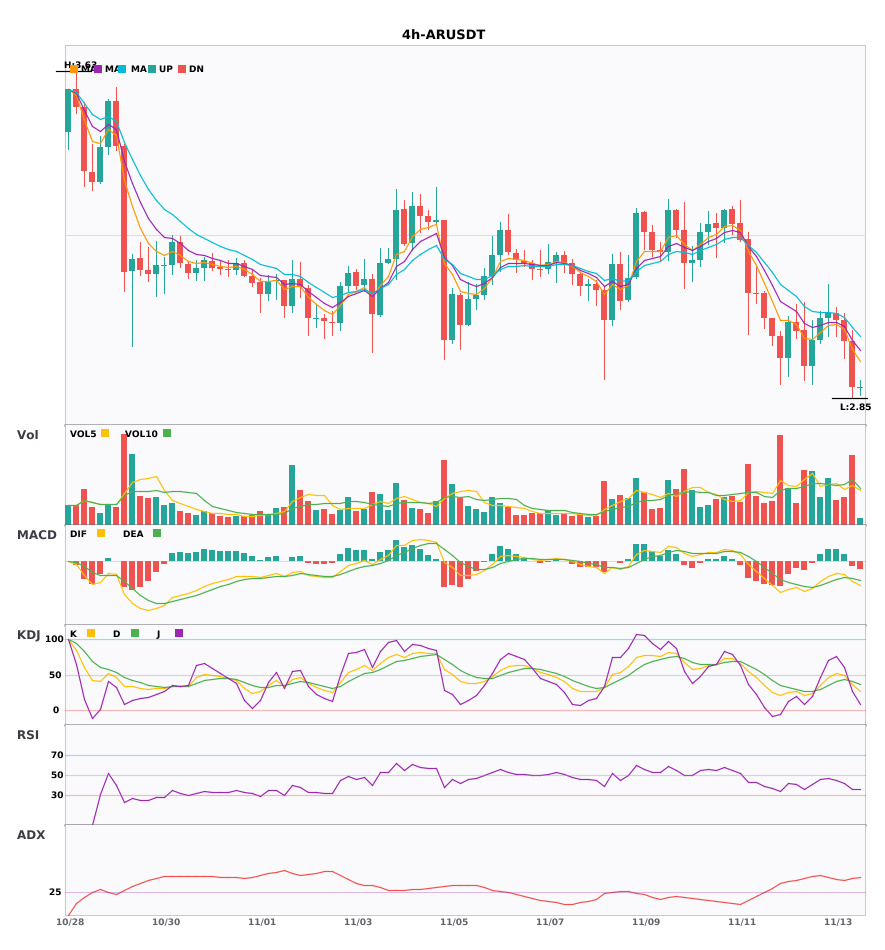
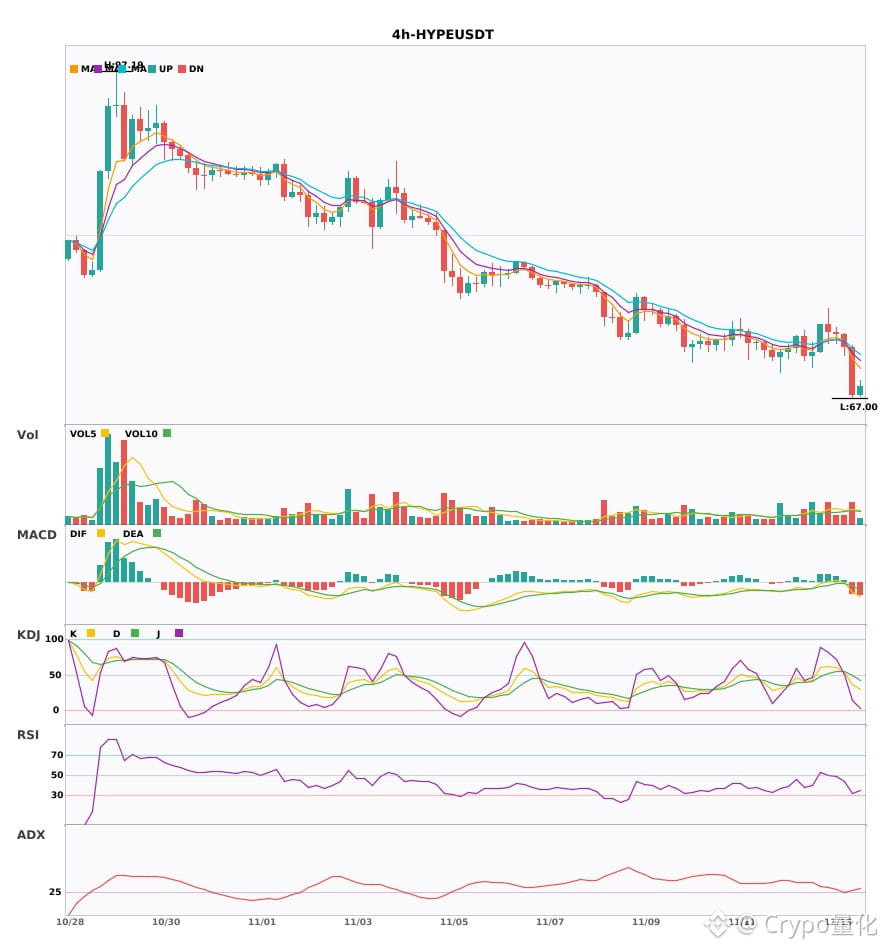
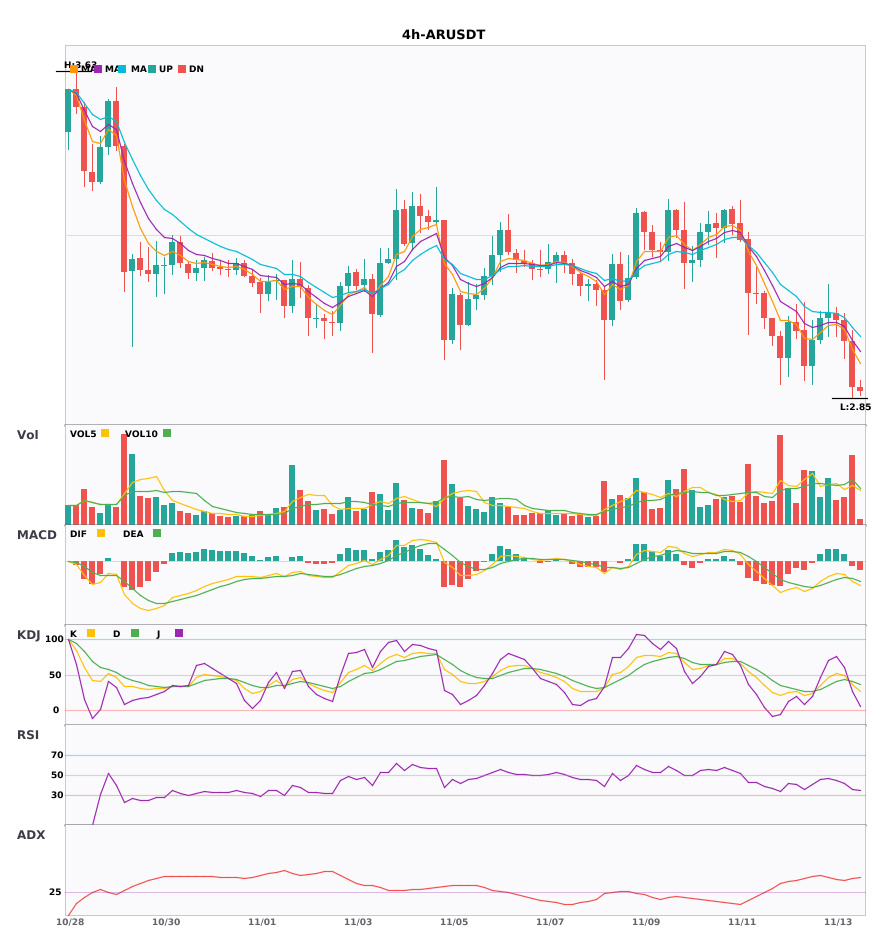
4-hour dual-coin short signals: HYPE and AR alert
📉 $HYPE | 4-hour bearish signal
━━━━━━━━━━━━━━━━━━
Technical analysis: ADX (27) indicates the trend is gaining momentum; entry is possible. MACD has formed a death cross below zero, accelerating bearish momentum. EMA5 has crossed below EMA8, signaling a short-term bearish trend. KDJ is weak, with bears in control (K36.9/D48.6). Volume has increased 1.5 times.
Price change: -6.0700%
📌 Market update: Binance Earn Dual Investment now supports HYPE
📉 $AR | 4-hour bearish signal
━━━━━━━━━━━━━━━━━━
Technical analysis: ADX is at 41, indicating a clear trend. MACD has formed a death cross below the zero line, strengthening bearish momentum. Moving averages are in a bearish alignment. KDJ has formed a death cross (K36.2/D41.2), indicating a bearish bias. Trading volume has increased 1.5 times.
Price change: -3.6800%
━━━━━━━━━━━━━━━━━━
#技术分析 #HYPE #AR
📌 The above content is for reference only and does not constitute investment advice
4-hour dual-coin short signals: HYPE and AR alert
📉 $HYPE | 4-hour bearish signal
━━━━━━━━━━━━━━━━━━
Technical analysis: ADX (27) indicates the trend is gaining momentum; entry is possible. MACD has formed a death cross below zero, accelerating bearish momentum. EMA5 has crossed below EMA8, signaling a short-term bearish trend. KDJ is weak, with bears in control (K36.9/D48.6). Volume has increased 1.5 times.
Price change: -6.0700%
📌 Market update: Binance Earn Dual Investment now supports HYPE
📉 $AR | 4-hour bearish signal
━━━━━━━━━━━━━━━━━━
Technical analysis: ADX is at 41, indicating a clear trend. MACD has formed a death cross below the zero line, strengthening bearish momentum. Moving averages are in a bearish alignment. KDJ has formed a death cross (K36.2/D41.2), indicating a bearish bias. Trading volume has increased 1.5 times.
Price change: -3.6800%
━━━━━━━━━━━━━━━━━━
#技术分析 #HYPE #AR
📌 The above content is for reference only and does not constitute investment advice
📉 $HYPE | 4-hour bearish signal
━━━━━━━━━━━━━━━━━━
Technical analysis: ADX (27) indicates the trend is gaining momentum; entry is possible. MACD has formed a death cross below zero, accelerating bearish momentum. EMA5 has crossed below EMA8, signaling a short-term bearish trend. KDJ is weak, with bears in control (K36.9/D48.6). Volume has increased 1.5 times.
Price change: -6.0700%
📌 Market update: Binance Earn Dual Investment now supports HYPE
📉 $AR | 4-hour bearish signal
━━━━━━━━━━━━━━━━━━
Technical analysis: ADX is at 41, indicating a clear trend. MACD has formed a death cross below the zero line, strengthening bearish momentum. Moving averages are in a bearish alignment. KDJ has formed a death cross (K36.2/D41.2), indicating a bearish bias. Trading volume has increased 1.5 times.
Price change: -3.6800%
━━━━━━━━━━━━━━━━━━
#技术分析 #HYPE #AR
📌 The above content is for reference only and does not constitute investment advice
32
·
--
$HYPE / $AR 4-hour bearish; short-term pressure is building, so don’t rush to buy the dip 🔥
════════════════════
🟢 $HYPE 4-hour bearish signal
⚠️Technical analysis: ADX trend is established; entry is possible | MACD bearish crossover below zero, green bars expanding | Moving average death cross | Weak KDJ: K36.9, D48.6 | Volume up 1.5x
📢Market update: Binance Earn: Dual Investment now supports the HYPE token.
════════════════════
🟢 $AR 4-hour bearish signal
⚠️Technical analysis: ADX 41, strong trend|MACD bearish crossover below zero|Moving averages in bearish alignment|KDJ bearish crossover (K36.2/D41.2)|Volume up 1.5x
════════════════════
🔔 Follow for first-hand market alerts 🔔
#技术分析 #HYPE #AR
📌 When trading, pay attention to whether the candlestick pattern confirms the setup
$HYPE / $AR 4-hour bearish; short-term pressure is building, so don’t rush to buy the dip 🔥
════════════════════
🟢 $HYPE 4-hour bearish signal
⚠️Technical analysis: ADX trend is established; entry is possible | MACD bearish crossover below zero, green bars expanding | Moving average death cross | Weak KDJ: K36.9, D48.6 | Volume up 1.5x
📢Market update: Binance Earn: Dual Investment now supports the HYPE token.
════════════════════
🟢 $AR 4-hour bearish signal
⚠️Technical analysis: ADX 41, strong trend|MACD bearish crossover below zero|Moving averages in bearish alignment|KDJ bearish crossover (K36.2/D41.2)|Volume up 1.5x
════════════════════
🔔 Follow for first-hand market alerts 🔔
#技术分析 #HYPE #AR
📌 When trading, pay attention to whether the candlestick pattern confirms the setup
════════════════════
🟢 $HYPE 4-hour bearish signal
⚠️Technical analysis: ADX trend is established; entry is possible | MACD bearish crossover below zero, green bars expanding | Moving average death cross | Weak KDJ: K36.9, D48.6 | Volume up 1.5x
📢Market update: Binance Earn: Dual Investment now supports the HYPE token.
════════════════════
🟢 $AR 4-hour bearish signal
⚠️Technical analysis: ADX 41, strong trend|MACD bearish crossover below zero|Moving averages in bearish alignment|KDJ bearish crossover (K36.2/D41.2)|Volume up 1.5x
════════════════════
🔔 Follow for first-hand market alerts 🔔
#技术分析 #HYPE #AR
📌 When trading, pay attention to whether the candlestick pattern confirms the setup
34

·
--
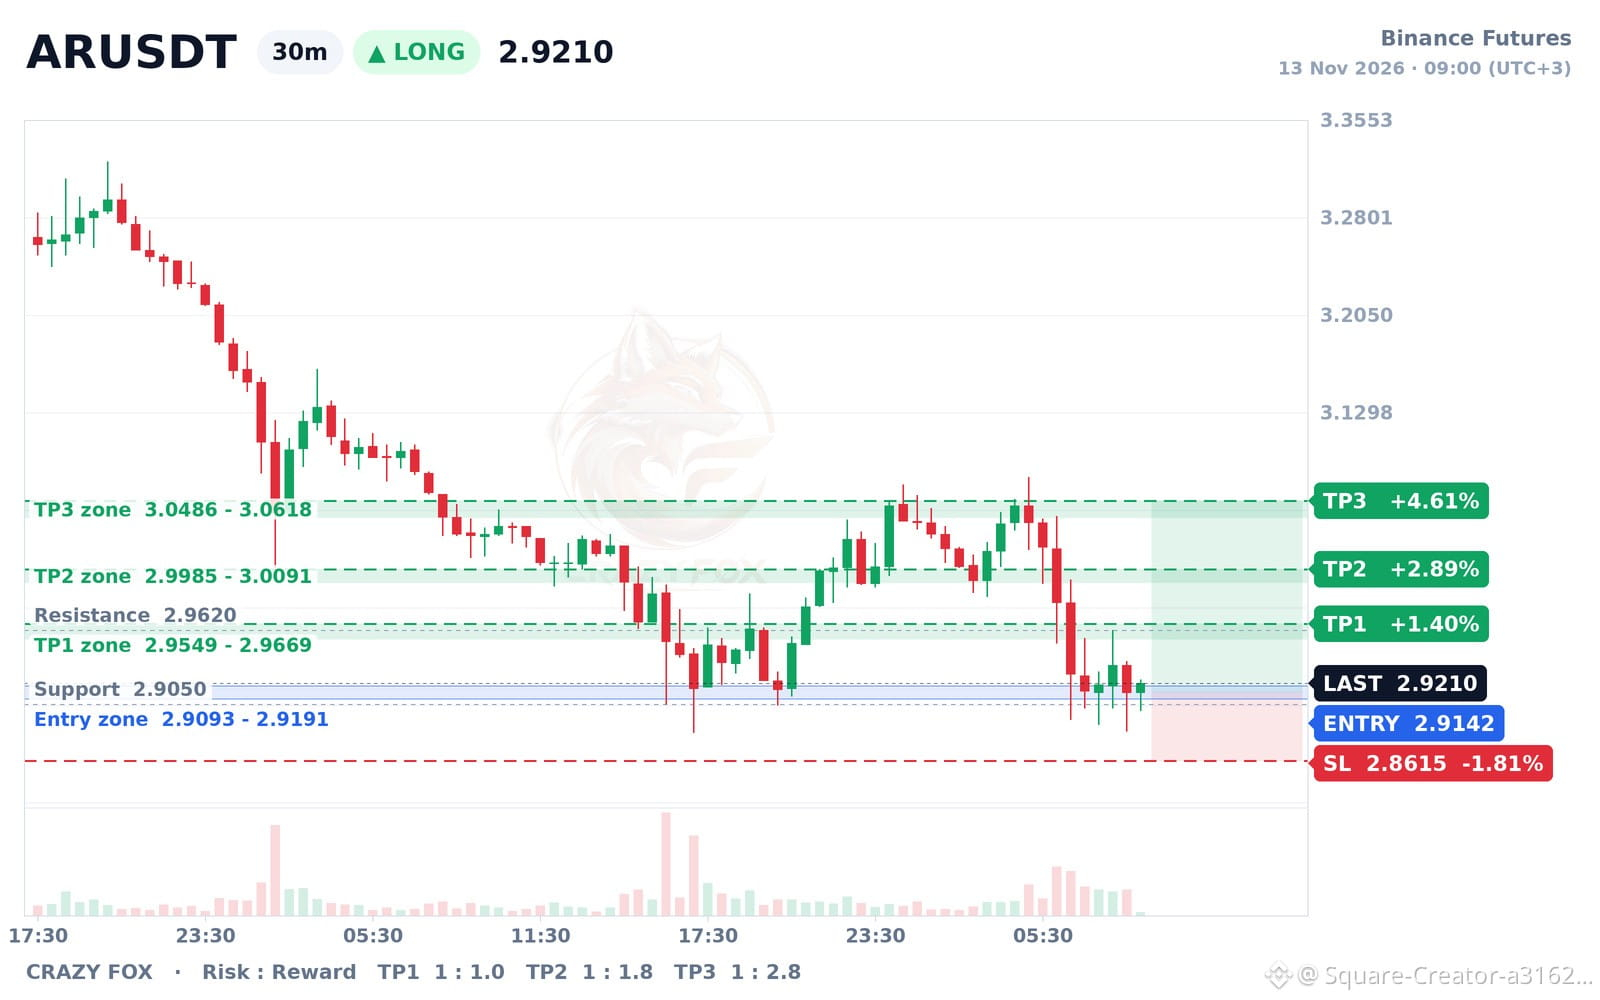
🦊 $AR · LONG buy 📈 · 30m
📍 Entry: 2.9093 – 2.9191 (wait for the pullback)
🎯 Target 1: 2.9549 – 2.9669 (+1.40%)
🎯 Target 2: 2.9985 – 3.0091 (+2.89%)
🎯 Target 3: 3.0486 – 3.0618 (+4.61%)
🛑 Stop: 2.8615 (-1.81%)
🤝 Your funds are entrusted to us · Not financial advice
#AR #CRAZYFOX
🦊 $AR · LONG buy 📈 · 30m
📍 Entry: 2.9093 – 2.9191 (wait for the pullback)
🎯 Target 1: 2.9549 – 2.9669 (+1.40%)
🎯 Target 2: 2.9985 – 3.0091 (+2.89%)
🎯 Target 3: 3.0486 – 3.0618 (+4.61%)
🛑 Stop: 2.8615 (-1.81%)
🤝 Your funds are entrusted to us · Not financial advice
#AR #CRAZYFOX
📍 Entry: 2.9093 – 2.9191 (wait for the pullback)
🎯 Target 1: 2.9549 – 2.9669 (+1.40%)
🎯 Target 2: 2.9985 – 3.0091 (+2.89%)
🎯 Target 3: 3.0486 – 3.0618 (+4.61%)
🛑 Stop: 2.8615 (-1.81%)
🤝 Your funds are entrusted to us · Not financial advice
#AR #CRAZYFOX
155

·
--
Bullish
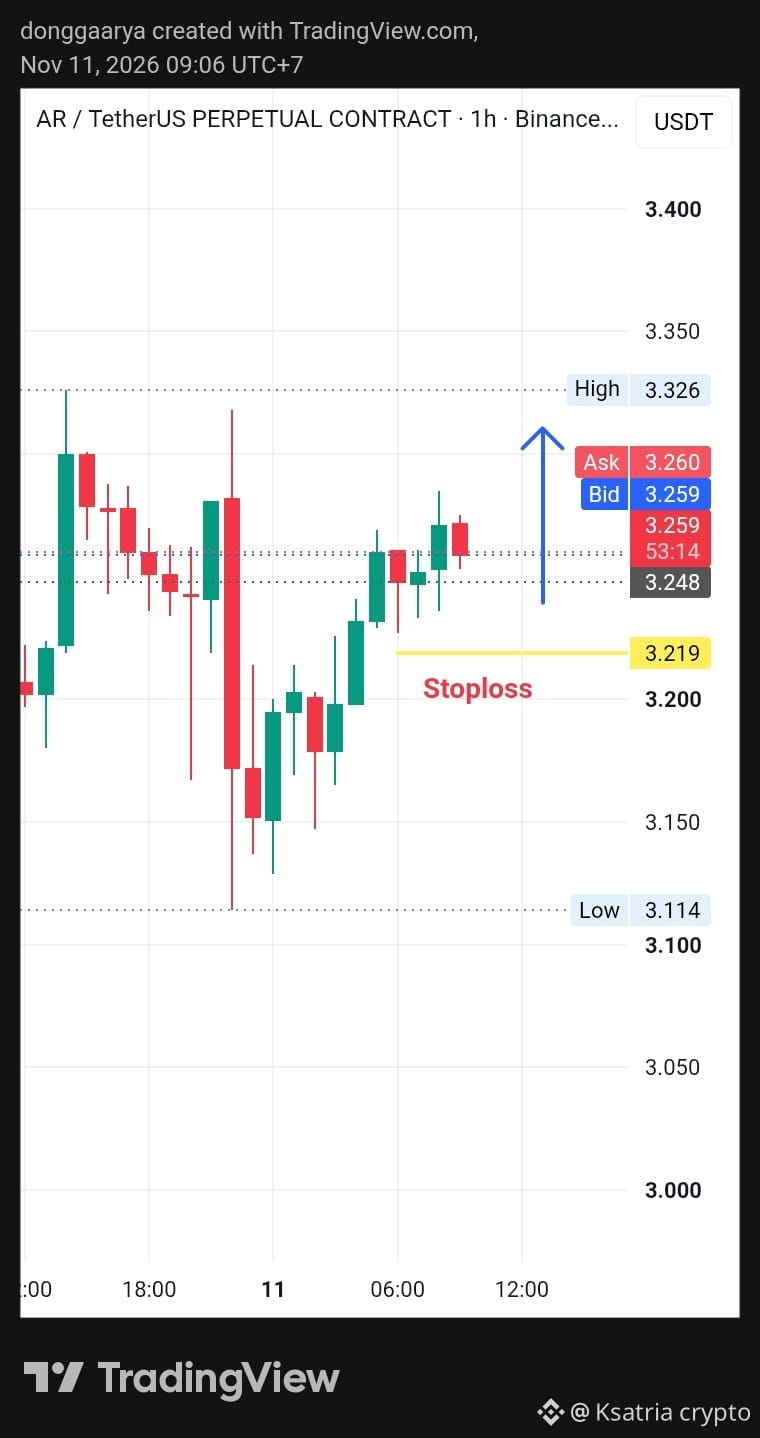
$AR TAKE LONG POSITION NOW
SL 3,219
$AR arweave take long position now after show continuation bullish pump moments and potential for breakout break our next resistance target at range level 3,326.
Based our macroeconomics fundamental analysist this coin show positif open interest ( OI) ITS means capital inflow more than capital outflow $AR
#Write2Earn #ar #arusdt #Arweave #signaladvisor
{future}(ARUSDT)
$AR TAKE LONG POSITION NOW
SL 3,219
$AR arweave take long position now after show continuation bullish pump moments and potential for breakout break our next resistance target at range level 3,326.
Based our macroeconomics fundamental analysist this coin show positif open interest ( OI) ITS means capital inflow more than capital outflow $AR
#Write2Earn #ar #arusdt #Arweave #signaladvisor
SL 3,219
$AR arweave take long position now after show continuation bullish pump moments and potential for breakout break our next resistance target at range level 3,326.
Based our macroeconomics fundamental analysist this coin show positif open interest ( OI) ITS means capital inflow more than capital outflow $AR
#Write2Earn #ar #arusdt #Arweave #signaladvisor
1
888

·
--
Article
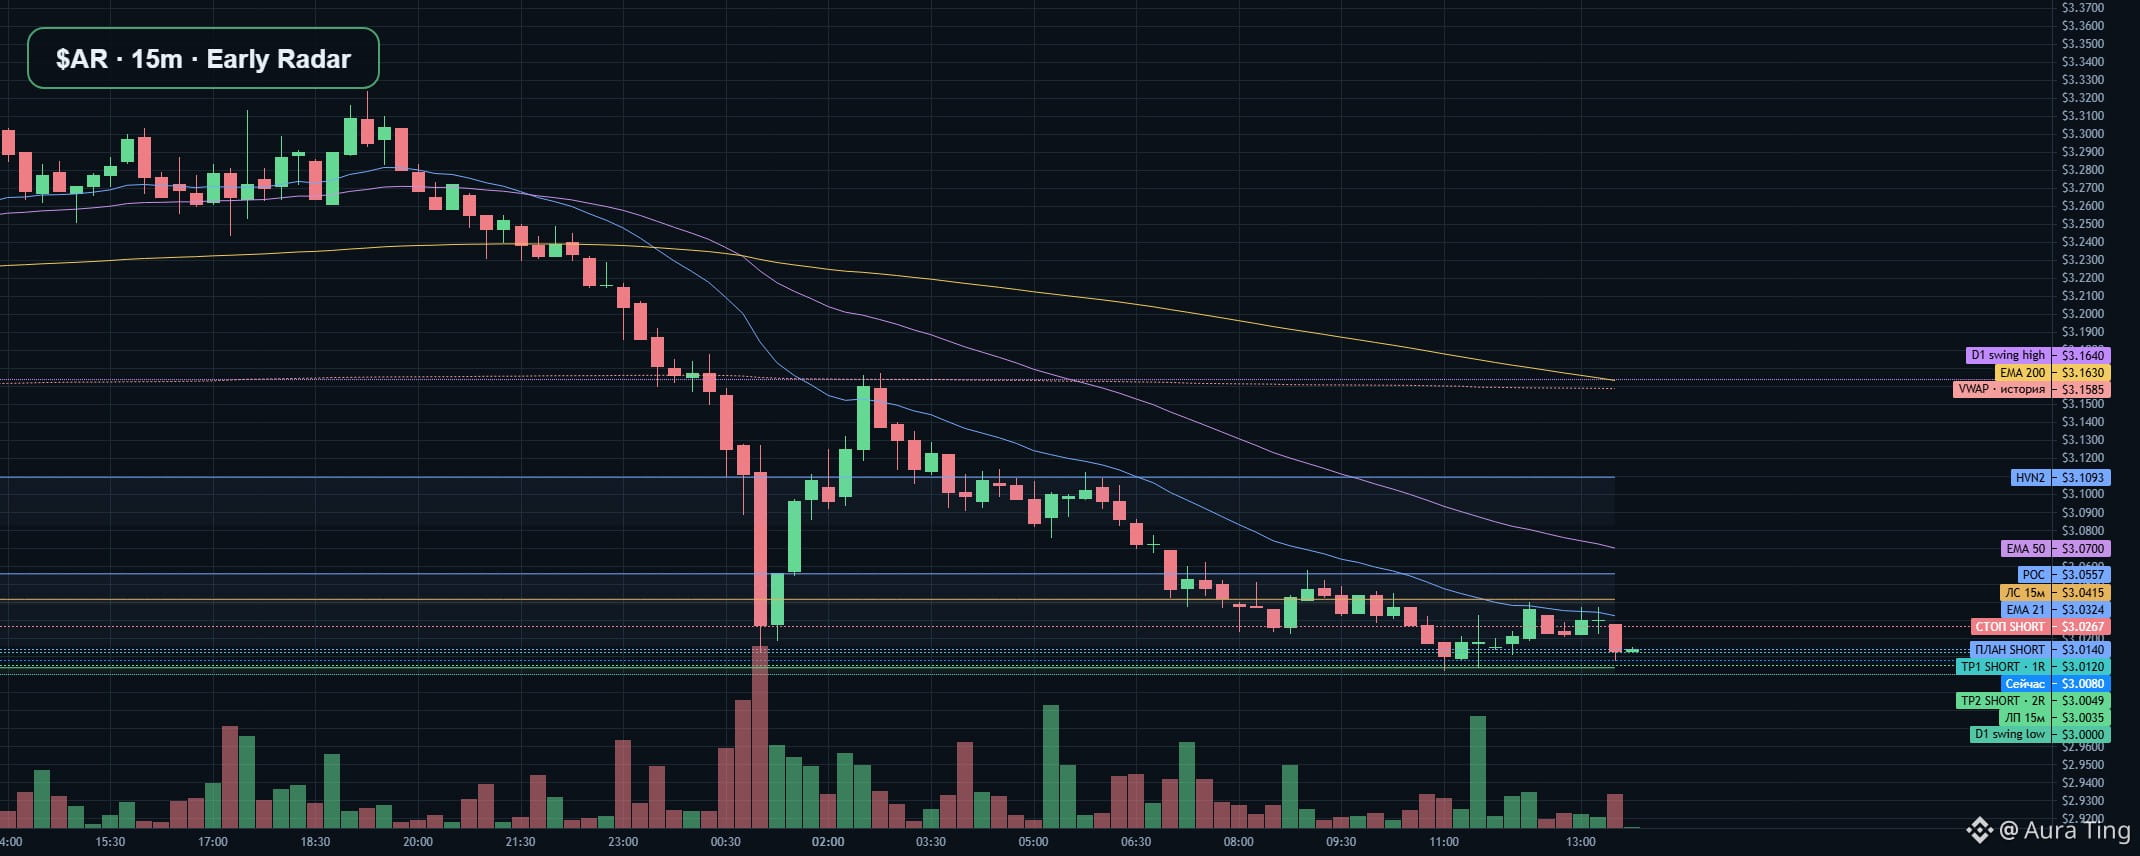
AR · Early Radar⚡ Breakout $AR · SHORT confirmed by a closed 5m candle at the 3.01 level.
close 3.01 / level 3.01
📉 SHORT · $AR (AR/USDT) · bearish scenario · 15m context, 15m indicators, 5m trigger
📉 Event: A closed structural breakdown on 15m is confirmed; the 5m retest has not yet occurred.
📊 MARKET
💵 Price: $3.008 · 1h -0.59% · 24h -8.85%.
AR · Early Radar
⚡ Breakout $AR · SHORT confirmed by a closed 5m candle at the 3.01 level.
close 3.01 / level 3.01
📉 SHORT · $AR (AR/USDT) · bearish scenario · 15m context, 15m indicators, 5m trigger
📉 Event: A closed structural breakdown on 15m is confirmed; the 5m retest has not yet occurred.
📊 MARKET
💵 Price: $3.008 · 1h -0.59% · 24h -8.85%.
close 3.01 / level 3.01
📉 SHORT · $AR (AR/USDT) · bearish scenario · 15m context, 15m indicators, 5m trigger
📉 Event: A closed structural breakdown on 15m is confirmed; the 5m retest has not yet occurred.
📊 MARKET
💵 Price: $3.008 · 1h -0.59% · 24h -8.85%.
7

·
--
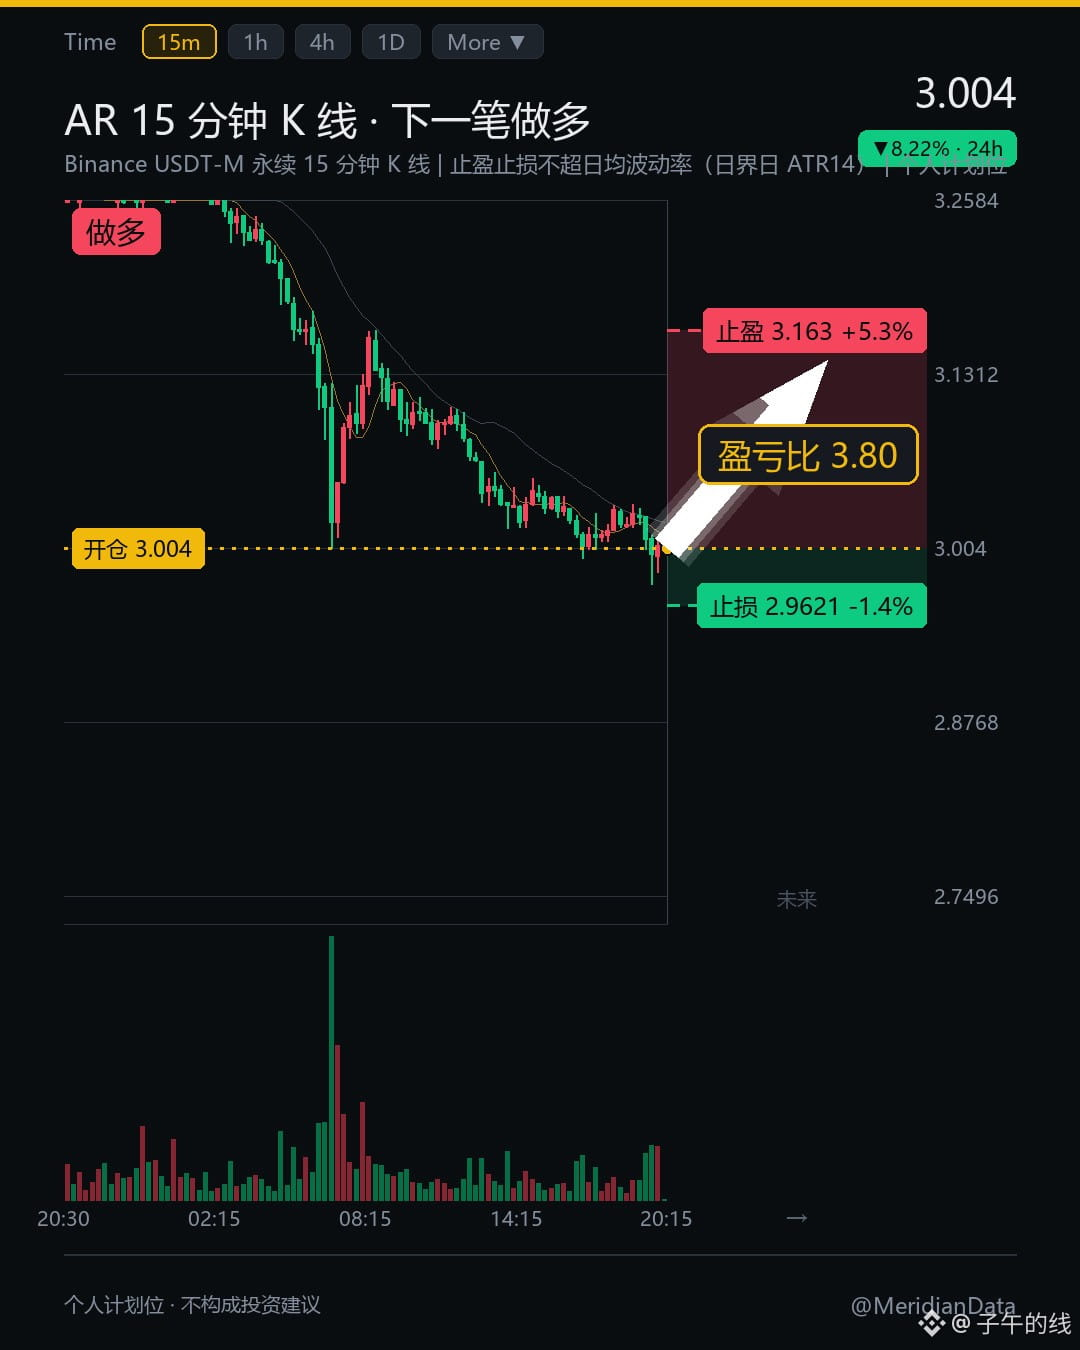
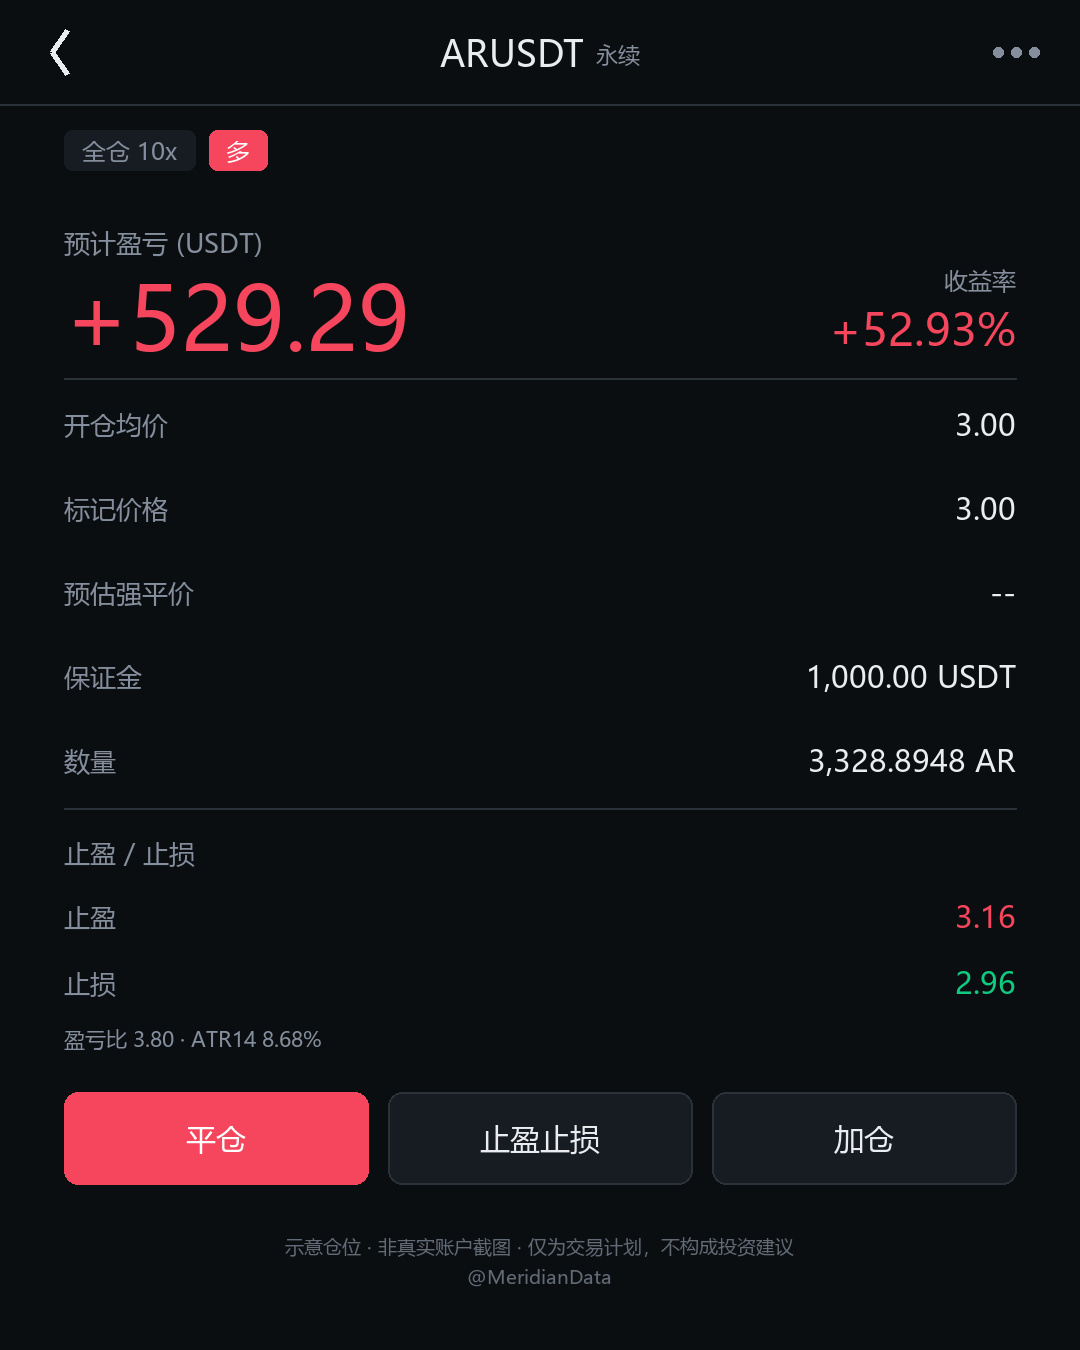
I watched it all afternoon and didn’t dare make a move. I just placed several orders at $AR , only after I was sure.
Take profit: 3.163
Stop loss: 2.9621
👇
{future}(ARUSDT)
You’re probably wondering: after seven days of declines, why buy in here?
The 15-minute candle closed at 3.004.
The 20-day range is 2.896 to 3.703. It’s now sitting at the 13.4th percentile, just over 3% above the lower end.
There’s almost nothing overhead.
Price has tested this level several times today, and liquidity is still here.
I thought it would break straight through, but buyers stepped in every time it dipped.
I’ve been watching since this afternoon, and the fact that buyers stepped in on every downward test while selling volume got smaller each time matters more than the size of the drop itself.
The coins have changed hands around this area, and there’s less disagreement than yesterday.
It’s like the steps downstairs: the more people step on them, the sturdier they become.
It’s down just 5.86% over the past seven days, and the downtrend is losing momentum.
Both my take-profit and stop-loss are within 8.68% of the average daily volatility. I won’t break my position-sizing rules.
The risk-reward ratio is 3.80. I’m willing to take a chance on this trade.
Honestly, this isn’t a pretty setup. Price is still crouched at the bottom.
Just this one trade.
What do you all think?
$BNB $TRX
#AR #BNB #Crypto
The above is a record of my personal trading system and observations of market data, and does not constitute investment advice
I watched it all afternoon and didn’t dare make a move. I just placed several orders at $AR , only after I was sure.
Take profit: 3.163
Stop loss: 2.9621
👇
You’re probably wondering: after seven days of declines, why buy in here?
The 15-minute candle closed at 3.004.
The 20-day range is 2.896 to 3.703. It’s now sitting at the 13.4th percentile, just over 3% above the lower end.
There’s almost nothing overhead.
Price has tested this level several times today, and liquidity is still here.
I thought it would break straight through, but buyers stepped in every time it dipped.
I’ve been watching since this afternoon, and the fact that buyers stepped in on every downward test while selling volume got smaller each time matters more than the size of the drop itself.
The coins have changed hands around this area, and there’s less disagreement than yesterday.
It’s like the steps downstairs: the more people step on them, the sturdier they become.
It’s down just 5.86% over the past seven days, and the downtrend is losing momentum.
Both my take-profit and stop-loss are within 8.68% of the average daily volatility. I won’t break my position-sizing rules.
The risk-reward ratio is 3.80. I’m willing to take a chance on this trade.
Honestly, this isn’t a pretty setup. Price is still crouched at the bottom.
Just this one trade.
What do you all think?
$BNB $TRX
#AR #BNB #Crypto
The above is a record of my personal trading system and observations of market data, and does not constitute investment advice
Take profit: 3.163
Stop loss: 2.9621
👇
You’re probably wondering: after seven days of declines, why buy in here?
The 15-minute candle closed at 3.004.
The 20-day range is 2.896 to 3.703. It’s now sitting at the 13.4th percentile, just over 3% above the lower end.
There’s almost nothing overhead.
Price has tested this level several times today, and liquidity is still here.
I thought it would break straight through, but buyers stepped in every time it dipped.
I’ve been watching since this afternoon, and the fact that buyers stepped in on every downward test while selling volume got smaller each time matters more than the size of the drop itself.
The coins have changed hands around this area, and there’s less disagreement than yesterday.
It’s like the steps downstairs: the more people step on them, the sturdier they become.
It’s down just 5.86% over the past seven days, and the downtrend is losing momentum.
Both my take-profit and stop-loss are within 8.68% of the average daily volatility. I won’t break my position-sizing rules.
The risk-reward ratio is 3.80. I’m willing to take a chance on this trade.
Honestly, this isn’t a pretty setup. Price is still crouched at the bottom.
Just this one trade.
What do you all think?
$BNB $TRX
#AR #BNB #Crypto
The above is a record of my personal trading system and observations of market data, and does not constitute investment advice
1
119

Bujhlam bhai, ei chobitar jonno English e 1 News dilam 👇
HEADLINE:
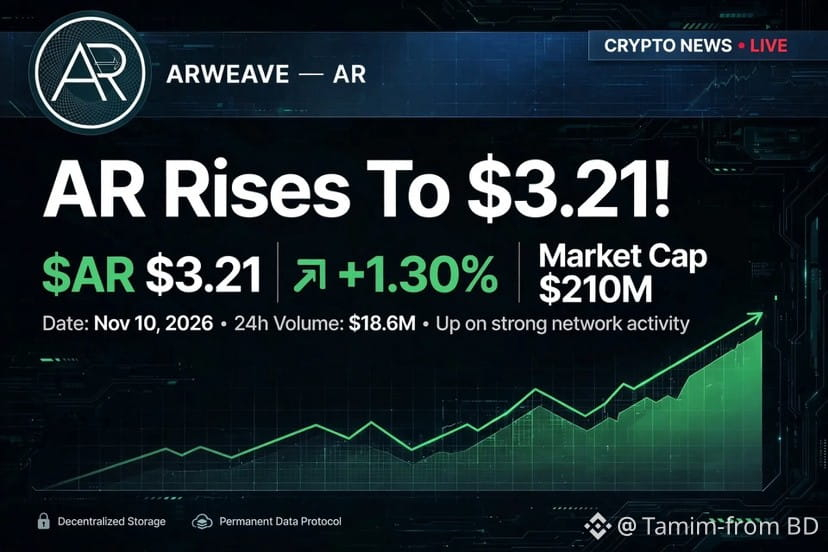
$AR Rises To $3.21 As Buyers Step Back In
NEWS IN ENGLISH:
Nov 10, 2026 — Arweave (AR) climbed +1.30% to $3.21, showing green while most of the crypto market is still under pressure.
The decentralized storage coin is holding strong with a Market Cap of $210M and 24h Volume of $18.6M. AR traded in a range of $3.06 - $3.30 in the last 24 hours.
AR is now up +4.80% in the past week, bouncing back on strong network activity and renewed interest in permanent data storage.
Analysts say if AR holds above $3.20, the next target could be $3.35 - $3.50.
> 🟢 AR NEWS | Nov 10, 2026
> $AR $3.21 | +1.30% ↑ | Cap: $210M
>
> AR Rises To $3.21!
> Buyers step back in, up on strong network activity.
>
> #AR #Arweave #CryptoNews #Binance #AR
Bujhlam bhai, ei chobitar jonno English e 1 News dilam 👇
HEADLINE:
$AR Rises To $3.21 As Buyers Step Back In
NEWS IN ENGLISH:
Nov 10, 2026 — Arweave (AR) climbed +1.30% to $3.21, showing green while most of the crypto market is still under pressure.
The decentralized storage coin is holding strong with a Market Cap of $210M and 24h Volume of $18.6M. AR traded in a range of $3.06 - $3.30 in the last 24 hours.
AR is now up +4.80% in the past week, bouncing back on strong network activity and renewed interest in permanent data storage.
Analysts say if AR holds above $3.20, the next target could be $3.35 - $3.50.
> 🟢 AR NEWS | Nov 10, 2026
> $AR $3.21 | +1.30% ↑ | Cap: $210M
>
> AR Rises To $3.21!
> Buyers step back in, up on strong network activity.
>
> #AR #Arweave #CryptoNews #Binance #AR
HEADLINE:
$AR Rises To $3.21 As Buyers Step Back In
NEWS IN ENGLISH:
Nov 10, 2026 — Arweave (AR) climbed +1.30% to $3.21, showing green while most of the crypto market is still under pressure.
The decentralized storage coin is holding strong with a Market Cap of $210M and 24h Volume of $18.6M. AR traded in a range of $3.06 - $3.30 in the last 24 hours.
AR is now up +4.80% in the past week, bouncing back on strong network activity and renewed interest in permanent data storage.
Analysts say if AR holds above $3.20, the next target could be $3.35 - $3.50.
> 🟢 AR NEWS | Nov 10, 2026
> $AR $3.21 | +1.30% ↑ | Cap: $210M
>
> AR Rises To $3.21!
> Buyers step back in, up on strong network activity.
>
> #AR #Arweave #CryptoNews #Binance #AR

1
585
Log in to explore more content
Join global crypto users on Binance Square
⚡️ Get latest and useful information about crypto.
💬 Trusted by the world’s largest crypto exchange.
👍 Discover real insights from verified creators.
Email / Phone number
Trending Topics
1
#WhoWillSucceedJensenHuangatNvidia?
192,714 views
1,759 Discussing
2
#WhatWillDriveCryptoandStocks’NextRebound?
609,508 views
3,590 Discussing
3
#TradFiForBeginners
745,437 views
4,565 Discussing
4
#BitcoinActiveSupplyInProfitDropsBelow45%
86,864 views
787 Discussing
5
#KavaSaysAbnormalActivityLimitedToKavaLend
51,504 views
444 Discussing
6
#USSpotXRPETFsSeeLargestWeeklyOutflowIn8Months
36,684 views
385 Discussing
7
#USPPIMissMayEaseBTCPressure
321,748 views
2,311 Discussing
8
#WORPTLetsTouristsConvertCryptoToThaiBaht
11,451 views
109 Discussing
9
#TONStrategyReports$23.97MQ3NetLoss
11,128 views
49 Discussing
10
#PolkadotCommunityApprovesNewStrategyWith97%Vote
31,211 views
301 Discussing