
#strk
strk
14M views
20,069 Discussing
Hot
Latest

·
--
Bearish
🔴 $STRK SELL 🔴
{future}(STRKUSDT)
📍 ENTRY: 0.03568-0.03598
🎯 TARGETS:
💰 0.03534
💰 0.03002
💰 0.02866
🛑 STOP: 0.03681
🔻 KEY SUPPORT BREAKDOWN — STRK BEARS ARE PUSHING LOWER
$STRK has broken below key support, putting the downside levels in focus. 👀
⚡ Support broken → bearish continuation on watch.
📉 Confirmation remains key.
#STRK #STRKUSDT #CryptoSignals #TradingSignals #FuturesSignals #ShortSignal
🔴 $STRK SELL 🔴
📍 ENTRY: 0.03568-0.03598
🎯 TARGETS:
💰 0.03534
💰 0.03002
💰 0.02866
🛑 STOP: 0.03681
🔻 KEY SUPPORT BREAKDOWN — STRK BEARS ARE PUSHING LOWER
$STRK has broken below key support, putting the downside levels in focus. 👀
⚡ Support broken → bearish continuation on watch.
📉 Confirmation remains key.
#STRK #STRKUSDT #CryptoSignals #TradingSignals #FuturesSignals #ShortSignal
📍 ENTRY: 0.03568-0.03598
🎯 TARGETS:
💰 0.03534
💰 0.03002
💰 0.02866
🛑 STOP: 0.03681
🔻 KEY SUPPORT BREAKDOWN — STRK BEARS ARE PUSHING LOWER
$STRK has broken below key support, putting the downside levels in focus. 👀
⚡ Support broken → bearish continuation on watch.
📉 Confirmation remains key.
#STRK #STRKUSDT #CryptoSignals #TradingSignals #FuturesSignals #ShortSignal
605

·
--
Bearish
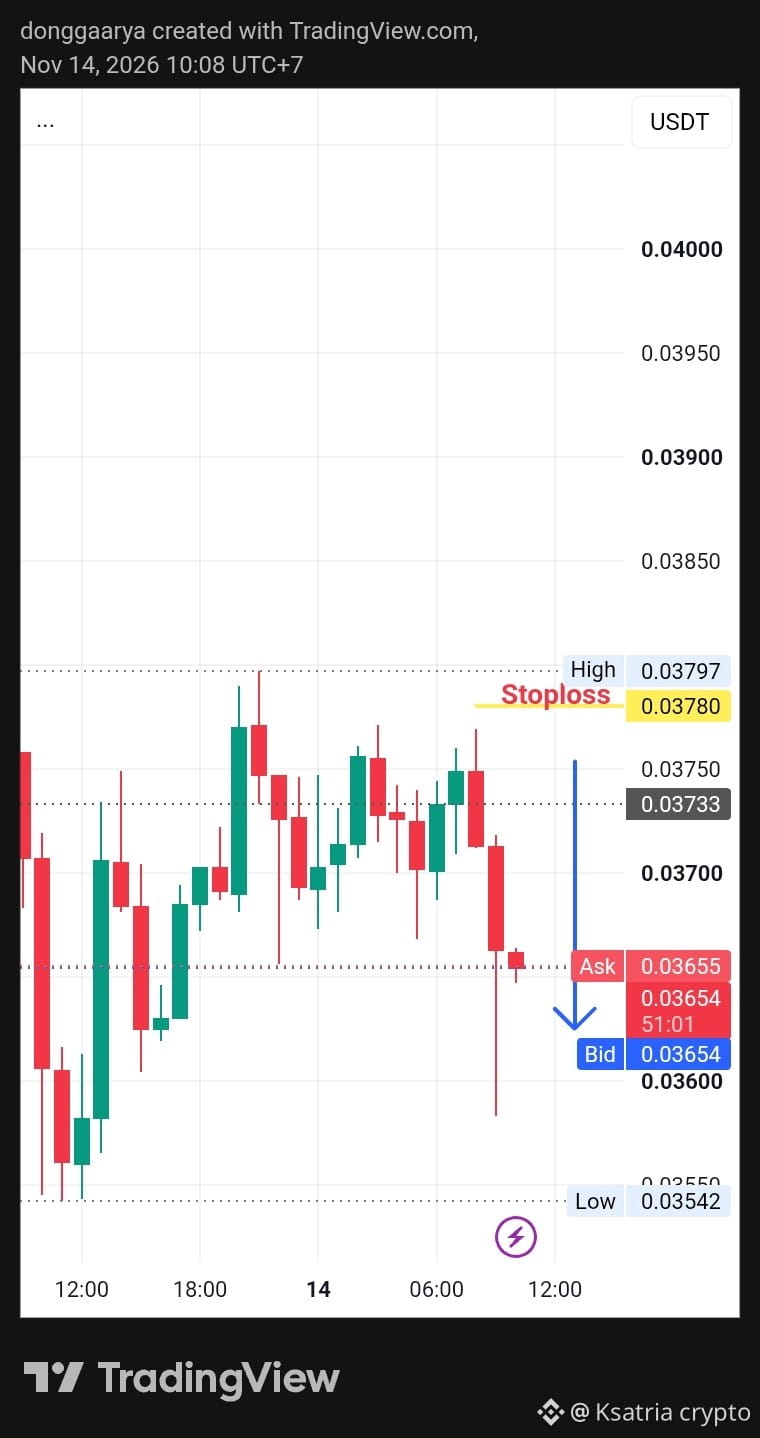
$STRK TAKE SHORTS POSITION NOW
SL 0,03780.
$STRK starknet token take short position now after show reversal moments and potential for bearish dump moments at next support level at range area 0,03542.
Based our macroeconomics fundamental analysist this coin show negatif open interest ( OI) ITS means capital outflow more than capital inflow $STRK
#Write2Earn #strk #strkusdt #STARKNET #signaladvisor
{future}(STRKUSDT)
$STRK TAKE SHORTS POSITION NOW
SL 0,03780.
$STRK starknet token take short position now after show reversal moments and potential for bearish dump moments at next support level at range area 0,03542.
Based our macroeconomics fundamental analysist this coin show negatif open interest ( OI) ITS means capital outflow more than capital inflow $STRK
#Write2Earn #strk #strkusdt #STARKNET #signaladvisor
SL 0,03780.
$STRK starknet token take short position now after show reversal moments and potential for bearish dump moments at next support level at range area 0,03542.
Based our macroeconomics fundamental analysist this coin show negatif open interest ( OI) ITS means capital outflow more than capital inflow $STRK
#Write2Earn #strk #strkusdt #STARKNET #signaladvisor
2
964


$STRK: VWAP Mechanics Check
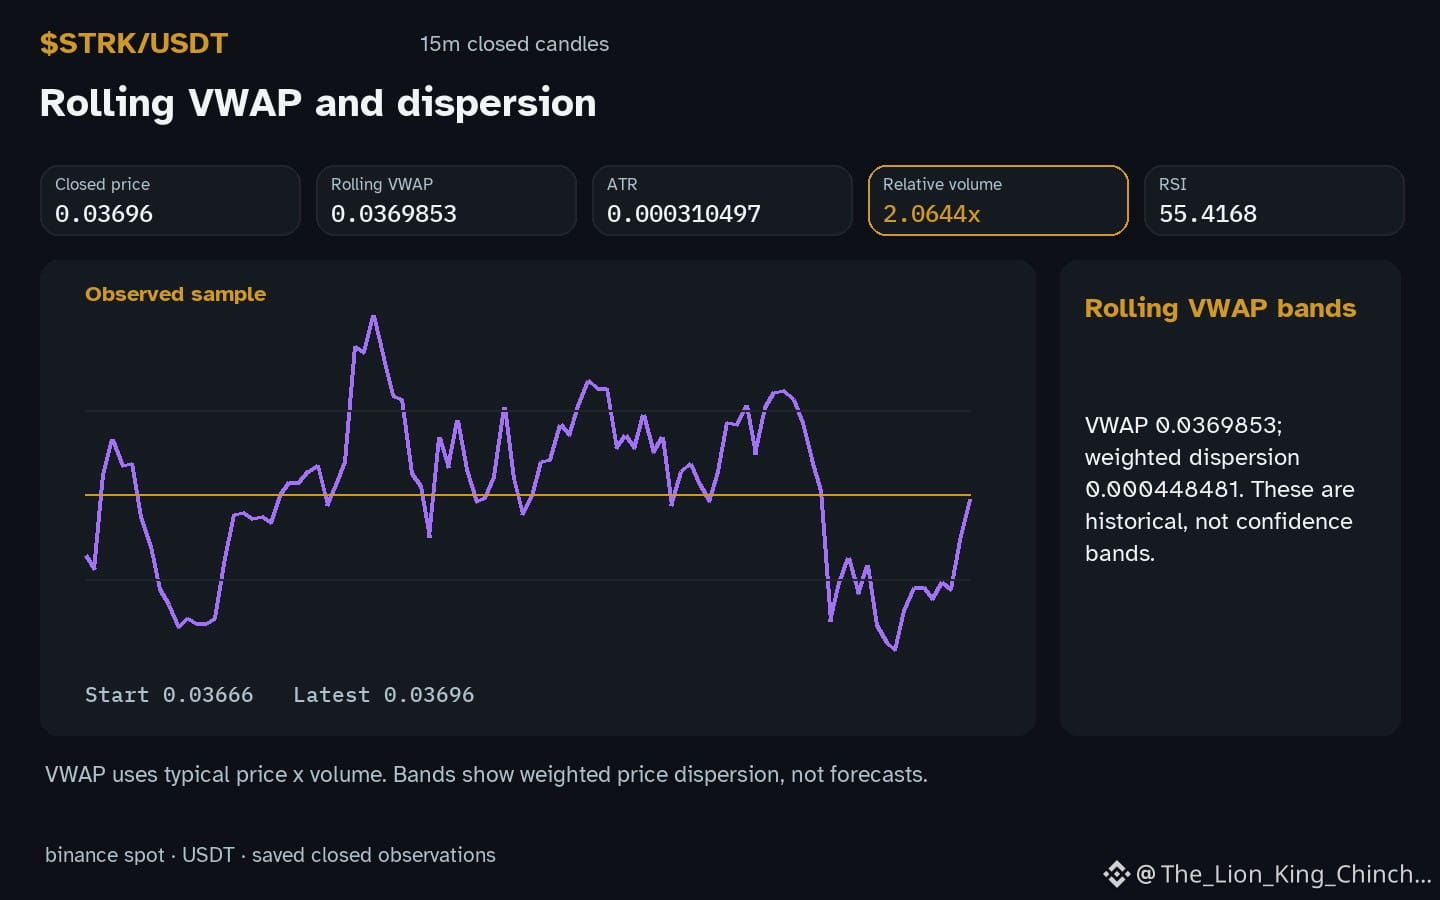
Has $STRK volume above its baseline convinced you that 0.0369853 acts as a floor? The chart sits 55.4 with relative volume at 2.06x. A hypothetical habit: staring until the line glows. Then the mind rushes while the watchlist stays calm.
The trap.
VWAP weights trades by size, not intent. If one large buyer lifts the average, it does not prove persistence. A buyer pushing just below 0.0369853 could still pull the metric slightly, changing the reference point. The average moves with activity. It is not a wall.
Consider a counterexample. If execution concentrates heavily away from the typical flow, the mean shifts. The current reading of 0.0369853 reflects past trades. It does not obligate future price to respect it. A recent spike can skew the value, making it appear stronger than the underlying flow suggests.
Self-check.
Compare the distance from price to the support at 0.03592. If the gap exceeds expected noise, the average may be less relevant. Ask if the volume spike was a single event or a steady accumulation. A one-off burst creates a temporary skew. It does not create a structural level.
What could change the reading. Look for a new baseline forming away from the historical average. If price closes below 0.03592, the previous VWAP context may expire. The rule should update with the data. Do not force the old average to fit the new reality. The metric serves the price, not the other way around.
Probabilistic market research, not a recommendation or guaranteed return.
A useful cross-check: $BTC has hourly direction up and volume not above its baseline; $SHELL has hourly direction up and volume above its baseline. This alone does not establish correlation.
#STRK #BTC
$STRK : VWAP Mechanics Check
Has $STRK volume above its baseline convinced you that 0.0369853 acts as a floor? The chart sits 55.4 with relative volume at 2.06x. A hypothetical habit: staring until the line glows. Then the mind rushes while the watchlist stays calm.
The trap.
VWAP weights trades by size, not intent. If one large buyer lifts the average, it does not prove persistence. A buyer pushing just below 0.0369853 could still pull the metric slightly, changing the reference point. The average moves with activity. It is not a wall.
Consider a counterexample. If execution concentrates heavily away from the typical flow, the mean shifts. The current reading of 0.0369853 reflects past trades. It does not obligate future price to respect it. A recent spike can skew the value, making it appear stronger than the underlying flow suggests.
Self-check.
Compare the distance from price to the support at 0.03592. If the gap exceeds expected noise, the average may be less relevant. Ask if the volume spike was a single event or a steady accumulation. A one-off burst creates a temporary skew. It does not create a structural level.
What could change the reading. Look for a new baseline forming away from the historical average. If price closes below 0.03592, the previous VWAP context may expire. The rule should update with the data. Do not force the old average to fit the new reality. The metric serves the price, not the other way around.
Probabilistic market research, not a recommendation or guaranteed return.
A useful cross-check: $BTC has hourly direction up and volume not above its baseline; $SHELL has hourly direction up and volume above its baseline. This alone does not establish correlation.
#STRK #BTC
Has $STRK volume above its baseline convinced you that 0.0369853 acts as a floor? The chart sits 55.4 with relative volume at 2.06x. A hypothetical habit: staring until the line glows. Then the mind rushes while the watchlist stays calm.
The trap.
VWAP weights trades by size, not intent. If one large buyer lifts the average, it does not prove persistence. A buyer pushing just below 0.0369853 could still pull the metric slightly, changing the reference point. The average moves with activity. It is not a wall.
Consider a counterexample. If execution concentrates heavily away from the typical flow, the mean shifts. The current reading of 0.0369853 reflects past trades. It does not obligate future price to respect it. A recent spike can skew the value, making it appear stronger than the underlying flow suggests.
Self-check.
Compare the distance from price to the support at 0.03592. If the gap exceeds expected noise, the average may be less relevant. Ask if the volume spike was a single event or a steady accumulation. A one-off burst creates a temporary skew. It does not create a structural level.
What could change the reading. Look for a new baseline forming away from the historical average. If price closes below 0.03592, the previous VWAP context may expire. The rule should update with the data. Do not force the old average to fit the new reality. The metric serves the price, not the other way around.
Probabilistic market research, not a recommendation or guaranteed return.
A useful cross-check: $BTC has hourly direction up and volume not above its baseline; $SHELL has hourly direction up and volume above its baseline. This alone does not establish correlation.
#STRK #BTC
15
·
--
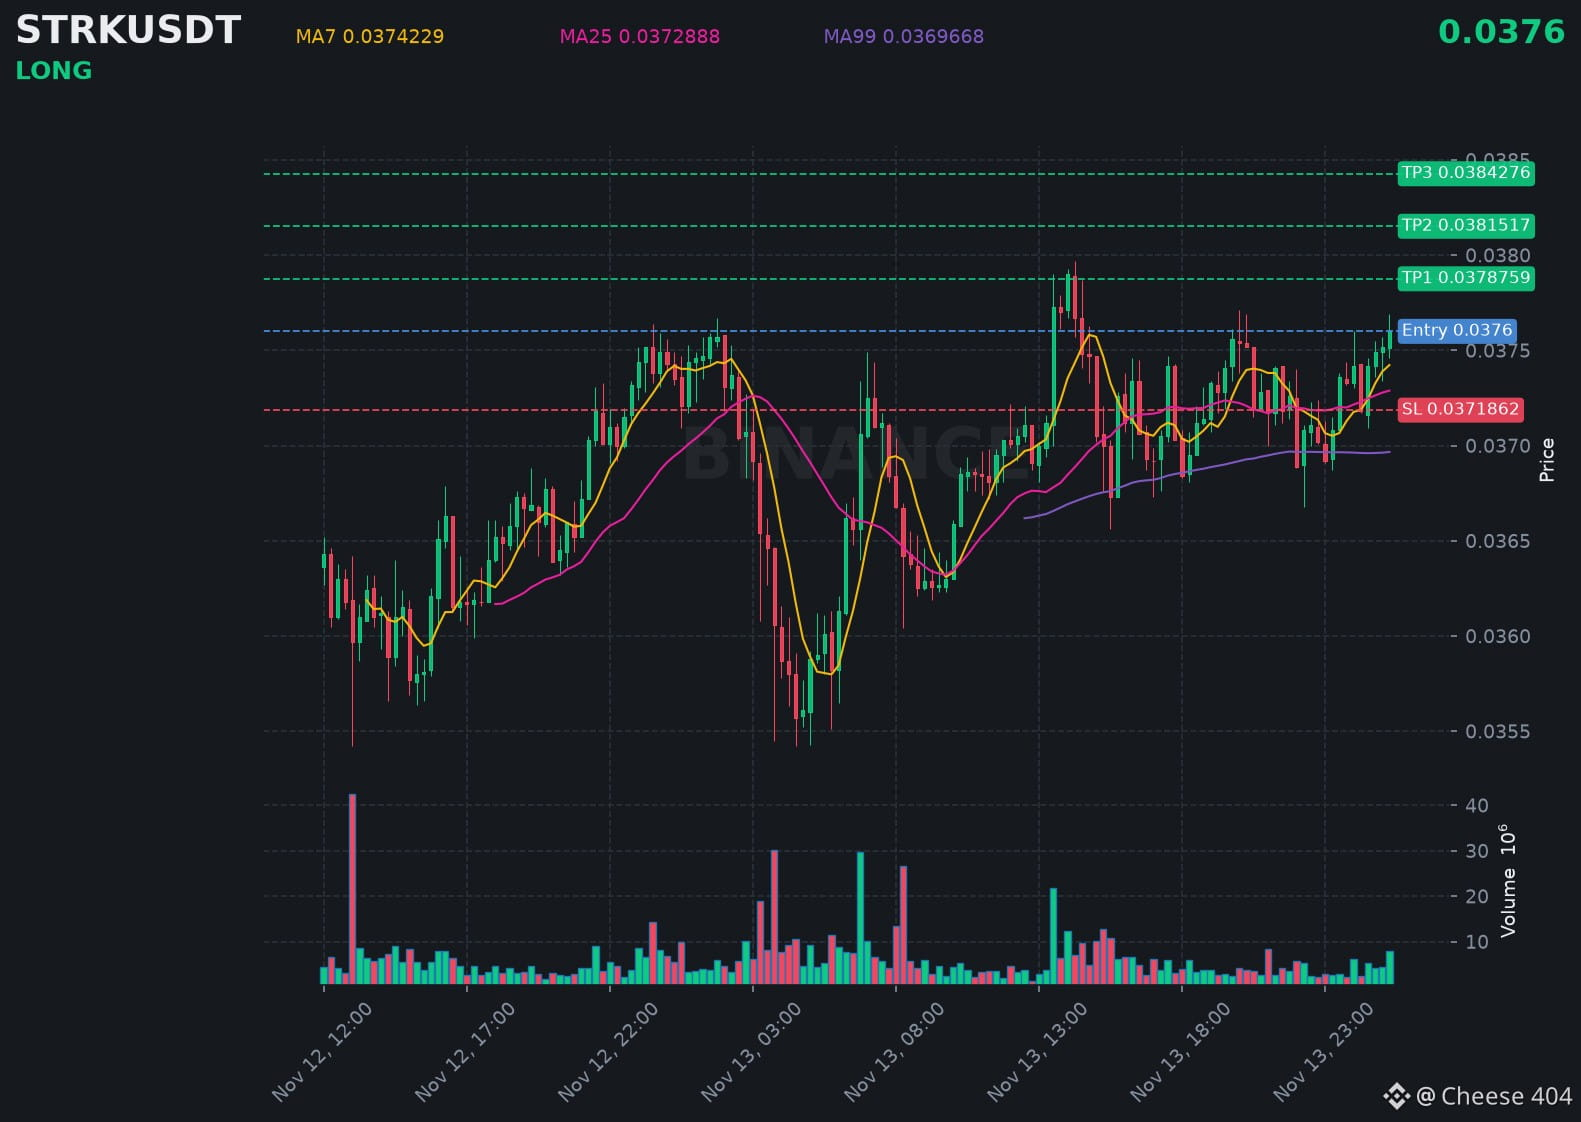
$STRK is holding steady above support, hinting at another leg up in the coming hours.
📍 @ 0.0376 | Volume: 0.29M USD
RSI 59 | EMA20: 0.0373061 USD
📈 Trade Plan:
📈 Entry: 0.0375172 – 0.0376828
🛑 Stop Loss: 0.0371862
🎯 TP1: 0.0378759
🎯 TP2: 0.0381517
🎯 TP3: 0.0384276
Waiting for a retest, then riding the uptrend.
👉 $STRK 👈 Catch it
#STRK
$STRK is holding steady above support, hinting at another leg up in the coming hours.
📍 @ 0.0376 | Volume: 0.29M USD
RSI 59 | EMA20: 0.0373061 USD
📈 Trade Plan:
📈 Entry: 0.0375172 – 0.0376828
🛑 Stop Loss: 0.0371862
🎯 TP1: 0.0378759
🎯 TP2: 0.0381517
🎯 TP3: 0.0384276
Waiting for a retest, then riding the uptrend.
👉 $STRK 👈 Catch it
#STRK
📍 @ 0.0376 | Volume: 0.29M USD
RSI 59 | EMA20: 0.0373061 USD
📈 Trade Plan:
📈 Entry: 0.0375172 – 0.0376828
🛑 Stop Loss: 0.0371862
🎯 TP1: 0.0378759
🎯 TP2: 0.0381517
🎯 TP3: 0.0384276
Waiting for a retest, then riding the uptrend.
👉 $STRK 👈 Catch it
#STRK
96

·
--
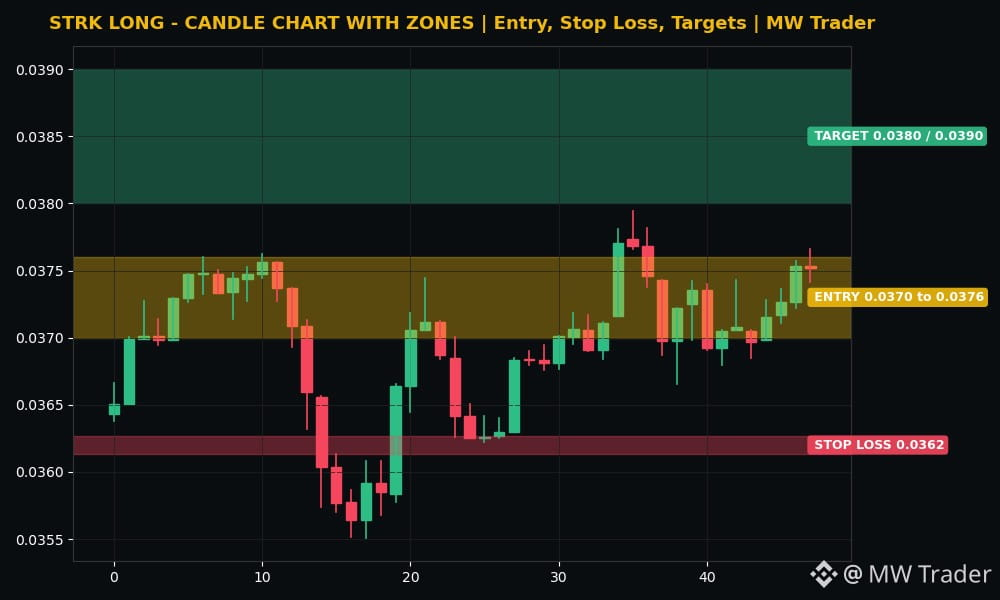
$STRK #STRK 🚀
Direction: LONG
Entry zone: 0.0370 to 0.0376
Stop loss: 0.0362
Target 1: 0.0380
Target 2: 0.0390
Starknet is trading near 0.03751794 dollars, up 2.06 percent in 24 hours, inside a range of 0.03550893 to 0.03794425 dollars, and the recent closes show buyers climbing step by step, 0.03696756, then 0.03715459, then 0.03726867, then 0.03753215, then 0.03751794. 🟢 My reading is that STRK is the steady climber in a red market, because it rose 2.06 percent while Bitcoin fell 3.60 percent in 24 hours, and five rising closes show momentum building toward the range high instead of fading. A long from the current zone, with a stop below 0.0362, targets 0.0380 first and then 0.0390 if buyers break the range high. A drop below the stop kills the idea without debate.
Futures trading is risky. Trade small, use a stop loss, and do your own research. This is my reading, not a guaranteed signal.
Does STRK break 0.0380 first, or lose 0.0362 first? 🤔
Follow for more trades.
#Starknet #Crypto #FuturesTrading #TradingSignals
$STRK #STRK 🚀
Direction: LONG
Entry zone: 0.0370 to 0.0376
Stop loss: 0.0362
Target 1: 0.0380
Target 2: 0.0390
Starknet is trading near 0.03751794 dollars, up 2.06 percent in 24 hours, inside a range of 0.03550893 to 0.03794425 dollars, and the recent closes show buyers climbing step by step, 0.03696756, then 0.03715459, then 0.03726867, then 0.03753215, then 0.03751794. 🟢 My reading is that STRK is the steady climber in a red market, because it rose 2.06 percent while Bitcoin fell 3.60 percent in 24 hours, and five rising closes show momentum building toward the range high instead of fading. A long from the current zone, with a stop below 0.0362, targets 0.0380 first and then 0.0390 if buyers break the range high. A drop below the stop kills the idea without debate.
Futures trading is risky. Trade small, use a stop loss, and do your own research. This is my reading, not a guaranteed signal.
Does STRK break 0.0380 first, or lose 0.0362 first? 🤔
Follow for more trades.
#Starknet #Crypto #FuturesTrading #TradingSignals
Direction: LONG
Entry zone: 0.0370 to 0.0376
Stop loss: 0.0362
Target 1: 0.0380
Target 2: 0.0390
Starknet is trading near 0.03751794 dollars, up 2.06 percent in 24 hours, inside a range of 0.03550893 to 0.03794425 dollars, and the recent closes show buyers climbing step by step, 0.03696756, then 0.03715459, then 0.03726867, then 0.03753215, then 0.03751794. 🟢 My reading is that STRK is the steady climber in a red market, because it rose 2.06 percent while Bitcoin fell 3.60 percent in 24 hours, and five rising closes show momentum building toward the range high instead of fading. A long from the current zone, with a stop below 0.0362, targets 0.0380 first and then 0.0390 if buyers break the range high. A drop below the stop kills the idea without debate.
Futures trading is risky. Trade small, use a stop loss, and do your own research. This is my reading, not a guaranteed signal.
Does STRK break 0.0380 first, or lose 0.0362 first? 🤔
Follow for more trades.
#Starknet #Crypto #FuturesTrading #TradingSignals
8

·
--
📉 $STRK Bearish Rejection at Key Resistance
Rating: 76/100 [A] • Strategy: EMATrend
📊 Trade Thesis:
Price encountered strong overhead rejection at the 50 EMA on the 1-hour chart, fully aligning with the broader 4-hour downtrend. The inability to reclaim higher levels signals persistent distribution by sellers.
🎯 Entry: 0.03726
🛑 Stop-Loss: 0.03849 (-3.30%)
✅ Take-Profit: 0.03479 (+6.63%)
⚖️ Risk/Reward: 1:2.0
🚫 Invalidation Rule: If a 1-hour candle closes above $0.03849 (+3.30%), this bearish thesis is invalidated. Cut position immediately.
💡 Trade Management: Secure 50% profit at Take-Profit target ($0.03479 +6.63%) and move Stop-Loss to Breakeven to eliminate downside risk.
⚖️ Risk Note: Moderate leverage recommended (3x–5x on Futures). Never risk more than 1–2% of total portfolio capital on a single setup.
📈 Binance Market Data:
• Funding: 0.0040% (Neutral) • Next: 3h 59m
• Open Interest (OI): $14.20M
• 24h Volume: $23.72M
• 24h Range: 0.03542 — 0.03797 (+2.9%)
📈 Strategy Track Record: WR 62% over 1691 trades
#STRK #CryptoTrading #CryptoSignals #BinanceSquare
⚠️ Not financial advice. Always manage your risk.
📉 $STRK Bearish Rejection at Key Resistance
Rating: 76/100 [A] • Strategy: EMATrend
📊 Trade Thesis:
Price encountered strong overhead rejection at the 50 EMA on the 1-hour chart, fully aligning with the broader 4-hour downtrend. The inability to reclaim higher levels signals persistent distribution by sellers.
🎯 Entry: 0.03726
🛑 Stop-Loss: 0.03849 (-3.30%)
✅ Take-Profit: 0.03479 (+6.63%)
⚖️ Risk/Reward: 1:2.0
🚫 Invalidation Rule: If a 1-hour candle closes above $0.03849 (+3.30%), this bearish thesis is invalidated. Cut position immediately.
💡 Trade Management: Secure 50% profit at Take-Profit target ($0.03479 +6.63%) and move Stop-Loss to Breakeven to eliminate downside risk.
⚖️ Risk Note: Moderate leverage recommended (3x–5x on Futures). Never risk more than 1–2% of total portfolio capital on a single setup.
📈 Binance Market Data:
• Funding: 0.0040% (Neutral) • Next: 3h 59m
• Open Interest (OI): $14.20M
• 24h Volume: $23.72M
• 24h Range: 0.03542 — 0.03797 (+2.9%)
📈 Strategy Track Record: WR 62% over 1691 trades
#STRK #CryptoTrading #CryptoSignals #BinanceSquare
⚠️ Not financial advice. Always manage your risk.
Rating: 76/100 [A] • Strategy: EMATrend
📊 Trade Thesis:
Price encountered strong overhead rejection at the 50 EMA on the 1-hour chart, fully aligning with the broader 4-hour downtrend. The inability to reclaim higher levels signals persistent distribution by sellers.
🎯 Entry: 0.03726
🛑 Stop-Loss: 0.03849 (-3.30%)
✅ Take-Profit: 0.03479 (+6.63%)
⚖️ Risk/Reward: 1:2.0
🚫 Invalidation Rule: If a 1-hour candle closes above $0.03849 (+3.30%), this bearish thesis is invalidated. Cut position immediately.
💡 Trade Management: Secure 50% profit at Take-Profit target ($0.03479 +6.63%) and move Stop-Loss to Breakeven to eliminate downside risk.
⚖️ Risk Note: Moderate leverage recommended (3x–5x on Futures). Never risk more than 1–2% of total portfolio capital on a single setup.
📈 Binance Market Data:
• Funding: 0.0040% (Neutral) • Next: 3h 59m
• Open Interest (OI): $14.20M
• 24h Volume: $23.72M
• 24h Range: 0.03542 — 0.03797 (+2.9%)
📈 Strategy Track Record: WR 62% over 1691 trades
#STRK #CryptoTrading #CryptoSignals #BinanceSquare
⚠️ Not financial advice. Always manage your risk.
12

·
--
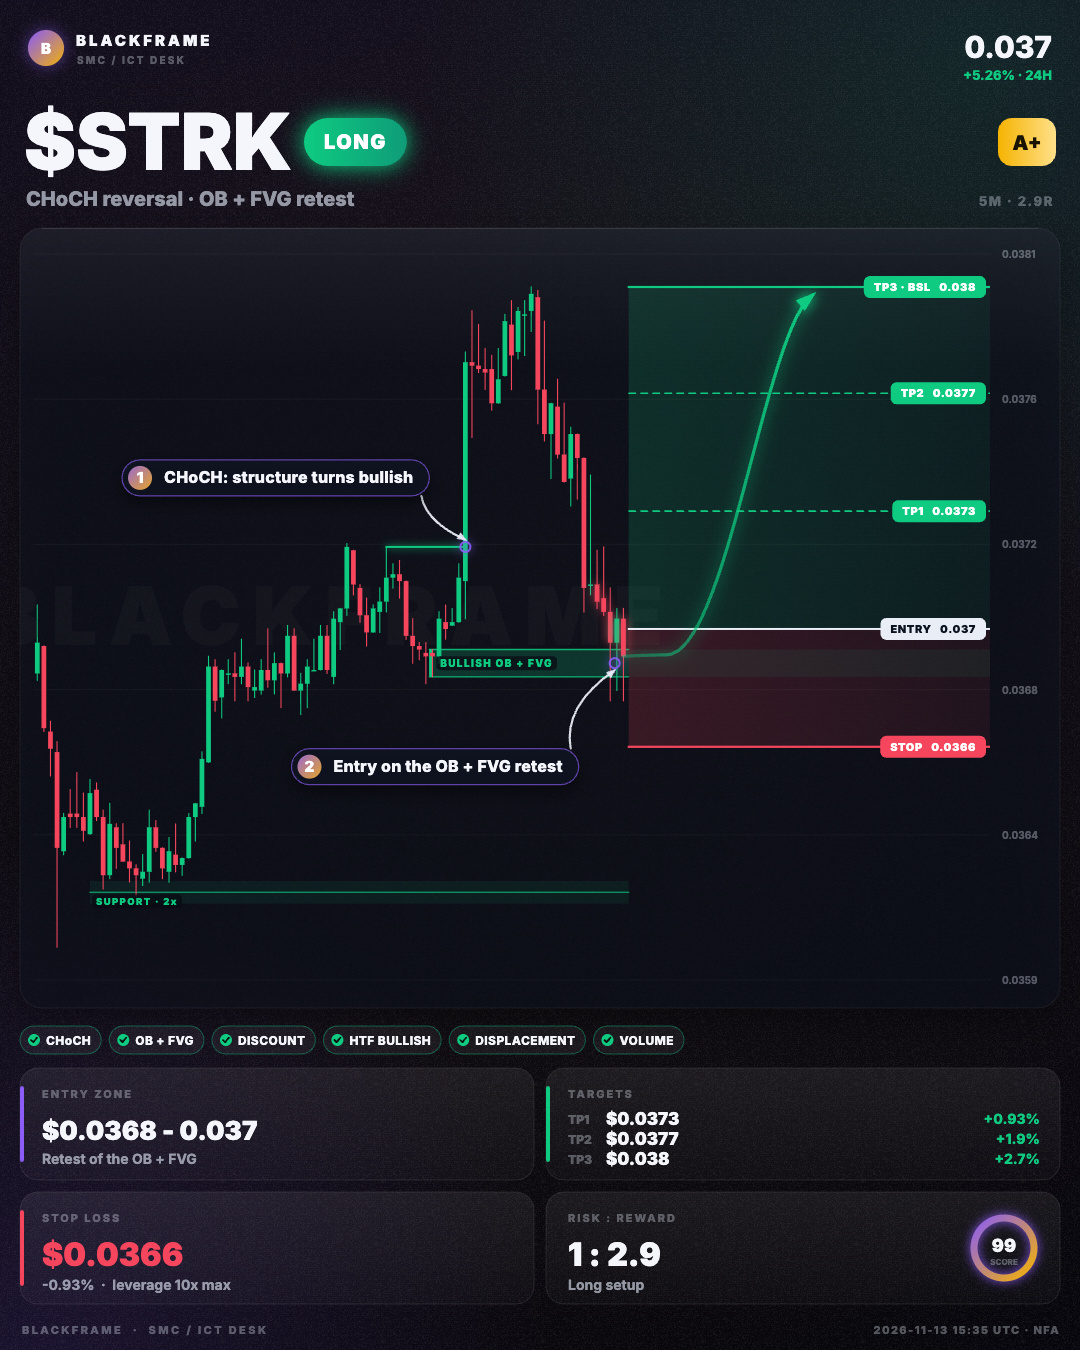
🌞 $STRK confirms bullish CHoCH on 5M
LONG · 5M
Entry: $0.0369 - $0.037
TP1: $0.0373
TP2: $0.0377
TP3: $0.038
SL: $0.0366
CHoCH on the 5M aligns with an order block and FVG stacked in one zone, providing strong discount buying. HTF bias stays bullish and volume expanded as price displaced upward. Target is buy‑side liquidity at $0.038; stop at $0.0366.
#STRK #PriceAction · NFA
🌞 $STRK confirms bullish CHoCH on 5M
LONG · 5M
Entry: $0.0369 - $0.037
TP1: $0.0373
TP2: $0.0377
TP3: $0.038
SL: $0.0366
CHoCH on the 5M aligns with an order block and FVG stacked in one zone, providing strong discount buying. HTF bias stays bullish and volume expanded as price displaced upward. Target is buy‑side liquidity at $0.038; stop at $0.0366.
#STRK #PriceAction · NFA
LONG · 5M
Entry: $0.0369 - $0.037
TP1: $0.0373
TP2: $0.0377
TP3: $0.038
SL: $0.0366
CHoCH on the 5M aligns with an order block and FVG stacked in one zone, providing strong discount buying. HTF bias stays bullish and volume expanded as price displaced upward. Target is buy‑side liquidity at $0.038; stop at $0.0366.
#STRK #PriceAction · NFA
71
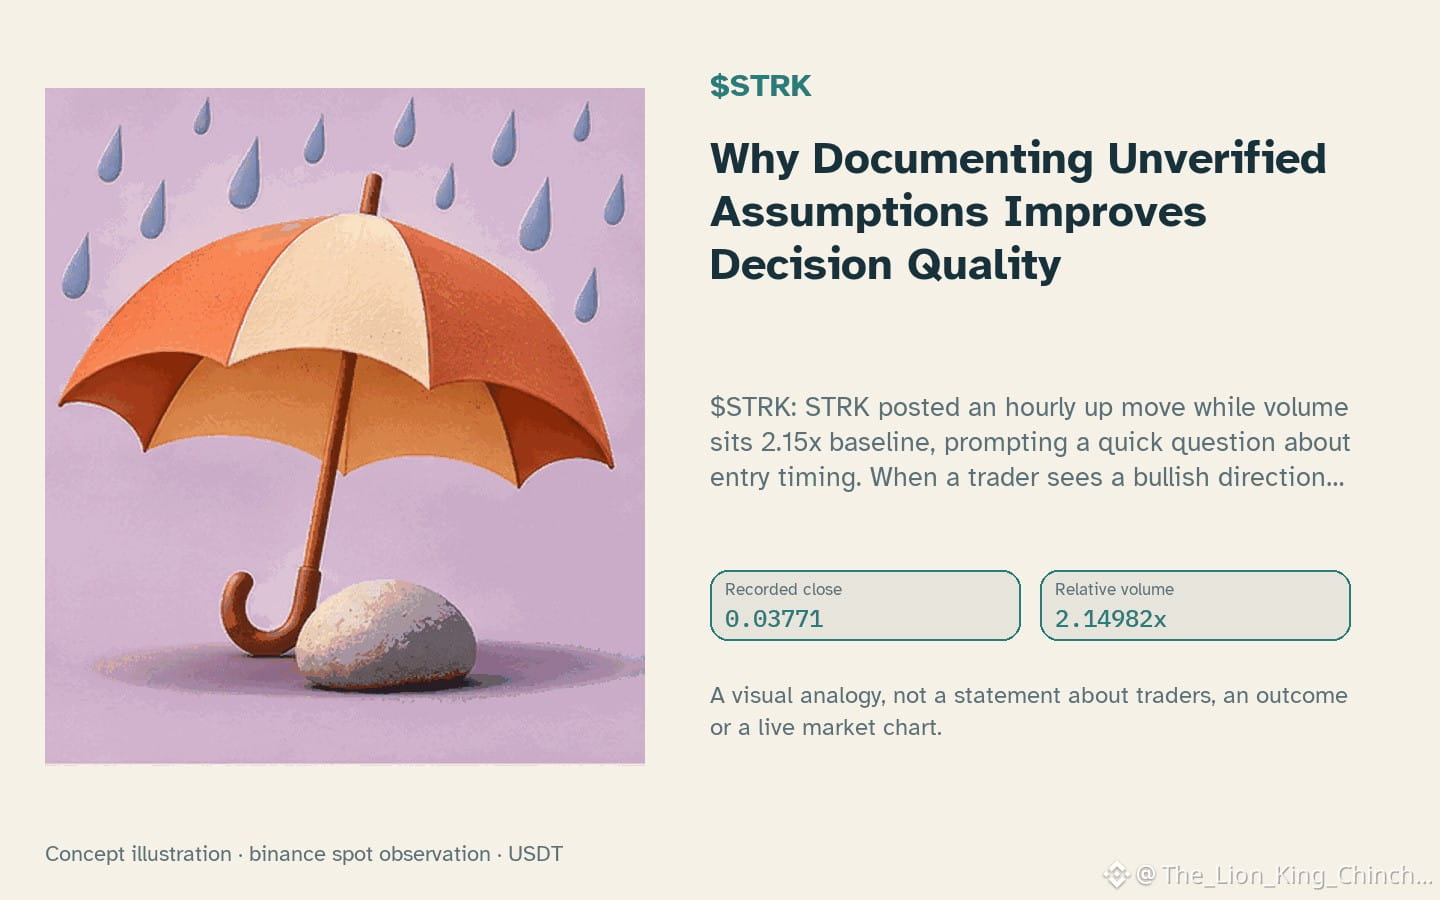
$STRK: Why Documenting Unverified Assumptions Improves Decision Quality
$STRK: STRK posted an hourly up move while volume sits 2.15x baseline, prompting a quick question about entry timing. When a trader sees a bullish direction paired with heightened activity, the temptation is to chase the move. A thought experiment can illustrate the trade‑off between entry quality and chasing.
Imagine two scenarios. In the first, the trader waits for a pull‑back toward the recent support level 0.03623 before entering, accepting a later fill but potentially higher risk‑reward. In the second, the trader jumps in at the market price as soon as the up hour is confirmed, capturing momentum but risking entry at a less favourable price if the move stalls.
The explicit uncertainty‑logging approach suggests writing down the assumption that "high volume confirms strength" alongside the observation of 2.15x baseline. This note creates a checkpoint: if the next closed candle shows a daily change 4.9833% that reverses direction, the assumption can be invalidated without emotional bias.
A counterexample would be a scenario where volume spikes but the price quickly retreats, showing that volume alone does not guarantee continuation. The self‑check asks: does the next hour’s price move stay above 0.03623 or break below it? If it breaks below, the logged assumption loses credibility and the trader should reassess the entry plan.
Thus, documenting the hypothesis and defining a concrete invalidation condition. price falling beneath 0.03623. provides a measurable way to balance chasing impulse against disciplined entry quality.
Probabilistic market research, not a recommendation or guaranteed return.
#STRK #RiskManagement #CryptoLearning
$STRK : Why Documenting Unverified Assumptions Improves Decision Quality
$STRK : STRK posted an hourly up move while volume sits 2.15x baseline, prompting a quick question about entry timing. When a trader sees a bullish direction paired with heightened activity, the temptation is to chase the move. A thought experiment can illustrate the trade‑off between entry quality and chasing.
Imagine two scenarios. In the first, the trader waits for a pull‑back toward the recent support level 0.03623 before entering, accepting a later fill but potentially higher risk‑reward. In the second, the trader jumps in at the market price as soon as the up hour is confirmed, capturing momentum but risking entry at a less favourable price if the move stalls.
The explicit uncertainty‑logging approach suggests writing down the assumption that "high volume confirms strength" alongside the observation of 2.15x baseline. This note creates a checkpoint: if the next closed candle shows a daily change 4.9833% that reverses direction, the assumption can be invalidated without emotional bias.
A counterexample would be a scenario where volume spikes but the price quickly retreats, showing that volume alone does not guarantee continuation. The self‑check asks: does the next hour’s price move stay above 0.03623 or break below it? If it breaks below, the logged assumption loses credibility and the trader should reassess the entry plan.
Thus, documenting the hypothesis and defining a concrete invalidation condition. price falling beneath 0.03623. provides a measurable way to balance chasing impulse against disciplined entry quality.
Probabilistic market research, not a recommendation or guaranteed return.
#STRK #RiskManagement #CryptoLearning
$STRK : STRK posted an hourly up move while volume sits 2.15x baseline, prompting a quick question about entry timing. When a trader sees a bullish direction paired with heightened activity, the temptation is to chase the move. A thought experiment can illustrate the trade‑off between entry quality and chasing.
Imagine two scenarios. In the first, the trader waits for a pull‑back toward the recent support level 0.03623 before entering, accepting a later fill but potentially higher risk‑reward. In the second, the trader jumps in at the market price as soon as the up hour is confirmed, capturing momentum but risking entry at a less favourable price if the move stalls.
The explicit uncertainty‑logging approach suggests writing down the assumption that "high volume confirms strength" alongside the observation of 2.15x baseline. This note creates a checkpoint: if the next closed candle shows a daily change 4.9833% that reverses direction, the assumption can be invalidated without emotional bias.
A counterexample would be a scenario where volume spikes but the price quickly retreats, showing that volume alone does not guarantee continuation. The self‑check asks: does the next hour’s price move stay above 0.03623 or break below it? If it breaks below, the logged assumption loses credibility and the trader should reassess the entry plan.
Thus, documenting the hypothesis and defining a concrete invalidation condition. price falling beneath 0.03623. provides a measurable way to balance chasing impulse against disciplined entry quality.
Probabilistic market research, not a recommendation or guaranteed return.
#STRK #RiskManagement #CryptoLearning
1
54

·
--
Verified
🚀 STARKNET ($STRK ): A Major Step Forward in Layer-2 Technology!
Starknet is gaining attention after introducing its new block-sized proof technology, demonstrating the ability to prove 1.1 billion Layer-2 gas in a single transaction.
This development highlights Starknet's continued focus on scalability, proof efficiency, and improving blockchain performance.
As Layer-2 competition grows, technological improvements like this could play an important role in attracting developers and expanding ecosystem adoption.
However, the long-term impact will depend on real-world usage and continued network development.
Can Starknet become a major player in the next generation of blockchain infrastructure?
#strk #CryptoNews #Layer2 #blockchain #Ethereum
🚀 STARKNET ($STRK ): A Major Step Forward in Layer-2 Technology!
Starknet is gaining attention after introducing its new block-sized proof technology, demonstrating the ability to prove 1.1 billion Layer-2 gas in a single transaction.
This development highlights Starknet's continued focus on scalability, proof efficiency, and improving blockchain performance.
As Layer-2 competition grows, technological improvements like this could play an important role in attracting developers and expanding ecosystem adoption.
However, the long-term impact will depend on real-world usage and continued network development.
Can Starknet become a major player in the next generation of blockchain infrastructure?
#strk #CryptoNews #Layer2 #blockchain #Ethereum
Starknet is gaining attention after introducing its new block-sized proof technology, demonstrating the ability to prove 1.1 billion Layer-2 gas in a single transaction.
This development highlights Starknet's continued focus on scalability, proof efficiency, and improving blockchain performance.
As Layer-2 competition grows, technological improvements like this could play an important role in attracting developers and expanding ecosystem adoption.
However, the long-term impact will depend on real-world usage and continued network development.
Can Starknet become a major player in the next generation of blockchain infrastructure?
#strk #CryptoNews #Layer2 #blockchain #Ethereum

1
600

·
--
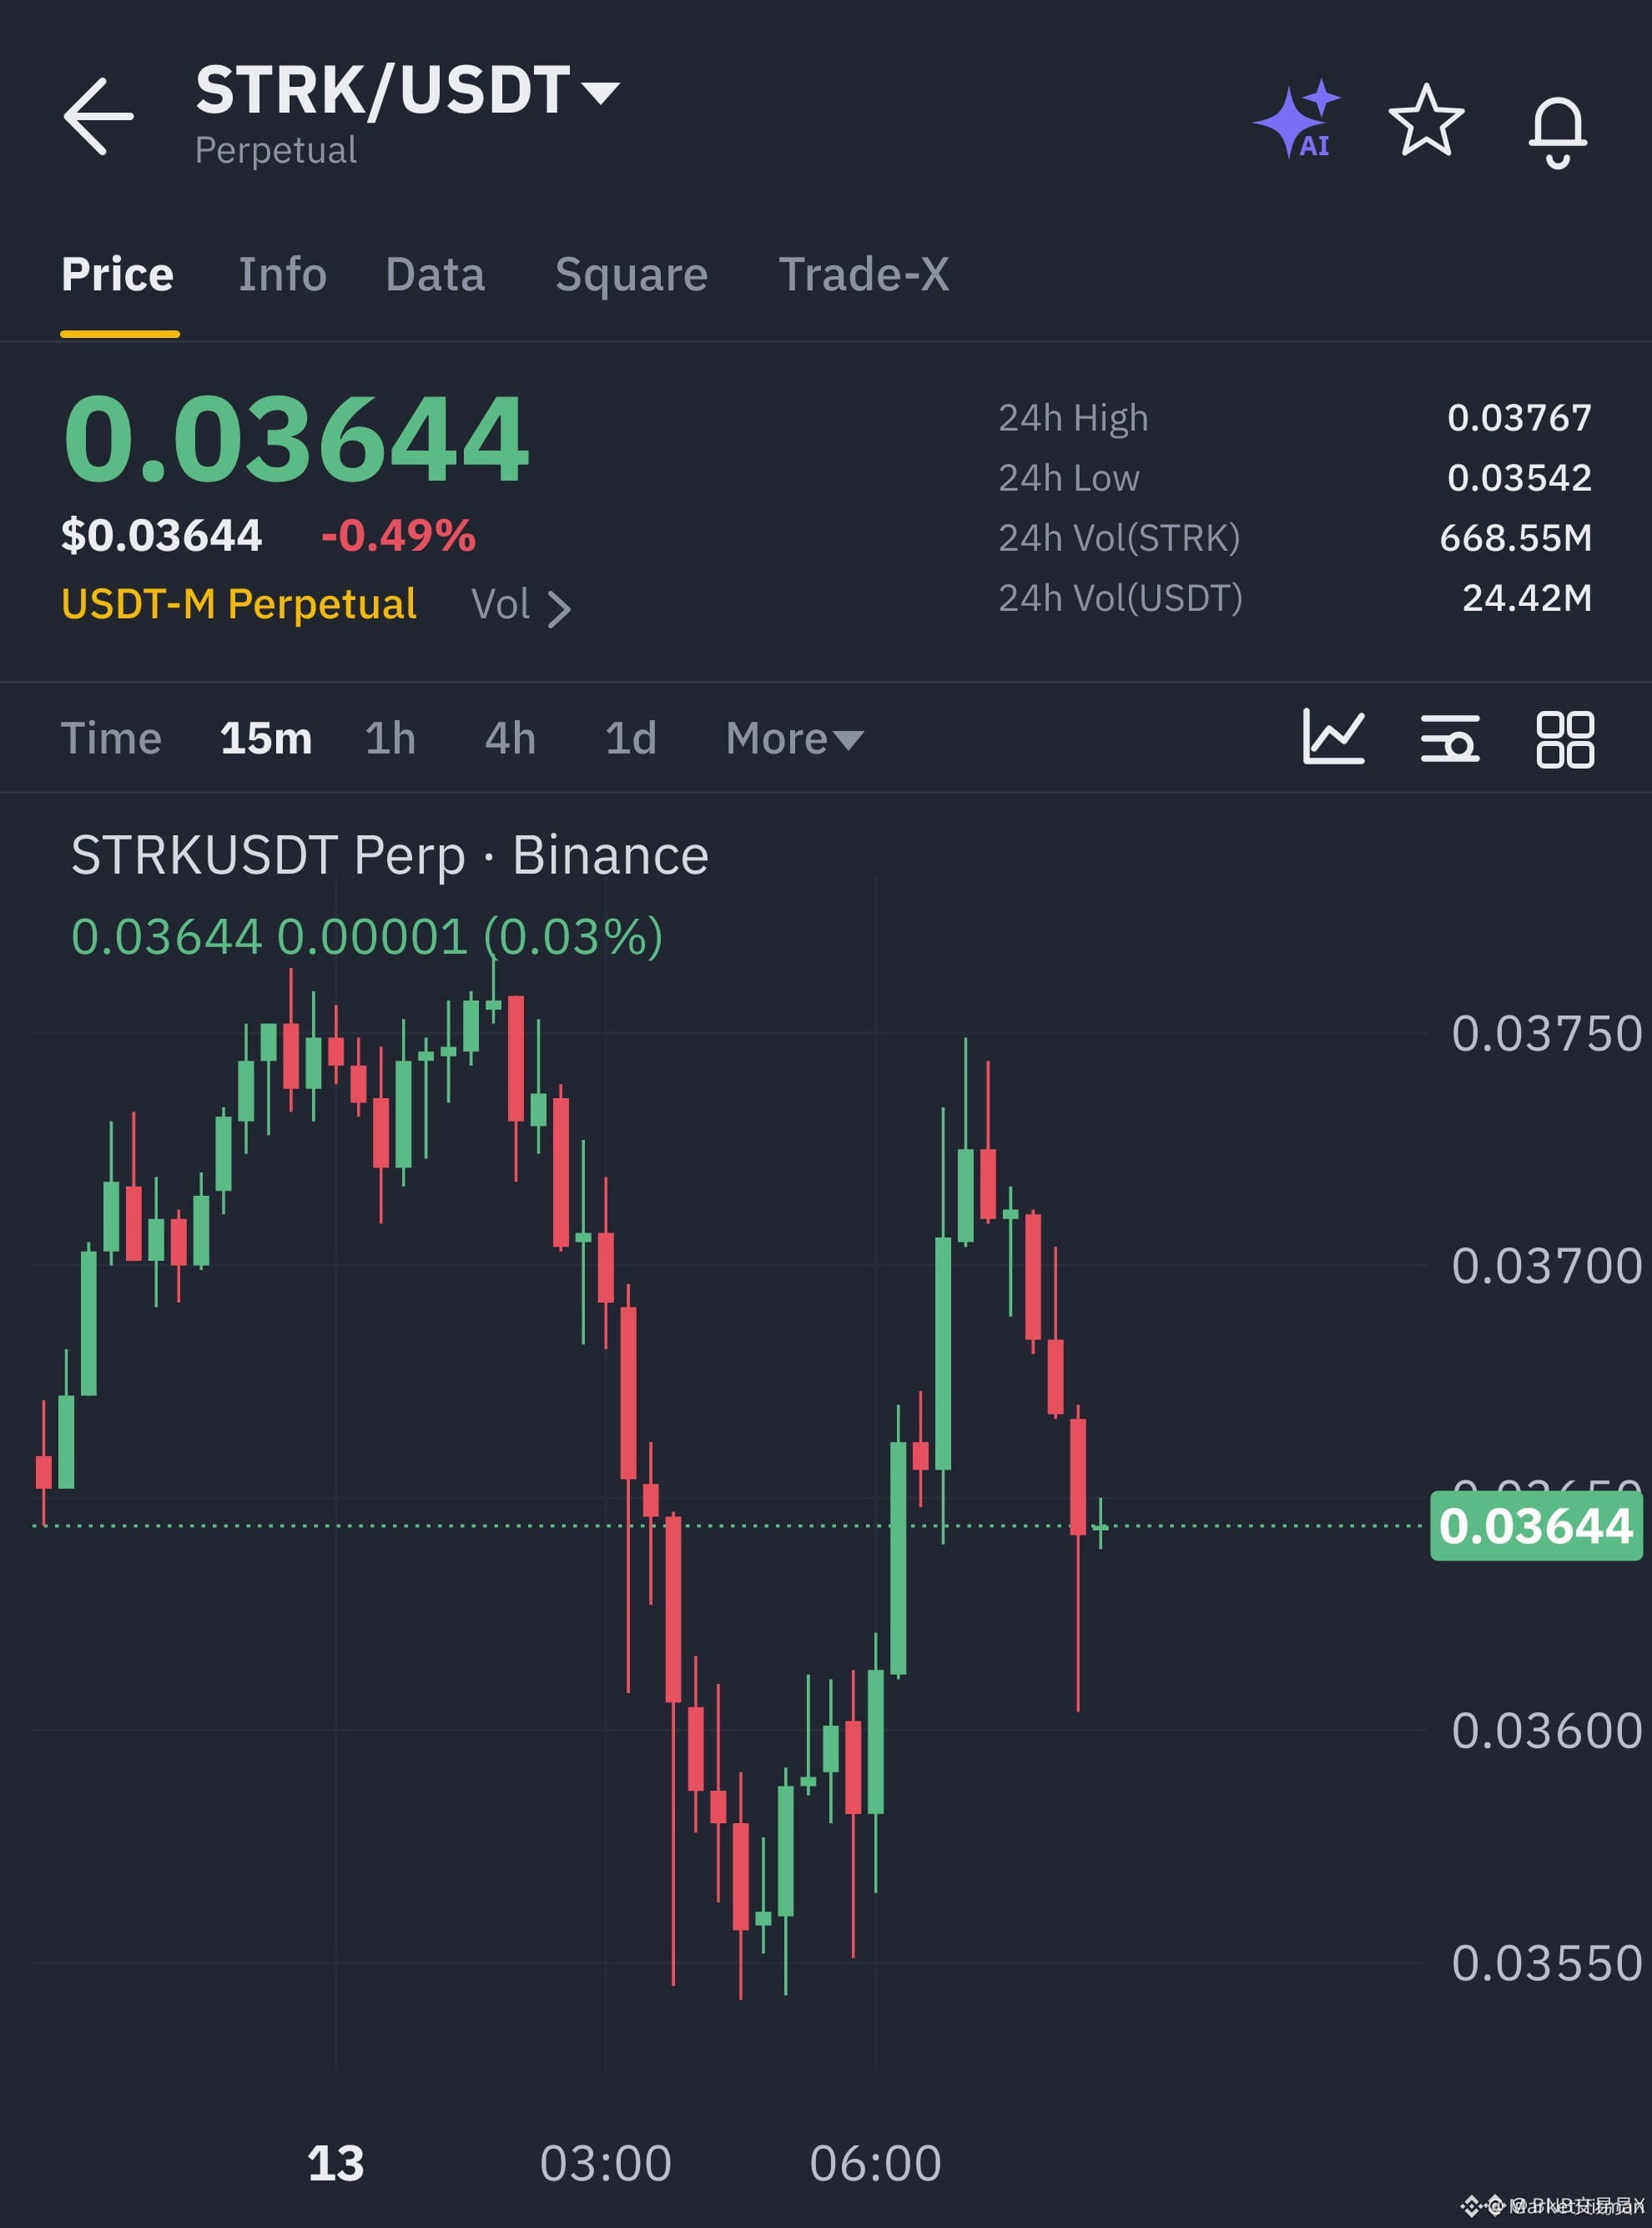
🔴 $STRK LOSING MOMENTUM AS SELLERS CAP THE BOUNCE AND WEIGHT PILES UP! 📉
Entry: 0.036312–0.036528 ⚡
Target: 0.035420 🎯
Stop Loss: 0.037286 ⚠️
Buyers are visibly exhausting their strength here as price gets firmly rejected below overhead resistance. 📊 Momentum indicators on the lower timeframes are rolling over, signaling that distribution is taking over.
Order flow shows aggressive supply stepping in to defend higher levels while bids thin out underneath. ⚡ Patient positioning on this downward rotation offers a clean risk-to-reward setup as bears target lower liquidity pockets.
💬 Are you tracking this breakdown closely or waiting for a deeper flush before entering? 👇
⚠️ Not financial advice. Always manage your risk. 🛡️
🏷️ #STRK #PYTH #JUP #ShortSetup
📉 🦈
🔴 $STRK LOSING MOMENTUM AS SELLERS CAP THE BOUNCE AND WEIGHT PILES UP! 📉
Entry: 0.036312–0.036528 ⚡
Target: 0.035420 🎯
Stop Loss: 0.037286 ⚠️
Buyers are visibly exhausting their strength here as price gets firmly rejected below overhead resistance. 📊 Momentum indicators on the lower timeframes are rolling over, signaling that distribution is taking over.
Order flow shows aggressive supply stepping in to defend higher levels while bids thin out underneath. ⚡ Patient positioning on this downward rotation offers a clean risk-to-reward setup as bears target lower liquidity pockets.
💬 Are you tracking this breakdown closely or waiting for a deeper flush before entering? 👇
⚠️ Not financial advice. Always manage your risk. 🛡️
🏷️ #STRK #PYTH #JUP #ShortSetup
📉 🦈
Entry: 0.036312–0.036528 ⚡
Target: 0.035420 🎯
Stop Loss: 0.037286 ⚠️
Buyers are visibly exhausting their strength here as price gets firmly rejected below overhead resistance. 📊 Momentum indicators on the lower timeframes are rolling over, signaling that distribution is taking over.
Order flow shows aggressive supply stepping in to defend higher levels while bids thin out underneath. ⚡ Patient positioning on this downward rotation offers a clean risk-to-reward setup as bears target lower liquidity pockets.
💬 Are you tracking this breakdown closely or waiting for a deeper flush before entering? 👇
⚠️ Not financial advice. Always manage your risk. 🛡️
🏷️ #STRK #PYTH #JUP #ShortSetup
📉 🦈
15


·
--
$STRK is down 5.0 percent today and I am passing on it completely
Trading $STRK with just 2.7M in daily volume is an easy way to get trapped
Volume sits right at 1.0x the weekly average which tells me nobody cares right now
I need to see an hourly close and hold above 0.03911 before I take a look
Or a clean pullback that holds 0.03545 and actually bounces off the lows
It could keep running without me and a bad entry costs more than a missed move
Chasing $STRK here or waiting for 0.03545?
#STRK #RiskManagement
$STRK is down 5.0 percent today and I am passing on it completely
Trading $STRK with just 2.7M in daily volume is an easy way to get trapped
Volume sits right at 1.0x the weekly average which tells me nobody cares right now
I need to see an hourly close and hold above 0.03911 before I take a look
Or a clean pullback that holds 0.03545 and actually bounces off the lows
It could keep running without me and a bad entry costs more than a missed move
Chasing $STRK here or waiting for 0.03545?
#STRK #RiskManagement
Trading $STRK with just 2.7M in daily volume is an easy way to get trapped
Volume sits right at 1.0x the weekly average which tells me nobody cares right now
I need to see an hourly close and hold above 0.03911 before I take a look
Or a clean pullback that holds 0.03545 and actually bounces off the lows
It could keep running without me and a bad entry costs more than a missed move
Chasing $STRK here or waiting for 0.03545?
#STRK #RiskManagement
10

·
--
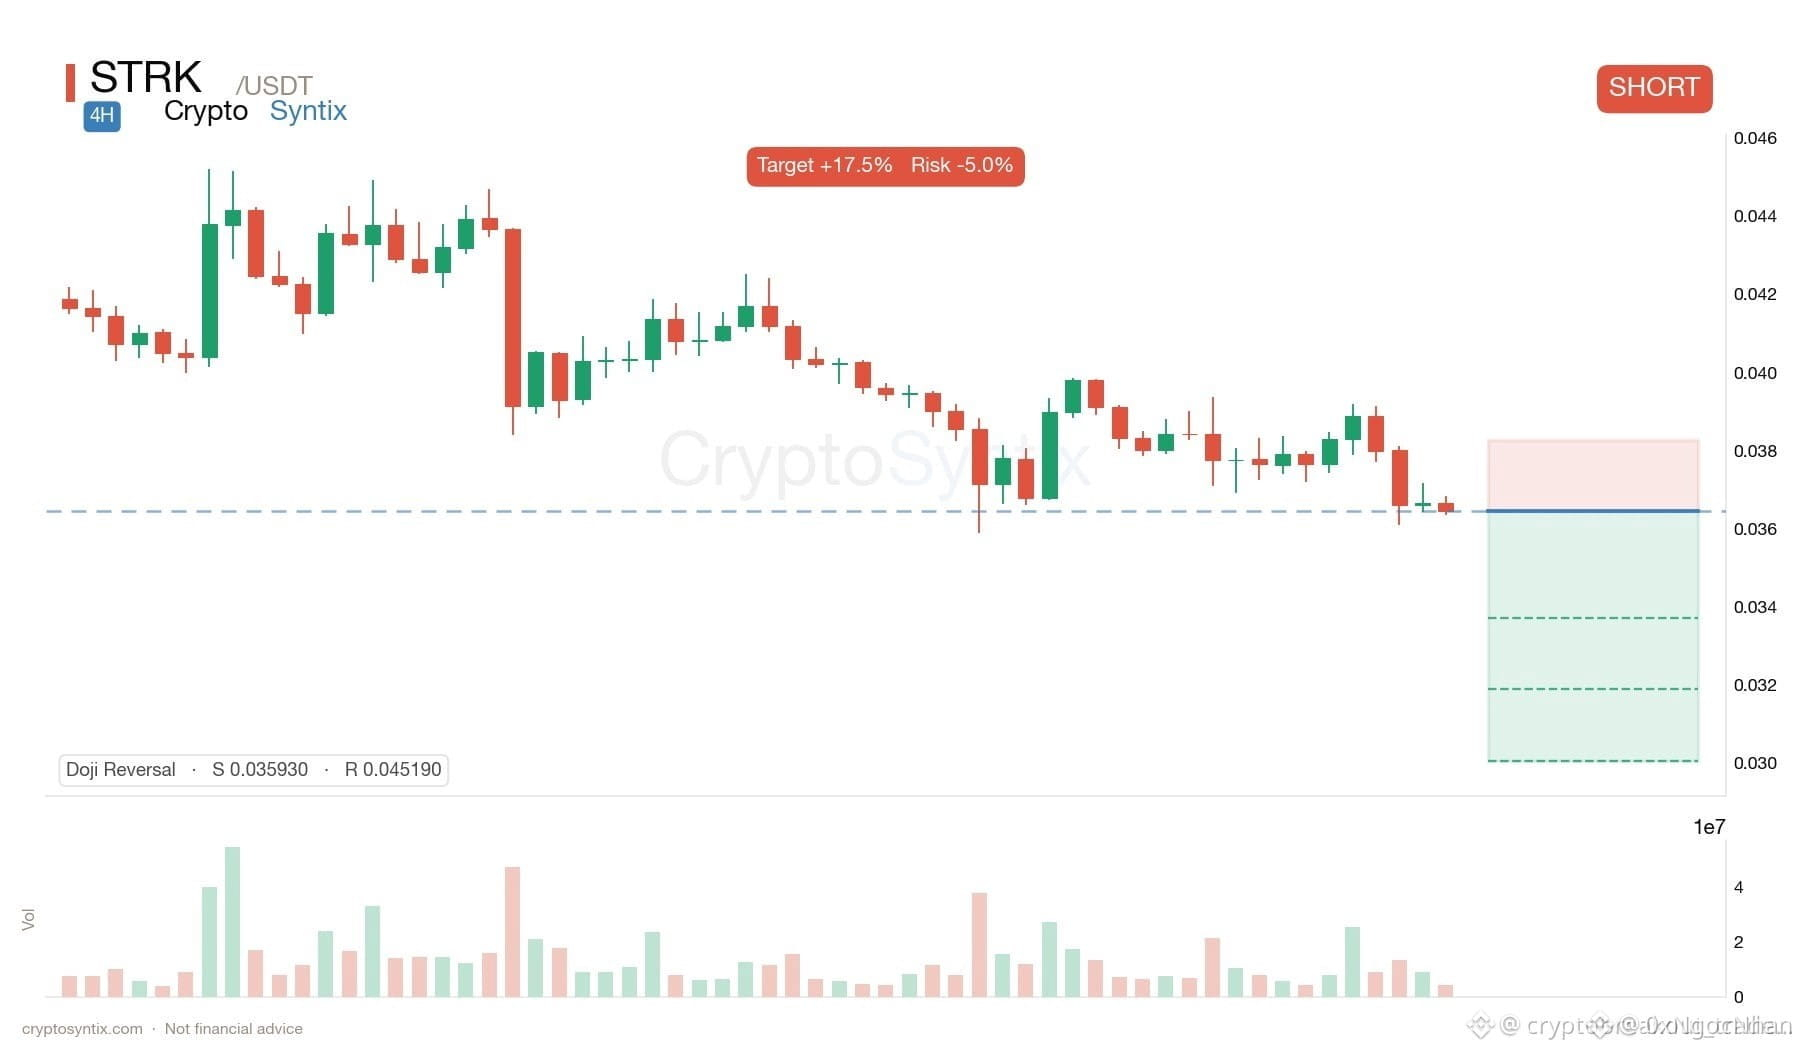
$STRK is already trading below the $0.03593 pressure point at $0.0358, down 6.79% in 24h. The 4h chart slipped 7.9%, while RSI sits near 34 and price remains under the 20D and 50D moving averages. Volume is only 0.4x its 20D average, so this looks more like weak demand than a clean capitulation. Bulls need to reclaim $0.04519 to challenge the bearish structure. Risk remains elevated 📉👀 #STRK #CryptoNews #Crypto
Inspired by cryptobreakout_trader on Binance Square.
$STRK is already trading below the $0.03593 pressure point at $0.0358, down 6.79% in 24h. The 4h chart slipped 7.9%, while RSI sits near 34 and price remains under the 20D and 50D moving averages. Volume is only 0.4x its 20D average, so this looks more like weak demand than a clean capitulation. Bulls need to reclaim $0.04519 to challenge the bearish structure. Risk remains elevated 📉👀 #STRK #CryptoNews #Crypto
Inspired by cryptobreakout_trader on Binance Square.
Inspired by cryptobreakout_trader on Binance Square.
39

$STRK
🔴🩸 $STRK Under Selling Pressure
🔥 Momentum is shifting in the bears' favor.
📉 Bearish Trigger: Losing $0.03593 could accelerate the sell-off.
🚧 Key Resistance: $0.04519
❌ Invalidation: A reclaim above $0.04519 would weaken the bearish structure.
⚡ Distribution near the highs often precedes the drop. Stay alert.
👀 The crowd chases candles. The prepared position before them.
#STRK #Crypto #Altcoins #Trading
$STRK
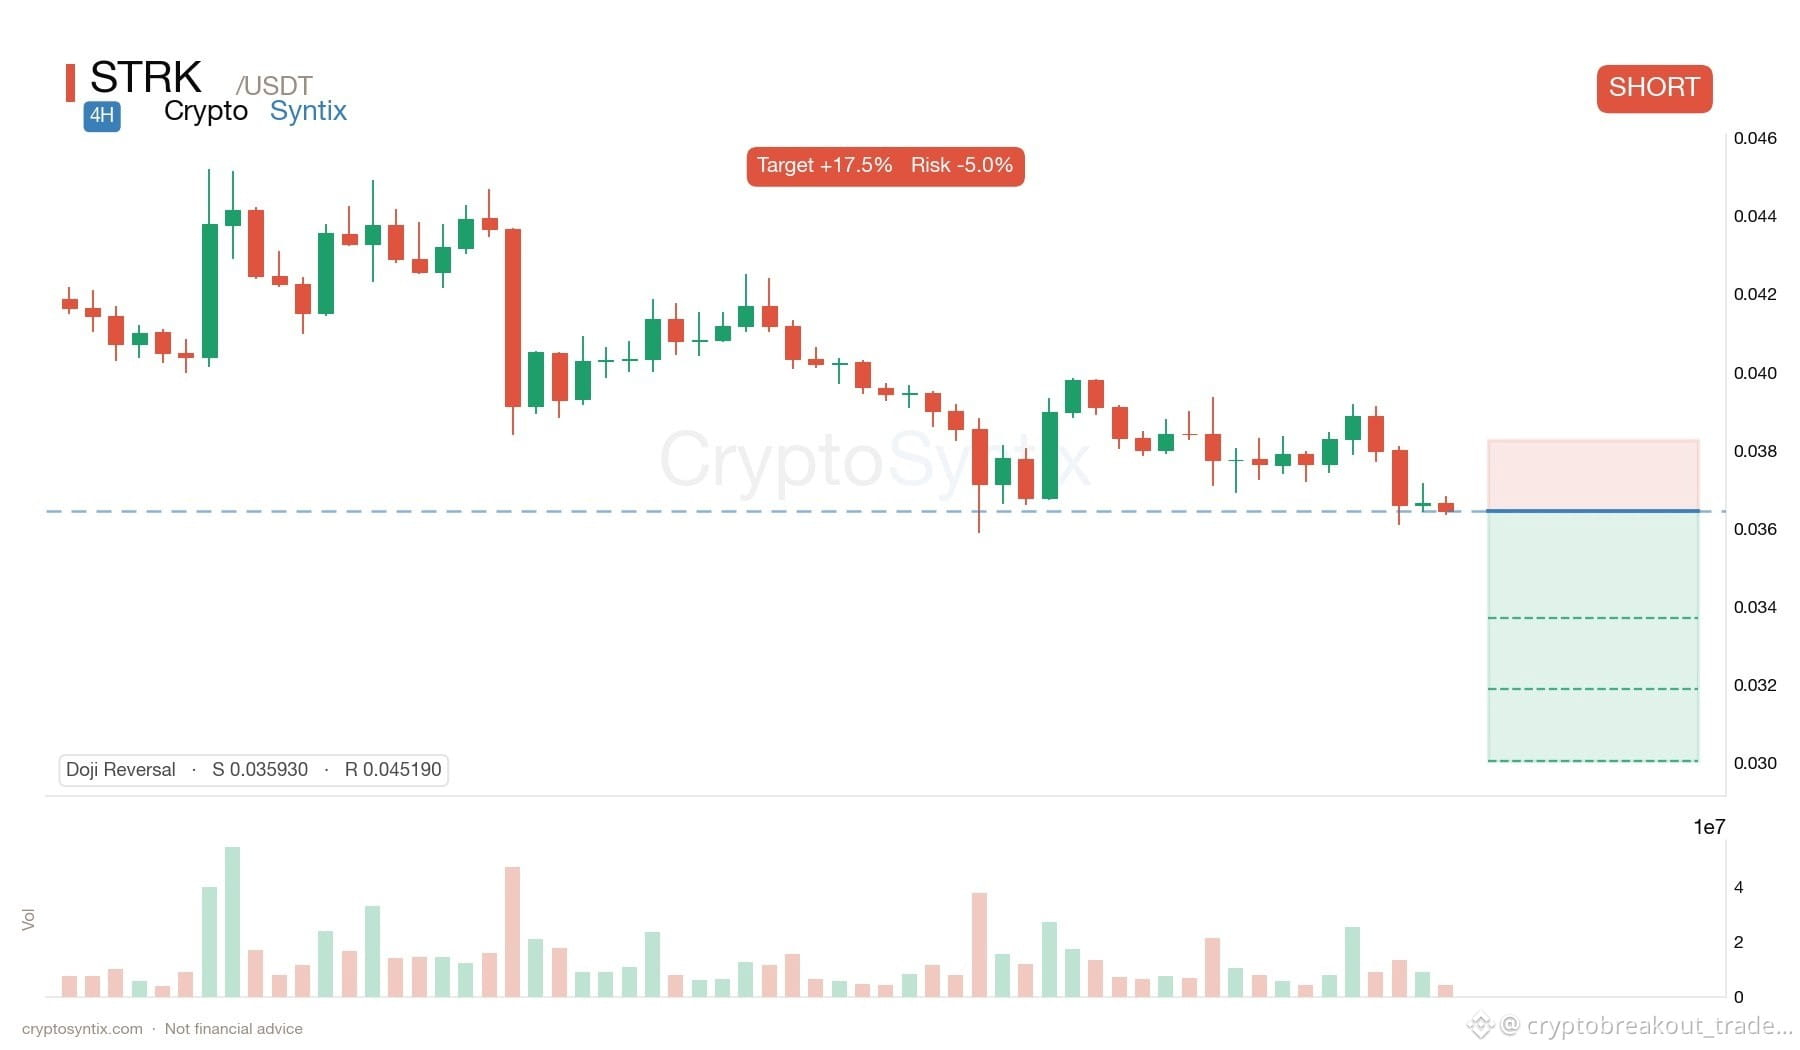
🔴🩸 $STRK Under Selling Pressure
🔥 Momentum is shifting in the bears' favor.
📉 Bearish Trigger: Losing $0.03593 could accelerate the sell-off.
🚧 Key Resistance: $0.04519
❌ Invalidation: A reclaim above $0.04519 would weaken the bearish structure.
⚡ Distribution near the highs often precedes the drop. Stay alert.
👀 The crowd chases candles. The prepared position before them.
#STRK #Crypto #Altcoins #Trading
🔴🩸 $STRK Under Selling Pressure
🔥 Momentum is shifting in the bears' favor.
📉 Bearish Trigger: Losing $0.03593 could accelerate the sell-off.
🚧 Key Resistance: $0.04519
❌ Invalidation: A reclaim above $0.04519 would weaken the bearish structure.
⚡ Distribution near the highs often precedes the drop. Stay alert.
👀 The crowd chases candles. The prepared position before them.
#STRK #Crypto #Altcoins #Trading
612
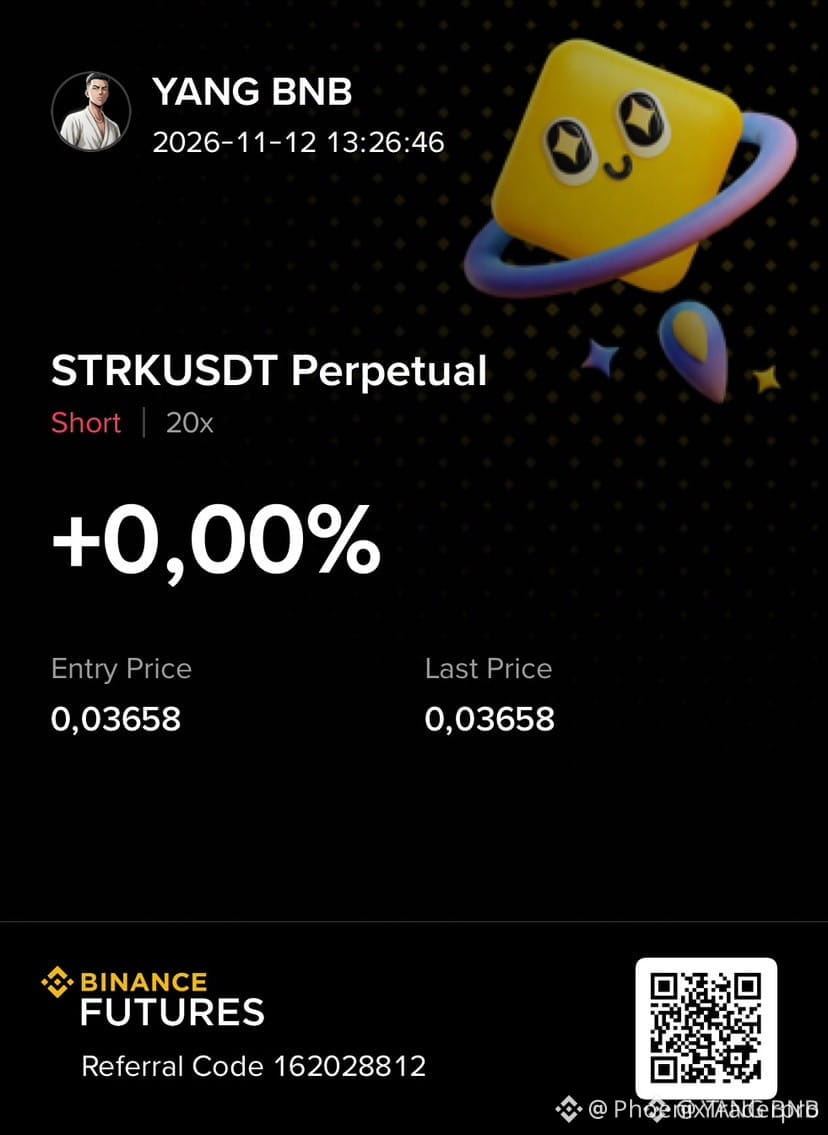
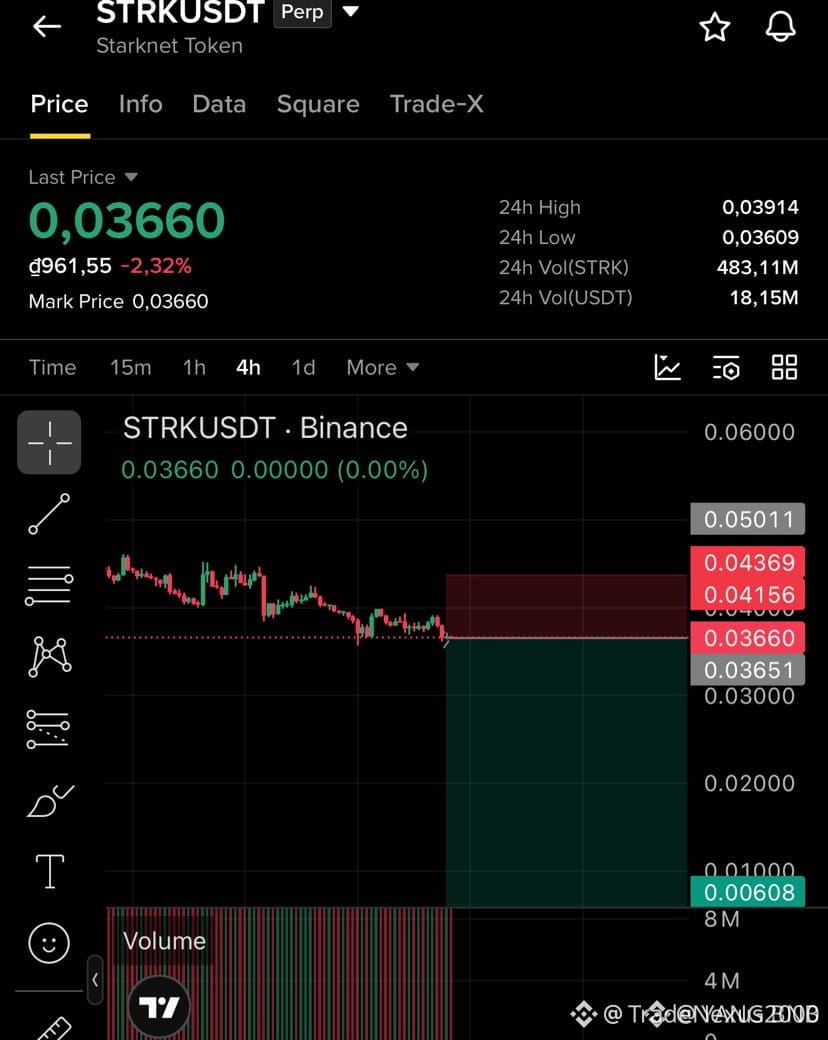
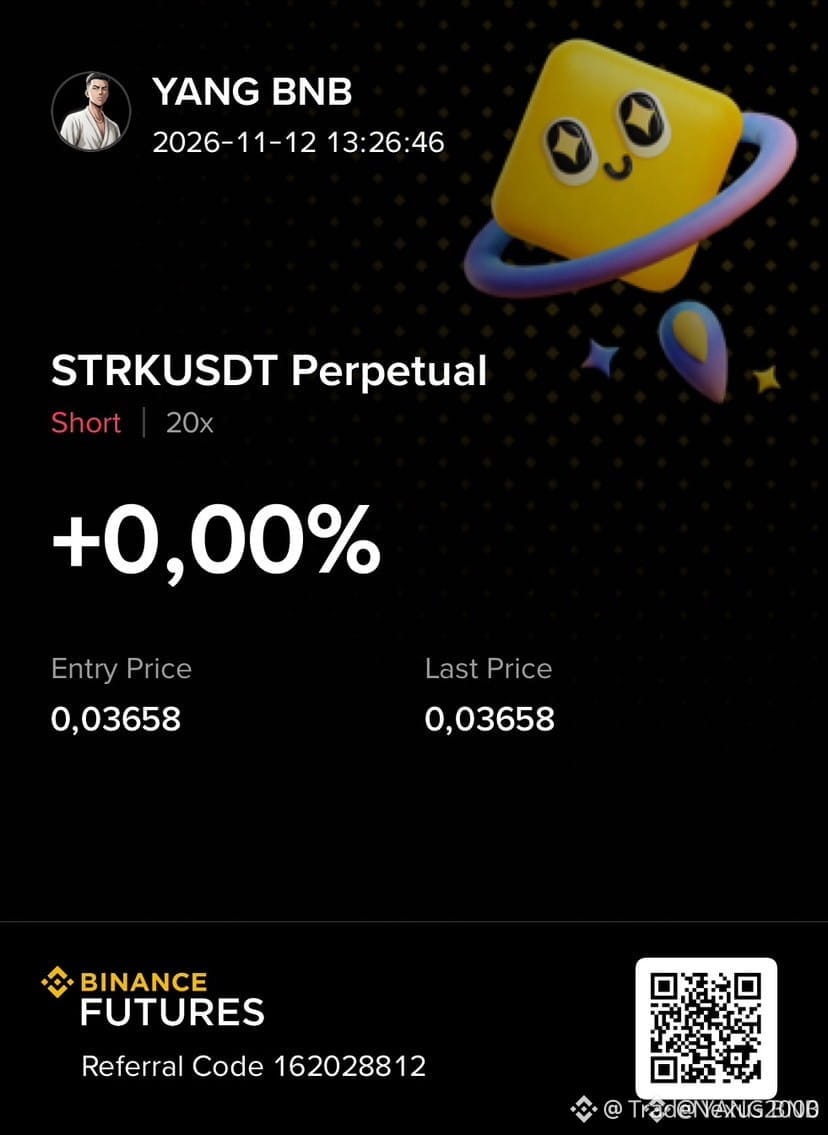
📉 $STRK BEARS ARE CRUSHING THE ORDER BOOK AS SELLER MOMENTUM ACCELERATES! 🩸
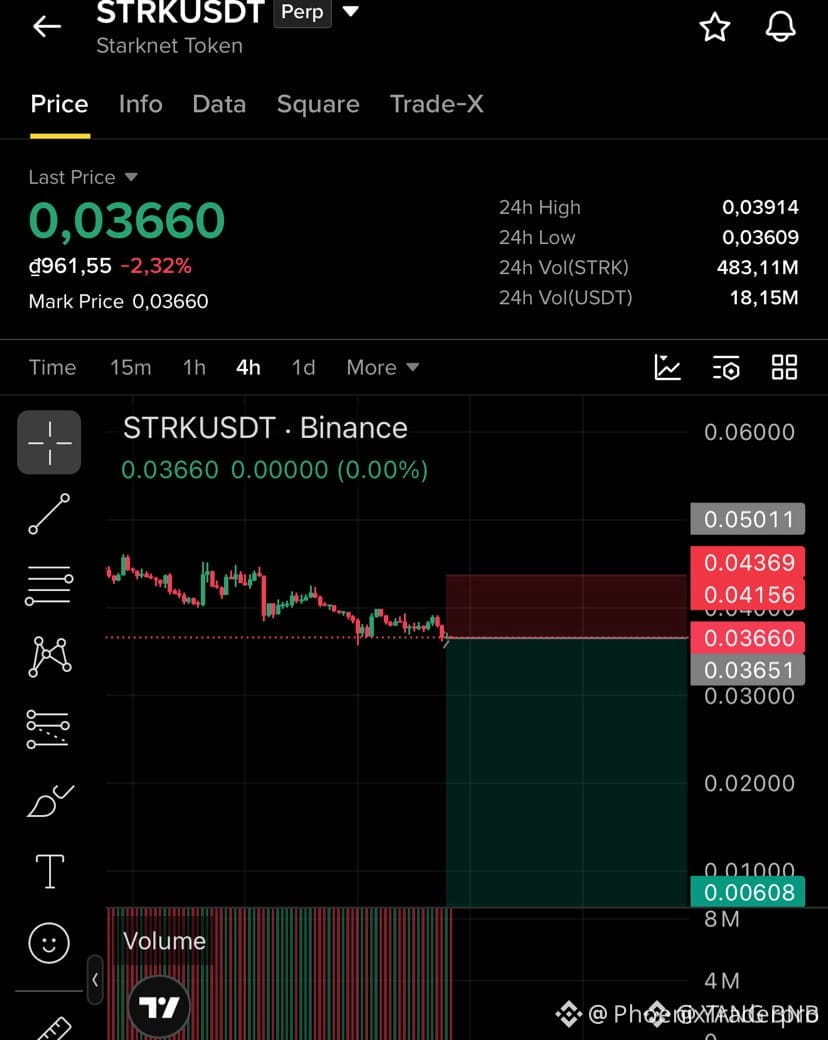
Entry: 0.03651 ⚡
Target: 0.00608 🎯
Sellers have seized complete control of the order book, systematically dismantling every weak bid in sight 📊. Distribution volume is climbing while upside attempts are getting instantly smothered by passive liquidity walls at major resistance.
This breakdown structure signals heavy institutional unwinding as supply floods the open market ⚡. Patience pays when the macro trend aligns this cleanly with relentless downward pressure.
💬 Are you positioning for this descent or waiting for confirmation below range support? 👇
⚠️ Not financial advice. Always manage your risk. 🛡️
🏷️ #STRK #ShortSetup #Bearish #Crypto
🐻 🩸
📉 $STRK BEARS ARE CRUSHING THE ORDER BOOK AS SELLER MOMENTUM ACCELERATES! 🩸
Entry: 0.03651 ⚡
Target: 0.00608 🎯
Sellers have seized complete control of the order book, systematically dismantling every weak bid in sight 📊. Distribution volume is climbing while upside attempts are getting instantly smothered by passive liquidity walls at major resistance.
This breakdown structure signals heavy institutional unwinding as supply floods the open market ⚡. Patience pays when the macro trend aligns this cleanly with relentless downward pressure.
💬 Are you positioning for this descent or waiting for confirmation below range support? 👇
⚠️ Not financial advice. Always manage your risk. 🛡️
🏷️ #STRK #ShortSetup #Bearish #Crypto
🐻 🩸
Entry: 0.03651 ⚡
Target: 0.00608 🎯
Sellers have seized complete control of the order book, systematically dismantling every weak bid in sight 📊. Distribution volume is climbing while upside attempts are getting instantly smothered by passive liquidity walls at major resistance.
This breakdown structure signals heavy institutional unwinding as supply floods the open market ⚡. Patience pays when the macro trend aligns this cleanly with relentless downward pressure.
💬 Are you positioning for this descent or waiting for confirmation below range support? 👇
⚠️ Not financial advice. Always manage your risk. 🛡️
🏷️ #STRK #ShortSetup #Bearish #Crypto
🐻 🩸
18
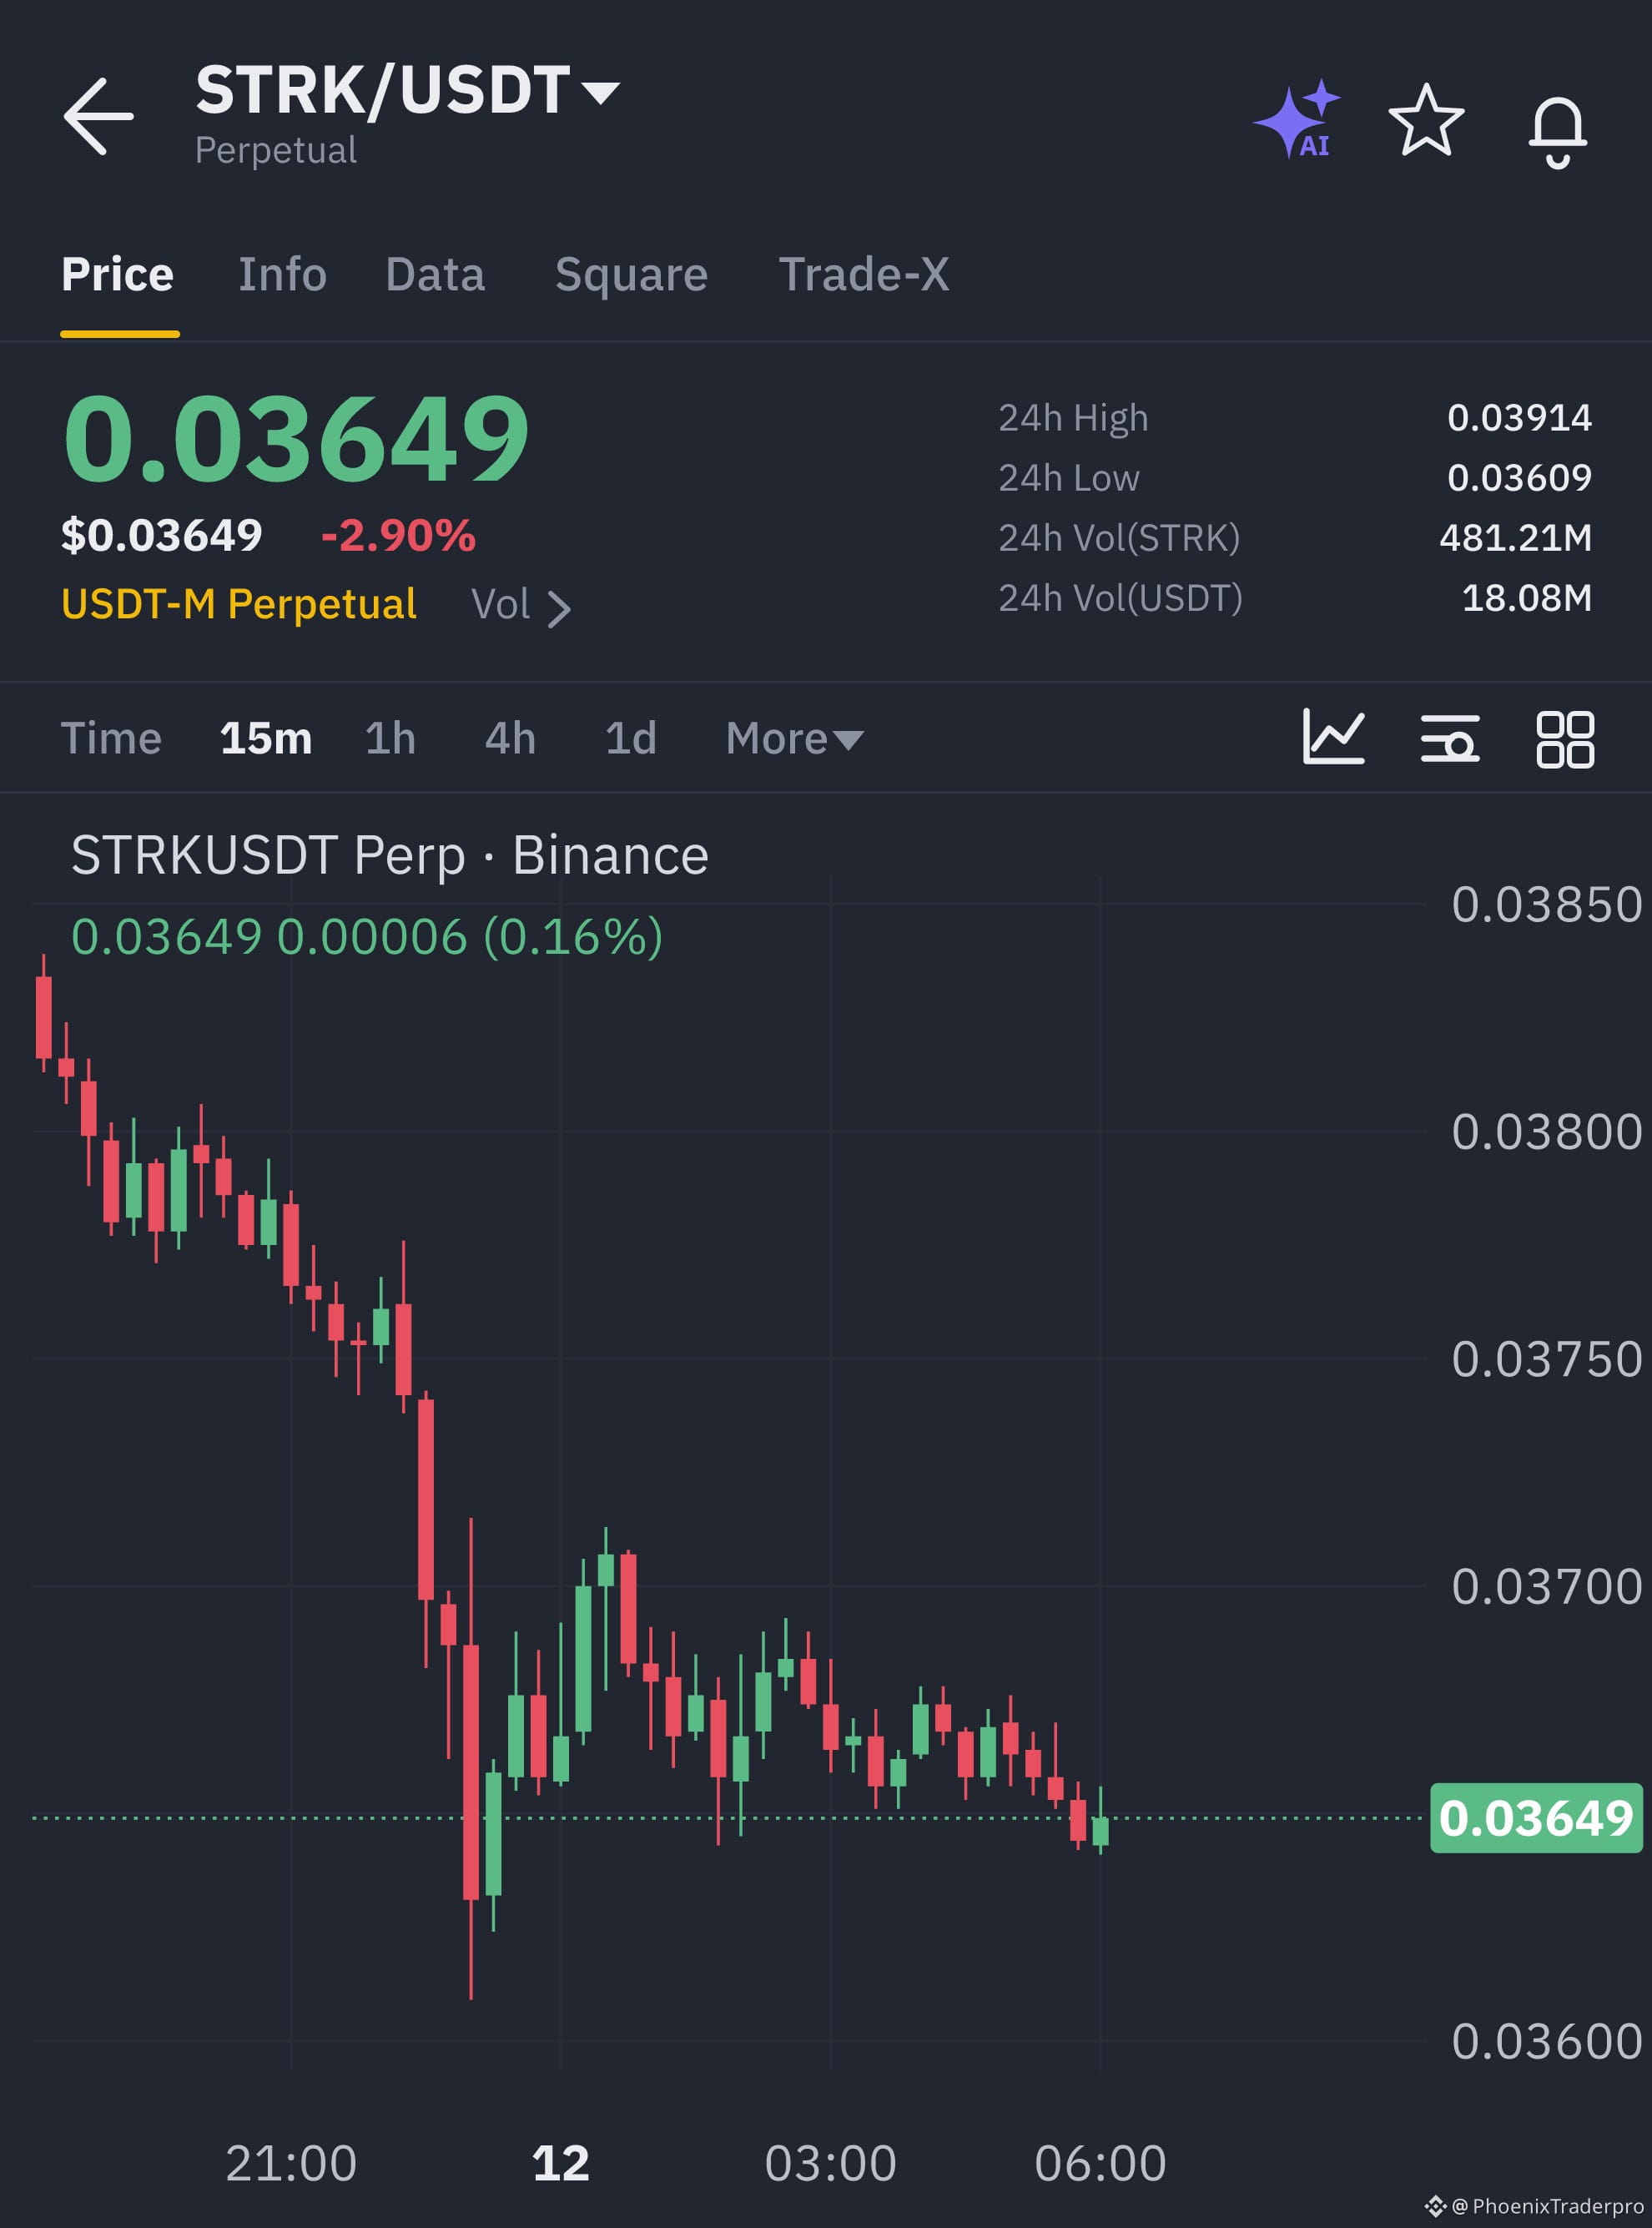
🔴 $STRK BUYERS ARE LOSING STEAM AS OVERHEAD RESISTANCE CRUSHES THE BOUNCE! 📉
Entry: 0.036448–0.036532 ⚡
Target: 0.035888 🚀
Stop Loss: 0.036824 ⚠️
Sellers are firmly guarding the upper boundaries as upside momentum fades rapidly across the order books. Price action looks heavy underneath the 0.036930 ceiling, signaling that distribution is active before the next leg lower. 📊
The breakdown structure points straight toward the 0.036410 pivot point as liquidity dries up on relief bounces. 📌
Are you fading this weak bounce or waiting for a clean break below support? 👇
⚠️ Not financial advice. Always manage your risk. 🛡️
🏷️ #STRK #ShortSetup #Crypto #Breakdown #AVAX
🔥 💎
🔴 $STRK BUYERS ARE LOSING STEAM AS OVERHEAD RESISTANCE CRUSHES THE BOUNCE! 📉
Entry: 0.036448–0.036532 ⚡
Target: 0.035888 🚀
Stop Loss: 0.036824 ⚠️
Sellers are firmly guarding the upper boundaries as upside momentum fades rapidly across the order books. Price action looks heavy underneath the 0.036930 ceiling, signaling that distribution is active before the next leg lower. 📊
The breakdown structure points straight toward the 0.036410 pivot point as liquidity dries up on relief bounces. 📌
Are you fading this weak bounce or waiting for a clean break below support? 👇
⚠️ Not financial advice. Always manage your risk. 🛡️
🏷️ #STRK #ShortSetup #Crypto #Breakdown #AVAX
🔥 💎
Entry: 0.036448–0.036532 ⚡
Target: 0.035888 🚀
Stop Loss: 0.036824 ⚠️
Sellers are firmly guarding the upper boundaries as upside momentum fades rapidly across the order books. Price action looks heavy underneath the 0.036930 ceiling, signaling that distribution is active before the next leg lower. 📊
The breakdown structure points straight toward the 0.036410 pivot point as liquidity dries up on relief bounces. 📌
Are you fading this weak bounce or waiting for a clean break below support? 👇
⚠️ Not financial advice. Always manage your risk. 🛡️
🏷️ #STRK #ShortSetup #Crypto #Breakdown #AVAX
🔥 💎
15
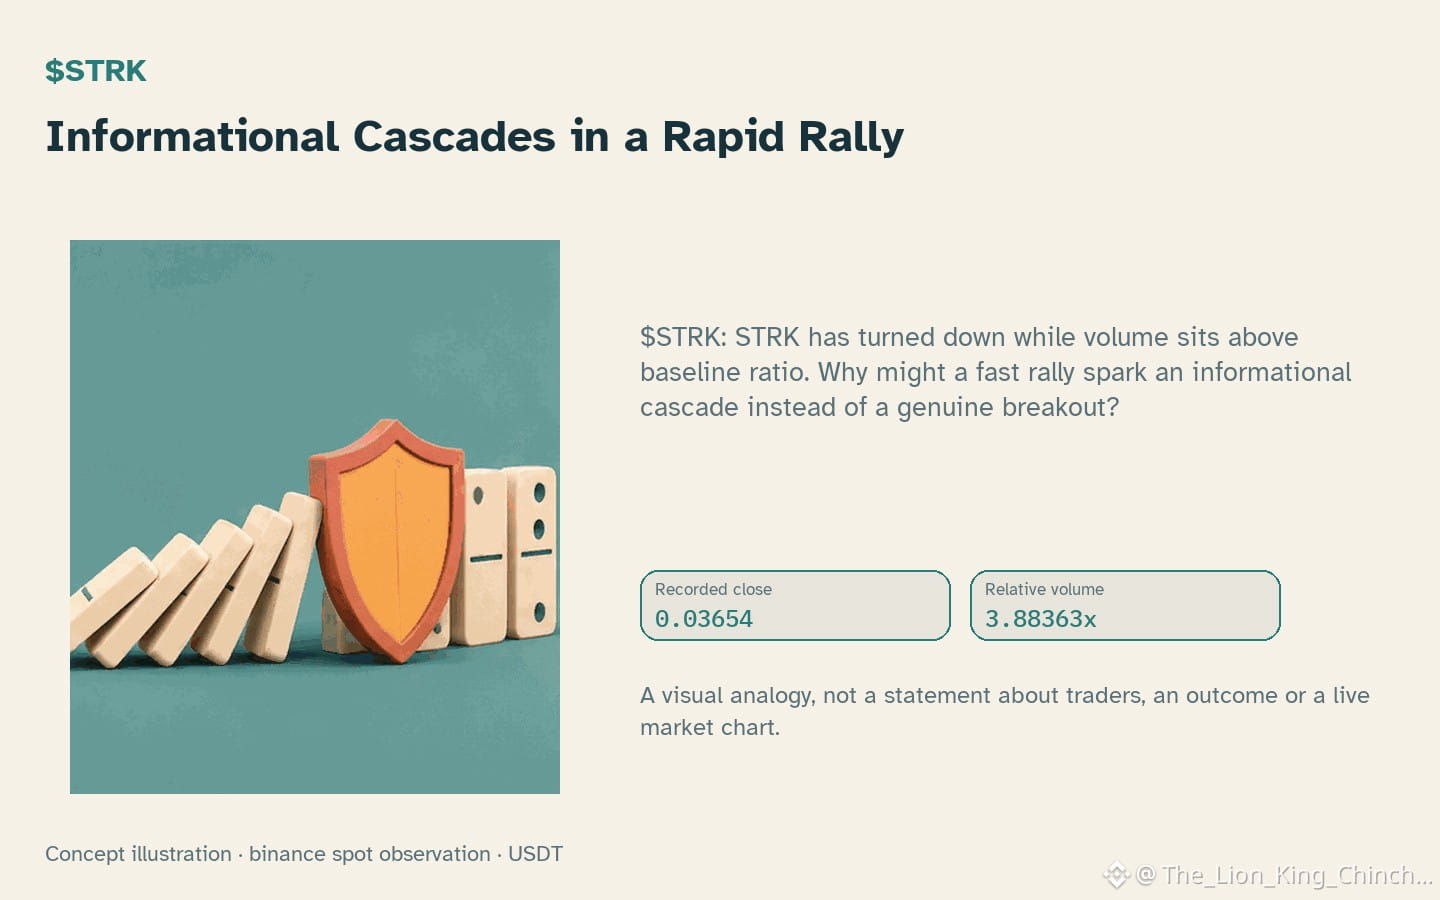
$STRK: Informational Cascades in a Rapid Rally
$STRK: STRK has turned down while volume sits above baseline ratio. Why might a fast rally spark an informational cascade instead of a genuine breakout?
### The tempting shortcut
When traders see hourly direction down but notice relative volume 3.88x baseline, the contrast can create a mental shortcut. The bias of anchoring may cause people to fixate on the volume spike as proof of strength, ignoring the price move. This shortcut often fuels an informational cascade: each participant assumes the previous trader had better information, so they join the rally without independent analysis.
### A more careful interpretation
A cautious view would treat the volume surge as a single data point and ask whether it reflects broader participation or a short‑lived burst. RSI 41.2 offers a modest gauge of momentum, but on its own it cannot confirm a sustained trend. Traders might over‑react, driven by fear of missing out, and push the price higher even though the hourly direction remains down. This scenario illustrates loss aversion: the pain of missing a perceived gain can outweigh the risk of a reversal.
### A useful next observation
Future closed‑candle data that shows hourly change -0.191205% turning positive would weaken the cascade hypothesis, suggesting genuine buying pressure. Conversely, a return to neutral or negative change would support the idea that the rally was mainly psychological.
**Self‑check**: Before adding to a position, ask if you are following the volume cue because you independently see value, or because you are echoing the crowd. If the answer leans toward the latter, pause and wait for a confirming price move.
Probabilistic market research, not a recommendation or guaranteed return.
Watchlist contrast: $ETH has hourly direction up and volume not above its baseline; $KITE has hourly direction up and volume above its baseline. This alone does not establish correlation.
#STRK #ETH #KITE #TradingPsychology
$STRK : Informational Cascades in a Rapid Rally
$STRK : STRK has turned down while volume sits above baseline ratio. Why might a fast rally spark an informational cascade instead of a genuine breakout?
### The tempting shortcut
When traders see hourly direction down but notice relative volume 3.88x baseline, the contrast can create a mental shortcut. The bias of anchoring may cause people to fixate on the volume spike as proof of strength, ignoring the price move. This shortcut often fuels an informational cascade: each participant assumes the previous trader had better information, so they join the rally without independent analysis.
### A more careful interpretation
A cautious view would treat the volume surge as a single data point and ask whether it reflects broader participation or a short‑lived burst. RSI 41.2 offers a modest gauge of momentum, but on its own it cannot confirm a sustained trend. Traders might over‑react, driven by fear of missing out, and push the price higher even though the hourly direction remains down. This scenario illustrates loss aversion: the pain of missing a perceived gain can outweigh the risk of a reversal.
### A useful next observation
Future closed‑candle data that shows hourly change -0.191205% turning positive would weaken the cascade hypothesis, suggesting genuine buying pressure. Conversely, a return to neutral or negative change would support the idea that the rally was mainly psychological.
**Self‑check**: Before adding to a position, ask if you are following the volume cue because you independently see value, or because you are echoing the crowd. If the answer leans toward the latter, pause and wait for a confirming price move.
Probabilistic market research, not a recommendation or guaranteed return.
Watchlist contrast: $ETH has hourly direction up and volume not above its baseline; $KITE has hourly direction up and volume above its baseline. This alone does not establish correlation.
#STRK #ETH #KITE #TradingPsychology
$STRK : STRK has turned down while volume sits above baseline ratio. Why might a fast rally spark an informational cascade instead of a genuine breakout?
### The tempting shortcut
When traders see hourly direction down but notice relative volume 3.88x baseline, the contrast can create a mental shortcut. The bias of anchoring may cause people to fixate on the volume spike as proof of strength, ignoring the price move. This shortcut often fuels an informational cascade: each participant assumes the previous trader had better information, so they join the rally without independent analysis.
### A more careful interpretation
A cautious view would treat the volume surge as a single data point and ask whether it reflects broader participation or a short‑lived burst. RSI 41.2 offers a modest gauge of momentum, but on its own it cannot confirm a sustained trend. Traders might over‑react, driven by fear of missing out, and push the price higher even though the hourly direction remains down. This scenario illustrates loss aversion: the pain of missing a perceived gain can outweigh the risk of a reversal.
### A useful next observation
Future closed‑candle data that shows hourly change -0.191205% turning positive would weaken the cascade hypothesis, suggesting genuine buying pressure. Conversely, a return to neutral or negative change would support the idea that the rally was mainly psychological.
**Self‑check**: Before adding to a position, ask if you are following the volume cue because you independently see value, or because you are echoing the crowd. If the answer leans toward the latter, pause and wait for a confirming price move.
Probabilistic market research, not a recommendation or guaranteed return.
Watchlist contrast: $ETH has hourly direction up and volume not above its baseline; $KITE has hourly direction up and volume above its baseline. This alone does not establish correlation.
#STRK #ETH #KITE #TradingPsychology
92

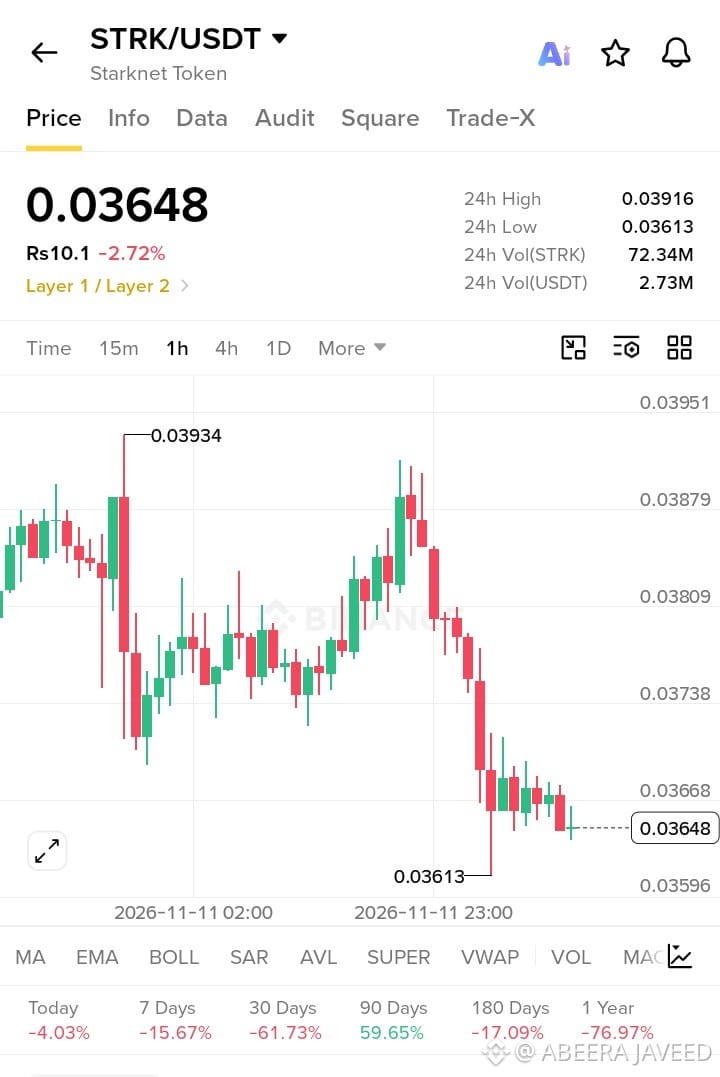
🚀 $STRK IS TESTING A KEY SUPPORT ZONE!
STRK is approaching the $0.03600 support area. A confirmed bullish bounce could open the door toward $0.03920.
📍 Entry: $0.03600–$0.03650
🎯 TP1: $0.03720
🎯 TP2: $0.03820
🎯 TP3: $0.03920
🛑 SL: $0.03550
Wait for buyer confirmation before considering the setup. Manage risk carefully.
#STRK #CryptoTrading #Altcoins #BinanceSquare
🚀 $STRK IS TESTING A KEY SUPPORT ZONE!
STRK is approaching the $0.03600 support area. A confirmed bullish bounce could open the door toward $0.03920.
📍 Entry: $0.03600–$0.03650
🎯 TP1: $0.03720
🎯 TP2: $0.03820
🎯 TP3: $0.03920
🛑 SL: $0.03550
Wait for buyer confirmation before considering the setup. Manage risk carefully.
#STRK #CryptoTrading #Altcoins #BinanceSquare
STRK is approaching the $0.03600 support area. A confirmed bullish bounce could open the door toward $0.03920.
📍 Entry: $0.03600–$0.03650
🎯 TP1: $0.03720
🎯 TP2: $0.03820
🎯 TP3: $0.03920
🛑 SL: $0.03550
Wait for buyer confirmation before considering the setup. Manage risk carefully.
#STRK #CryptoTrading #Altcoins #BinanceSquare
14

🚨 $STRK BREAKDOWN CONFIRMED AS SMART MONEY FLOODS INTO SHORT POSITIONS 📉
Entry: 0.03651 ⚡
Target: 0.00608 🎯
Institutional order flow shows aggressive distribution forming right below key resistance. Market structure has flipped bearish on the lower timeframes, opening a clean inefficiency window for downward expansion. 📊
The mitigation block at current levels acts as a launchpad for sellers aiming at lower liquidity pools. 🌊 Volume profiles indicate fading buyer participation while supply outpaces demand heavily. 💡
Are you riding this structural breakdown down to the lows, or waiting for a retest? 👇
⚠️ Not financial advice. Always manage your risk. 🛡️
🏷️ #STRK #ShortSetup #MarketStructure #Crypto
📉 🦈
🚨 $STRK BREAKDOWN CONFIRMED AS SMART MONEY FLOODS INTO SHORT POSITIONS 📉
Entry: 0.03651 ⚡
Target: 0.00608 🎯
Institutional order flow shows aggressive distribution forming right below key resistance. Market structure has flipped bearish on the lower timeframes, opening a clean inefficiency window for downward expansion. 📊
The mitigation block at current levels acts as a launchpad for sellers aiming at lower liquidity pools. 🌊 Volume profiles indicate fading buyer participation while supply outpaces demand heavily. 💡
Are you riding this structural breakdown down to the lows, or waiting for a retest? 👇
⚠️ Not financial advice. Always manage your risk. 🛡️
🏷️ #STRK #ShortSetup #MarketStructure #Crypto
📉 🦈
Entry: 0.03651 ⚡
Target: 0.00608 🎯
Institutional order flow shows aggressive distribution forming right below key resistance. Market structure has flipped bearish on the lower timeframes, opening a clean inefficiency window for downward expansion. 📊
The mitigation block at current levels acts as a launchpad for sellers aiming at lower liquidity pools. 🌊 Volume profiles indicate fading buyer participation while supply outpaces demand heavily. 💡
Are you riding this structural breakdown down to the lows, or waiting for a retest? 👇
⚠️ Not financial advice. Always manage your risk. 🛡️
🏷️ #STRK #ShortSetup #MarketStructure #Crypto
📉 🦈
7

·
--
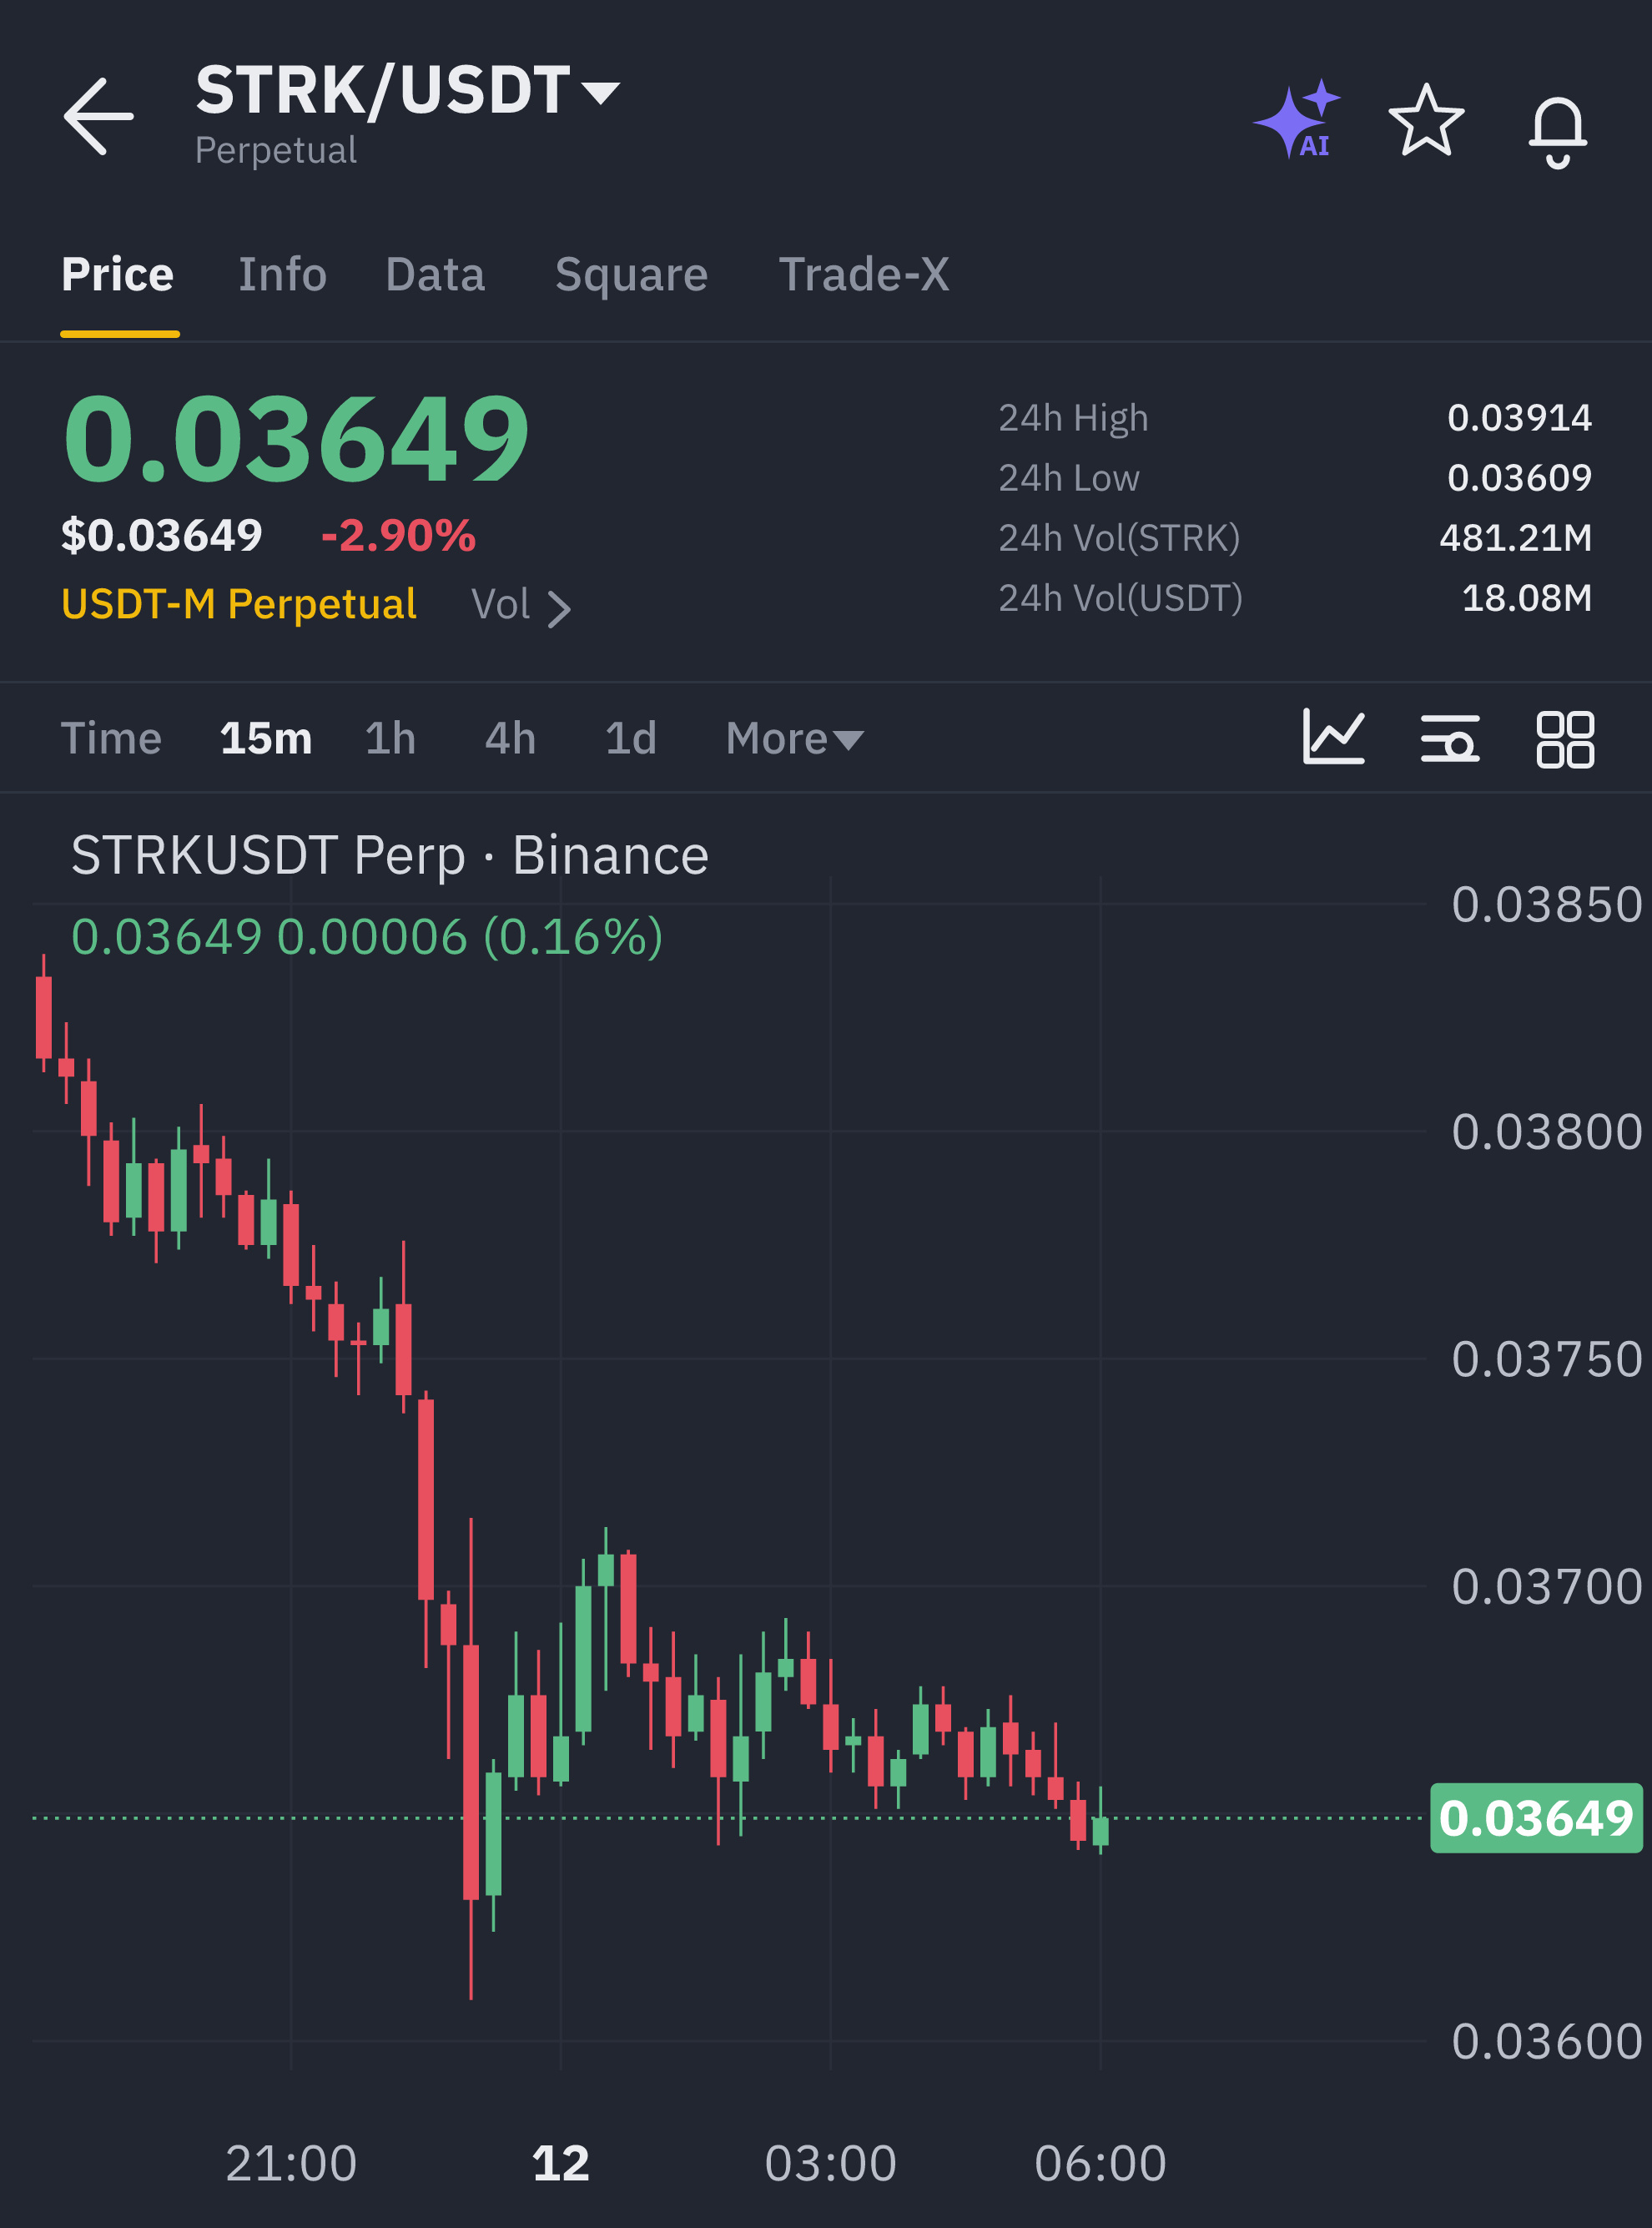
🔴 $STRK LOSING STRUCTURAL SUPPORT AS SMART MONEY CAPPING PRESSURES MOUNT! 📉
Entry: 0.036448–0.036532 ⚡
Target: 0.035888 🎯
Stop Loss: 0.036824 ⚠️
Price action on $STRK is showing clear distribution signs with buyers failing to defend the local pivot. Order flow reflects aggressive capping below 0.036930, leaving the bids vulnerable to a deeper liquidity sweep toward institutional targets. 📊
Momentum oscillators on the lower timeframes confirm fading buying pressure while supply blocks remain heavily defended. ⚡ This structural rejection highlights a clean distribution phase before the next leg lower. 🔍
Are you tracking this short setup or waiting for a retest of higher resistance? 🤔
⚠️ Not financial advice. Always manage your risk. 🛡️
🏷️ #STRK #ShortSetup #MarketStructure #OrderFlow
📉 🦈
🔴 $STRK LOSING STRUCTURAL SUPPORT AS SMART MONEY CAPPING PRESSURES MOUNT! 📉
Entry: 0.036448–0.036532 ⚡
Target: 0.035888 🎯
Stop Loss: 0.036824 ⚠️
Price action on $STRK is showing clear distribution signs with buyers failing to defend the local pivot. Order flow reflects aggressive capping below 0.036930, leaving the bids vulnerable to a deeper liquidity sweep toward institutional targets. 📊
Momentum oscillators on the lower timeframes confirm fading buying pressure while supply blocks remain heavily defended. ⚡ This structural rejection highlights a clean distribution phase before the next leg lower. 🔍
Are you tracking this short setup or waiting for a retest of higher resistance? 🤔
⚠️ Not financial advice. Always manage your risk. 🛡️
🏷️ #STRK #ShortSetup #MarketStructure #OrderFlow
📉 🦈
Entry: 0.036448–0.036532 ⚡
Target: 0.035888 🎯
Stop Loss: 0.036824 ⚠️
Price action on $STRK is showing clear distribution signs with buyers failing to defend the local pivot. Order flow reflects aggressive capping below 0.036930, leaving the bids vulnerable to a deeper liquidity sweep toward institutional targets. 📊
Momentum oscillators on the lower timeframes confirm fading buying pressure while supply blocks remain heavily defended. ⚡ This structural rejection highlights a clean distribution phase before the next leg lower. 🔍
Are you tracking this short setup or waiting for a retest of higher resistance? 🤔
⚠️ Not financial advice. Always manage your risk. 🛡️
🏷️ #STRK #ShortSetup #MarketStructure #OrderFlow
📉 🦈
1
Log in to explore more content
Join global crypto users on Binance Square
⚡️ Get latest and useful information about crypto.
💬 Trusted by the world’s largest crypto exchange.
👍 Discover real insights from verified creators.
Email / Phone number
Trending Topics
1
#WhoWillSucceedJensenHuangatNvidia?
81,433 views
1,115 Discussing
2
#WhatWillDriveCryptoandStocks’NextRebound?
431,655 views
3,015 Discussing
3
#BitcoinActiveSupplyInProfitDropsBelow45%
21,738 views
336 Discussing
4
#KavaSaysAbnormalActivityLimitedToKavaLend
8,507 views
170 Discussing
5
#USSpotXRPETFsSeeLargestWeeklyOutflowIn8Months
7,720 views
161 Discussing
6
#USPPIMissMayEaseBTCPressure
206,752 views
2,048 Discussing
7
#WORPTLetsTouristsConvertCryptoToThaiBaht
2,550 views
50 Discussing
8
#TONStrategyReports$23.97MQ3NetLoss
3,193 views
41 Discussing
9
#PolkadotCommunityApprovesNewStrategyWith97%Vote
18,626 views
244 Discussing
10
#dYdXPlansV9.9UpgradeToShiftUSDCToInjective
11,380 views
197 Discussing