
#ray
ray
2.2M views
5,756 Discussing
Hot
Latest


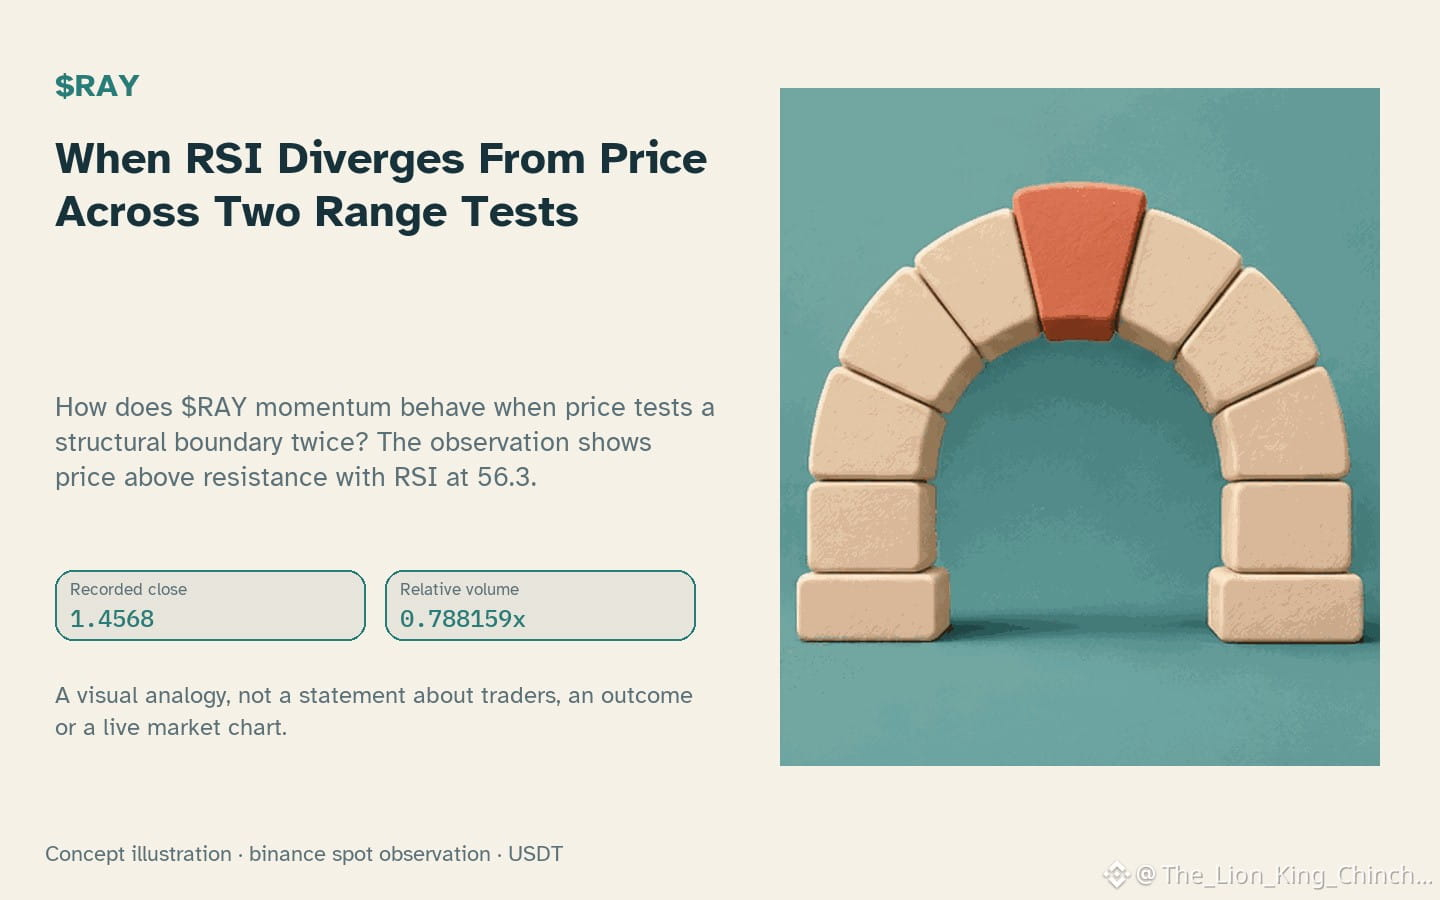
$RAY: When RSI Diverges From Price Across Two Range Tests
How does $RAY momentum behave when price tests a structural boundary twice? The observation shows price above resistance with RSI at 56.3.
Structure Check
A hypothetical mechanism suggests that if price makes a higher high at the same boundary, but RSI fails to make a higher high, this represents relative weakening pressure. This is not a confirmed signal. It is a conditional pattern. In this snapshot, relative volume is at 0.79x baseline, which is not above baseline. Low volume during a test often means the move lacks broad participation. If the next candle closes cleanly above resistance with sustained volume, the structure holds. If it retests and closes back below, the divergence becomes more significant.
Alternative Reading
Price staying above resistance could simply be noise. A single upper wick or gap might create a false break. The MACD histogram at 6.98705e-05 versus its signal line at -0.00218244 provides context but does not guarantee direction. If the next hourly change is 0.475895%, it confirms current momentum. However, if price reverses sharply, the initial divergence was not meaningful. This shows why we must wait for closed candles before claiming a break.
Limits and Self-Counterexample
This analysis relies solely on the stored observation at the current timestamp. It does not prove who bought or sold. It does not measure order flow or hidden liquidity. A counterexample occurs if price breaks out and immediately re-enters the range. In that case, the "divergence" was just a fakeout. To reassess, check if the next daily change exceeds -5.4026% in the same direction. If volume remains flat, the structural claim is weak. Do not interpret this as a prediction. Treat it as a hypothesis to be tested by future data.
Probabilistic market research, not a recommendation or guaranteed return.
#RAY #MarketAnalysis
$RAY : When RSI Diverges From Price Across Two Range Tests
How does $RAY momentum behave when price tests a structural boundary twice? The observation shows price above resistance with RSI at 56.3.
Structure Check
A hypothetical mechanism suggests that if price makes a higher high at the same boundary, but RSI fails to make a higher high, this represents relative weakening pressure. This is not a confirmed signal. It is a conditional pattern. In this snapshot, relative volume is at 0.79x baseline, which is not above baseline. Low volume during a test often means the move lacks broad participation. If the next candle closes cleanly above resistance with sustained volume, the structure holds. If it retests and closes back below, the divergence becomes more significant.
Alternative Reading
Price staying above resistance could simply be noise. A single upper wick or gap might create a false break. The MACD histogram at 6.98705e-05 versus its signal line at -0.00218244 provides context but does not guarantee direction. If the next hourly change is 0.475895%, it confirms current momentum. However, if price reverses sharply, the initial divergence was not meaningful. This shows why we must wait for closed candles before claiming a break.
Limits and Self-Counterexample
This analysis relies solely on the stored observation at the current timestamp. It does not prove who bought or sold. It does not measure order flow or hidden liquidity. A counterexample occurs if price breaks out and immediately re-enters the range. In that case, the "divergence" was just a fakeout. To reassess, check if the next daily change exceeds -5.4026% in the same direction. If volume remains flat, the structural claim is weak. Do not interpret this as a prediction. Treat it as a hypothesis to be tested by future data.
Probabilistic market research, not a recommendation or guaranteed return.
#RAY #MarketAnalysis
How does $RAY momentum behave when price tests a structural boundary twice? The observation shows price above resistance with RSI at 56.3.
Structure Check
A hypothetical mechanism suggests that if price makes a higher high at the same boundary, but RSI fails to make a higher high, this represents relative weakening pressure. This is not a confirmed signal. It is a conditional pattern. In this snapshot, relative volume is at 0.79x baseline, which is not above baseline. Low volume during a test often means the move lacks broad participation. If the next candle closes cleanly above resistance with sustained volume, the structure holds. If it retests and closes back below, the divergence becomes more significant.
Alternative Reading
Price staying above resistance could simply be noise. A single upper wick or gap might create a false break. The MACD histogram at 6.98705e-05 versus its signal line at -0.00218244 provides context but does not guarantee direction. If the next hourly change is 0.475895%, it confirms current momentum. However, if price reverses sharply, the initial divergence was not meaningful. This shows why we must wait for closed candles before claiming a break.
Limits and Self-Counterexample
This analysis relies solely on the stored observation at the current timestamp. It does not prove who bought or sold. It does not measure order flow or hidden liquidity. A counterexample occurs if price breaks out and immediately re-enters the range. In that case, the "divergence" was just a fakeout. To reassess, check if the next daily change exceeds -5.4026% in the same direction. If volume remains flat, the structural claim is weak. Do not interpret this as a prediction. Treat it as a hypothesis to be tested by future data.
Probabilistic market research, not a recommendation or guaranteed return.
#RAY #MarketAnalysis
36
$RAY: Does One Feed Represent All?
Does $RAY data from one venue answer trading questions? The choice frames uncertainty.
The Research Dilemma
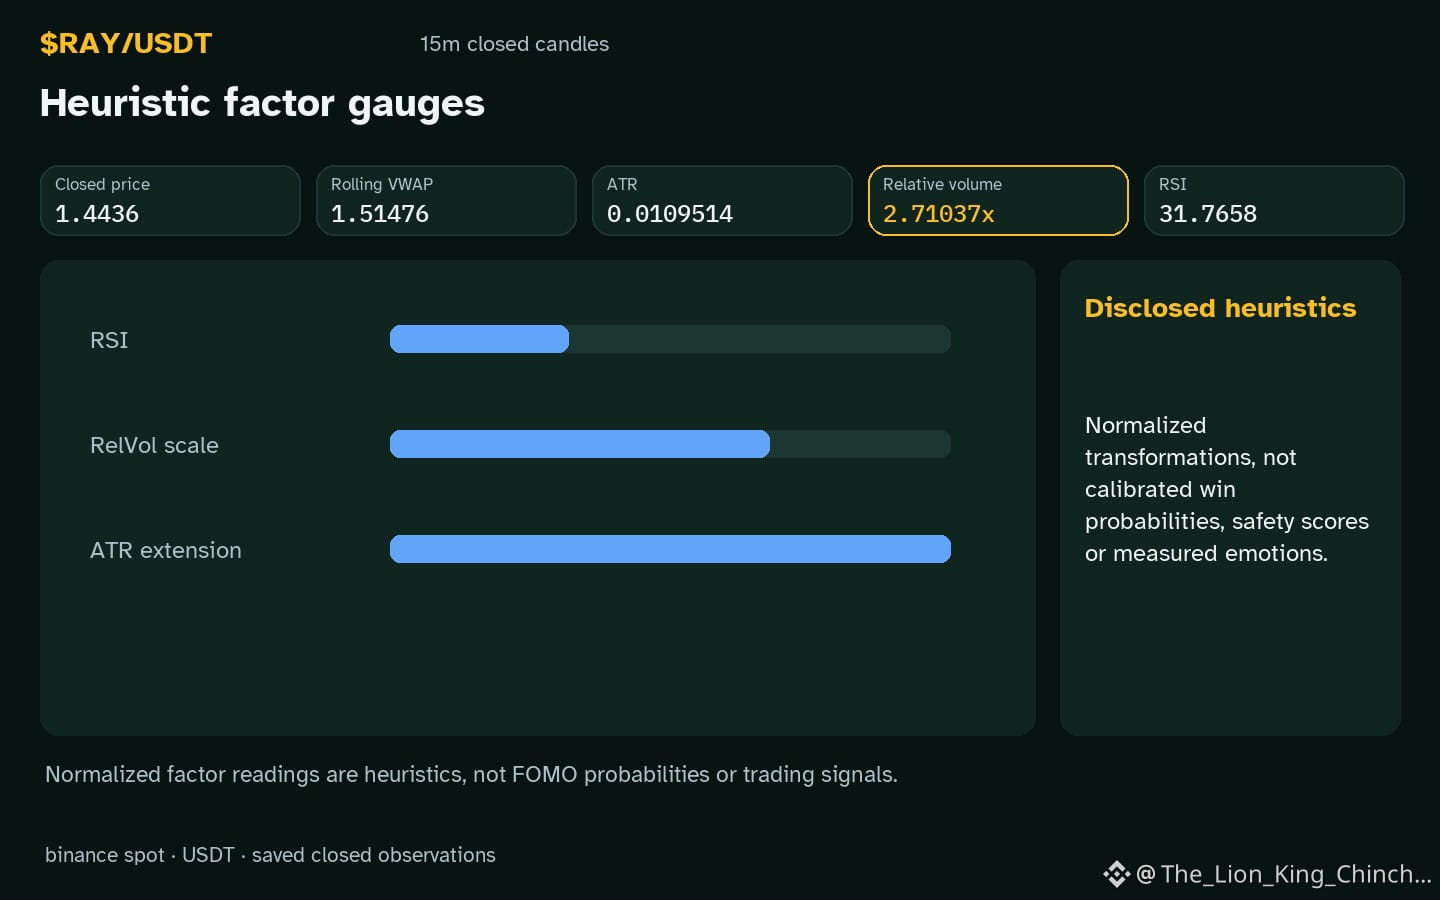
Public metrics often feel definitive. A reader sees relative volume 2.71x and RSI 31.8. These point to a specific state. They do not reveal global intent. One exchange is a single vantage point. Other venues hold different orders. Treating a single slice as truth creates false confidence.
The Trade-off
Imagine a rule. If hourly direction is down during active trading signals, the signal is deemed strong or weak. This depends on the feed. Higher confidence comes from one source. Clarity comes from admitting limits. Every extra source adds noise. Every single source risks ignorance. Selecting wide or narrow data shifts the conclusion on the same chart. The mechanism favors precision but hides bias. The bias is not honesty but scope. It matters for any asset, not just $RAY.
A Rule Worth Testing
Ask a self-check question. Would the conclusion survive if the data came from another desk? If no, name the limitation. A counterexample shows this clearly. If a desk shows buying while another rests, the truth sits between them. The check is simple. State the source. Then state the possible conflict. This keeps the analysis honest.
The mechanism survives by naming the container. The source defines the view. The view frames the limits. A broader lens lowers confidence but improves reliability. Better to be less sure and more accurate. Better to claim less and see more. Time is precious. Trust is harder to earn. Ask the question. Check the limits. Stay humble.
Probabilistic market research, not a recommendation or guaranteed return.
#RAY #CryptoCommunity #CryptoLearning
$RAY : Does One Feed Represent All?
Does $RAY data from one venue answer trading questions? The choice frames uncertainty.
The Research Dilemma
Public metrics often feel definitive. A reader sees relative volume 2.71x and RSI 31.8. These point to a specific state. They do not reveal global intent. One exchange is a single vantage point. Other venues hold different orders. Treating a single slice as truth creates false confidence.
The Trade-off
Imagine a rule. If hourly direction is down during active trading signals, the signal is deemed strong or weak. This depends on the feed. Higher confidence comes from one source. Clarity comes from admitting limits. Every extra source adds noise. Every single source risks ignorance. Selecting wide or narrow data shifts the conclusion on the same chart. The mechanism favors precision but hides bias. The bias is not honesty but scope. It matters for any asset, not just $RAY .
A Rule Worth Testing
Ask a self-check question. Would the conclusion survive if the data came from another desk? If no, name the limitation. A counterexample shows this clearly. If a desk shows buying while another rests, the truth sits between them. The check is simple. State the source. Then state the possible conflict. This keeps the analysis honest.
The mechanism survives by naming the container. The source defines the view. The view frames the limits. A broader lens lowers confidence but improves reliability. Better to be less sure and more accurate. Better to claim less and see more. Time is precious. Trust is harder to earn. Ask the question. Check the limits. Stay humble.
Probabilistic market research, not a recommendation or guaranteed return.
#RAY #CryptoCommunity #CryptoLearning
Does $RAY data from one venue answer trading questions? The choice frames uncertainty.
The Research Dilemma
Public metrics often feel definitive. A reader sees relative volume 2.71x and RSI 31.8. These point to a specific state. They do not reveal global intent. One exchange is a single vantage point. Other venues hold different orders. Treating a single slice as truth creates false confidence.
The Trade-off
Imagine a rule. If hourly direction is down during active trading signals, the signal is deemed strong or weak. This depends on the feed. Higher confidence comes from one source. Clarity comes from admitting limits. Every extra source adds noise. Every single source risks ignorance. Selecting wide or narrow data shifts the conclusion on the same chart. The mechanism favors precision but hides bias. The bias is not honesty but scope. It matters for any asset, not just $RAY .
A Rule Worth Testing
Ask a self-check question. Would the conclusion survive if the data came from another desk? If no, name the limitation. A counterexample shows this clearly. If a desk shows buying while another rests, the truth sits between them. The check is simple. State the source. Then state the possible conflict. This keeps the analysis honest.
The mechanism survives by naming the container. The source defines the view. The view frames the limits. A broader lens lowers confidence but improves reliability. Better to be less sure and more accurate. Better to claim less and see more. Time is precious. Trust is harder to earn. Ask the question. Check the limits. Stay humble.
Probabilistic market research, not a recommendation or guaranteed return.
#RAY #CryptoCommunity #CryptoLearning
31
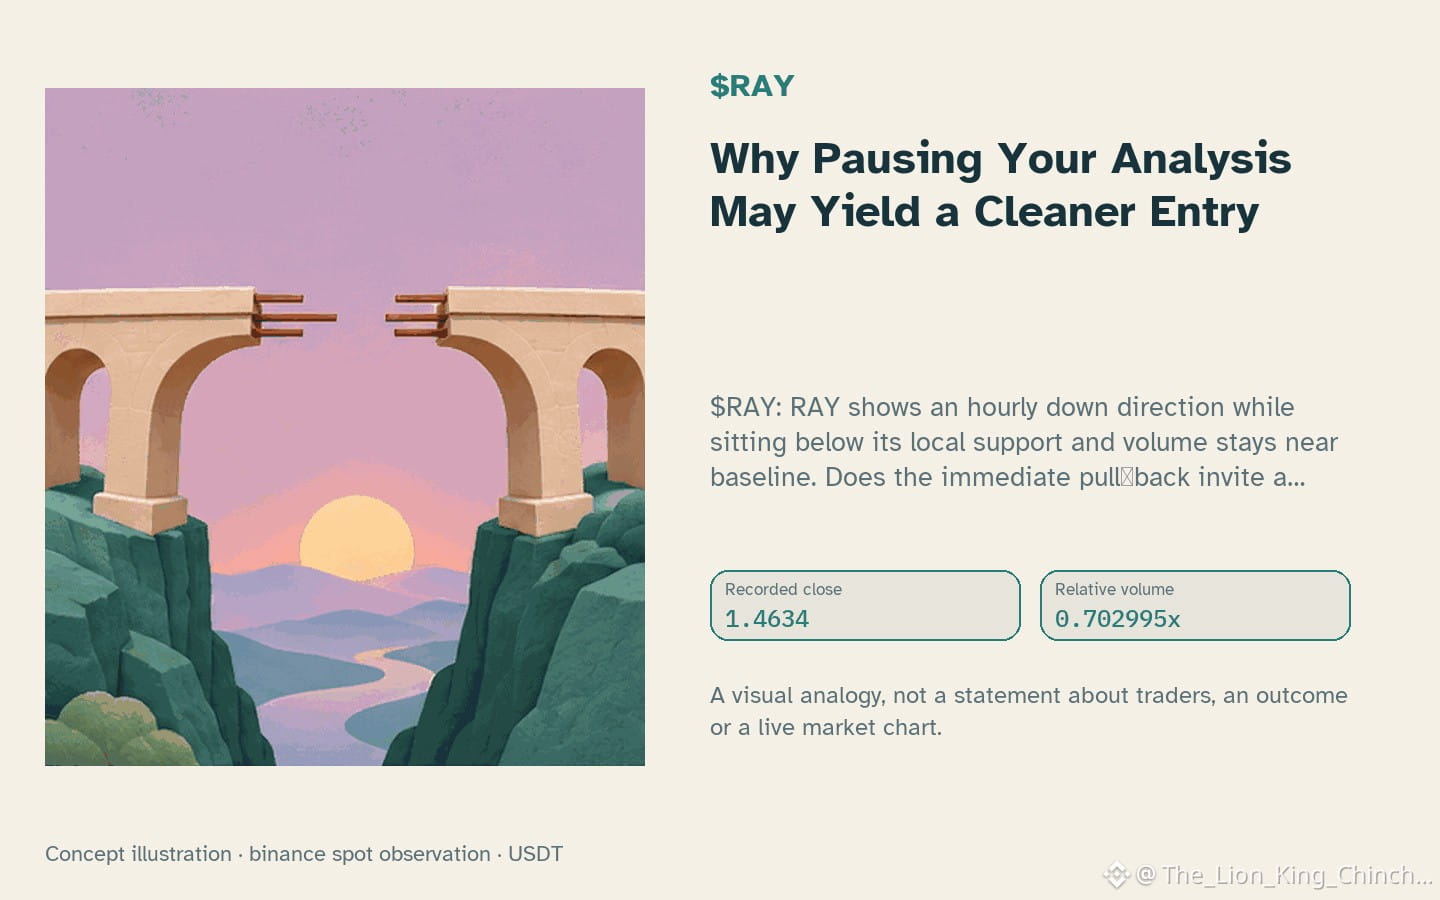
$RAY: Why Pausing Your Analysis May Yield a Cleaner Entry
$RAY: RAY shows an hourly down direction while sitting below its local support and volume stays near baseline. Does the immediate pull‑back invite a hurried entry, or would a brief pause clarify the trade‑off between entry quality and chasing a move?
The dilemma centers on timing. Imagine two hypothetical traders: one places a limit just above the recent low as soon as the down bar closes, hoping to catch a rebound. The other waits for the price to retest the support zone, confirming that the down pressure has eased before committing. Both face the same observation – the price is below support and volume offers no extra confirmation – yet their outcomes differ based on how they balance immediacy against confirmation.
A practical rule to test is to measure entry quality by the distance between the entry point and the nearest support level, while the cost of chasing is reflected in the extra risk taken if the price continues lower. If the trader enters early, the stop may need to be set wider, increasing potential loss. Waiting a few candles could tighten the stop but also risk missing the move entirely.
The hypothesis can be invalidated if a subsequent hourly candle closes above the support level with a clear reversal pattern, showing that the early entry would have been unnecessary. Conversely, if the price breaks further down and the support holds, the delayed entry gains merit. Monitoring the next closed hourly candle will therefore provide a concrete reassessment condition.
Probabilistic market research, not a recommendation or guaranteed return.
#RAY #RiskManagement #CryptoLearning
$RAY : Why Pausing Your Analysis May Yield a Cleaner Entry
$RAY : RAY shows an hourly down direction while sitting below its local support and volume stays near baseline. Does the immediate pull‑back invite a hurried entry, or would a brief pause clarify the trade‑off between entry quality and chasing a move?
The dilemma centers on timing. Imagine two hypothetical traders: one places a limit just above the recent low as soon as the down bar closes, hoping to catch a rebound. The other waits for the price to retest the support zone, confirming that the down pressure has eased before committing. Both face the same observation – the price is below support and volume offers no extra confirmation – yet their outcomes differ based on how they balance immediacy against confirmation.
A practical rule to test is to measure entry quality by the distance between the entry point and the nearest support level, while the cost of chasing is reflected in the extra risk taken if the price continues lower. If the trader enters early, the stop may need to be set wider, increasing potential loss. Waiting a few candles could tighten the stop but also risk missing the move entirely.
The hypothesis can be invalidated if a subsequent hourly candle closes above the support level with a clear reversal pattern, showing that the early entry would have been unnecessary. Conversely, if the price breaks further down and the support holds, the delayed entry gains merit. Monitoring the next closed hourly candle will therefore provide a concrete reassessment condition.
Probabilistic market research, not a recommendation or guaranteed return.
#RAY #RiskManagement #CryptoLearning
$RAY : RAY shows an hourly down direction while sitting below its local support and volume stays near baseline. Does the immediate pull‑back invite a hurried entry, or would a brief pause clarify the trade‑off between entry quality and chasing a move?
The dilemma centers on timing. Imagine two hypothetical traders: one places a limit just above the recent low as soon as the down bar closes, hoping to catch a rebound. The other waits for the price to retest the support zone, confirming that the down pressure has eased before committing. Both face the same observation – the price is below support and volume offers no extra confirmation – yet their outcomes differ based on how they balance immediacy against confirmation.
A practical rule to test is to measure entry quality by the distance between the entry point and the nearest support level, while the cost of chasing is reflected in the extra risk taken if the price continues lower. If the trader enters early, the stop may need to be set wider, increasing potential loss. Waiting a few candles could tighten the stop but also risk missing the move entirely.
The hypothesis can be invalidated if a subsequent hourly candle closes above the support level with a clear reversal pattern, showing that the early entry would have been unnecessary. Conversely, if the price breaks further down and the support holds, the delayed entry gains merit. Monitoring the next closed hourly candle will therefore provide a concrete reassessment condition.
Probabilistic market research, not a recommendation or guaranteed return.
#RAY #RiskManagement #CryptoLearning
64

·
--
Bullish
🟢 $RAY BUY 🟢
{future}(RAYSOLUSDT)
📍 ENTRY: 1.4854-1.5142
🎯 TARGETS:
💰 1.5193
💰 1.5393
💰 1.6030
🛑 STOP: 1.4776
🚀 KEY SUPPORT BOUNCE — RAY BULLS ARE LOOKING FOR A REVERSAL
$RAY is reacting from key support, putting the upside levels in focus. 👀
⚡ Support defense → bullish continuation on watch.
📈 Confirmation remains key.
#RAY #RAYUSDT #CryptoSignals #TradingSignals #FuturesSignals #LongSignal
🟢 $RAY BUY 🟢
📍 ENTRY: 1.4854-1.5142
🎯 TARGETS:
💰 1.5193
💰 1.5393
💰 1.6030
🛑 STOP: 1.4776
🚀 KEY SUPPORT BOUNCE — RAY BULLS ARE LOOKING FOR A REVERSAL
$RAY is reacting from key support, putting the upside levels in focus. 👀
⚡ Support defense → bullish continuation on watch.
📈 Confirmation remains key.
#RAY #RAYUSDT #CryptoSignals #TradingSignals #FuturesSignals #LongSignal
📍 ENTRY: 1.4854-1.5142
🎯 TARGETS:
💰 1.5193
💰 1.5393
💰 1.6030
🛑 STOP: 1.4776
🚀 KEY SUPPORT BOUNCE — RAY BULLS ARE LOOKING FOR A REVERSAL
$RAY is reacting from key support, putting the upside levels in focus. 👀
⚡ Support defense → bullish continuation on watch.
📈 Confirmation remains key.
#RAY #RAYUSDT #CryptoSignals #TradingSignals #FuturesSignals #LongSignal
159

·
--
RAY buy pressure is strengthening.
Buy Share
15m 85.7% | 1h 66.1%
4h 60.3% | 12h 49.0% | 1D 48.4%
15m Flow
Buy $78.49K | Sell $13.15K
Net +$65.34K | B/S 5.97
Cash Share 0.5%
Market
12h 48.8% | 1D 50.3%
Order Book: Ask-heavy (0.84)
Buy-side flow is strong, while order-book depth remains ask-heavy.
RADAVOX Market Intelligence
#RAY #Crypto
RAY buy pressure is strengthening.
Buy Share
15m 85.7% | 1h 66.1%
4h 60.3% | 12h 49.0% | 1D 48.4%
15m Flow
Buy $78.49K | Sell $13.15K
Net +$65.34K | B/S 5.97
Cash Share 0.5%
Market
12h 48.8% | 1D 50.3%
Order Book: Ask-heavy (0.84)
Buy-side flow is strong, while order-book depth remains ask-heavy.
RADAVOX Market Intelligence
#RAY #Crypto
Buy Share
15m 85.7% | 1h 66.1%
4h 60.3% | 12h 49.0% | 1D 48.4%
15m Flow
Buy $78.49K | Sell $13.15K
Net +$65.34K | B/S 5.97
Cash Share 0.5%
Market
12h 48.8% | 1D 50.3%
Order Book: Ask-heavy (0.84)
Buy-side flow is strong, while order-book depth remains ask-heavy.
RADAVOX Market Intelligence
#RAY #Crypto
4

·
--
$RAY or $JUP for the next leg? Only one.
RAY is $1.66 after getting hit 7.47% today, with the 4h window down 7.8%. Ugly chart. 📉
Price sits below the 20d and 50d MAs, RSI is 41, and volume is just $2.22M, only 0.6x its 20d average. This is not a tape I want to chase, especially while $ETH sets the mood.
At $1.66, I want a reclaim. Lose it and I’m staying out. Funding is flat at 0.000%. ⚡
Pick your side. 👀
#RAY #Crypto #Binance
$RAY or $JUP for the next leg? Only one.
RAY is $1.66 after getting hit 7.47% today, with the 4h window down 7.8%. Ugly chart. 📉
Price sits below the 20d and 50d MAs, RSI is 41, and volume is just $2.22M, only 0.6x its 20d average. This is not a tape I want to chase, especially while $ETH sets the mood.
At $1.66, I want a reclaim. Lose it and I’m staying out. Funding is flat at 0.000%. ⚡
Pick your side. 👀
#RAY #Crypto #Binance
RAY is $1.66 after getting hit 7.47% today, with the 4h window down 7.8%. Ugly chart. 📉
Price sits below the 20d and 50d MAs, RSI is 41, and volume is just $2.22M, only 0.6x its 20d average. This is not a tape I want to chase, especially while $ETH sets the mood.
At $1.66, I want a reclaim. Lose it and I’m staying out. Funding is flat at 0.000%. ⚡
Pick your side. 👀
#RAY #Crypto #Binance
9
·
--
Bullish
🟢 $RAY BUY 🟢
{future}(RAYSOLUSDT)
📍 ENTRY: 1.6518-1.6911
🎯 TARGETS:
💰 1.7134
💰 1.7279
💰 1.8701
🛑 STOP: 1.6358
🚀 KEY SUPPORT BOUNCE — RAY BULLS ARE LOOKING FOR A REVERSAL
$RAY is reacting from key support, putting the upside levels in focus. 👀
⚡ Support defense → bullish continuation on watch.
📈 Confirmation remains key.
#RAY #RAYUSDT #CryptoSignals #TradingSignals #FuturesSignals #LongSignal
🟢 $RAY BUY 🟢
📍 ENTRY: 1.6518-1.6911
🎯 TARGETS:
💰 1.7134
💰 1.7279
💰 1.8701
🛑 STOP: 1.6358
🚀 KEY SUPPORT BOUNCE — RAY BULLS ARE LOOKING FOR A REVERSAL
$RAY is reacting from key support, putting the upside levels in focus. 👀
⚡ Support defense → bullish continuation on watch.
📈 Confirmation remains key.
#RAY #RAYUSDT #CryptoSignals #TradingSignals #FuturesSignals #LongSignal
📍 ENTRY: 1.6518-1.6911
🎯 TARGETS:
💰 1.7134
💰 1.7279
💰 1.8701
🛑 STOP: 1.6358
🚀 KEY SUPPORT BOUNCE — RAY BULLS ARE LOOKING FOR A REVERSAL
$RAY is reacting from key support, putting the upside levels in focus. 👀
⚡ Support defense → bullish continuation on watch.
📈 Confirmation remains key.
#RAY #RAYUSDT #CryptoSignals #TradingSignals #FuturesSignals #LongSignal
231
$RAY: Is a pullback with lighter volume always a constructive sign?
Many assume a drop in volume during a pullback automatically signals buyers are taking a break. This view often leads to wishful thinking.
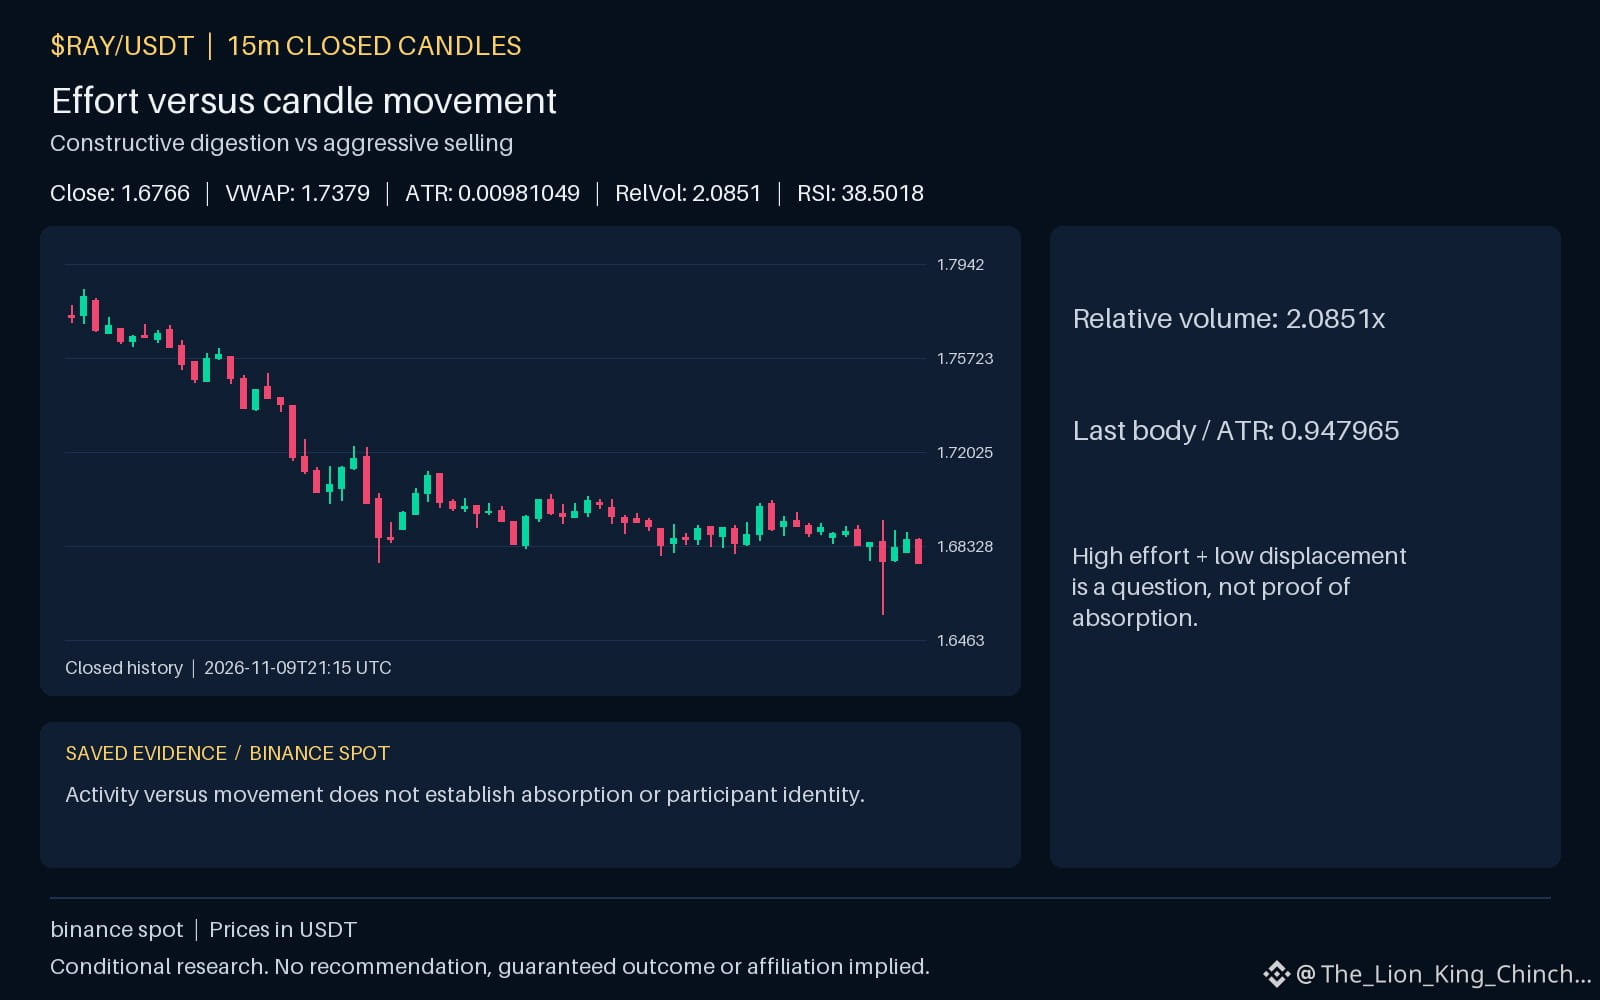
Hypothetically, constructive digestion might involve a pullback accompanied by a relative volume 2.0851 metric, compared to the 2.17618e+06. If the RSI is 38.5018 near the 1.68711 and 1.69904 bands, it suggests energy might be shifting. However, a lower volume reading could equally mean sellers are slowly entering without committing large size. Since the price -0.557533 is below the 1.69904 and trading near 1.6766, the initial cause of the move remains ambiguous.
Unverified claims about absorption or hidden order flow cause confusion. We lack funding data to confirm hedging activity. Let us test the mechanism with an alternative view. Suppose the pullback represented sellers quietly widening a position. In that scenario, an eventual breakout downward could happen just as easily as an upward reversion. A lower RSI value simply means fewer recent gains, not necessarily stronger support. The relative volume ratio does not prove underlying intent, nor does it measure the depth of bids. Therefore, using volume to definitively categorize an active market move as constructive digestion is a speculative leap. A self-check should ask if we would change our strategy if the volume metric rose during a pullback that closed at the same level. Any conclusion relies on the assumption that the observation applies to this specific context, which lacks direct proof. Do not mix hypothetical patterns with immediate trading intuition. A safer approach is to observe a broader consolidation phase before treating low volume as a distinct directional signal.
Probabilistic market research, not a recommendation or guaranteed return.
When price pulls back after a rally, do you remember to check whether volume is expanding or drying up?
#RAY #CryptoLearning
$RAY : Is a pullback with lighter volume always a constructive sign?
Many assume a drop in volume during a pullback automatically signals buyers are taking a break. This view often leads to wishful thinking.
Hypothetically, constructive digestion might involve a pullback accompanied by a relative volume 2.0851 metric, compared to the 2.17618e+06. If the RSI is 38.5018 near the 1.68711 and 1.69904 bands, it suggests energy might be shifting. However, a lower volume reading could equally mean sellers are slowly entering without committing large size. Since the price -0.557533 is below the 1.69904 and trading near 1.6766, the initial cause of the move remains ambiguous.
Unverified claims about absorption or hidden order flow cause confusion. We lack funding data to confirm hedging activity. Let us test the mechanism with an alternative view. Suppose the pullback represented sellers quietly widening a position. In that scenario, an eventual breakout downward could happen just as easily as an upward reversion. A lower RSI value simply means fewer recent gains, not necessarily stronger support. The relative volume ratio does not prove underlying intent, nor does it measure the depth of bids. Therefore, using volume to definitively categorize an active market move as constructive digestion is a speculative leap. A self-check should ask if we would change our strategy if the volume metric rose during a pullback that closed at the same level. Any conclusion relies on the assumption that the observation applies to this specific context, which lacks direct proof. Do not mix hypothetical patterns with immediate trading intuition. A safer approach is to observe a broader consolidation phase before treating low volume as a distinct directional signal.
Probabilistic market research, not a recommendation or guaranteed return.
When price pulls back after a rally, do you remember to check whether volume is expanding or drying up?
#RAY #CryptoLearning
Many assume a drop in volume during a pullback automatically signals buyers are taking a break. This view often leads to wishful thinking.
Hypothetically, constructive digestion might involve a pullback accompanied by a relative volume 2.0851 metric, compared to the 2.17618e+06. If the RSI is 38.5018 near the 1.68711 and 1.69904 bands, it suggests energy might be shifting. However, a lower volume reading could equally mean sellers are slowly entering without committing large size. Since the price -0.557533 is below the 1.69904 and trading near 1.6766, the initial cause of the move remains ambiguous.
Unverified claims about absorption or hidden order flow cause confusion. We lack funding data to confirm hedging activity. Let us test the mechanism with an alternative view. Suppose the pullback represented sellers quietly widening a position. In that scenario, an eventual breakout downward could happen just as easily as an upward reversion. A lower RSI value simply means fewer recent gains, not necessarily stronger support. The relative volume ratio does not prove underlying intent, nor does it measure the depth of bids. Therefore, using volume to definitively categorize an active market move as constructive digestion is a speculative leap. A self-check should ask if we would change our strategy if the volume metric rose during a pullback that closed at the same level. Any conclusion relies on the assumption that the observation applies to this specific context, which lacks direct proof. Do not mix hypothetical patterns with immediate trading intuition. A safer approach is to observe a broader consolidation phase before treating low volume as a distinct directional signal.
Probabilistic market research, not a recommendation or guaranteed return.
When price pulls back after a rally, do you remember to check whether volume is expanding or drying up?
#RAY #CryptoLearning
21

I'm stuck in these 3 coins $HUMA $RAY and $BEAMX in #RAY . I've already accepted part of the loss. Now I'll wait for the others to go up a little before accepting the loss, or if they fall further, end up with nothing.
I've already realized that whales can't live without their favorite food.
Now I'll wait for #NVDA to fall further and try to recover the loss, or end up with nothing!
Those who are afraid of losing shouldn't get into the game.
Whatever God wills.
I'm stuck in these 3 coins $HUMA $RAY and $BEAMX in #RAY . I've already accepted part of the loss. Now I'll wait for the others to go up a little before accepting the loss, or if they fall further, end up with nothing.
I've already realized that whales can't live without their favorite food.
Now I'll wait for #NVDA to fall further and try to recover the loss, or end up with nothing!
Those who are afraid of losing shouldn't get into the game.
Whatever God wills.
I've already realized that whales can't live without their favorite food.
Now I'll wait for #NVDA to fall further and try to recover the loss, or end up with nothing!
Those who are afraid of losing shouldn't get into the game.
Whatever God wills.
1
1.1k

·
--
🚀 $RAY SHATTERING MARKET WEAKNESS WITH RELATIVE STRENGTH AND RELENTLESS BOUNCES! 💥
Entry: 1.60 ⚡
Target: 1.80 🚀
While the broader market gasps for air during flash crashes, $RAY refuses to stay down. 📊 This outperformer continues to absorb supply effortlessly, defending the 1.60 demand shelf like clockwork before sprinting back toward resistance. ⚡
Pairing execution precision with disciplined asset selection is how you separate signal from noise in these choppy waters alongside names like $PEPE . 💡 Are you rotating capital into proven market leaders or getting trapped chasing lagging bags? 👇
⚠️ Not financial advice. Always manage your risk. 🛡️
🏷️ #RAY #AltcoinSeason #Trading #Crypto #PEPE
🔥 💎
🚀 $RAY SHATTERING MARKET WEAKNESS WITH RELATIVE STRENGTH AND RELENTLESS BOUNCES! 💥
Entry: 1.60 ⚡
Target: 1.80 🚀
While the broader market gasps for air during flash crashes, $RAY refuses to stay down. 📊 This outperformer continues to absorb supply effortlessly, defending the 1.60 demand shelf like clockwork before sprinting back toward resistance. ⚡
Pairing execution precision with disciplined asset selection is how you separate signal from noise in these choppy waters alongside names like $PEPE . 💡 Are you rotating capital into proven market leaders or getting trapped chasing lagging bags? 👇
⚠️ Not financial advice. Always manage your risk. 🛡️
🏷️ #RAY #AltcoinSeason #Trading #Crypto #PEPE
🔥 💎
Entry: 1.60 ⚡
Target: 1.80 🚀
While the broader market gasps for air during flash crashes, $RAY refuses to stay down. 📊 This outperformer continues to absorb supply effortlessly, defending the 1.60 demand shelf like clockwork before sprinting back toward resistance. ⚡
Pairing execution precision with disciplined asset selection is how you separate signal from noise in these choppy waters alongside names like $PEPE . 💡 Are you rotating capital into proven market leaders or getting trapped chasing lagging bags? 👇
⚠️ Not financial advice. Always manage your risk. 🛡️
🏷️ #RAY #AltcoinSeason #Trading #Crypto #PEPE
🔥 💎
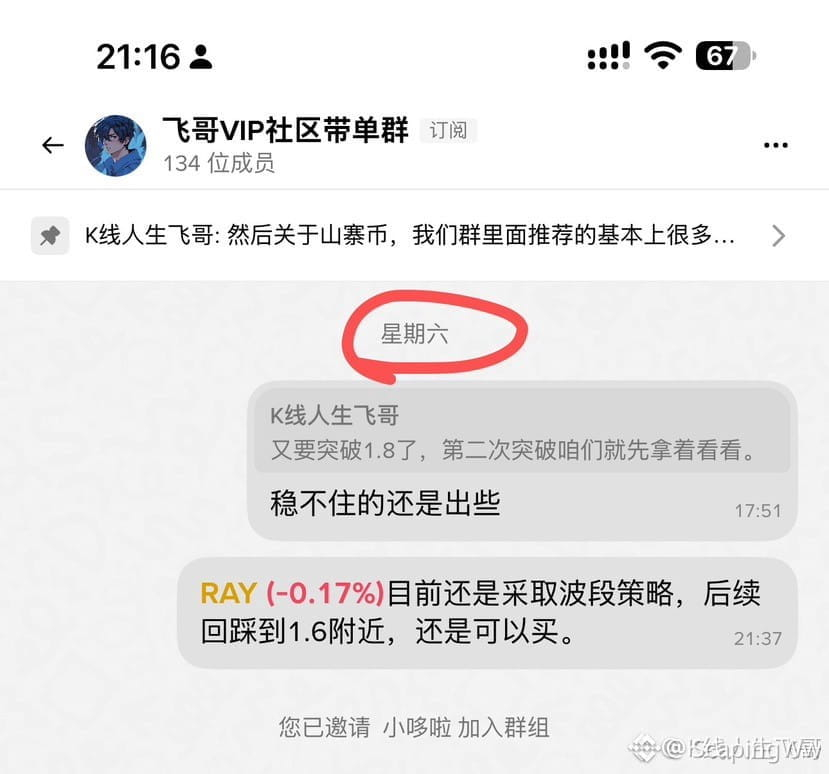
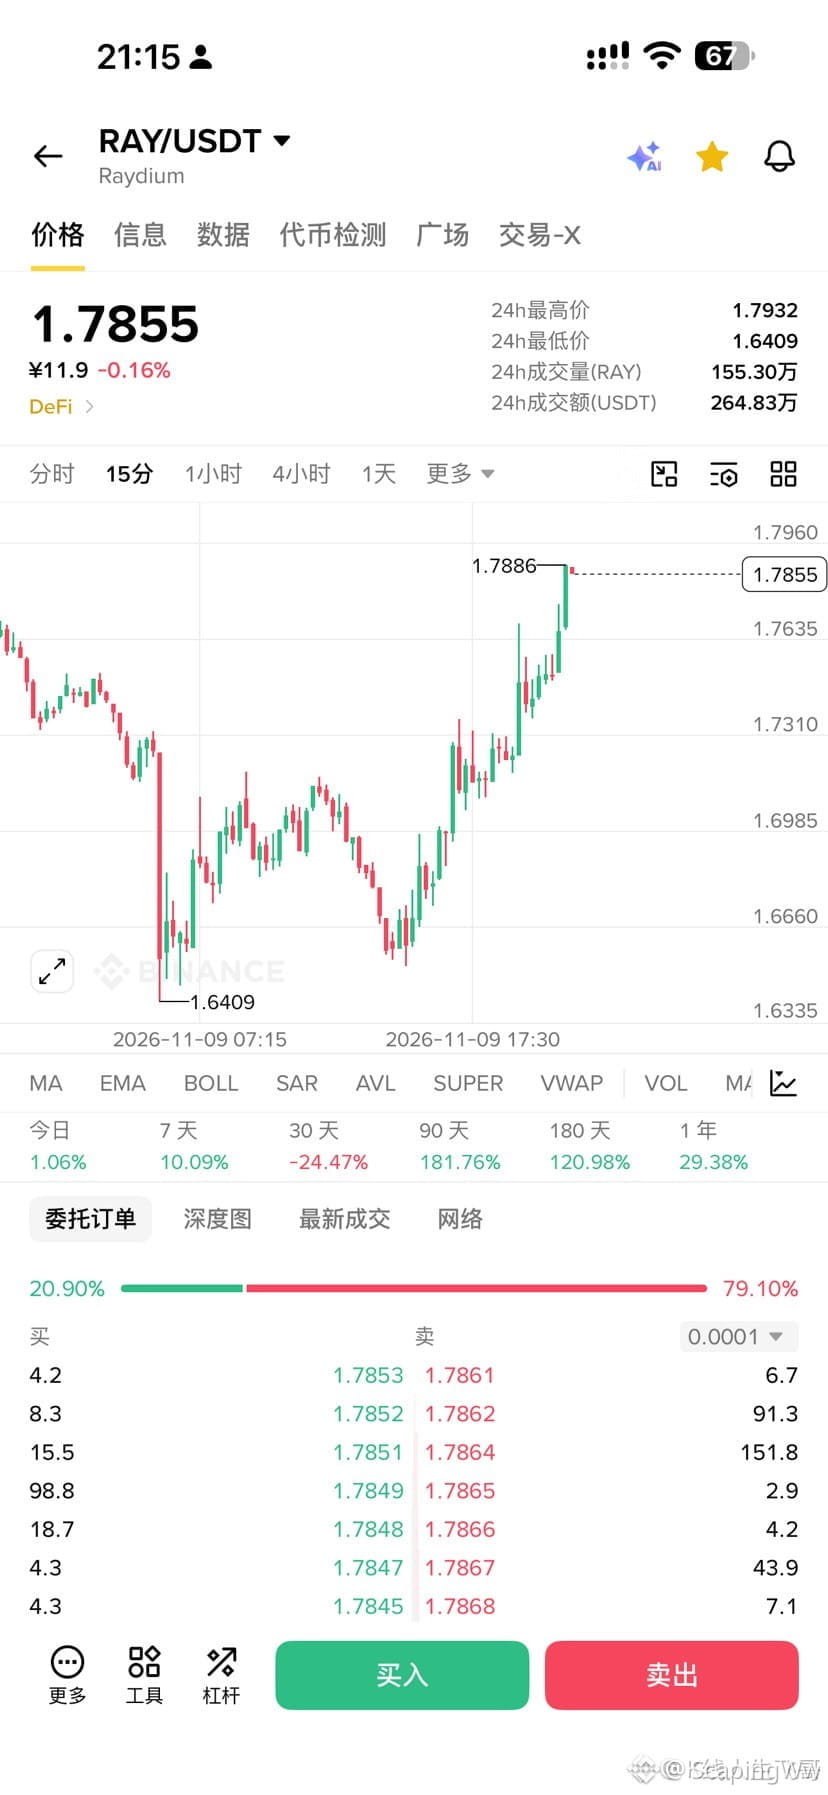

15

🦈 $RAY SHOWS RELATIVE STATURE AS SMART MONEY DEFENDS THE 1.6 DEMAND BLOCK 📊
Entry: 1.60 ⚡
Target: 1.80 🚀
Price action on $RAY continues to display aggressive institutional accumulation while broader altcoin structures flounder. Each test of the 1.6 pivot triggers swift bid absorption, confirming sustained smart money backing.
Sustained momentum reclaimed the 1.8 liquidity shelf with clean execution, demonstrating structural resilience that mirrors selective market leaders like $PEPE .
💡 Are you treating these range bounds as accumulation zones or waiting for a structural breakout confirmation? 👇
⚠️ Not financial advice. Always manage your risk. 🛡️
🏷️ #RAY #SmartMoney #MarketStructure #Crypto
🦈 ⚖️
🦈 $RAY SHOWS RELATIVE STATURE AS SMART MONEY DEFENDS THE 1.6 DEMAND BLOCK 📊
Entry: 1.60 ⚡
Target: 1.80 🚀
Price action on $RAY continues to display aggressive institutional accumulation while broader altcoin structures flounder. Each test of the 1.6 pivot triggers swift bid absorption, confirming sustained smart money backing.
Sustained momentum reclaimed the 1.8 liquidity shelf with clean execution, demonstrating structural resilience that mirrors selective market leaders like $PEPE .
💡 Are you treating these range bounds as accumulation zones or waiting for a structural breakout confirmation? 👇
⚠️ Not financial advice. Always manage your risk. 🛡️
🏷️ #RAY #SmartMoney #MarketStructure #Crypto
🦈 ⚖️
Entry: 1.60 ⚡
Target: 1.80 🚀
Price action on $RAY continues to display aggressive institutional accumulation while broader altcoin structures flounder. Each test of the 1.6 pivot triggers swift bid absorption, confirming sustained smart money backing.
Sustained momentum reclaimed the 1.8 liquidity shelf with clean execution, demonstrating structural resilience that mirrors selective market leaders like $PEPE .
💡 Are you treating these range bounds as accumulation zones or waiting for a structural breakout confirmation? 👇
⚠️ Not financial advice. Always manage your risk. 🛡️
🏷️ #RAY #SmartMoney #MarketStructure #Crypto
🦈 ⚖️
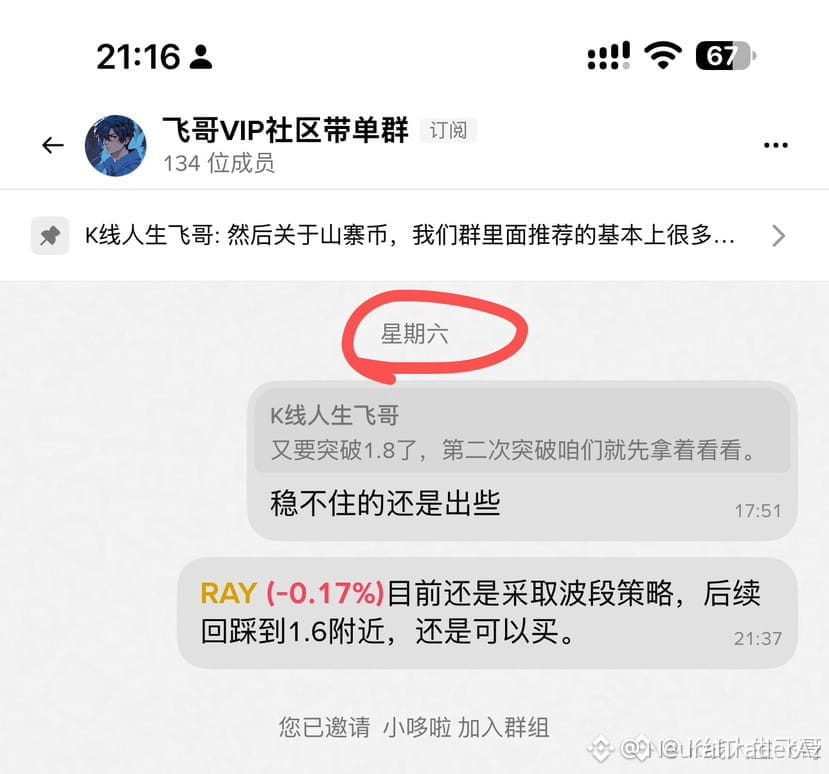
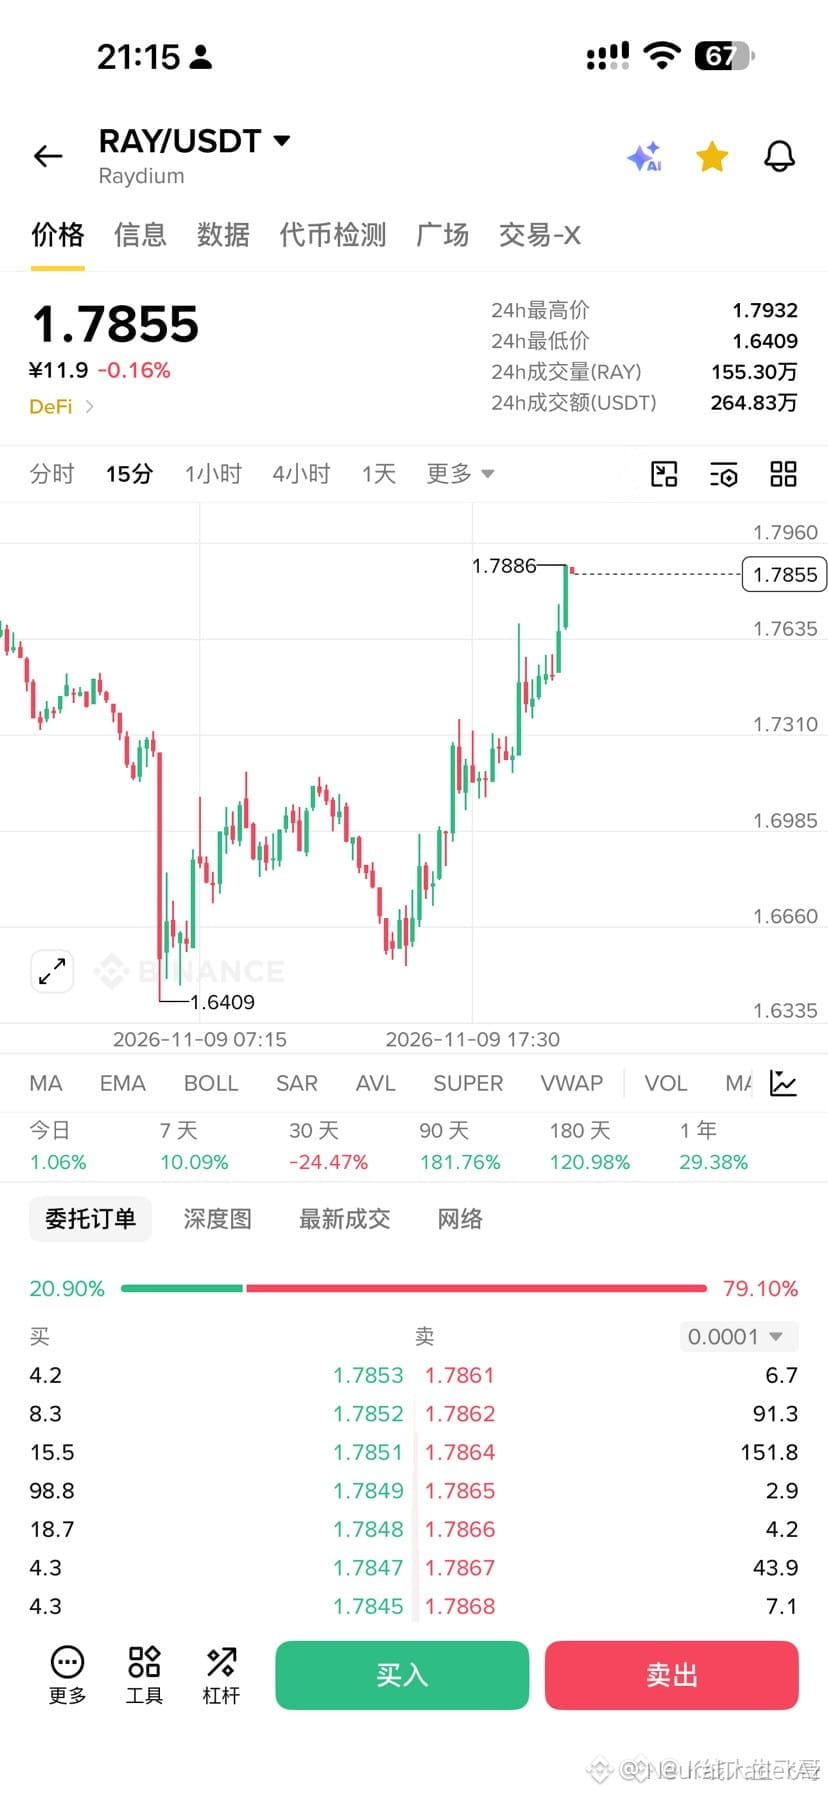

8
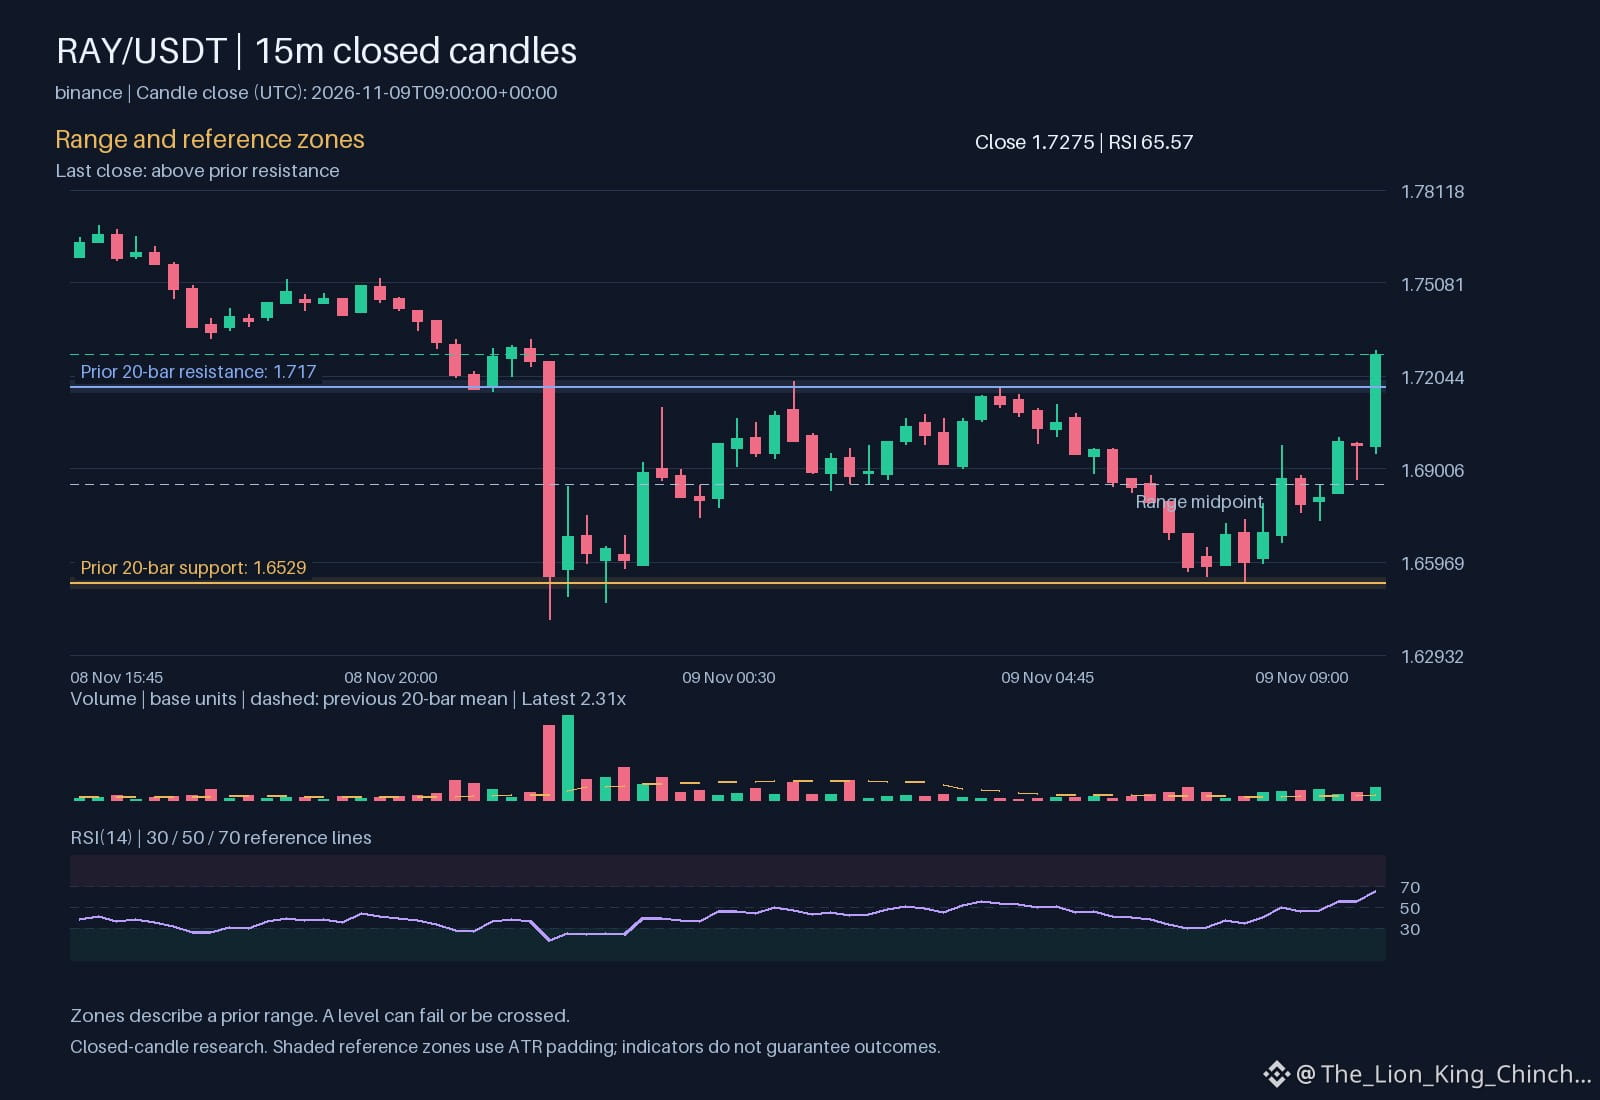
$RAY: How Anchoring Skews Our Reading of Price
Anchoring bias makes us cling to a familiar price level when new data arrives. In the market for $RAY, observation shows price trading above resistance while hourly direction is up and volume is above baseline. This combination can create a strong visual cue, yet it does not prove a permanent shift. Instead of treating the level as a fixed truth, consider it a temporary reference point that may become irrelevant if momentum weakens.
### How it changes interpretation
When a trader sees price break a key level, they often stop questioning the original thesis. The relative volume at 2.31357 signals activity, but silence on sustained confirmation remains possible. If you anchor to the break, you might ignore the current RSI reading of 65.5745 or the gap between price and the 1.68893. This tunnel vision risks mistaking a short term burst for a structural change. The decision quality drops because the fresh evidence gets filtered through an old mental model.
### A practical self-check
Before finalizing a view, ask yourself if you would still weight the same factors if the price opened differently. If the answer changes once you remove the previous level from sight, anchoring is active. Reassess the situation by comparing current momentum against past averages without naming specific numbers. This resets your frame and helps separate fact from expectation.
Probabilistic market research, not a recommendation or guaranteed return.
Would you keep the same rule after missing a move?
#RAY #TradingPsychology #CryptoLearning
$RAY : How Anchoring Skews Our Reading of Price
Anchoring bias makes us cling to a familiar price level when new data arrives. In the market for $RAY , observation shows price trading above resistance while hourly direction is up and volume is above baseline. This combination can create a strong visual cue, yet it does not prove a permanent shift. Instead of treating the level as a fixed truth, consider it a temporary reference point that may become irrelevant if momentum weakens.
### How it changes interpretation
When a trader sees price break a key level, they often stop questioning the original thesis. The relative volume at 2.31357 signals activity, but silence on sustained confirmation remains possible. If you anchor to the break, you might ignore the current RSI reading of 65.5745 or the gap between price and the 1.68893. This tunnel vision risks mistaking a short term burst for a structural change. The decision quality drops because the fresh evidence gets filtered through an old mental model.
### A practical self-check
Before finalizing a view, ask yourself if you would still weight the same factors if the price opened differently. If the answer changes once you remove the previous level from sight, anchoring is active. Reassess the situation by comparing current momentum against past averages without naming specific numbers. This resets your frame and helps separate fact from expectation.
Probabilistic market research, not a recommendation or guaranteed return.
Would you keep the same rule after missing a move?
#RAY #TradingPsychology #CryptoLearning
Anchoring bias makes us cling to a familiar price level when new data arrives. In the market for $RAY , observation shows price trading above resistance while hourly direction is up and volume is above baseline. This combination can create a strong visual cue, yet it does not prove a permanent shift. Instead of treating the level as a fixed truth, consider it a temporary reference point that may become irrelevant if momentum weakens.
### How it changes interpretation
When a trader sees price break a key level, they often stop questioning the original thesis. The relative volume at 2.31357 signals activity, but silence on sustained confirmation remains possible. If you anchor to the break, you might ignore the current RSI reading of 65.5745 or the gap between price and the 1.68893. This tunnel vision risks mistaking a short term burst for a structural change. The decision quality drops because the fresh evidence gets filtered through an old mental model.
### A practical self-check
Before finalizing a view, ask yourself if you would still weight the same factors if the price opened differently. If the answer changes once you remove the previous level from sight, anchoring is active. Reassess the situation by comparing current momentum against past averages without naming specific numbers. This resets your frame and helps separate fact from expectation.
Probabilistic market research, not a recommendation or guaranteed return.
Would you keep the same rule after missing a move?
#RAY #TradingPsychology #CryptoLearning
29

🦈 $RAY AND $PEPE SHOWING RELATIVE STRENGTH AS THE MARKET PURGES DEAD WEIGHT! ⚡
Entry: 1.6 ⚡
Target: 1.8 🚀
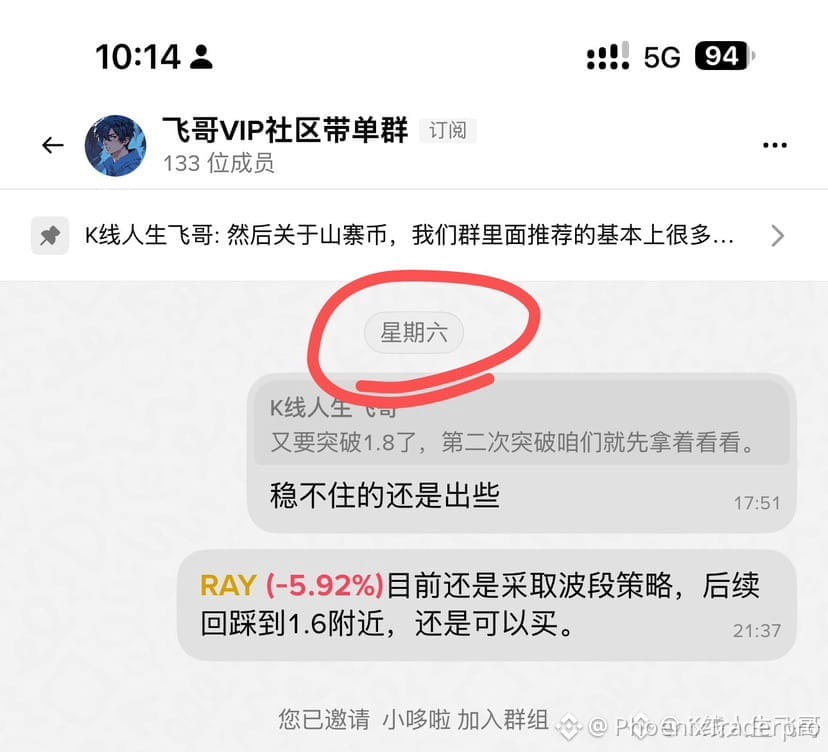
The market is ruthless right now, but elite altcoins like $PEPE , $UNI , and $RAY refuse to break. While dead weight bleeds out into oblivion, smart money is rotating heavily into strong-handed plays with real momentum and solid liquidity profiles. 🌊
Stop holding onto bags of digital dust hoping for a miraculous resurrection. Treat every relief bounce as an exit liquidity event to purge the garbage from your portfolio. 💡
💬 Are you still clinging to laggards or aggressively rotating into proven trendsetters? 👇
⚠️ Not financial advice. Always manage your risk. 🛡️
🏷️ #RAY #PEPE #UNI #Altcoins #Crypto
🔥 💎
🦈 $RAY AND $PEPE SHOWING RELATIVE STRENGTH AS THE MARKET PURGES DEAD WEIGHT! ⚡
Entry: 1.6 ⚡
Target: 1.8 🚀
The market is ruthless right now, but elite altcoins like $PEPE , $UNI , and $RAY refuse to break. While dead weight bleeds out into oblivion, smart money is rotating heavily into strong-handed plays with real momentum and solid liquidity profiles. 🌊
Stop holding onto bags of digital dust hoping for a miraculous resurrection. Treat every relief bounce as an exit liquidity event to purge the garbage from your portfolio. 💡
💬 Are you still clinging to laggards or aggressively rotating into proven trendsetters? 👇
⚠️ Not financial advice. Always manage your risk. 🛡️
🏷️ #RAY #PEPE #UNI #Altcoins #Crypto
🔥 💎
Entry: 1.6 ⚡
Target: 1.8 🚀
The market is ruthless right now, but elite altcoins like $PEPE , $UNI , and $RAY refuse to break. While dead weight bleeds out into oblivion, smart money is rotating heavily into strong-handed plays with real momentum and solid liquidity profiles. 🌊
Stop holding onto bags of digital dust hoping for a miraculous resurrection. Treat every relief bounce as an exit liquidity event to purge the garbage from your portfolio. 💡
💬 Are you still clinging to laggards or aggressively rotating into proven trendsetters? 👇
⚠️ Not financial advice. Always manage your risk. 🛡️
🏷️ #RAY #PEPE #UNI #Altcoins #Crypto
🔥 💎
7

·
--
🦈 $RAY $PEPE $UNI INSTITUTIONAL ACCUMULATION REVEALS DIVERGENCE AS WEAK LIQUIDITY IS PURGED ⚡
Entry: 1.60 ⚡
Target: 1.80 🚀
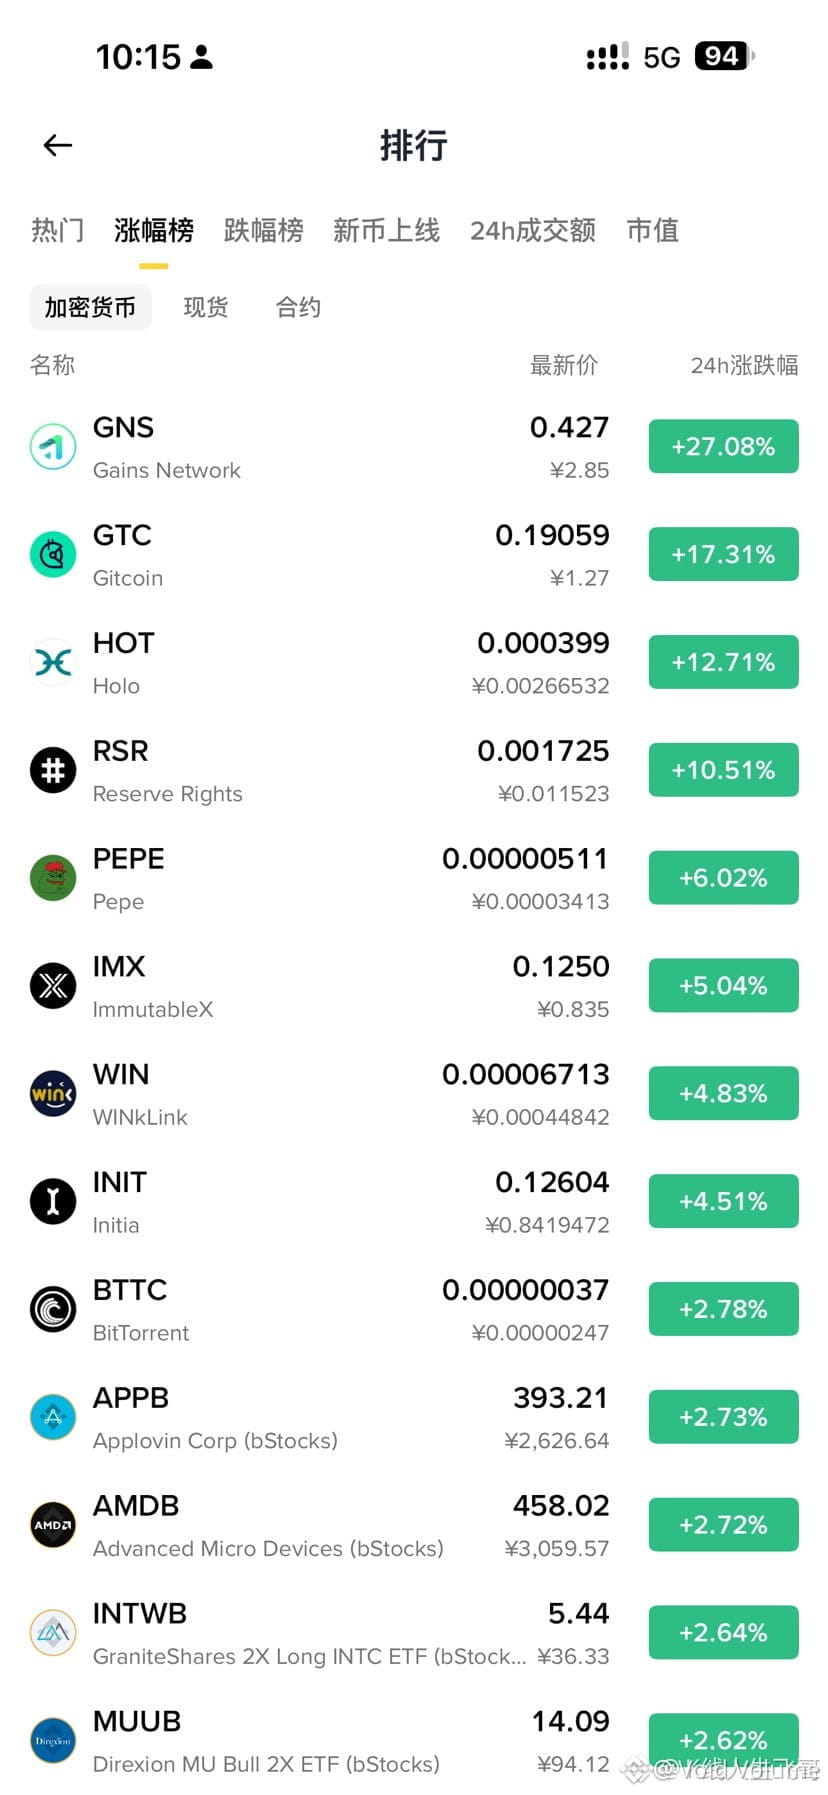
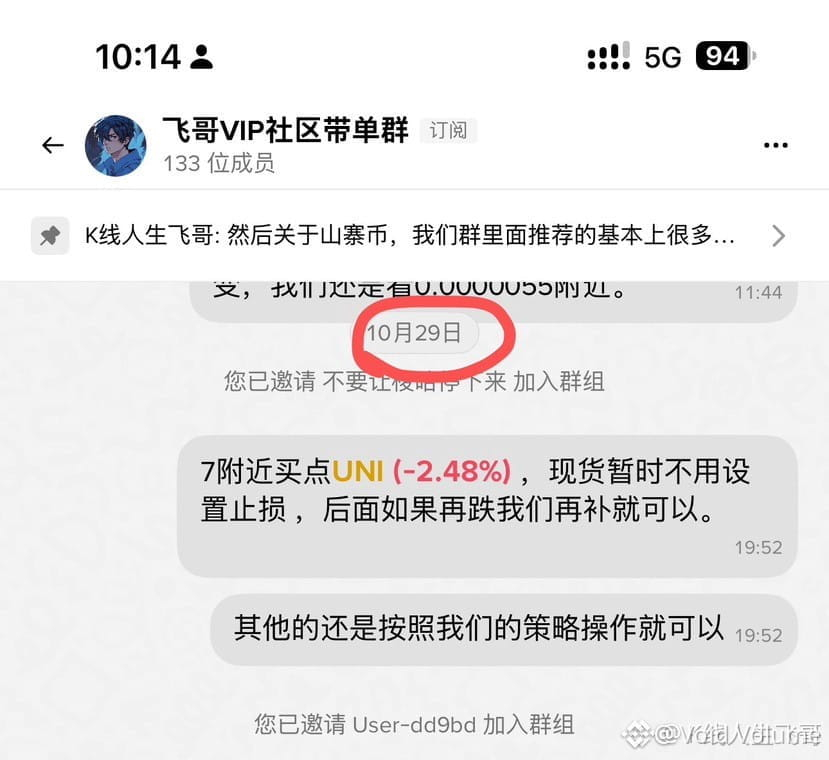
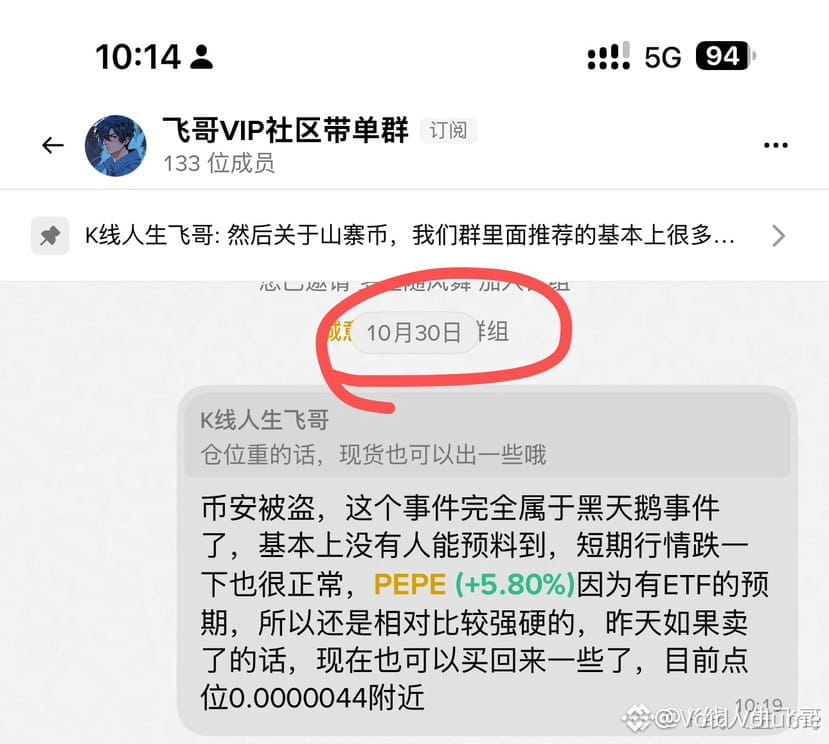
Smart money footprints reveal intense polarization as capital flees decaying retail structures and concentrates inside high-conviction demand blocks. While $PEPE and $UNI defend their respective retest zones, swing execution on $RAY demonstrates how disciplined range mechanics outperform passive holding. 📊
Dead tokens trapped in historical distribution zones will continue bleeding toward zero during every expansion phase. Cleaning up your portfolio is essential when structural regime shifts occur. 💡
Are you rotating your capital into high-conviction institutional setups or still holding legacy bags hoping for a miracle? 🤔
⚠️ Not financial advice. Always manage your risk. 🛡️
🏷️ #RAY #SmartMoney #MarketStructure #Crypto #Altcoins
🔥 🦈
🦈 $RAY $PEPE $UNI INSTITUTIONAL ACCUMULATION REVEALS DIVERGENCE AS WEAK LIQUIDITY IS PURGED ⚡
Entry: 1.60 ⚡
Target: 1.80 🚀
Smart money footprints reveal intense polarization as capital flees decaying retail structures and concentrates inside high-conviction demand blocks. While $PEPE and $UNI defend their respective retest zones, swing execution on $RAY demonstrates how disciplined range mechanics outperform passive holding. 📊
Dead tokens trapped in historical distribution zones will continue bleeding toward zero during every expansion phase. Cleaning up your portfolio is essential when structural regime shifts occur. 💡
Are you rotating your capital into high-conviction institutional setups or still holding legacy bags hoping for a miracle? 🤔
⚠️ Not financial advice. Always manage your risk. 🛡️
🏷️ #RAY #SmartMoney #MarketStructure #Crypto #Altcoins
🔥 🦈
Entry: 1.60 ⚡
Target: 1.80 🚀
Smart money footprints reveal intense polarization as capital flees decaying retail structures and concentrates inside high-conviction demand blocks. While $PEPE and $UNI defend their respective retest zones, swing execution on $RAY demonstrates how disciplined range mechanics outperform passive holding. 📊
Dead tokens trapped in historical distribution zones will continue bleeding toward zero during every expansion phase. Cleaning up your portfolio is essential when structural regime shifts occur. 💡
Are you rotating your capital into high-conviction institutional setups or still holding legacy bags hoping for a miracle? 🤔
⚠️ Not financial advice. Always manage your risk. 🛡️
🏷️ #RAY #SmartMoney #MarketStructure #Crypto #Altcoins
🔥 🦈
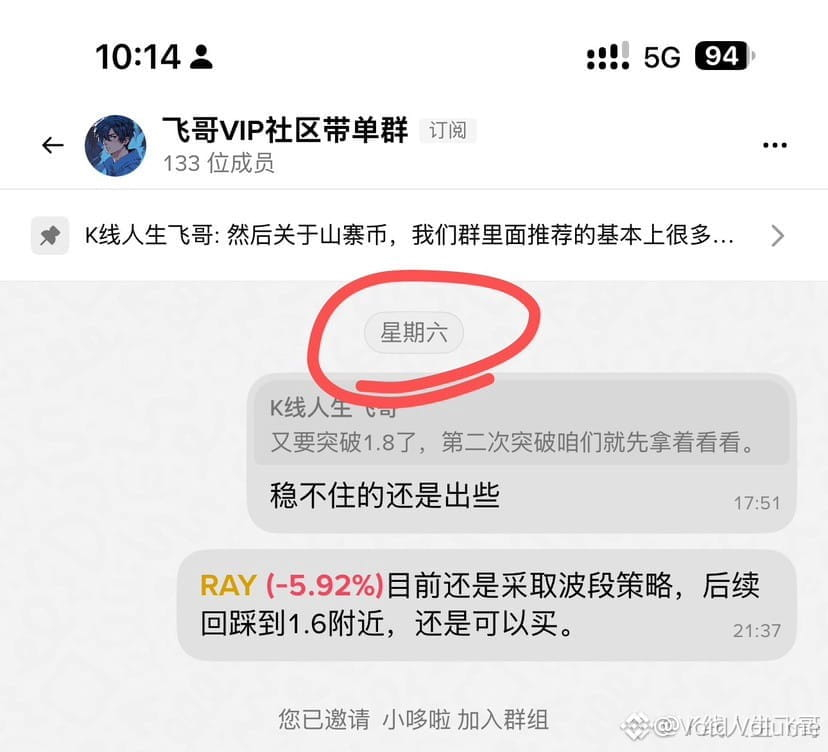
3

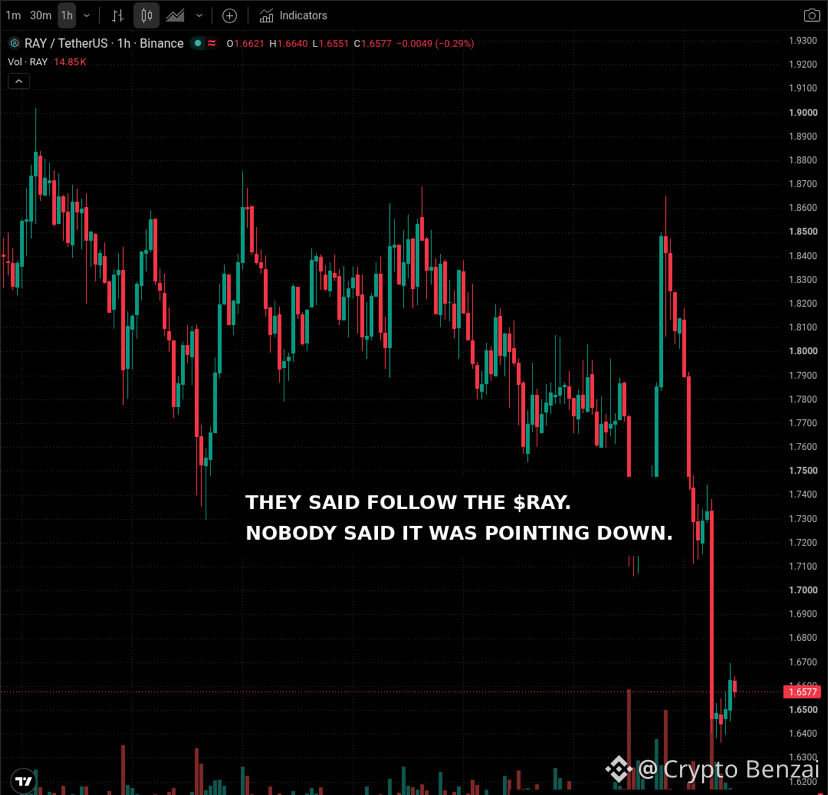
🚨 $RAY BEAMED STRAIGHT INTO A LIQUIDITY VACUUM AND STALLED OUT!
That brutal hourly print from 1.73 down to 1.64 caught late momentum chasers completely off guard. Order books thinned out instantly as sellers aggressively slammed bids, leaving the price parked near 1.66 in a heavy consolidation fog. 📊
When structural support gets vaporized this fast, it reveals how fragile leveraged positioning really is on lower timeframes. Smart money used that sudden flush to sweep trapped longs before letting the market drift in indecision.
💬 Are you stepping in to catch this knife or waiting for a confirmed reclaim above resistance?
⚠️ Not financial advice. Always manage your risk. 🛡️
🏷️ #RAY #Raydium #CryptoTrading #MarketAnalysis
🔥
🚨 $RAY BEAMED STRAIGHT INTO A LIQUIDITY VACUUM AND STALLED OUT!
That brutal hourly print from 1.73 down to 1.64 caught late momentum chasers completely off guard. Order books thinned out instantly as sellers aggressively slammed bids, leaving the price parked near 1.66 in a heavy consolidation fog. 📊
When structural support gets vaporized this fast, it reveals how fragile leveraged positioning really is on lower timeframes. Smart money used that sudden flush to sweep trapped longs before letting the market drift in indecision.
💬 Are you stepping in to catch this knife or waiting for a confirmed reclaim above resistance?
⚠️ Not financial advice. Always manage your risk. 🛡️
🏷️ #RAY #Raydium #CryptoTrading #MarketAnalysis
🔥
That brutal hourly print from 1.73 down to 1.64 caught late momentum chasers completely off guard. Order books thinned out instantly as sellers aggressively slammed bids, leaving the price parked near 1.66 in a heavy consolidation fog. 📊
When structural support gets vaporized this fast, it reveals how fragile leveraged positioning really is on lower timeframes. Smart money used that sudden flush to sweep trapped longs before letting the market drift in indecision.
💬 Are you stepping in to catch this knife or waiting for a confirmed reclaim above resistance?
⚠️ Not financial advice. Always manage your risk. 🛡️
🏷️ #RAY #Raydium #CryptoTrading #MarketAnalysis
🔥
2

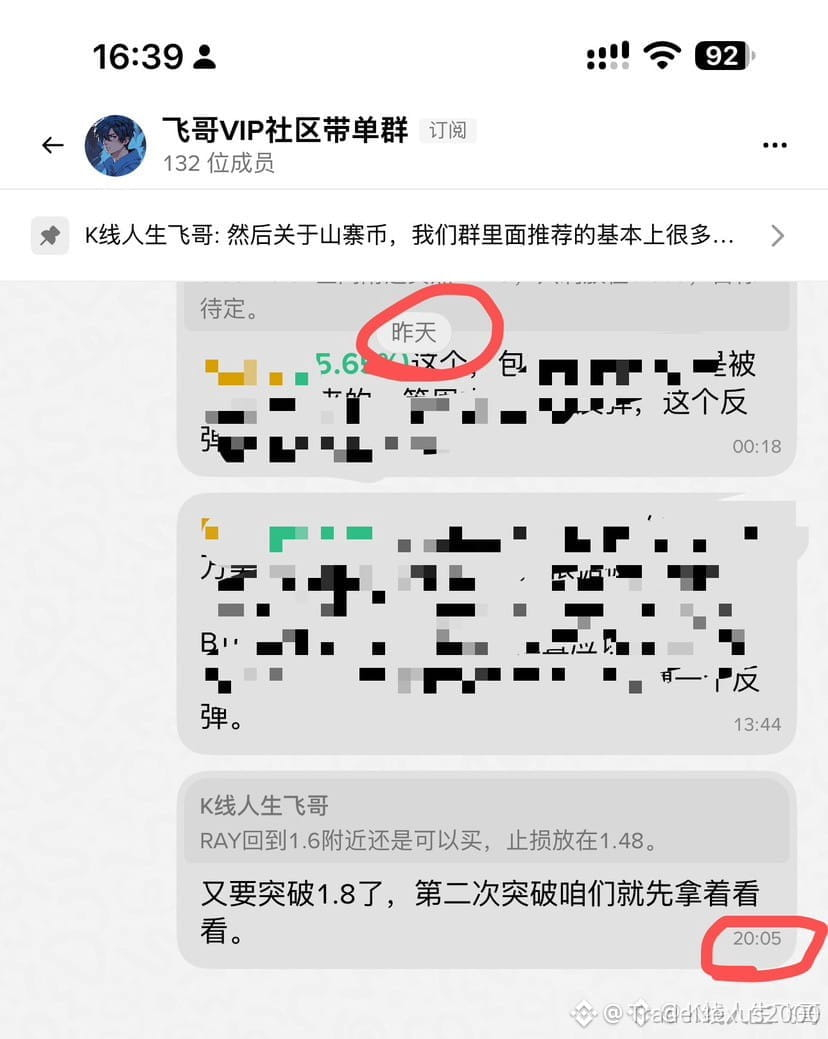
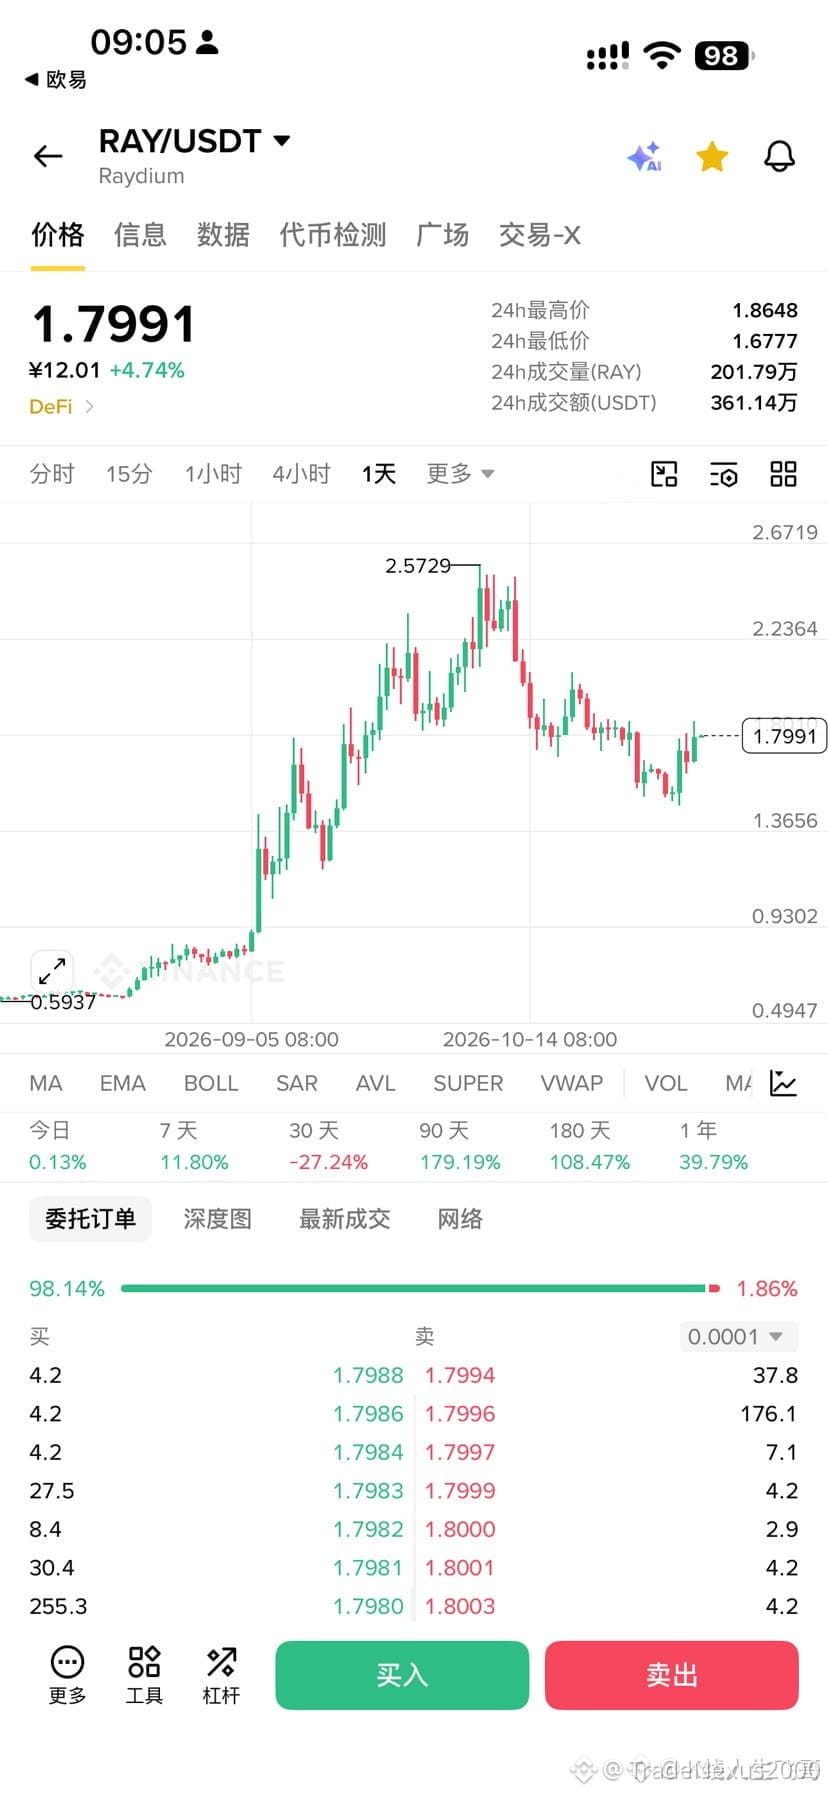
⚡ $RAY BREAKS THROUGH KEY RESISTANCE AS INSTITUTIONAL REVENUE BUYBACKS ACCELERATE 🚀
Entry: 1.6 ⚡
Target: 1.8 🚀
The structural demand around the 1.6 structural support has consistently absorbed sell-side pressure, establishing a clean liquidity baseline for this Solana ecosystem powerhouse. 📊 With robust fundamentals spanning decentralized swap infrastructure, perpetual markets, and token launchpads backed by a 12 percent protocol revenue buyback mechanism, price action is aggressively reclaiming key structural hurdles. ⚡
Momentum indicators reflect high-beta strength during macro relief phases, mirroring historical accumulation patterns that preceded massive multi-fold expansions. 💡 Are you positioning for the continuation move past 1.8 or waiting for a localized retest of the range lows? 👇
⚠️ Not financial advice. Always manage your risk. 🛡️
🏷️ #RAY #Solana #DeFi #Breakout #Crypto
🔥 💎
⚡ $RAY BREAKS THROUGH KEY RESISTANCE AS INSTITUTIONAL REVENUE BUYBACKS ACCELERATE 🚀
Entry: 1.6 ⚡
Target: 1.8 🚀
The structural demand around the 1.6 structural support has consistently absorbed sell-side pressure, establishing a clean liquidity baseline for this Solana ecosystem powerhouse. 📊 With robust fundamentals spanning decentralized swap infrastructure, perpetual markets, and token launchpads backed by a 12 percent protocol revenue buyback mechanism, price action is aggressively reclaiming key structural hurdles. ⚡
Momentum indicators reflect high-beta strength during macro relief phases, mirroring historical accumulation patterns that preceded massive multi-fold expansions. 💡 Are you positioning for the continuation move past 1.8 or waiting for a localized retest of the range lows? 👇
⚠️ Not financial advice. Always manage your risk. 🛡️
🏷️ #RAY #Solana #DeFi #Breakout #Crypto
🔥 💎
Entry: 1.6 ⚡
Target: 1.8 🚀
The structural demand around the 1.6 structural support has consistently absorbed sell-side pressure, establishing a clean liquidity baseline for this Solana ecosystem powerhouse. 📊 With robust fundamentals spanning decentralized swap infrastructure, perpetual markets, and token launchpads backed by a 12 percent protocol revenue buyback mechanism, price action is aggressively reclaiming key structural hurdles. ⚡
Momentum indicators reflect high-beta strength during macro relief phases, mirroring historical accumulation patterns that preceded massive multi-fold expansions. 💡 Are you positioning for the continuation move past 1.8 or waiting for a localized retest of the range lows? 👇
⚠️ Not financial advice. Always manage your risk. 🛡️
🏷️ #RAY #Solana #DeFi #Breakout #Crypto
🔥 💎

3
🚨 $RAY IGNITING A MASSIVE DEFI BREAKOUT ACROSS THE SOLANA ECOSYSTEM! 💥
Entry: 1.6 ⚡
Target: 1.8 🚀
This Solana infrastructure heavyweight is flexing its high-beta muscles, dominating swap and perp volume while a robust twelve percent revenue buyback engine eats up circulating supply. 📊 When momentum shifts, this asset consistently outpaces the broader market with explosive recovery velocity. ⚡
The recent reclaim of the 1.8 level flips local resistance into a springboard for higher targets as buyers aggressively step in. 💡 Are you riding this momentum wave or waiting for a deeper retest? 👇
⚠️ Not financial advice. Always manage your risk. 🛡️
🏷️ #RAY #DeFi #Solana #Altcoins #Crypto
🔥 💎
🚨 $RAY IGNITING A MASSIVE DEFI BREAKOUT ACROSS THE SOLANA ECOSYSTEM! 💥
Entry: 1.6 ⚡
Target: 1.8 🚀
This Solana infrastructure heavyweight is flexing its high-beta muscles, dominating swap and perp volume while a robust twelve percent revenue buyback engine eats up circulating supply. 📊 When momentum shifts, this asset consistently outpaces the broader market with explosive recovery velocity. ⚡
The recent reclaim of the 1.8 level flips local resistance into a springboard for higher targets as buyers aggressively step in. 💡 Are you riding this momentum wave or waiting for a deeper retest? 👇
⚠️ Not financial advice. Always manage your risk. 🛡️
🏷️ #RAY #DeFi #Solana #Altcoins #Crypto
🔥 💎
Entry: 1.6 ⚡
Target: 1.8 🚀
This Solana infrastructure heavyweight is flexing its high-beta muscles, dominating swap and perp volume while a robust twelve percent revenue buyback engine eats up circulating supply. 📊 When momentum shifts, this asset consistently outpaces the broader market with explosive recovery velocity. ⚡
The recent reclaim of the 1.8 level flips local resistance into a springboard for higher targets as buyers aggressively step in. 💡 Are you riding this momentum wave or waiting for a deeper retest? 👇
⚠️ Not financial advice. Always manage your risk. 🛡️
🏷️ #RAY #DeFi #Solana #Altcoins #Crypto
🔥 💎

1

·
--
Bullish
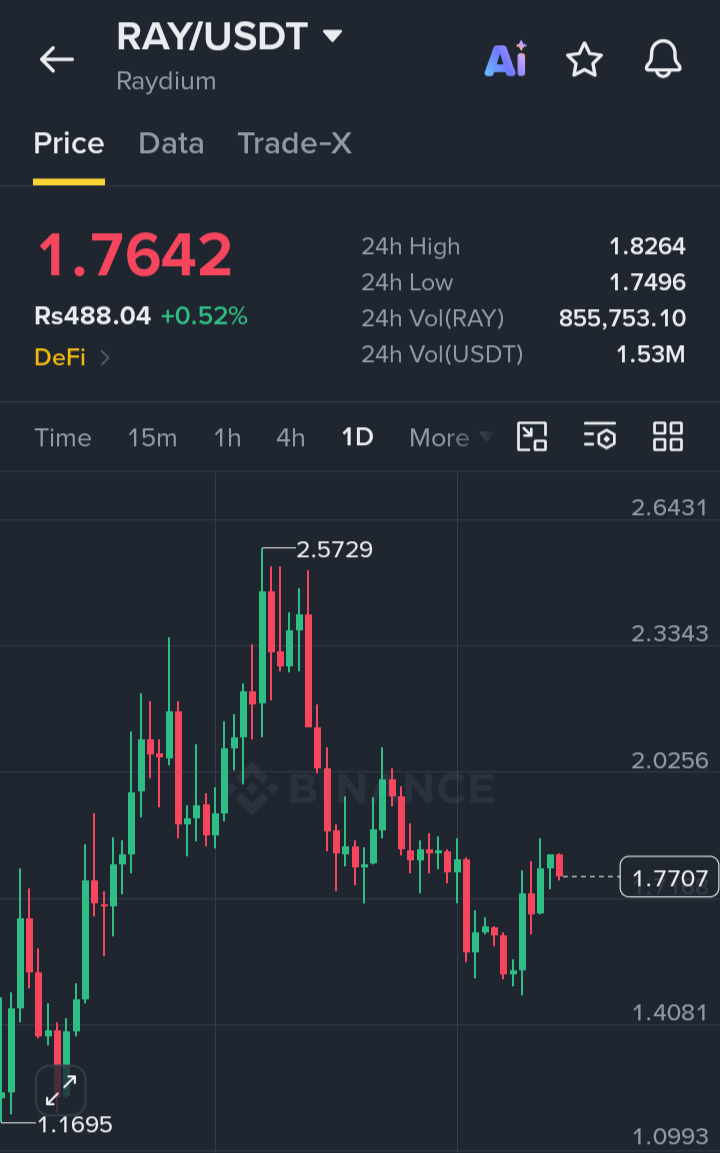
$RAY is showing strength from support, with buyers gradually taking control and momentum building for a potential continuation move.
Entry: 1.7500–1.7650
TP1: 1.8200
TP2: 1.9000
TP3: 2.0250
SL: 1.6900
Buy and Trade $ARB
{future}(ARBUSDT)
#RAY $IDOL
{alpha}(560x3b4de3c7855c03bb9f50ea252cd2c9fa1125ab07)
{spot}(RAYUSDT)
$RAY is showing strength from support, with buyers gradually taking control and momentum building for a potential continuation move.
Entry: 1.7500–1.7650
TP1: 1.8200
TP2: 1.9000
TP3: 2.0250
SL: 1.6900
Buy and Trade $ARB
#RAY $IDOL
Entry: 1.7500–1.7650
TP1: 1.8200
TP2: 1.9000
TP3: 2.0250
SL: 1.6900
Buy and Trade $ARB
#RAY $IDOL
1
108

·
--
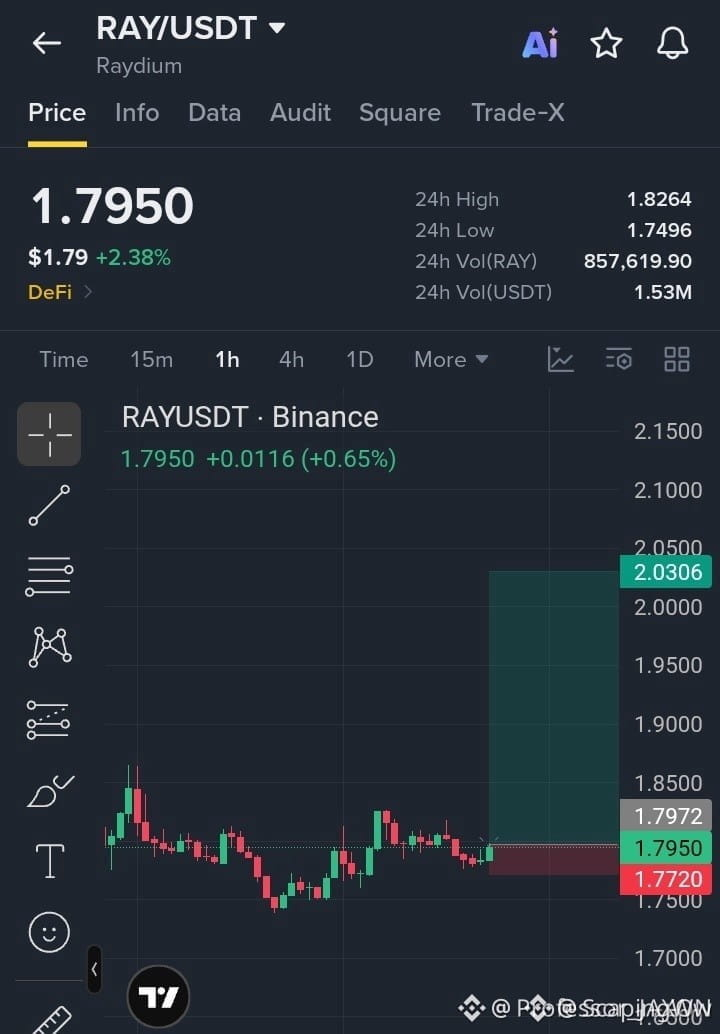
🦈 $RAY ABSORBING SELL PRESSURE ABOVE KEY SUPPORT BEFORE THE EXPANSION 🚀
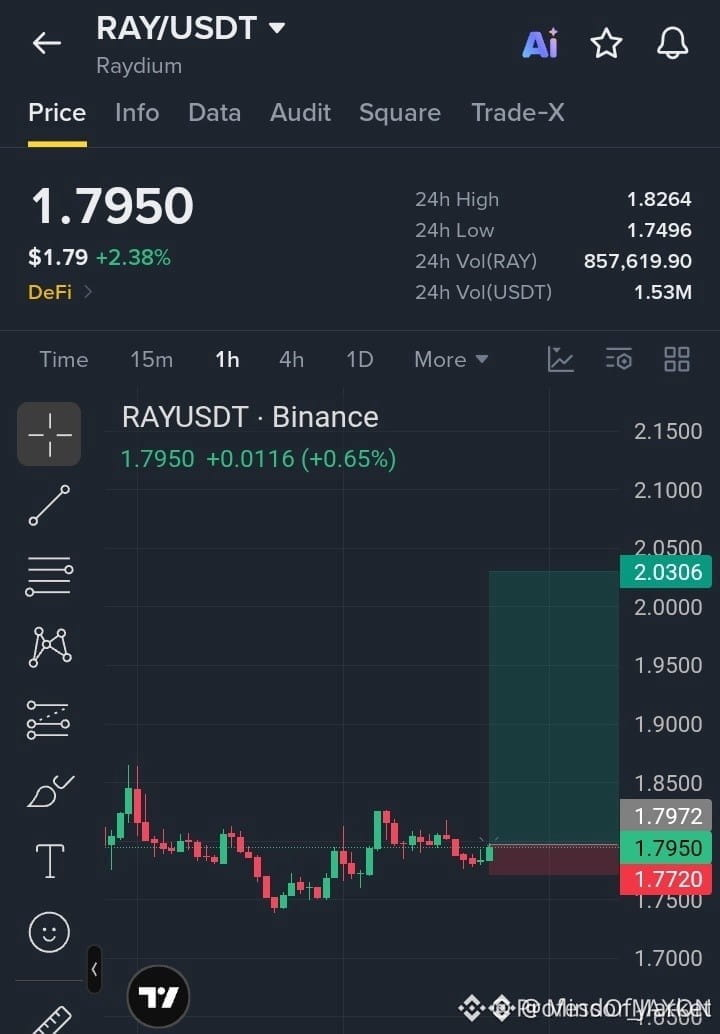
Entry: 1.7900–1.8000 ⚡
Target: 2.0306 🚀
Stop Loss: 1.7720 ⚠️
Smart money is quietly absorbing liquidity right above the 1.7720 structural floor as institutional sellers exhaust their remaining inventory. 🌊
A clean structural reclaim and acceptance above the 1.8200 threshold will trigger automated buying pressure toward higher overhead liquidity pools. 📊
Are you positioning your bids within this accumulation zone or waiting for confirmation above the local range high? 🤔
⚠️ Not financial advice. Always manage your risk. 🛡️
🏷️ #RAY #LongSetup #MarketStructure #Crypto
🔥 💎
🦈 $RAY ABSORBING SELL PRESSURE ABOVE KEY SUPPORT BEFORE THE EXPANSION 🚀
Entry: 1.7900–1.8000 ⚡
Target: 2.0306 🚀
Stop Loss: 1.7720 ⚠️
Smart money is quietly absorbing liquidity right above the 1.7720 structural floor as institutional sellers exhaust their remaining inventory. 🌊
A clean structural reclaim and acceptance above the 1.8200 threshold will trigger automated buying pressure toward higher overhead liquidity pools. 📊
Are you positioning your bids within this accumulation zone or waiting for confirmation above the local range high? 🤔
⚠️ Not financial advice. Always manage your risk. 🛡️
🏷️ #RAY #LongSetup #MarketStructure #Crypto
🔥 💎
Entry: 1.7900–1.8000 ⚡
Target: 2.0306 🚀
Stop Loss: 1.7720 ⚠️
Smart money is quietly absorbing liquidity right above the 1.7720 structural floor as institutional sellers exhaust their remaining inventory. 🌊
A clean structural reclaim and acceptance above the 1.8200 threshold will trigger automated buying pressure toward higher overhead liquidity pools. 📊
Are you positioning your bids within this accumulation zone or waiting for confirmation above the local range high? 🤔
⚠️ Not financial advice. Always manage your risk. 🛡️
🏷️ #RAY #LongSetup #MarketStructure #Crypto
🔥 💎
11
·
--
🚀 $RAY COILED AT SUPPORT AND READY TO IGNITE A MASSIVE BREAKOUT RALLY! 💥
Entry: 1.7900–1.8000 ⚡
Target: 2.0306 🚀
Stop Loss: 1.7720 ⚠️
Buyers are aggressively defending the lower boundary, absorbing every wave of seller exhaustion in a textbook accumulation phase. 📊 Volume profiles show strong institutional bids stacking right inside the current entry zone.
Once price flips the local threshold with conviction, expect order book liquidity to thin out rapidly toward higher resistance targets. ⚡
Are you scaling in here while the risk-to-reward ratio is clean, or waiting for confirmation above the pivot? 👇
⚠️ Not financial advice. Always manage your risk. 🛡️
🏷️ #RAY #Breakout #Crypto #LongSetup #Trading
🔥 💎
🚀 $RAY COILED AT SUPPORT AND READY TO IGNITE A MASSIVE BREAKOUT RALLY! 💥
Entry: 1.7900–1.8000 ⚡
Target: 2.0306 🚀
Stop Loss: 1.7720 ⚠️
Buyers are aggressively defending the lower boundary, absorbing every wave of seller exhaustion in a textbook accumulation phase. 📊 Volume profiles show strong institutional bids stacking right inside the current entry zone.
Once price flips the local threshold with conviction, expect order book liquidity to thin out rapidly toward higher resistance targets. ⚡
Are you scaling in here while the risk-to-reward ratio is clean, or waiting for confirmation above the pivot? 👇
⚠️ Not financial advice. Always manage your risk. 🛡️
🏷️ #RAY #Breakout #Crypto #LongSetup #Trading
🔥 💎
Entry: 1.7900–1.8000 ⚡
Target: 2.0306 🚀
Stop Loss: 1.7720 ⚠️
Buyers are aggressively defending the lower boundary, absorbing every wave of seller exhaustion in a textbook accumulation phase. 📊 Volume profiles show strong institutional bids stacking right inside the current entry zone.
Once price flips the local threshold with conviction, expect order book liquidity to thin out rapidly toward higher resistance targets. ⚡
Are you scaling in here while the risk-to-reward ratio is clean, or waiting for confirmation above the pivot? 👇
⚠️ Not financial advice. Always manage your risk. 🛡️
🏷️ #RAY #Breakout #Crypto #LongSetup #Trading
🔥 💎
8
Log in to explore more content
Join global crypto users on Binance Square
⚡️ Get latest and useful information about crypto.
💬 Trusted by the world’s largest crypto exchange.
👍 Discover real insights from verified creators.
Email / Phone number
Trending Topics
1
#WhoWillSucceedJensenHuangatNvidia?
160,105 views
1,604 Discussing
2
#WhatWillDriveCryptoandStocks’NextRebound?
560,338 views
3,443 Discussing
3
#BitcoinActiveSupplyInProfitDropsBelow45%
70,548 views
683 Discussing
4
#KavaSaysAbnormalActivityLimitedToKavaLend
38,205 views
379 Discussing
5
#USSpotXRPETFsSeeLargestWeeklyOutflowIn8Months
29,857 views
331 Discussing
6
#USPPIMissMayEaseBTCPressure
290,515 views
2,238 Discussing
7
#WORPTLetsTouristsConvertCryptoToThaiBaht
9,803 views
89 Discussing
8
#TONStrategyReports$23.97MQ3NetLoss
10,427 views
43 Discussing
9
#PolkadotCommunityApprovesNewStrategyWith97%Vote
27,756 views
286 Discussing
10
#dYdXPlansV9.9UpgradeToShiftUSDCToInjective
26,185 views
247 Discussing