
#fil
fil
9M views
21,437 Discussing
Hot
Latest

·
--
🚀 Filecoin (FIL) – Can Bulls Make a Comeback?
$FIL is around $0.66 👀
Can buyers build fresh momentum?
📊 Key levels to watch:
- Support: $0.61
- Resistance: $0.72
- Watch buying volume.
- A breakout above resistance could improve bullish momentum.
🔥 Recovery or more downside?
Bullish or Bearish? What's your target? 👇
#FIL #Filecoin #CryptoAnalysis #BinanceSquare
DYOR. Always manage your risk.
{spot}(FILUSDT)
🚀 Filecoin (FIL) – Can Bulls Make a Comeback?
$FIL is around $0.66 👀
Can buyers build fresh momentum?
📊 Key levels to watch:
- Support: $0.61
- Resistance: $0.72
- Watch buying volume.
- A breakout above resistance could improve bullish momentum.
🔥 Recovery or more downside?
Bullish or Bearish? What's your target? 👇
#FIL #Filecoin #CryptoAnalysis #BinanceSquare
DYOR. Always manage your risk.
$FIL is around $0.66 👀
Can buyers build fresh momentum?
📊 Key levels to watch:
- Support: $0.61
- Resistance: $0.72
- Watch buying volume.
- A breakout above resistance could improve bullish momentum.
🔥 Recovery or more downside?
Bullish or Bearish? What's your target? 👇
#FIL #Filecoin #CryptoAnalysis #BinanceSquare
DYOR. Always manage your risk.

3
1.4k

·
--
The long execution framework for $FIL is officially set—here are the exact levels to monitor.
⚡ $FIL — LONG SETUP
📍 Entry: 0.633006 – 0.636842
🎯 TP1: 0.644515
🎯 TP2: 0.64963
🎯 TP3: 0.657303
🛑 Stop Loss: 0.62917
Trade here 👇
📌 Trade management rules: see pinned post.
Are you taking this $FIL setup or watching from the sidelines? Let me know your bias below and follow for the next trade update.
#WriteToEarn #FIL #CryptoTrading #BinanceSquare #Crypto
The long execution framework for $FIL is officially set—here are the exact levels to monitor.
⚡ $FIL — LONG SETUP
📍 Entry: 0.633006 – 0.636842
🎯 TP1: 0.644515
🎯 TP2: 0.64963
🎯 TP3: 0.657303
🛑 Stop Loss: 0.62917
Trade here 👇
📌 Trade management rules: see pinned post.
Are you taking this $FIL setup or watching from the sidelines? Let me know your bias below and follow for the next trade update.
#WriteToEarn #FIL #CryptoTrading #BinanceSquare #Crypto
⚡ $FIL — LONG SETUP
📍 Entry: 0.633006 – 0.636842
🎯 TP1: 0.644515
🎯 TP2: 0.64963
🎯 TP3: 0.657303
🛑 Stop Loss: 0.62917
Trade here 👇
📌 Trade management rules: see pinned post.
Are you taking this $FIL setup or watching from the sidelines? Let me know your bias below and follow for the next trade update.
#WriteToEarn #FIL #CryptoTrading #BinanceSquare #Crypto
1
766

·
--
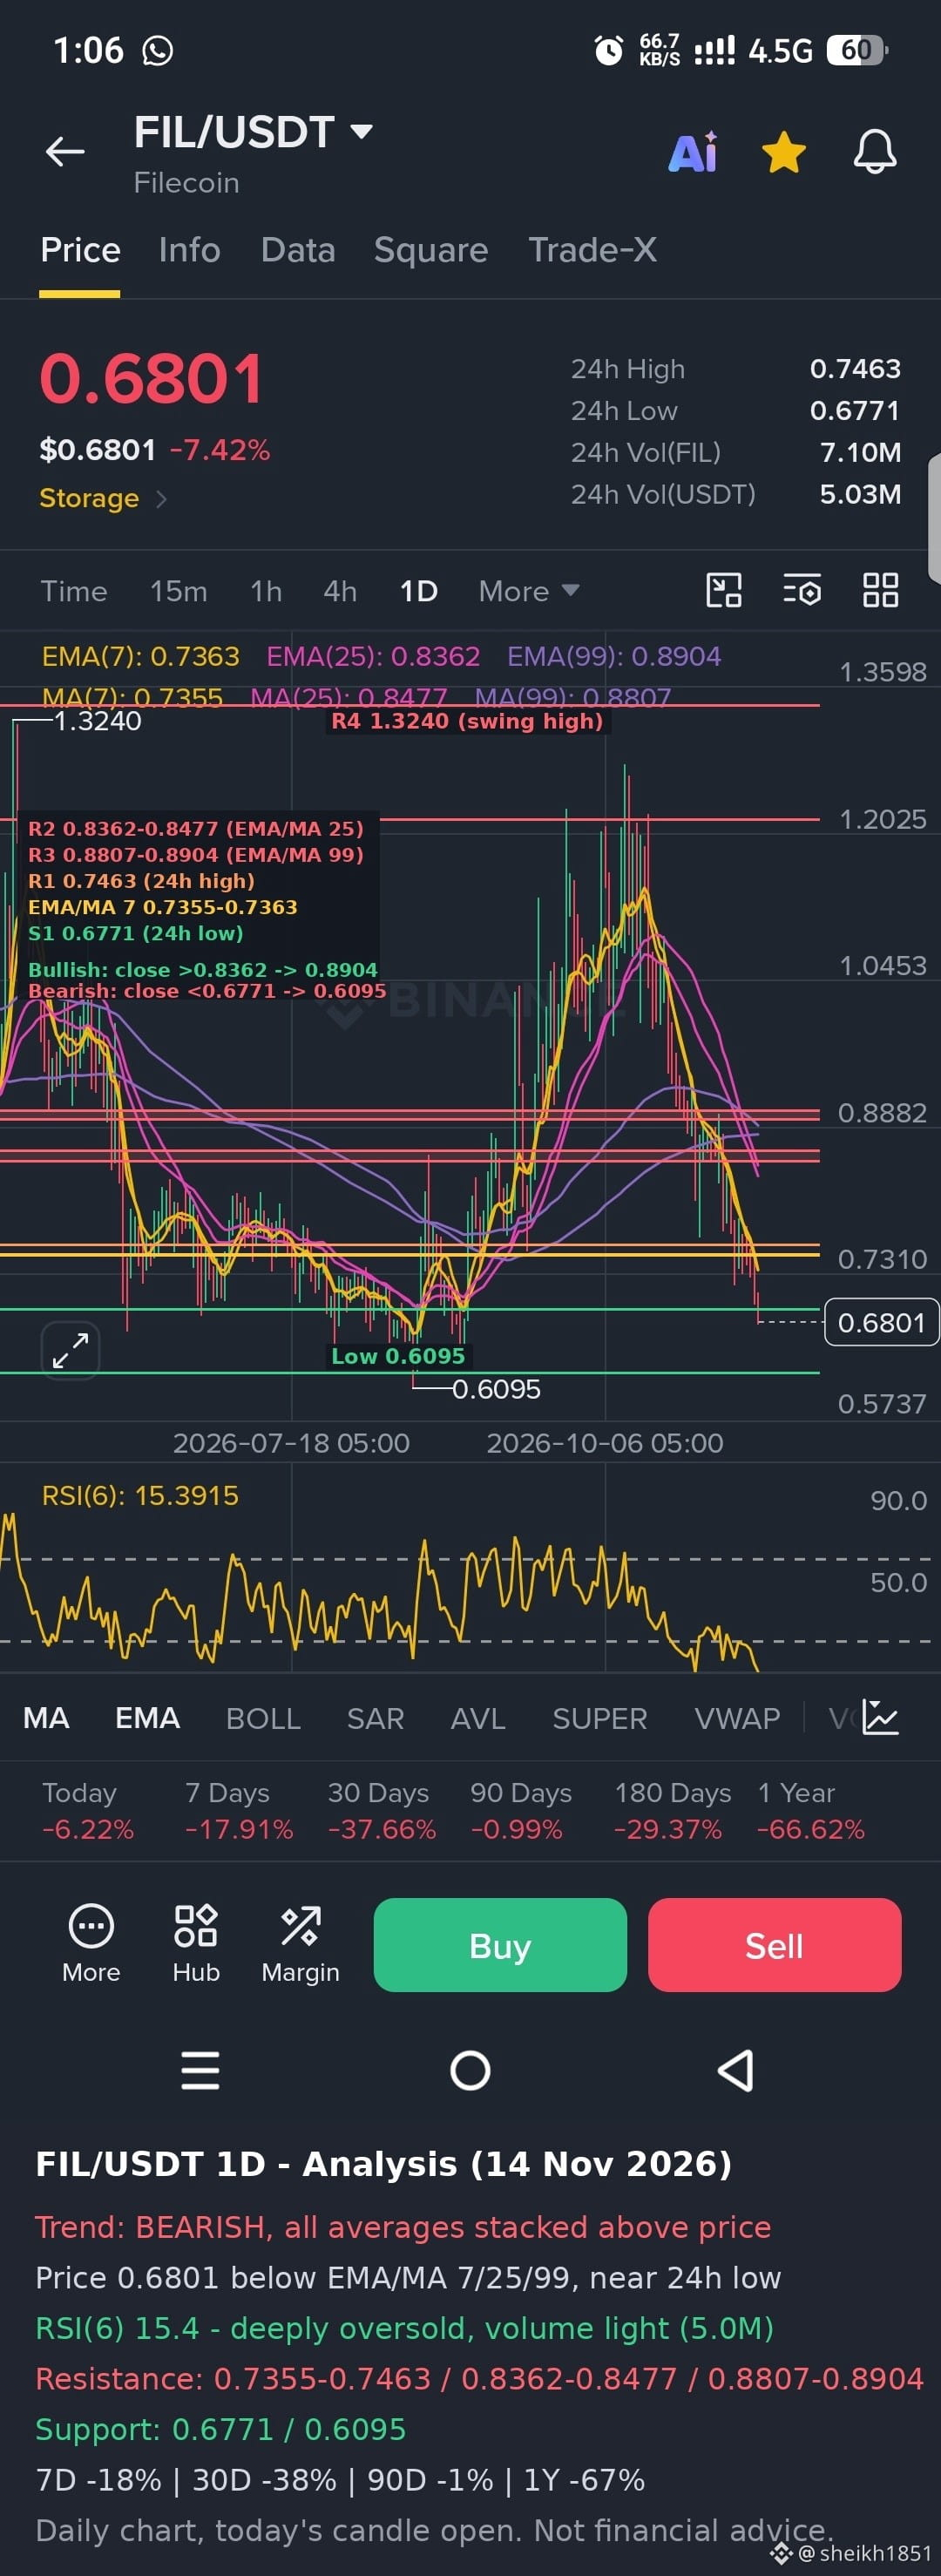
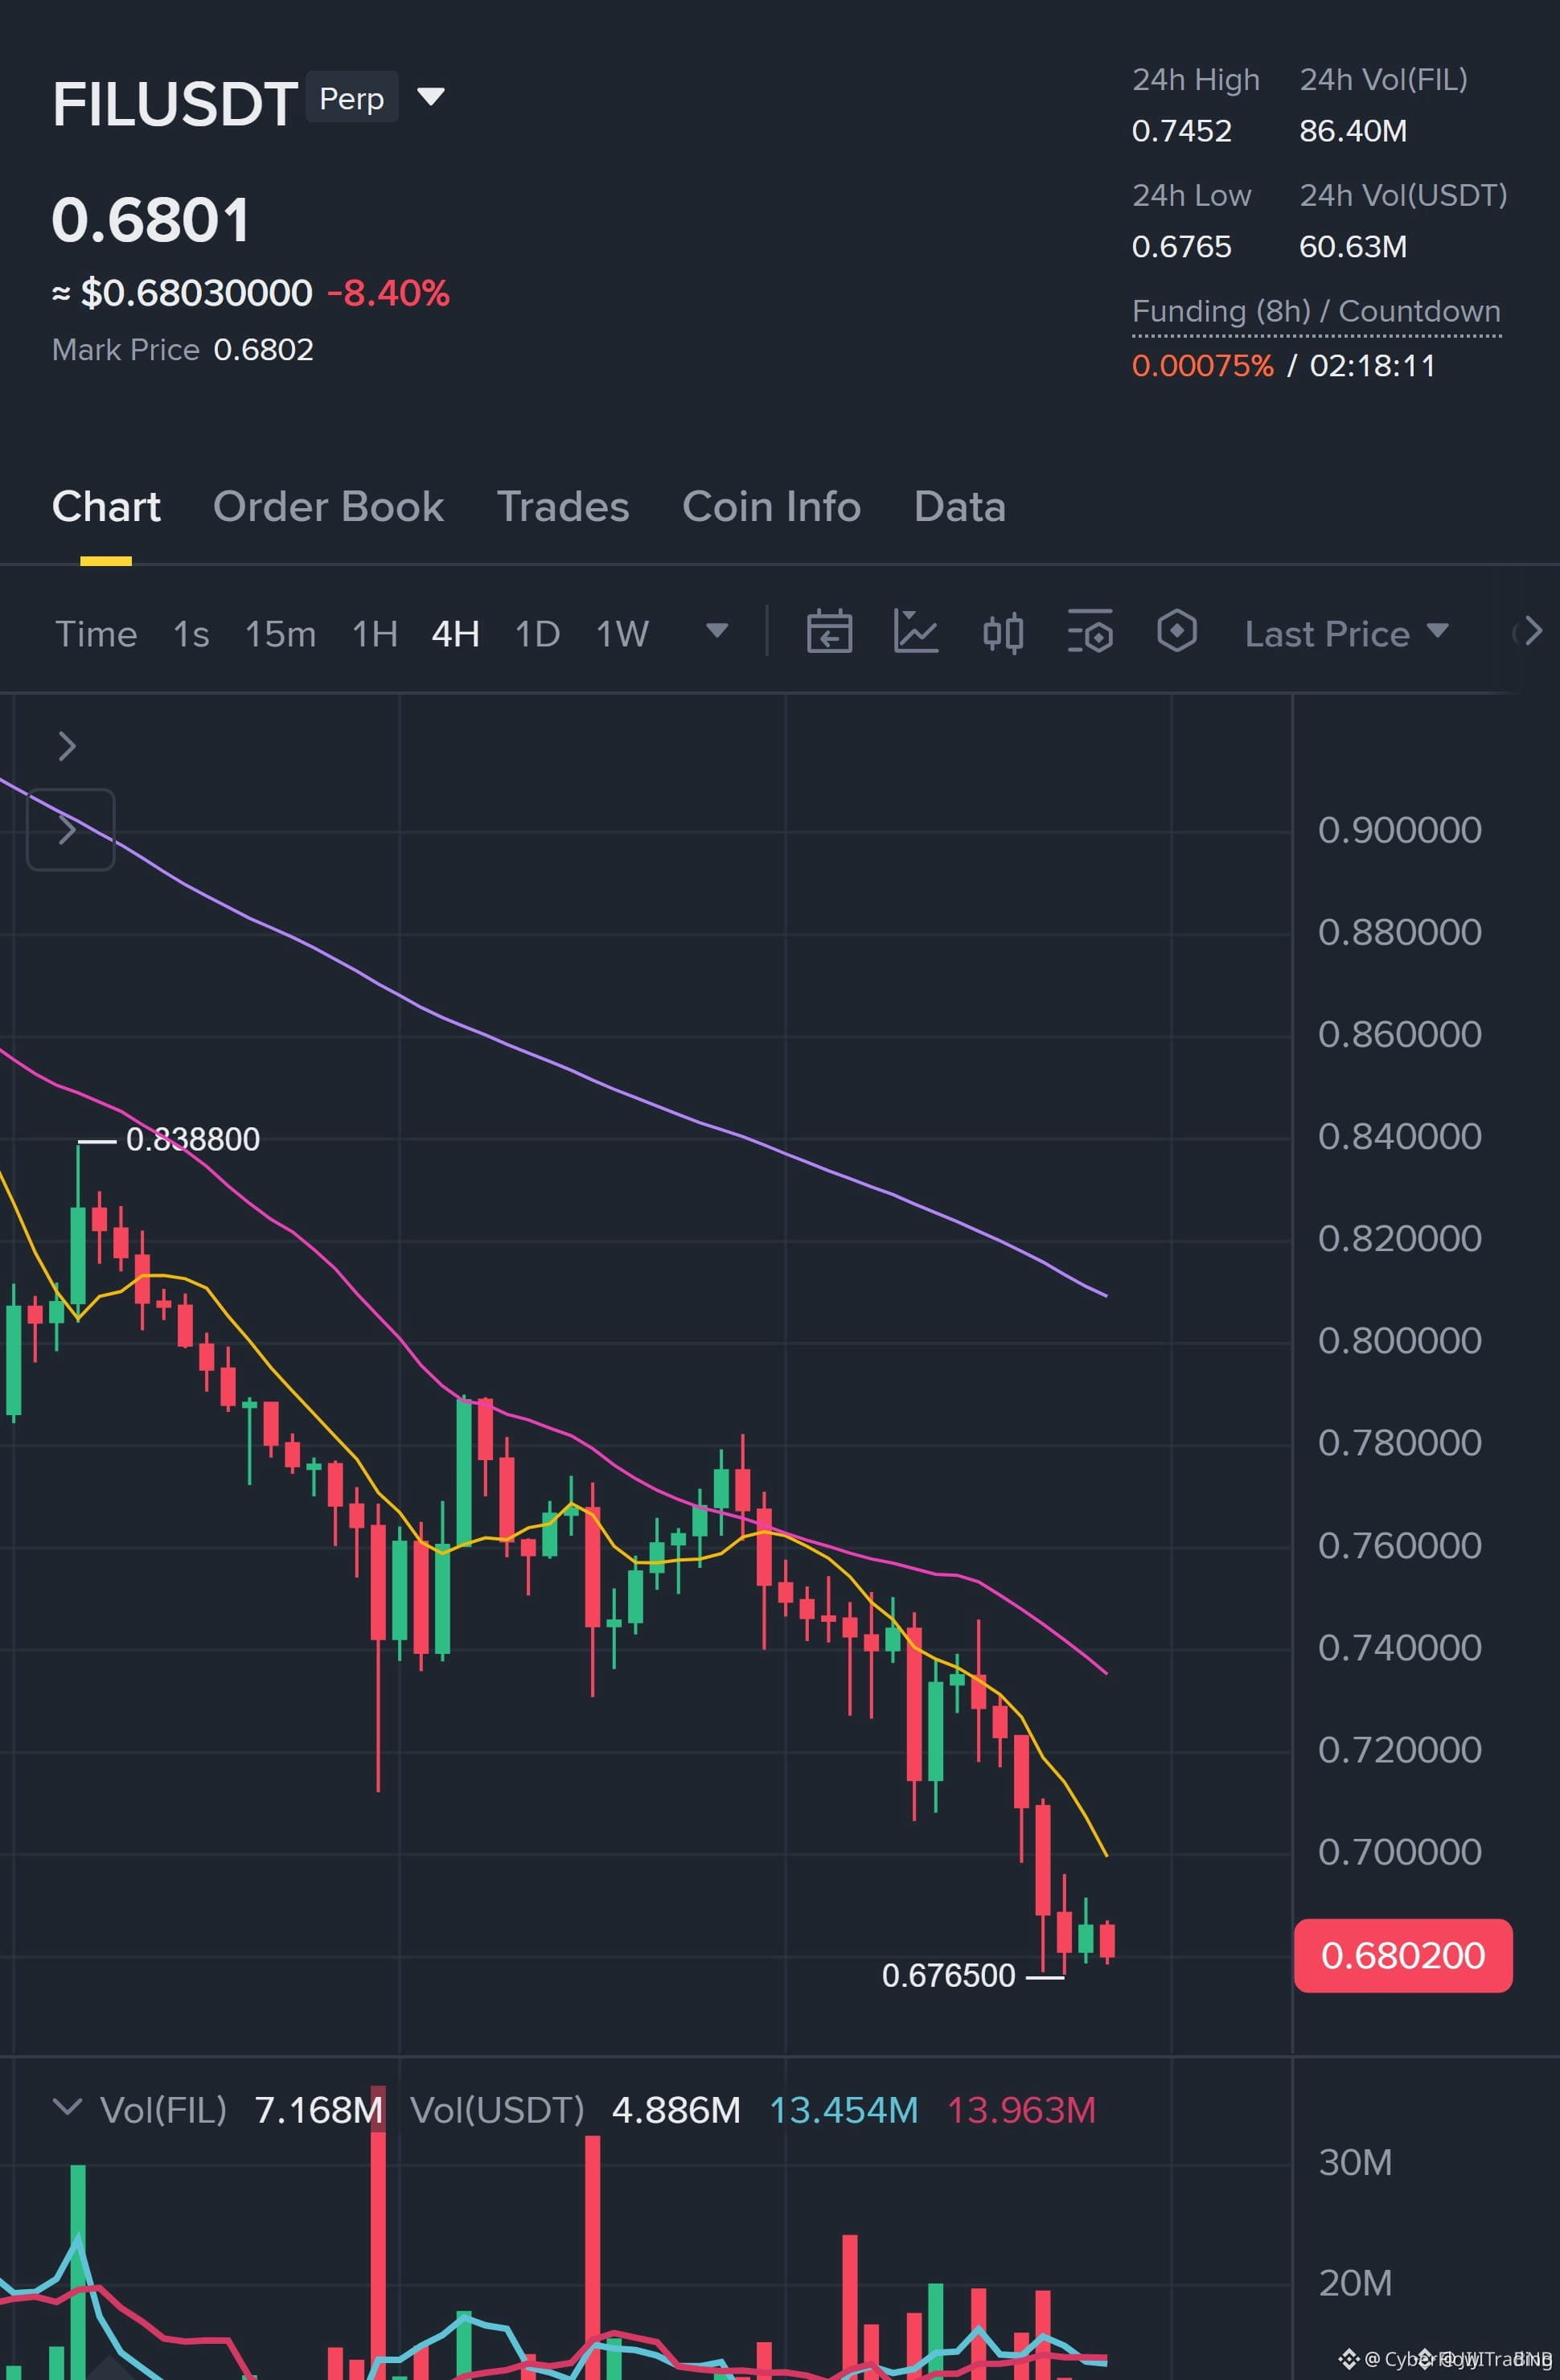
$FIL FIL/USDT (1D) – Quick Analysis
This is the daily chart, so these levels move more slowly than the 1H screenshots. Today's candle is still open, so the -7.42% move can change.
Trend: Bearish. Price (0.6801) is below every moving average: EMA(7) 0.7363, EMA(25) 0.8362, EMA(99) 0.8904, MA(25) 0.8477 and MA(99) 0.8807. The averages are stacked in bearish order and all sloping down. The rally from the 0.6095 low to the 1.3240 peak has now been mostly given back. Over longer periods it is down about 18% over 7 days, 38% over 30 days and 67% over one year, and about 1% lower over 90 days.
Momentum: RSI(6) is about 15.4, which is deeply oversold. That raises the chance of a relief bounce, but in a strong downtrend RSI can stay low for a while. Volume is light (about 5.0M USDT), so the selling is steady, not panicked.
Key levels:
Resistance: 0.7355 to 0.7363 (MA/EMA 7), then 0.8362 to 0.8477 (EMA/MA 25), then 0.8807 to 0.8904 (the 99 averages). The 0.7463 24h high sits in between.
- **Support:** 0.6771 (24h low, close to the current price), then 0.6095 (the recent low). Below that, the chart shows nothing until about 0.57.
Outlook:The bias stays bearish while price is under 0.7355. A bounce into 0.7355 to 0.7463 is the likeliest near-term move, and that zone would probably act as resistance. A daily close below 0.6771 would put 0.6095 in play, and losing that would open further downside. A bullish shift needs a daily close back above 0.8362.
This is a technical read not financial advice. Use stop-losses and keep position sizes small.#Binance #fil
{spot}(FILUSDT)
$FIL FIL/USDT (1D) – Quick Analysis
This is the daily chart, so these levels move more slowly than the 1H screenshots. Today's candle is still open, so the -7.42% move can change.
Trend: Bearish. Price (0.6801) is below every moving average: EMA(7) 0.7363, EMA(25) 0.8362, EMA(99) 0.8904, MA(25) 0.8477 and MA(99) 0.8807. The averages are stacked in bearish order and all sloping down. The rally from the 0.6095 low to the 1.3240 peak has now been mostly given back. Over longer periods it is down about 18% over 7 days, 38% over 30 days and 67% over one year, and about 1% lower over 90 days.
Momentum: RSI(6) is about 15.4, which is deeply oversold. That raises the chance of a relief bounce, but in a strong downtrend RSI can stay low for a while. Volume is light (about 5.0M USDT), so the selling is steady, not panicked.
Key levels:
Resistance: 0.7355 to 0.7363 (MA/EMA 7), then 0.8362 to 0.8477 (EMA/MA 25), then 0.8807 to 0.8904 (the 99 averages). The 0.7463 24h high sits in between.
- **Support:** 0.6771 (24h low, close to the current price), then 0.6095 (the recent low). Below that, the chart shows nothing until about 0.57.
Outlook:The bias stays bearish while price is under 0.7355. A bounce into 0.7355 to 0.7463 is the likeliest near-term move, and that zone would probably act as resistance. A daily close below 0.6771 would put 0.6095 in play, and losing that would open further downside. A bullish shift needs a daily close back above 0.8362.
This is a technical read not financial advice. Use stop-losses and keep position sizes small.#Binance #fil
This is the daily chart, so these levels move more slowly than the 1H screenshots. Today's candle is still open, so the -7.42% move can change.
Trend: Bearish. Price (0.6801) is below every moving average: EMA(7) 0.7363, EMA(25) 0.8362, EMA(99) 0.8904, MA(25) 0.8477 and MA(99) 0.8807. The averages are stacked in bearish order and all sloping down. The rally from the 0.6095 low to the 1.3240 peak has now been mostly given back. Over longer periods it is down about 18% over 7 days, 38% over 30 days and 67% over one year, and about 1% lower over 90 days.
Momentum: RSI(6) is about 15.4, which is deeply oversold. That raises the chance of a relief bounce, but in a strong downtrend RSI can stay low for a while. Volume is light (about 5.0M USDT), so the selling is steady, not panicked.
Key levels:
Resistance: 0.7355 to 0.7363 (MA/EMA 7), then 0.8362 to 0.8477 (EMA/MA 25), then 0.8807 to 0.8904 (the 99 averages). The 0.7463 24h high sits in between.
- **Support:** 0.6771 (24h low, close to the current price), then 0.6095 (the recent low). Below that, the chart shows nothing until about 0.57.
Outlook:The bias stays bearish while price is under 0.7355. A bounce into 0.7355 to 0.7463 is the likeliest near-term move, and that zone would probably act as resistance. A daily close below 0.6771 would put 0.6095 in play, and losing that would open further downside. A bullish shift needs a daily close back above 0.8362.
This is a technical read not financial advice. Use stop-losses and keep position sizes small.#Binance #fil
780

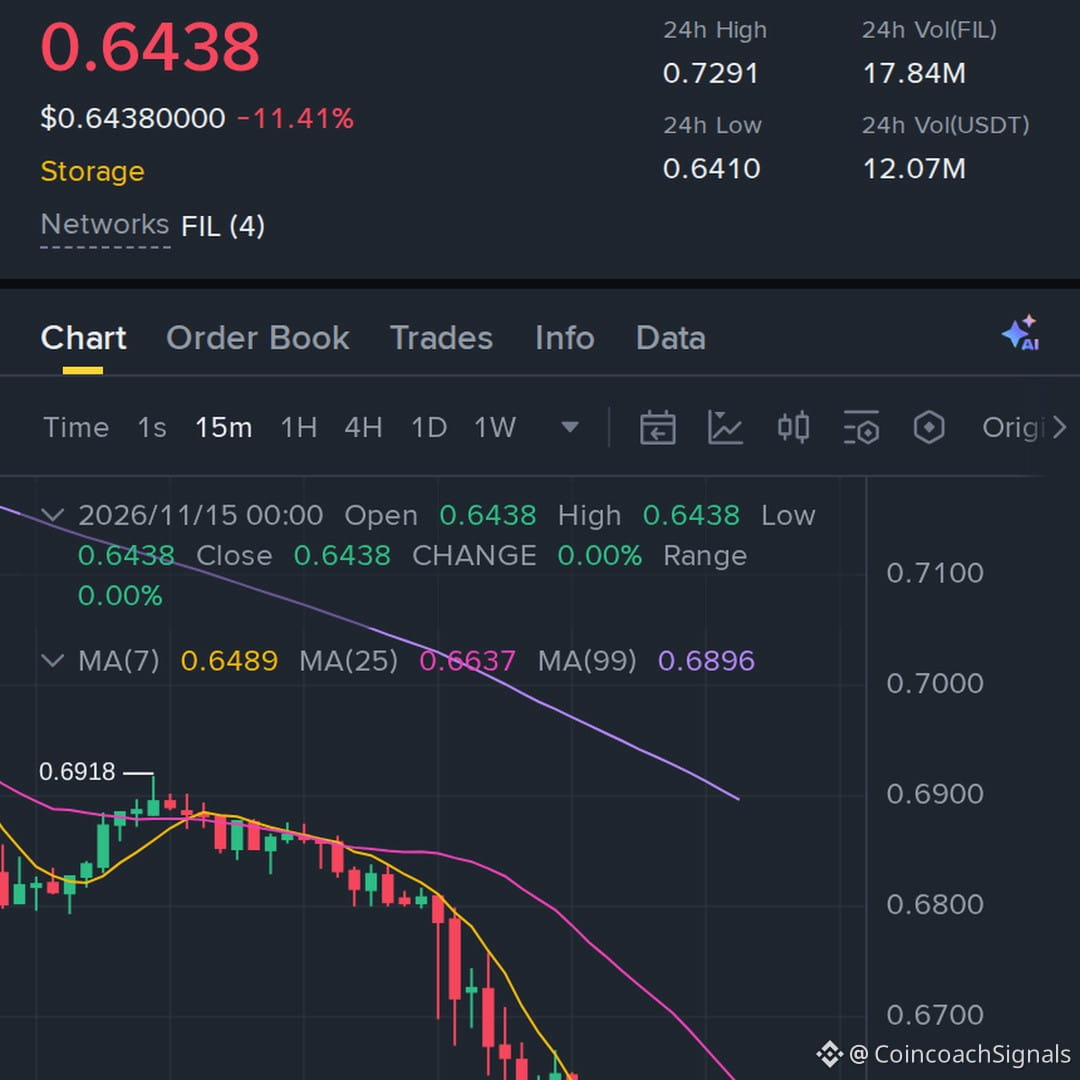
sellers are leaning on $FIL, failed to hold the push and is slipping back under resistance, so 36x feels reasonable here
Entry: 0.6433–0.6455
TP1: 0.6251 → TP2: 0.609 → TP3: 0.5929
Stop Loss: 0.6686
#FIL #Binance #Write2Earn #crypto
sellers are leaning on $FIL , failed to hold the push and is slipping back under resistance, so 36x feels reasonable here
Entry: 0.6433–0.6455
TP1: 0.6251 → TP2: 0.609 → TP3: 0.5929
Stop Loss: 0.6686
#FIL #Binance #Write2Earn #crypto
Entry: 0.6433–0.6455
TP1: 0.6251 → TP2: 0.609 → TP3: 0.5929
Stop Loss: 0.6686
#FIL #Binance #Write2Earn #crypto
51

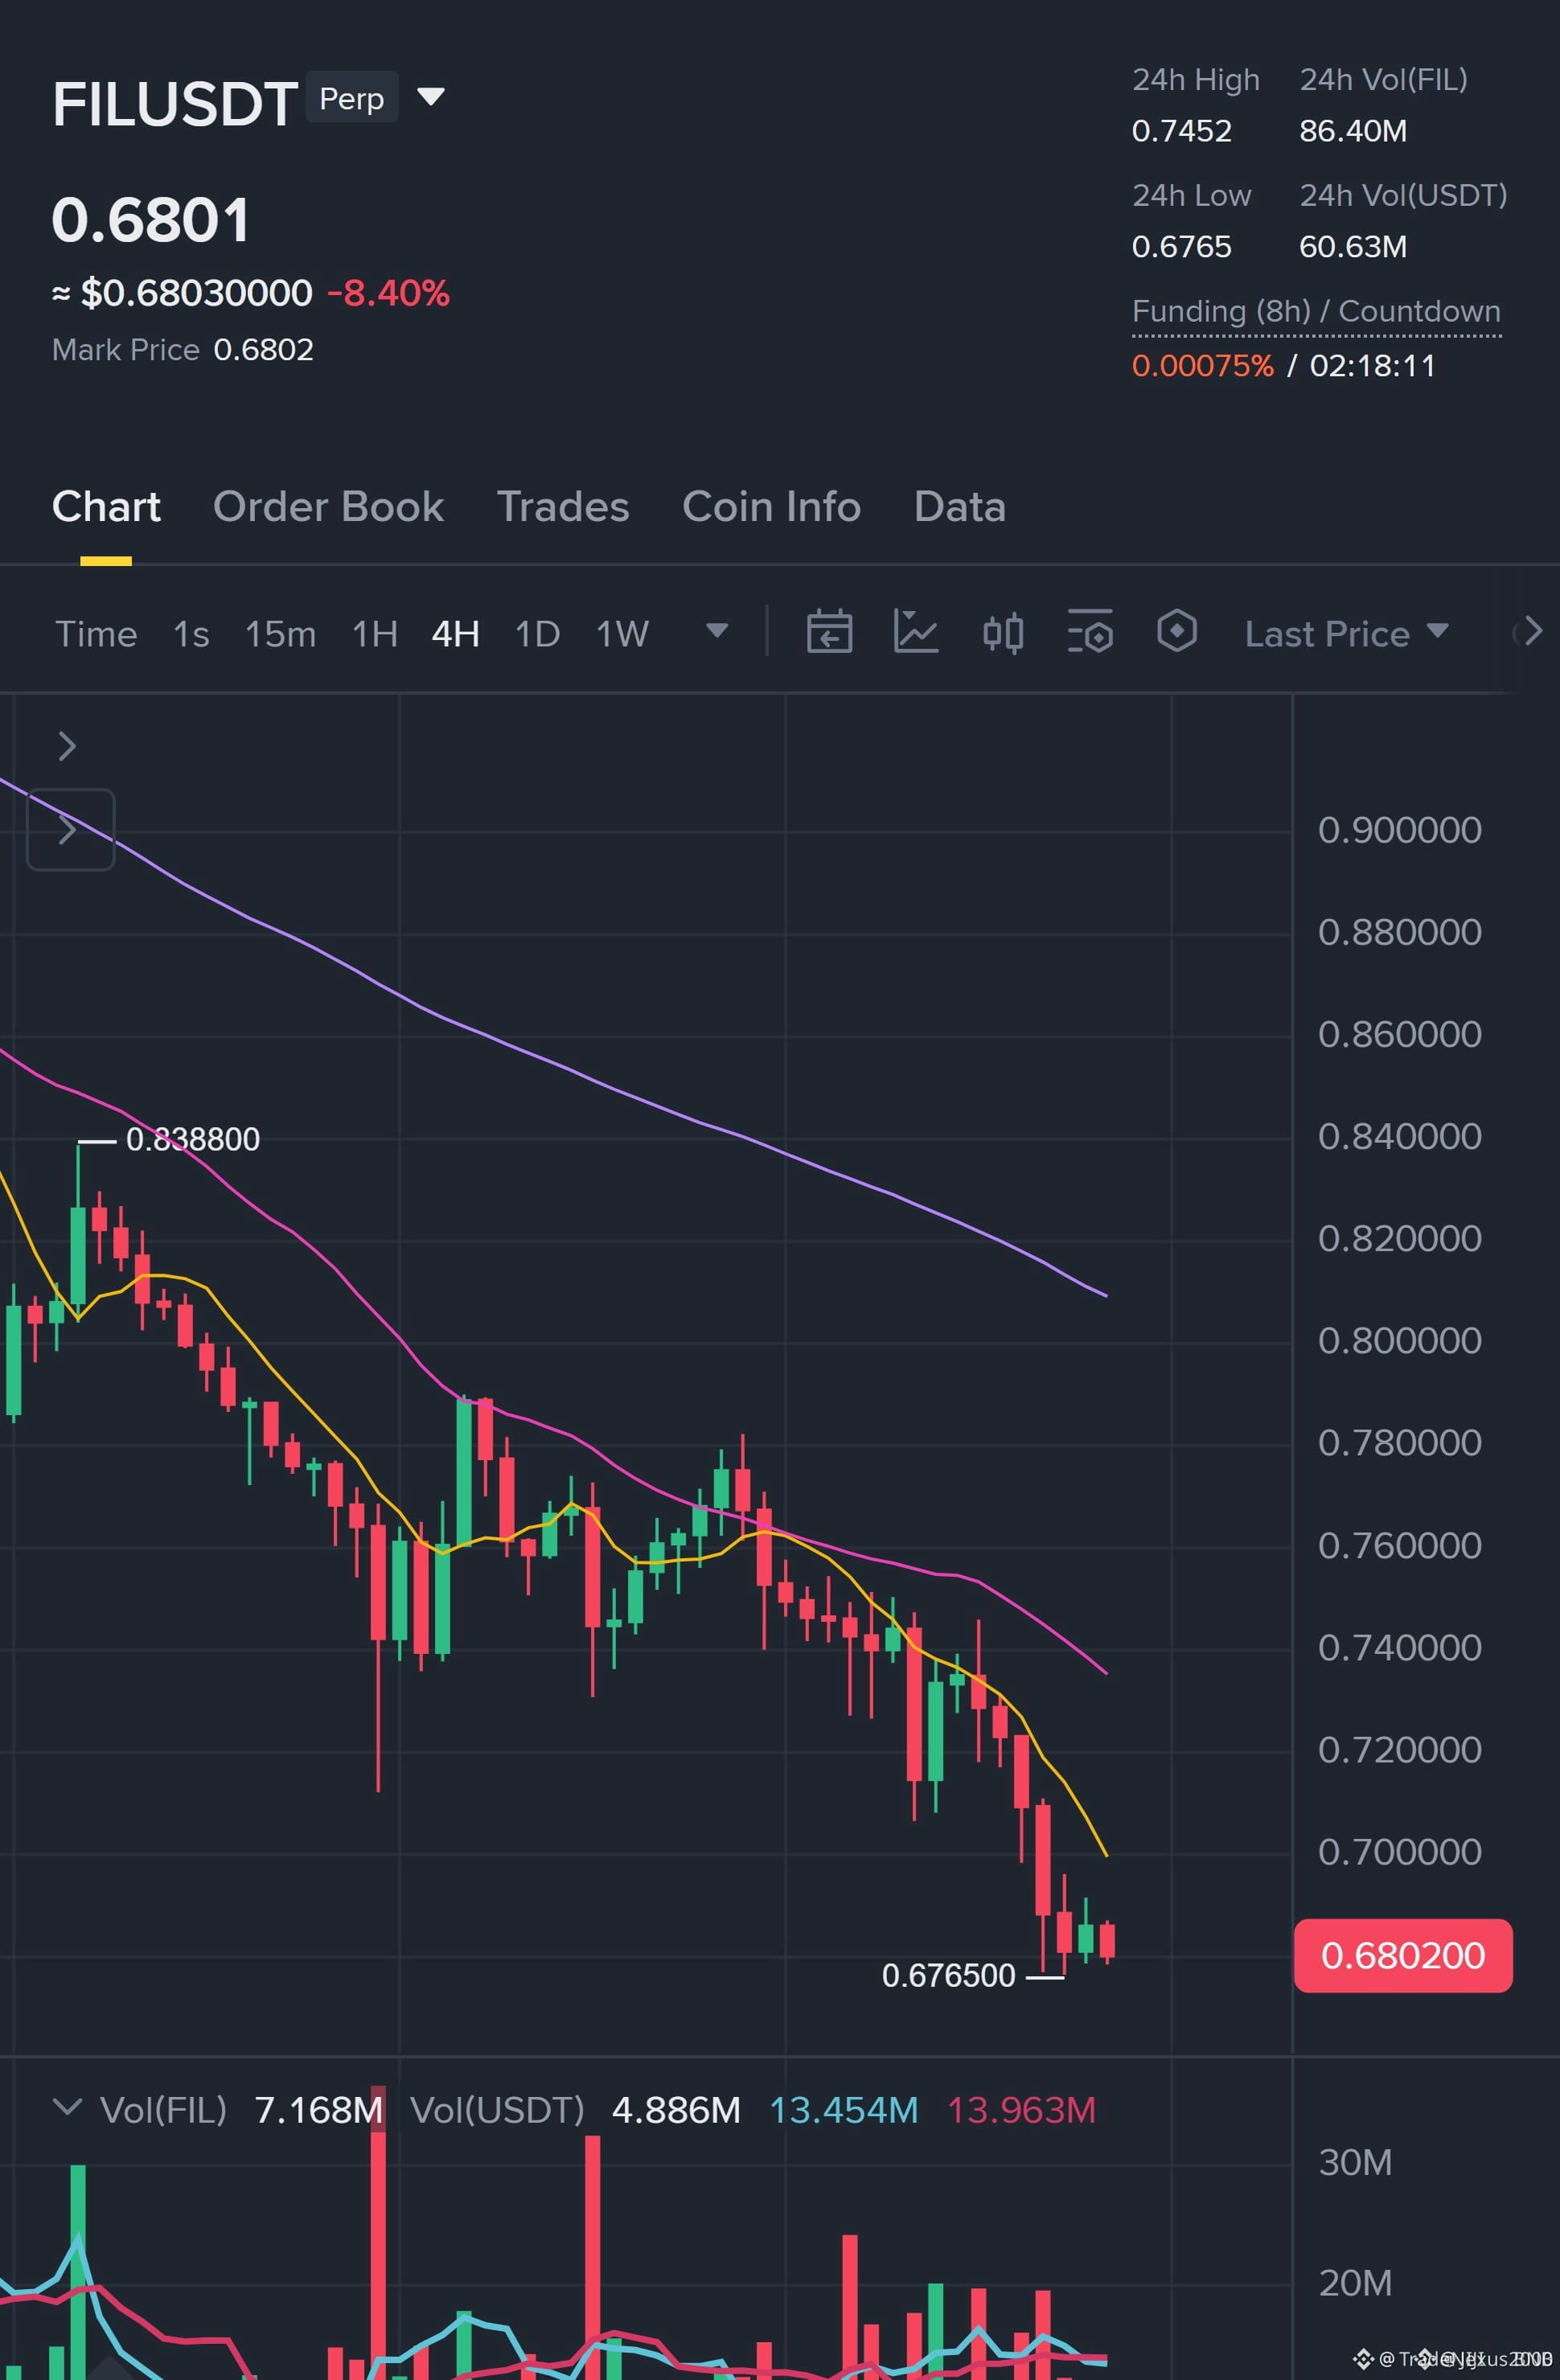
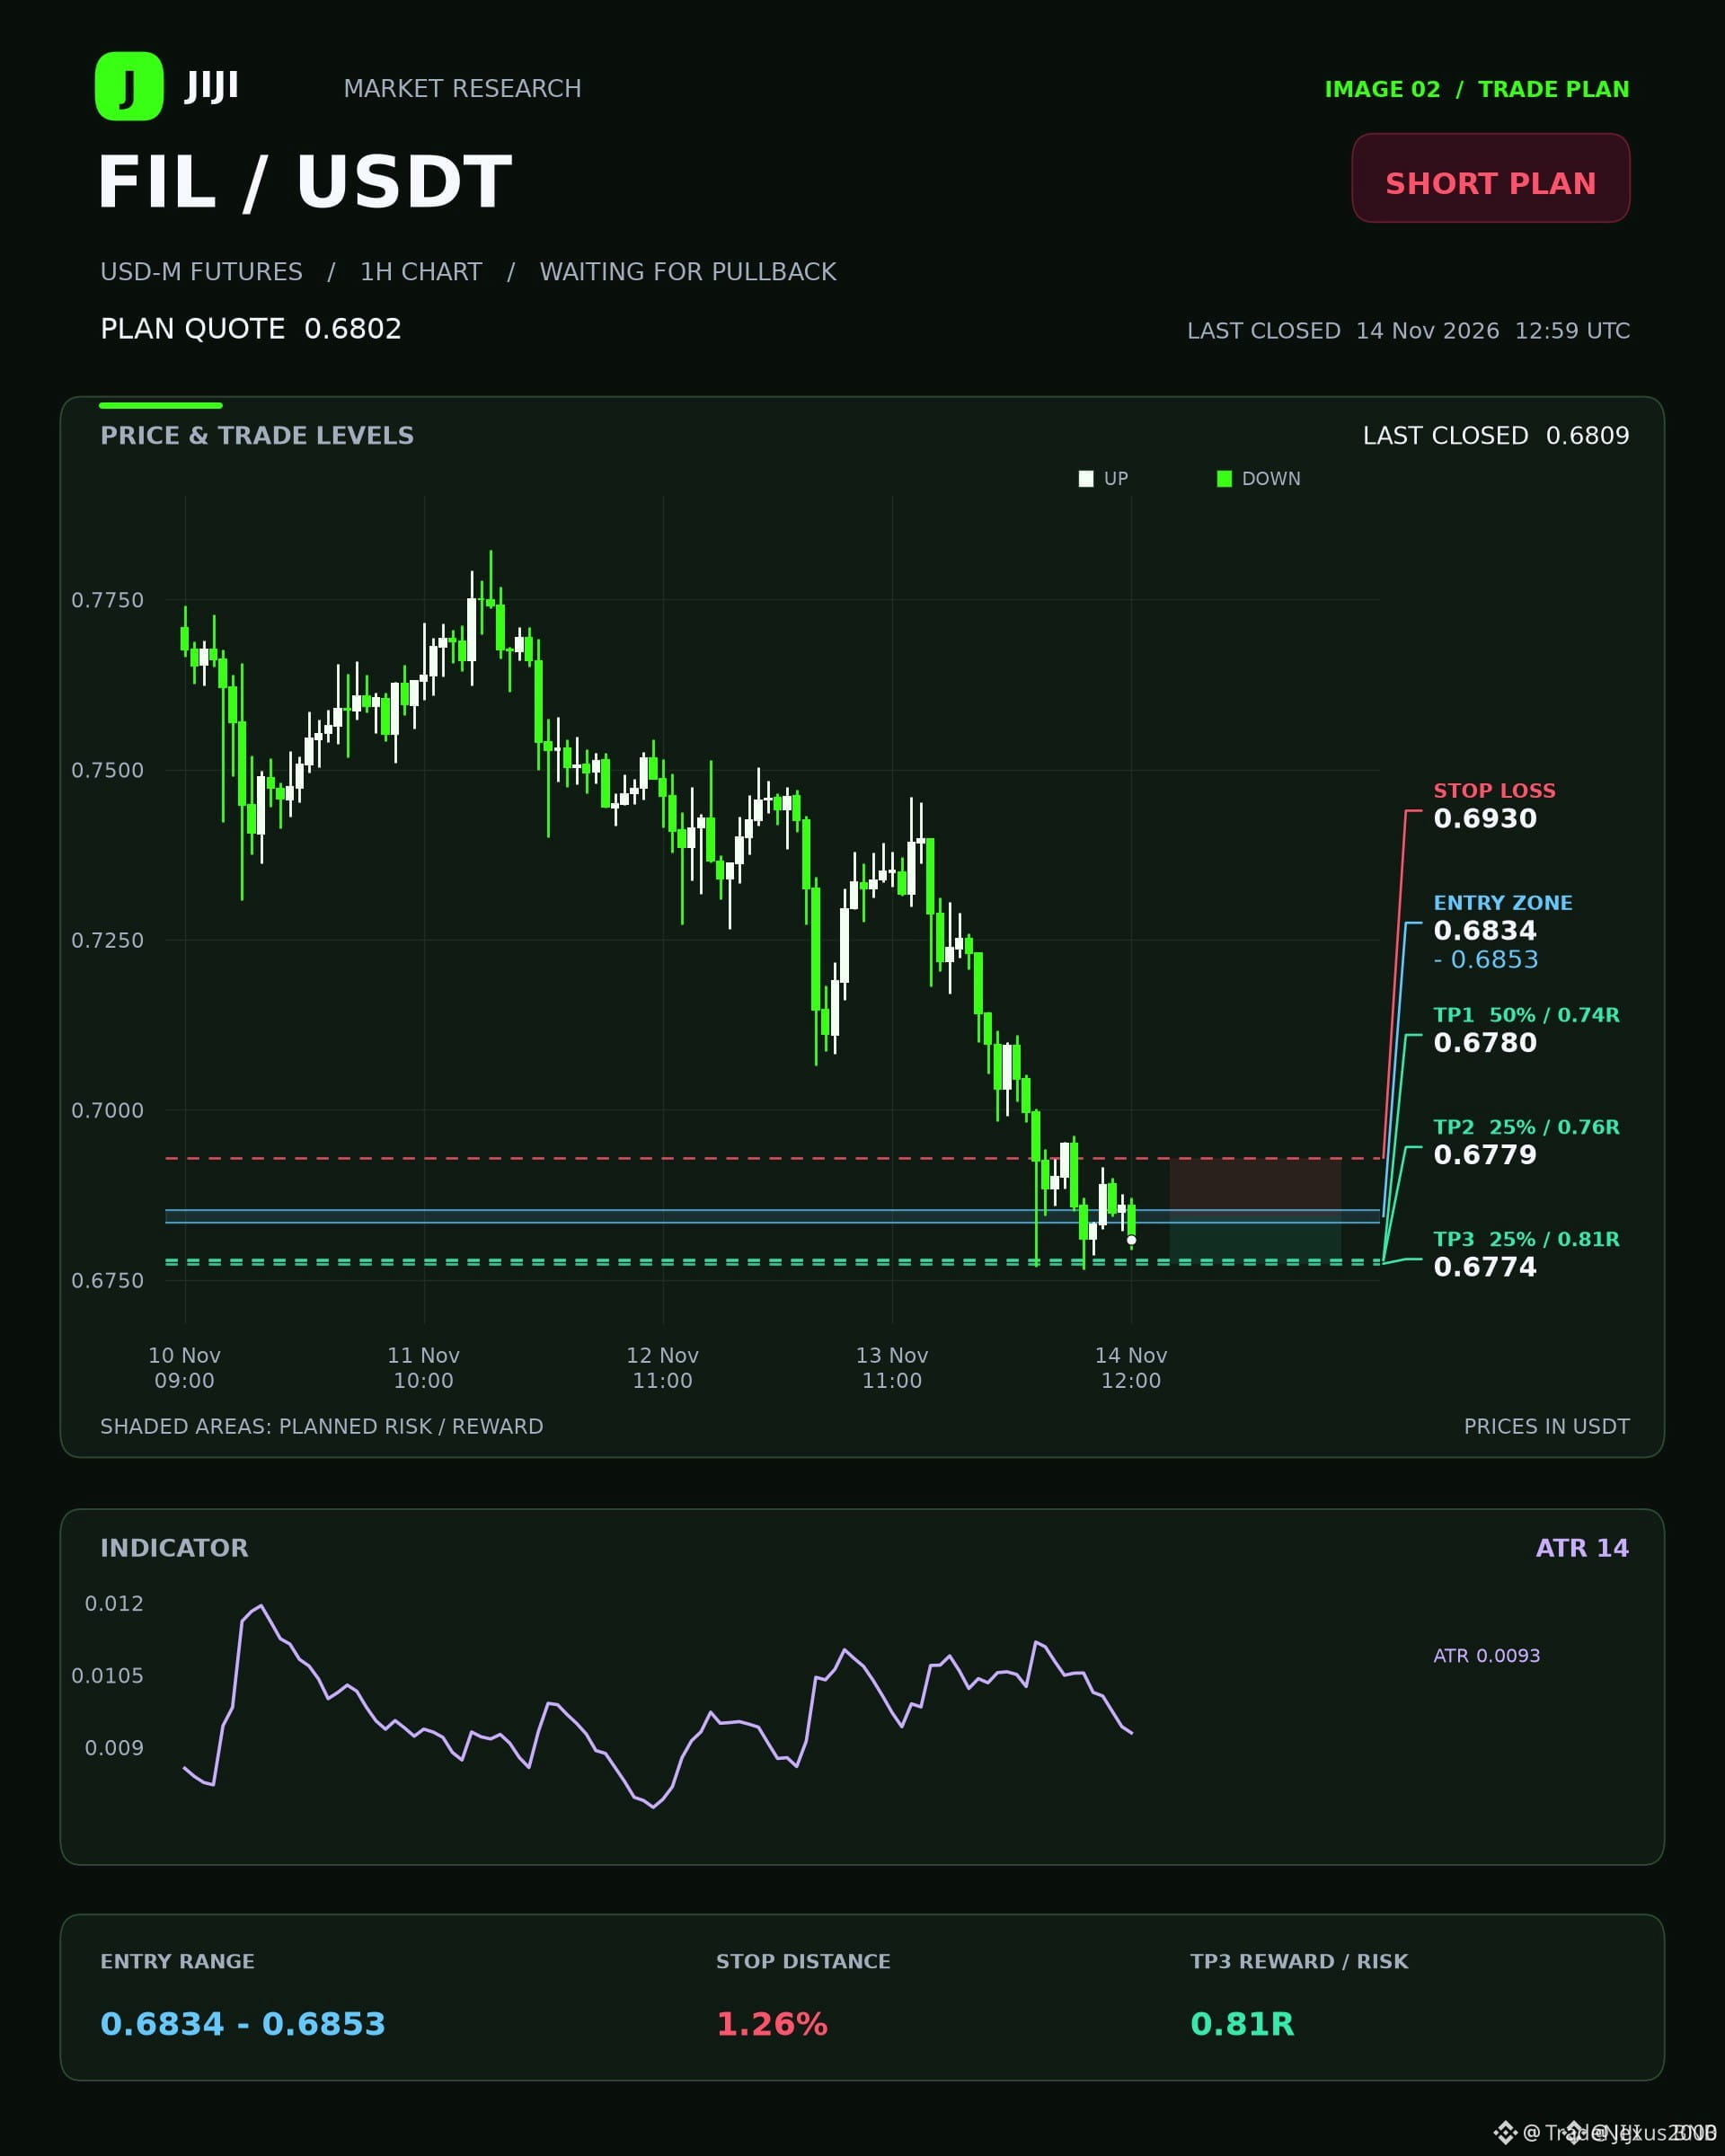
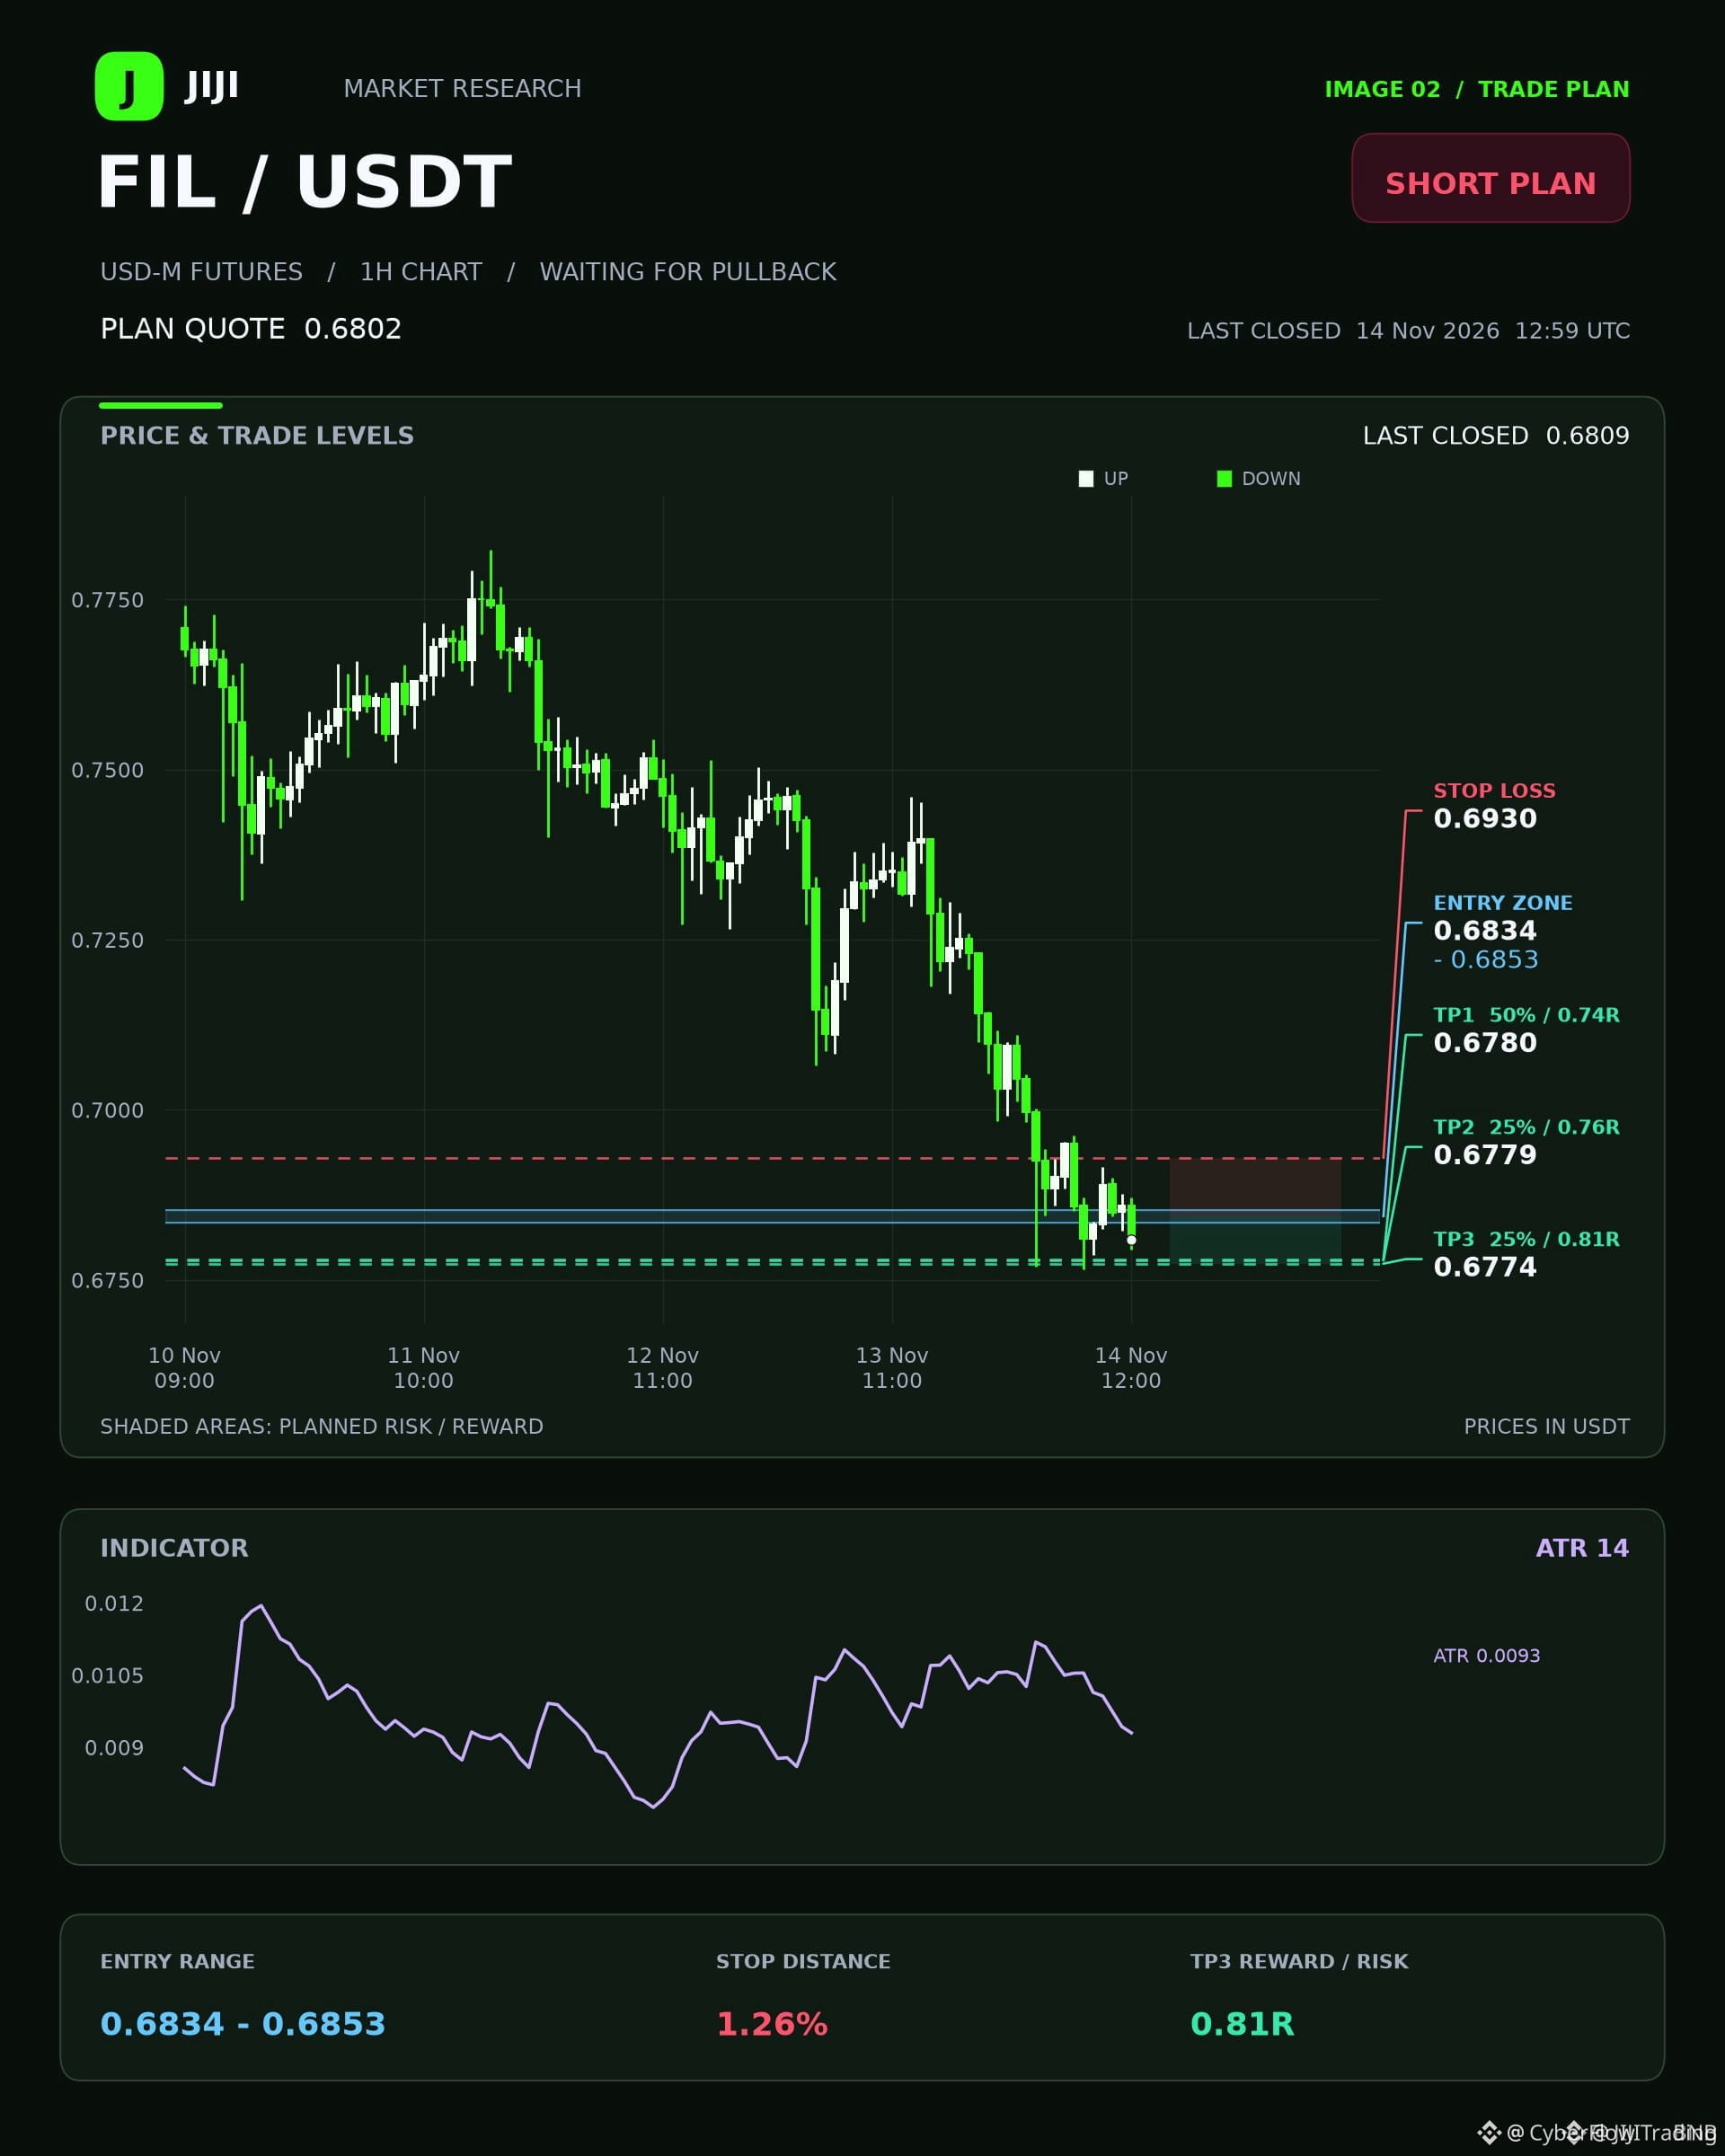
🚨 $FIL BEARISH 4H EMA STACK SIGNALS INSTITUTIONAL SHORT SETUP AWAITING PULLBACK 📉
Entry: 0.6834 - 0.6853 ⚡
Target: 0.6774 🚀
Stop Loss: 0.693 ⚠️
The structural landscape for $FIL remains firmly under distributor control with a clean bearish EMA stack on the higher timeframe. Price action is currently extended below the 50 EMA, suggesting an overdue mean reversion bounce into our distribution zone before institutional momentum resumes. 📊
With ADX measuring robust trend strength at 37.6 and the 1h RSI reflecting corrective pressure, patient positioning is key. We are stalking a reaction inside the upper band before committing capital to the downside sweep. 💡
💬 Are you waiting for the full retest into the zone or looking to fade the minor bounces early? 👇
⚠️ Not financial advice. Always manage your risk. 🛡️
🏷️ #FIL #ShortSetup #CryptoFutures #MarketStructure
📉 🦈
🚨 $FIL BEARISH 4H EMA STACK SIGNALS INSTITUTIONAL SHORT SETUP AWAITING PULLBACK 📉
Entry: 0.6834 - 0.6853 ⚡
Target: 0.6774 🚀
Stop Loss: 0.693 ⚠️
The structural landscape for $FIL remains firmly under distributor control with a clean bearish EMA stack on the higher timeframe. Price action is currently extended below the 50 EMA, suggesting an overdue mean reversion bounce into our distribution zone before institutional momentum resumes. 📊
With ADX measuring robust trend strength at 37.6 and the 1h RSI reflecting corrective pressure, patient positioning is key. We are stalking a reaction inside the upper band before committing capital to the downside sweep. 💡
💬 Are you waiting for the full retest into the zone or looking to fade the minor bounces early? 👇
⚠️ Not financial advice. Always manage your risk. 🛡️
🏷️ #FIL #ShortSetup #CryptoFutures #MarketStructure
📉 🦈
Entry: 0.6834 - 0.6853 ⚡
Target: 0.6774 🚀
Stop Loss: 0.693 ⚠️
The structural landscape for $FIL remains firmly under distributor control with a clean bearish EMA stack on the higher timeframe. Price action is currently extended below the 50 EMA, suggesting an overdue mean reversion bounce into our distribution zone before institutional momentum resumes. 📊
With ADX measuring robust trend strength at 37.6 and the 1h RSI reflecting corrective pressure, patient positioning is key. We are stalking a reaction inside the upper band before committing capital to the downside sweep. 💡
💬 Are you waiting for the full retest into the zone or looking to fade the minor bounces early? 👇
⚠️ Not financial advice. Always manage your risk. 🛡️
🏷️ #FIL #ShortSetup #CryptoFutures #MarketStructure
📉 🦈
40

·
--
🦈 $FIL AND $HBAR COLLATERAL RATIO UPGRADE REDEFINES MARGIN CAPACITY 📊
A major liquidity platform is elevating the collateral recognition for both $FIL and $HBAR from 50% to 60%, instantly expanding structural borrowing power without any organic spot demand. 💡 This technical adjustment means capital efficiency shifts overnight, allowing higher leverage utilization across active margin positions. ⚡
However, institutional risk management dictates that enhanced borrowing capacity is not an invitation for reckless exposure. Utilizing this expanded headroom without tightening risk parameters simply magnifies downside vulnerability if market structure shifts. 🌊
💬 Are you adjusting your margin buffers to capitalize on this upgrade, or keeping leverage strictly capped? 👇
⚠️ Not financial advice. Always manage your risk. 🛡️
🏷️ #FIL #HBAR #MarginTrading #RiskManagement #SmartMoney
🦈 ⚖️
🦈 $FIL AND $HBAR COLLATERAL RATIO UPGRADE REDEFINES MARGIN CAPACITY 📊
A major liquidity platform is elevating the collateral recognition for both $FIL and $HBAR from 50% to 60%, instantly expanding structural borrowing power without any organic spot demand. 💡 This technical adjustment means capital efficiency shifts overnight, allowing higher leverage utilization across active margin positions. ⚡
However, institutional risk management dictates that enhanced borrowing capacity is not an invitation for reckless exposure. Utilizing this expanded headroom without tightening risk parameters simply magnifies downside vulnerability if market structure shifts. 🌊
💬 Are you adjusting your margin buffers to capitalize on this upgrade, or keeping leverage strictly capped? 👇
⚠️ Not financial advice. Always manage your risk. 🛡️
🏷️ #FIL #HBAR #MarginTrading #RiskManagement #SmartMoney
🦈 ⚖️
A major liquidity platform is elevating the collateral recognition for both $FIL and $HBAR from 50% to 60%, instantly expanding structural borrowing power without any organic spot demand. 💡 This technical adjustment means capital efficiency shifts overnight, allowing higher leverage utilization across active margin positions. ⚡
However, institutional risk management dictates that enhanced borrowing capacity is not an invitation for reckless exposure. Utilizing this expanded headroom without tightening risk parameters simply magnifies downside vulnerability if market structure shifts. 🌊
💬 Are you adjusting your margin buffers to capitalize on this upgrade, or keeping leverage strictly capped? 👇
⚠️ Not financial advice. Always manage your risk. 🛡️
🏷️ #FIL #HBAR #MarginTrading #RiskManagement #SmartMoney
🦈 ⚖️

18


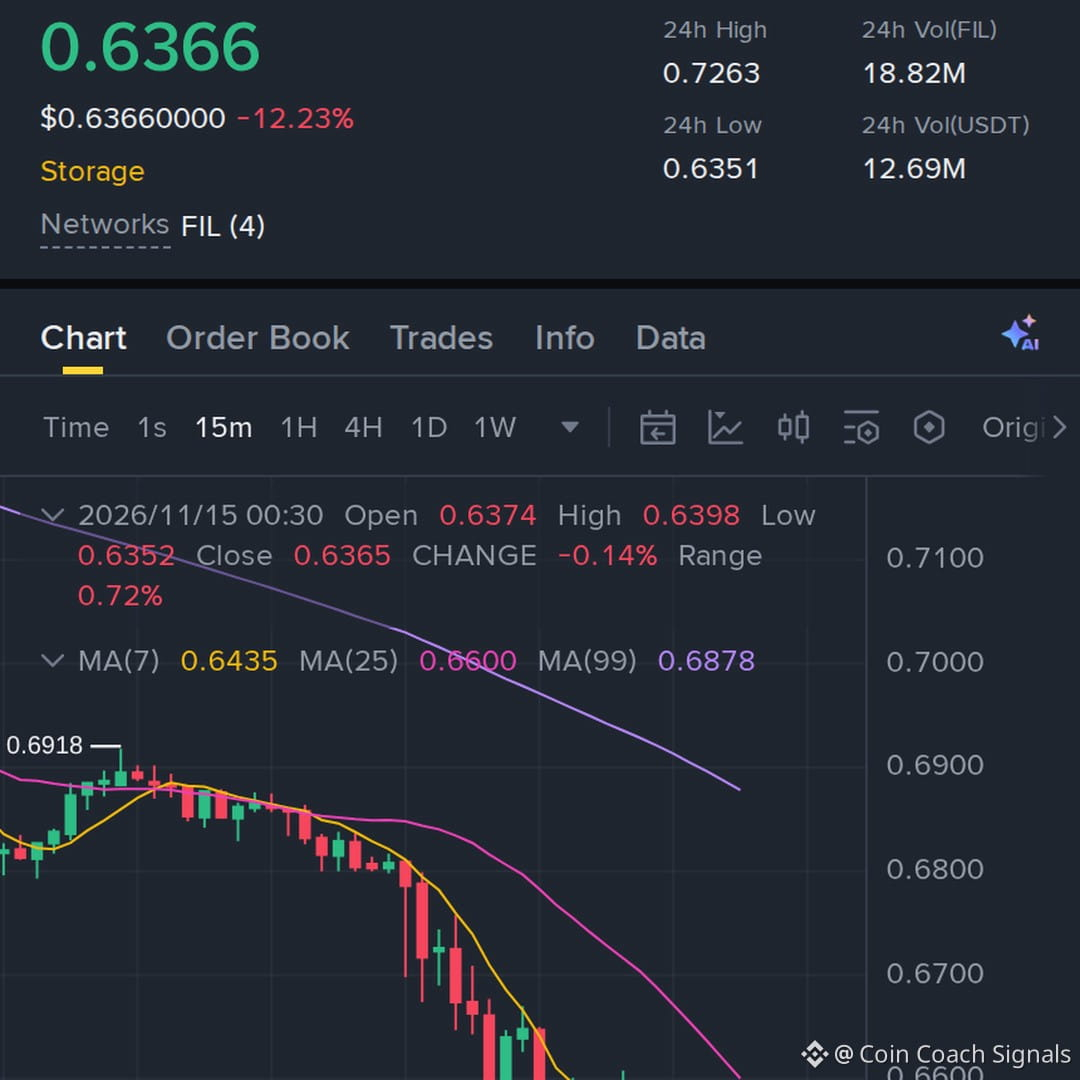
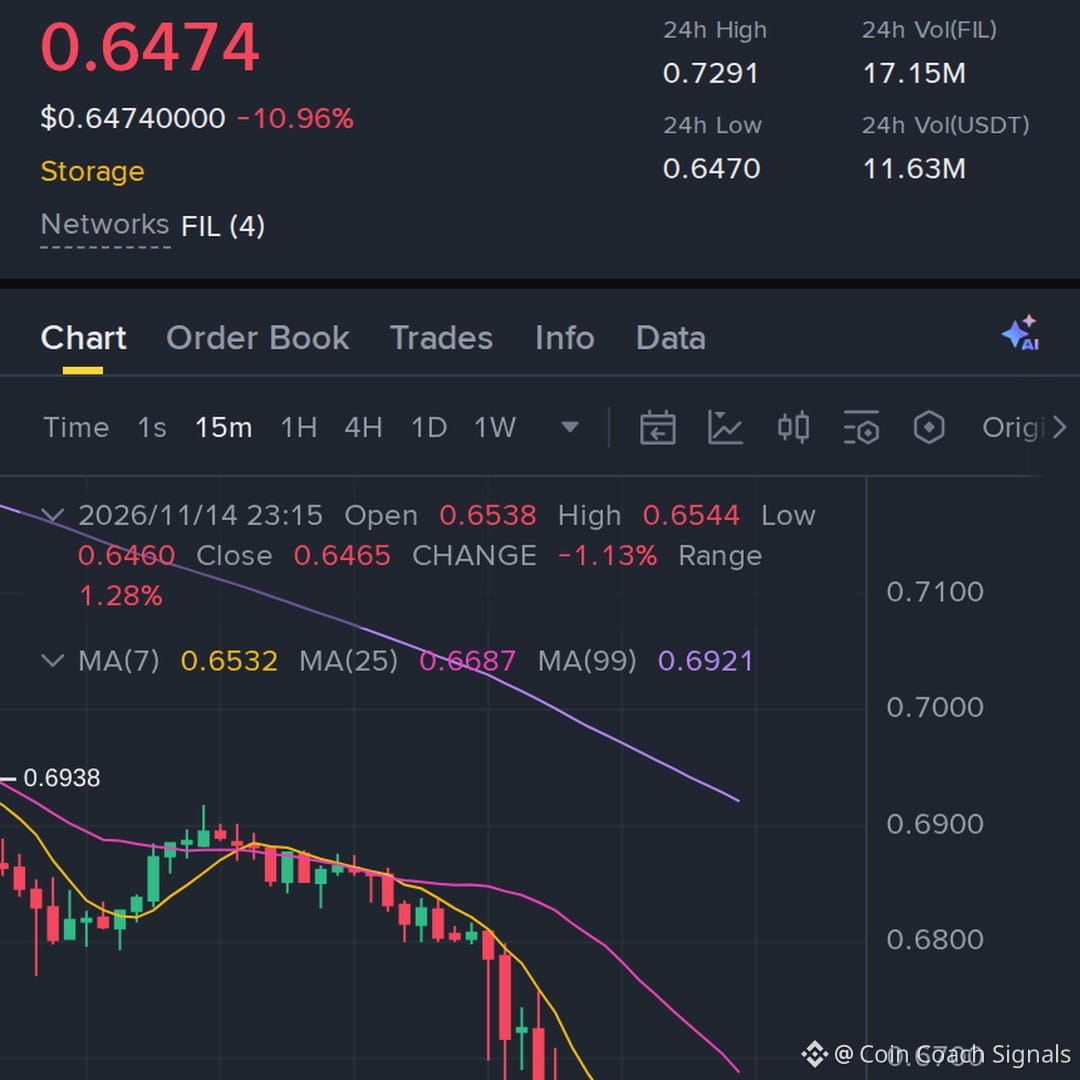
this is getting interesting, $FIL just rejected again, so the short side makes more sense here, keeping this setup around 41x
Entry: 0.6364–0.6383 | TP1: 0.6182 / TP2: 0.6023 / TP3: 0.5864 | Stop Loss: 0.6623
#FIL #Write2Earn #binance #Crypto
this is getting interesting, $FIL just rejected again, so the short side makes more sense here, keeping this setup around 41x
Entry: 0.6364–0.6383 | TP1: 0.6182 / TP2: 0.6023 / TP3: 0.5864 | Stop Loss: 0.6623
#FIL #Write2Earn #binance #Crypto
Entry: 0.6364–0.6383 | TP1: 0.6182 / TP2: 0.6023 / TP3: 0.5864 | Stop Loss: 0.6623
#FIL #Write2Earn #binance #Crypto
149


🔴 $FIL BEARISH MOMENTUM BUILDING AS SELLERS STACK THE ORDER BOOK! 📉
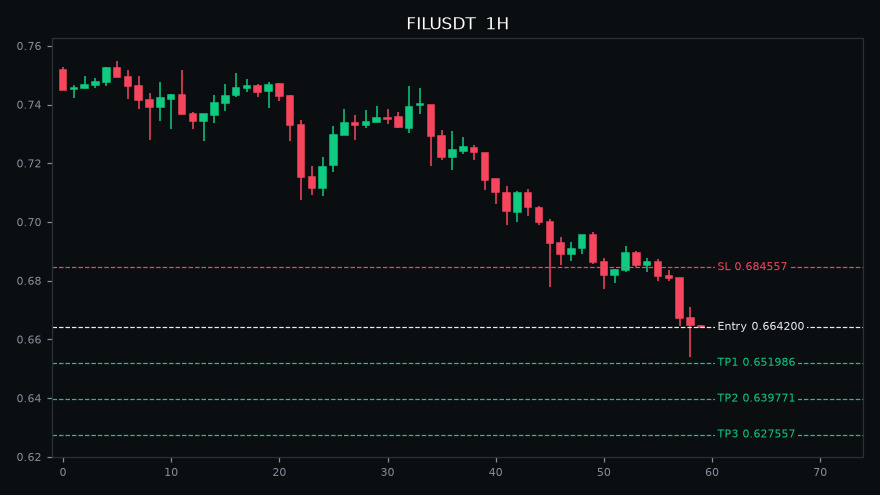
Entry: 0.6834 - 0.6853 ⚡
Target: 0.6774 🚀
Stop Loss: 0.693 ⚠️
Bears are firmly in control of the trend structure with a heavily stacked bearish moving average on the higher timeframe. 📊 Price is currently stretched away from the hourly average, signalling an impending relief bounce before the next leg down. ⚡
Patience is key here to catch the pullback into our resistance zone rather than chasing the sweep directly. 🔍 Are you positioning for the continuation downward or waiting for confirmation on the lower timeframe? 👇
⚠️ Not financial advice. Always manage your risk. 🛡️
🏷️ #FIL #ShortSetup #Crypto #Trading
🔴 📉
🔴 $FIL BEARISH MOMENTUM BUILDING AS SELLERS STACK THE ORDER BOOK! 📉
Entry: 0.6834 - 0.6853 ⚡
Target: 0.6774 🚀
Stop Loss: 0.693 ⚠️
Bears are firmly in control of the trend structure with a heavily stacked bearish moving average on the higher timeframe. 📊 Price is currently stretched away from the hourly average, signalling an impending relief bounce before the next leg down. ⚡
Patience is key here to catch the pullback into our resistance zone rather than chasing the sweep directly. 🔍 Are you positioning for the continuation downward or waiting for confirmation on the lower timeframe? 👇
⚠️ Not financial advice. Always manage your risk. 🛡️
🏷️ #FIL #ShortSetup #Crypto #Trading
🔴 📉
Entry: 0.6834 - 0.6853 ⚡
Target: 0.6774 🚀
Stop Loss: 0.693 ⚠️
Bears are firmly in control of the trend structure with a heavily stacked bearish moving average on the higher timeframe. 📊 Price is currently stretched away from the hourly average, signalling an impending relief bounce before the next leg down. ⚡
Patience is key here to catch the pullback into our resistance zone rather than chasing the sweep directly. 🔍 Are you positioning for the continuation downward or waiting for confirmation on the lower timeframe? 👇
⚠️ Not financial advice. Always manage your risk. 🛡️
🏷️ #FIL #ShortSetup #Crypto #Trading
🔴 📉
35

·
--
$FIL looks ready to bounce up from here 🚀
Recent low sits at $0.67710 which makes stopping out very cheap
Buying $FIL between 0.67978 and 0.68631
Invalid below 0.67275
Taking profit at 0.70338 0.71563 0.73401
Trading volume is normal at $4.9M with price down 6.9 percent
One hour RSI is low at 33 showing sellers are tired
Sitting inside the zone as I type this
Tap $FIL to buy
Last 7 days of my calls, 37 hit target and 102 hit stop
Taking it or watching it
#FIL #TradingSignals
$FIL looks ready to bounce up from here 🚀
Recent low sits at $0.67710 which makes stopping out very cheap
Buying $FIL between 0.67978 and 0.68631
Invalid below 0.67275
Taking profit at 0.70338 0.71563 0.73401
Trading volume is normal at $4.9M with price down 6.9 percent
One hour RSI is low at 33 showing sellers are tired
Sitting inside the zone as I type this
Tap $FIL to buy
Last 7 days of my calls, 37 hit target and 102 hit stop
Taking it or watching it
#FIL #TradingSignals
Recent low sits at $0.67710 which makes stopping out very cheap
Buying $FIL between 0.67978 and 0.68631
Invalid below 0.67275
Taking profit at 0.70338 0.71563 0.73401
Trading volume is normal at $4.9M with price down 6.9 percent
One hour RSI is low at 33 showing sellers are tired
Sitting inside the zone as I type this
Tap $FIL to buy
Last 7 days of my calls, 37 hit target and 102 hit stop
Taking it or watching it
#FIL #TradingSignals
26

·
--
Bullish
$FIL — LONG (3x leverage)
Entry: $0.720 – $0.728
SL: $0.711
TP1: $0.737
TP2: $0.746
TP3: $0.755
#FIL #Filecoin #BinanceFutures $FIL
{future}(FILUSDT)
$FIL — LONG (3x leverage)
Entry: $0.720 – $0.728
SL: $0.711
TP1: $0.737
TP2: $0.746
TP3: $0.755
#FIL #Filecoin #BinanceFutures $FIL
Entry: $0.720 – $0.728
SL: $0.711
TP1: $0.737
TP2: $0.746
TP3: $0.755
#FIL #Filecoin #BinanceFutures $FIL
23

·
--
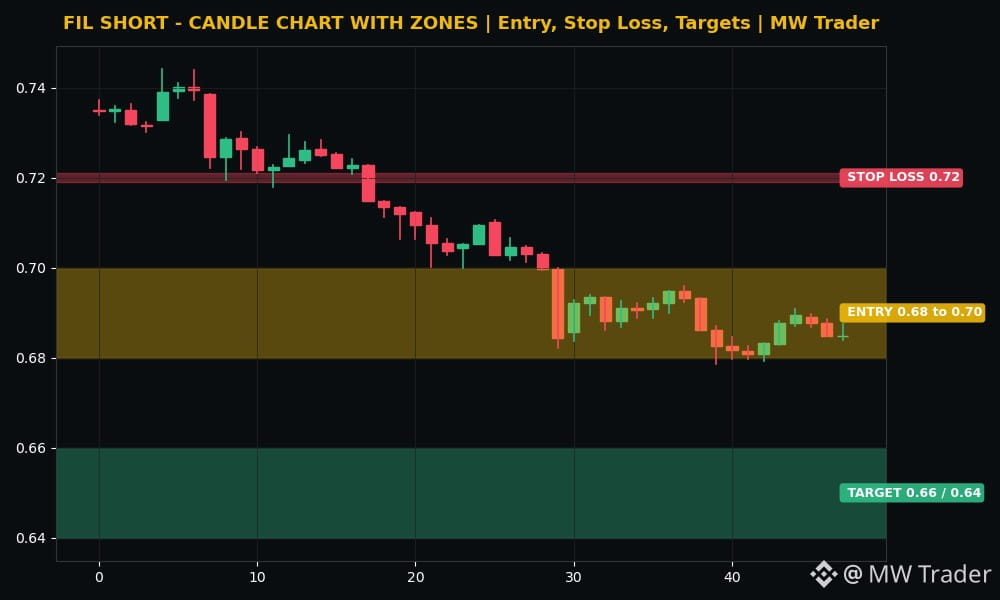
$FIL #FIL SHORT setup, Filecoin is the weakest coin in this batch and the tape is heavy. 📉
Direction: SHORT
Entry zone: 0.68 to 0.70
Stop loss: 0.72
Target 1: 0.66
Target 2: 0.64
CoinGecko data checked at 17:00 PKT puts Filecoin near 0.687 dollars, down 6.61 percent in 24 hours, with the 24 hour range from 0.679 to 0.744 dollars and the last 30 minute close at 0.685. 🔴 The chart shows real candles with the entry zone, stop loss line and target zones marked, and FIL fell harder than almost every large cap today, which is the pattern of a coin with no buyers in a fear market, so the short stays valid while price holds under 0.72. Futures trading is risky, trade small, manage risk, do your own research.
Does Filecoin hold 0.68 dollars here, or slide to 0.64 first? 🤔
Follow for more trades.
#Filecoin #Crypto #FuturesTrading #TradingSignals
$FIL #FIL SHORT setup, Filecoin is the weakest coin in this batch and the tape is heavy. 📉
Direction: SHORT
Entry zone: 0.68 to 0.70
Stop loss: 0.72
Target 1: 0.66
Target 2: 0.64
CoinGecko data checked at 17:00 PKT puts Filecoin near 0.687 dollars, down 6.61 percent in 24 hours, with the 24 hour range from 0.679 to 0.744 dollars and the last 30 minute close at 0.685. 🔴 The chart shows real candles with the entry zone, stop loss line and target zones marked, and FIL fell harder than almost every large cap today, which is the pattern of a coin with no buyers in a fear market, so the short stays valid while price holds under 0.72. Futures trading is risky, trade small, manage risk, do your own research.
Does Filecoin hold 0.68 dollars here, or slide to 0.64 first? 🤔
Follow for more trades.
#Filecoin #Crypto #FuturesTrading #TradingSignals
Direction: SHORT
Entry zone: 0.68 to 0.70
Stop loss: 0.72
Target 1: 0.66
Target 2: 0.64
CoinGecko data checked at 17:00 PKT puts Filecoin near 0.687 dollars, down 6.61 percent in 24 hours, with the 24 hour range from 0.679 to 0.744 dollars and the last 30 minute close at 0.685. 🔴 The chart shows real candles with the entry zone, stop loss line and target zones marked, and FIL fell harder than almost every large cap today, which is the pattern of a coin with no buyers in a fear market, so the short stays valid while price holds under 0.72. Futures trading is risky, trade small, manage risk, do your own research.
Does Filecoin hold 0.68 dollars here, or slide to 0.64 first? 🤔
Follow for more trades.
#Filecoin #Crypto #FuturesTrading #TradingSignals
31

·
--
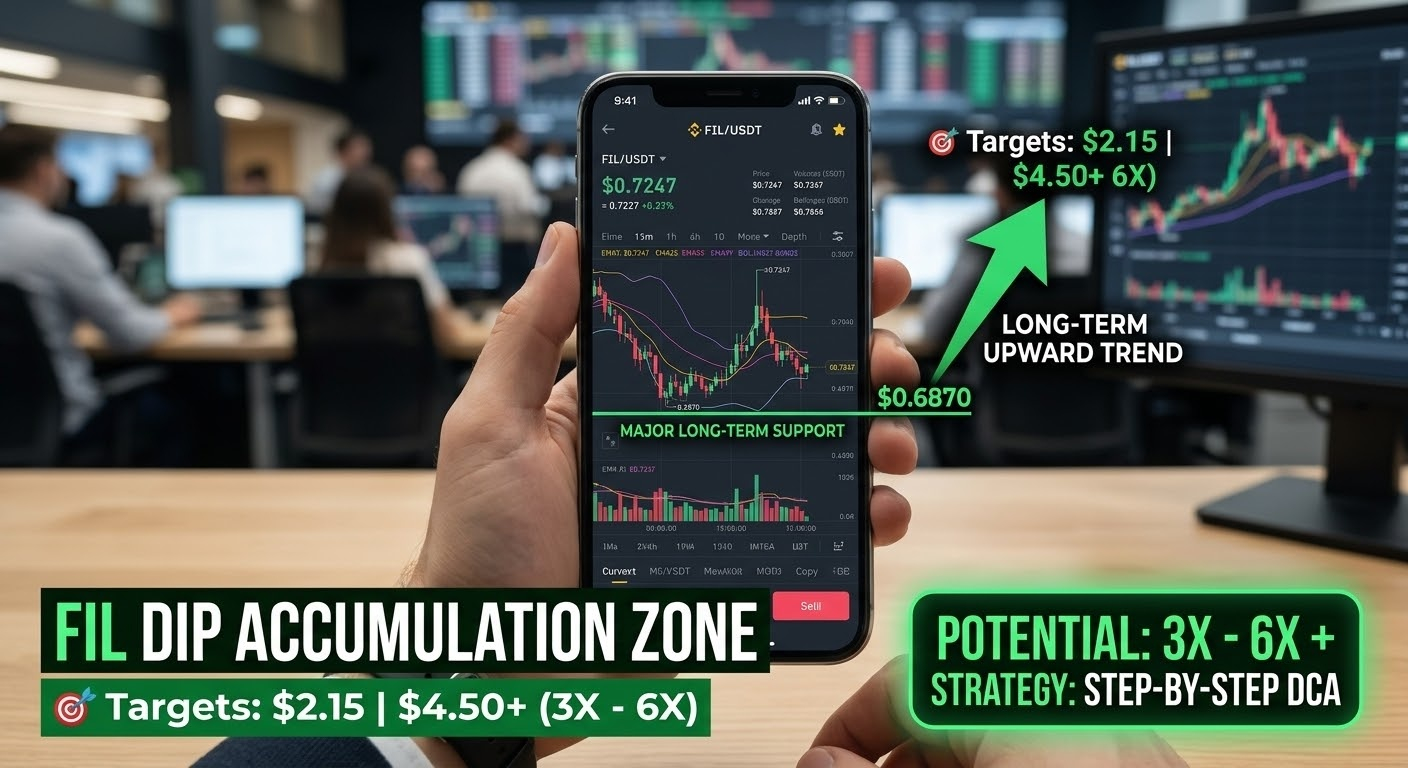
🔥 $FIL Deep Accumulation Floor: A Quiet 3X–6X Blueprint Unfolding? 🧠⚡
Hey Traders! While the macro market is correcting sharply, seasoned eyes are focused on established utility projects sitting on their historical floors.
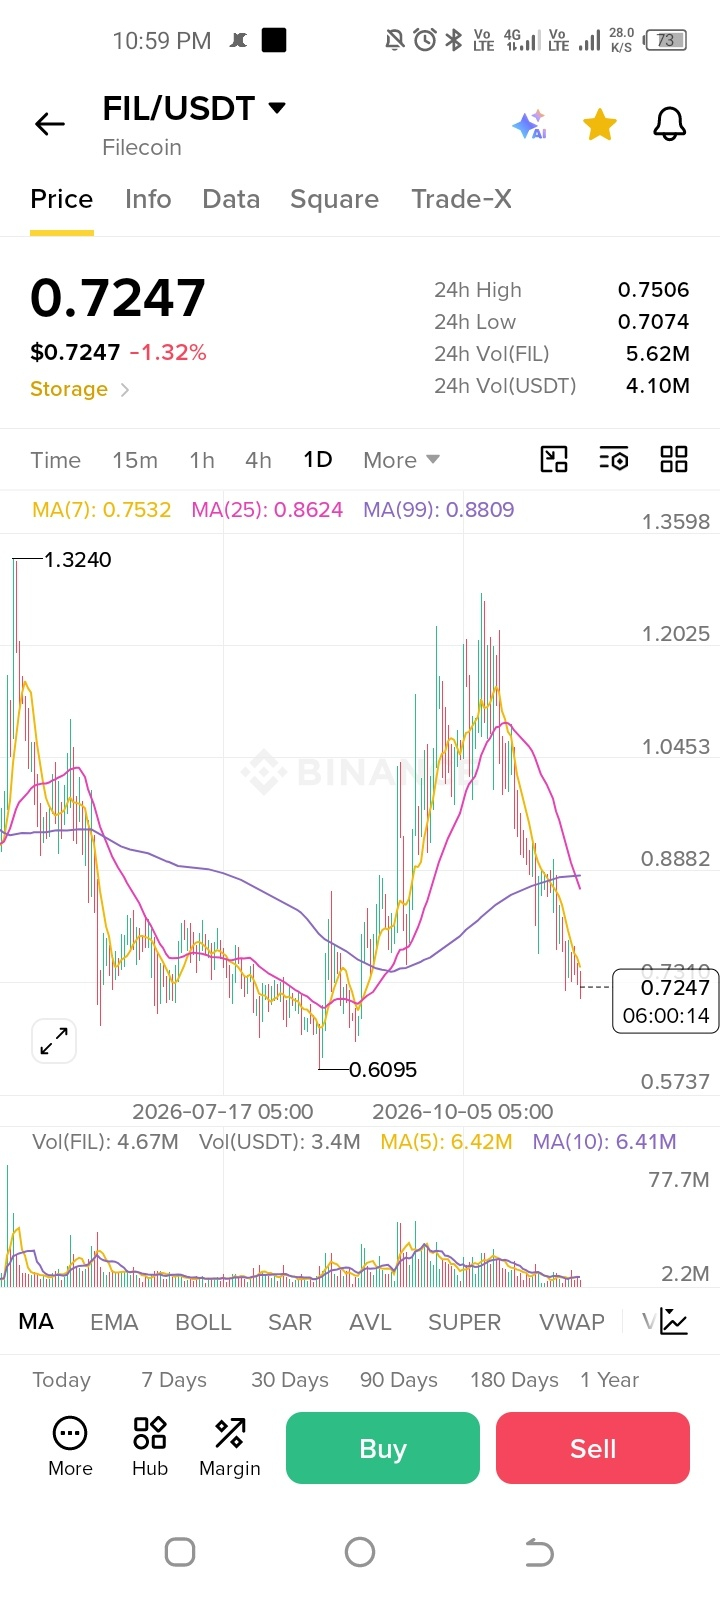
$FIL is trading at a critical historical bottom, with its major long-term support floor resting firmly around the $0.6870 zone. For patient DCA (Dollar Cost Averaging) investors, this quiet consolidation phase often represents a low-risk, high-reward entry range.
Technical Breakdown:
Support: $0.6870 (Ultimate long-term floor)
Target 1: $2.15 (Next major intermediate resistance)
Target 2: $4.50+ (6X Potential) - A clean long-term recovery pathway
My Strategy: Step-by-Step DCA in this red zone. Manage your risk, and protect your reserve capital—never catch falling knives blindly! The biggest rewards go to the most patient accumulation minds!
💡 Are you buying this FIL dip or waiting for a confirmation pump? Let’s discuss your entry levels below! 👇
#Filecoin #FIL #CryptoAnalysis #BinanceSquare #BybitSquare #RiskManagement #DCA
🔥 $FIL Deep Accumulation Floor: A Quiet 3X–6X Blueprint Unfolding? 🧠⚡
Hey Traders! While the macro market is correcting sharply, seasoned eyes are focused on established utility projects sitting on their historical floors.
$FIL is trading at a critical historical bottom, with its major long-term support floor resting firmly around the $0.6870 zone. For patient DCA (Dollar Cost Averaging) investors, this quiet consolidation phase often represents a low-risk, high-reward entry range.
Technical Breakdown:
Support: $0.6870 (Ultimate long-term floor)
Target 1: $2.15 (Next major intermediate resistance)
Target 2: $4.50+ (6X Potential) - A clean long-term recovery pathway
My Strategy: Step-by-Step DCA in this red zone. Manage your risk, and protect your reserve capital—never catch falling knives blindly! The biggest rewards go to the most patient accumulation minds!
💡 Are you buying this FIL dip or waiting for a confirmation pump? Let’s discuss your entry levels below! 👇
#Filecoin #FIL #CryptoAnalysis #BinanceSquare #BybitSquare #RiskManagement #DCA
Hey Traders! While the macro market is correcting sharply, seasoned eyes are focused on established utility projects sitting on their historical floors.
$FIL is trading at a critical historical bottom, with its major long-term support floor resting firmly around the $0.6870 zone. For patient DCA (Dollar Cost Averaging) investors, this quiet consolidation phase often represents a low-risk, high-reward entry range.
Technical Breakdown:
Support: $0.6870 (Ultimate long-term floor)
Target 1: $2.15 (Next major intermediate resistance)
Target 2: $4.50+ (6X Potential) - A clean long-term recovery pathway
My Strategy: Step-by-Step DCA in this red zone. Manage your risk, and protect your reserve capital—never catch falling knives blindly! The biggest rewards go to the most patient accumulation minds!
💡 Are you buying this FIL dip or waiting for a confirmation pump? Let’s discuss your entry levels below! 👇
#Filecoin #FIL #CryptoAnalysis #BinanceSquare #BybitSquare #RiskManagement #DCA
678

·
--
🚨 MASSIVE SHORT TRAP TRIGGERED ON $FIL! AGGRESSIVE BUY PRESSURE EXPLODING RIGHT NOW!
Look at the tape: CVD divergence is screaming institutional accumulation while late bears get absorbed at key support. Sell-side liquidity just vanished into thin air.
Price sits right at a lethal inflection zone. Whales are actively sweeping retail stops before a brutal expansion upward. DO NOT GET LEFT BEHIND ON THIS MOVE.
EXECUTION PLAN:
ENTRY: 0.7054 $FIL
SL: 0.6963
TP1: 0.7250
TP2: 0.7460
RR: 4.47:1
Are bears walking into a massive squeeze, or can sellers force a breakdown below 0.6960? Drop your bias below!
#FIL #BinanceSquare #SlowSclap #TradingAnalysis
🚨 MASSIVE SHORT TRAP TRIGGERED ON $FIL ! AGGRESSIVE BUY PRESSURE EXPLODING RIGHT NOW!
Look at the tape: CVD divergence is screaming institutional accumulation while late bears get absorbed at key support. Sell-side liquidity just vanished into thin air.
Price sits right at a lethal inflection zone. Whales are actively sweeping retail stops before a brutal expansion upward. DO NOT GET LEFT BEHIND ON THIS MOVE.
EXECUTION PLAN:
ENTRY: 0.7054 $FIL
SL: 0.6963
TP1: 0.7250
TP2: 0.7460
RR: 4.47:1
Are bears walking into a massive squeeze, or can sellers force a breakdown below 0.6960? Drop your bias below!
#FIL #BinanceSquare #SlowSclap #TradingAnalysis
Look at the tape: CVD divergence is screaming institutional accumulation while late bears get absorbed at key support. Sell-side liquidity just vanished into thin air.
Price sits right at a lethal inflection zone. Whales are actively sweeping retail stops before a brutal expansion upward. DO NOT GET LEFT BEHIND ON THIS MOVE.
EXECUTION PLAN:
ENTRY: 0.7054 $FIL
SL: 0.6963
TP1: 0.7250
TP2: 0.7460
RR: 4.47:1
Are bears walking into a massive squeeze, or can sellers force a breakdown below 0.6960? Drop your bias below!
#FIL #BinanceSquare #SlowSclap #TradingAnalysis
87

·
--
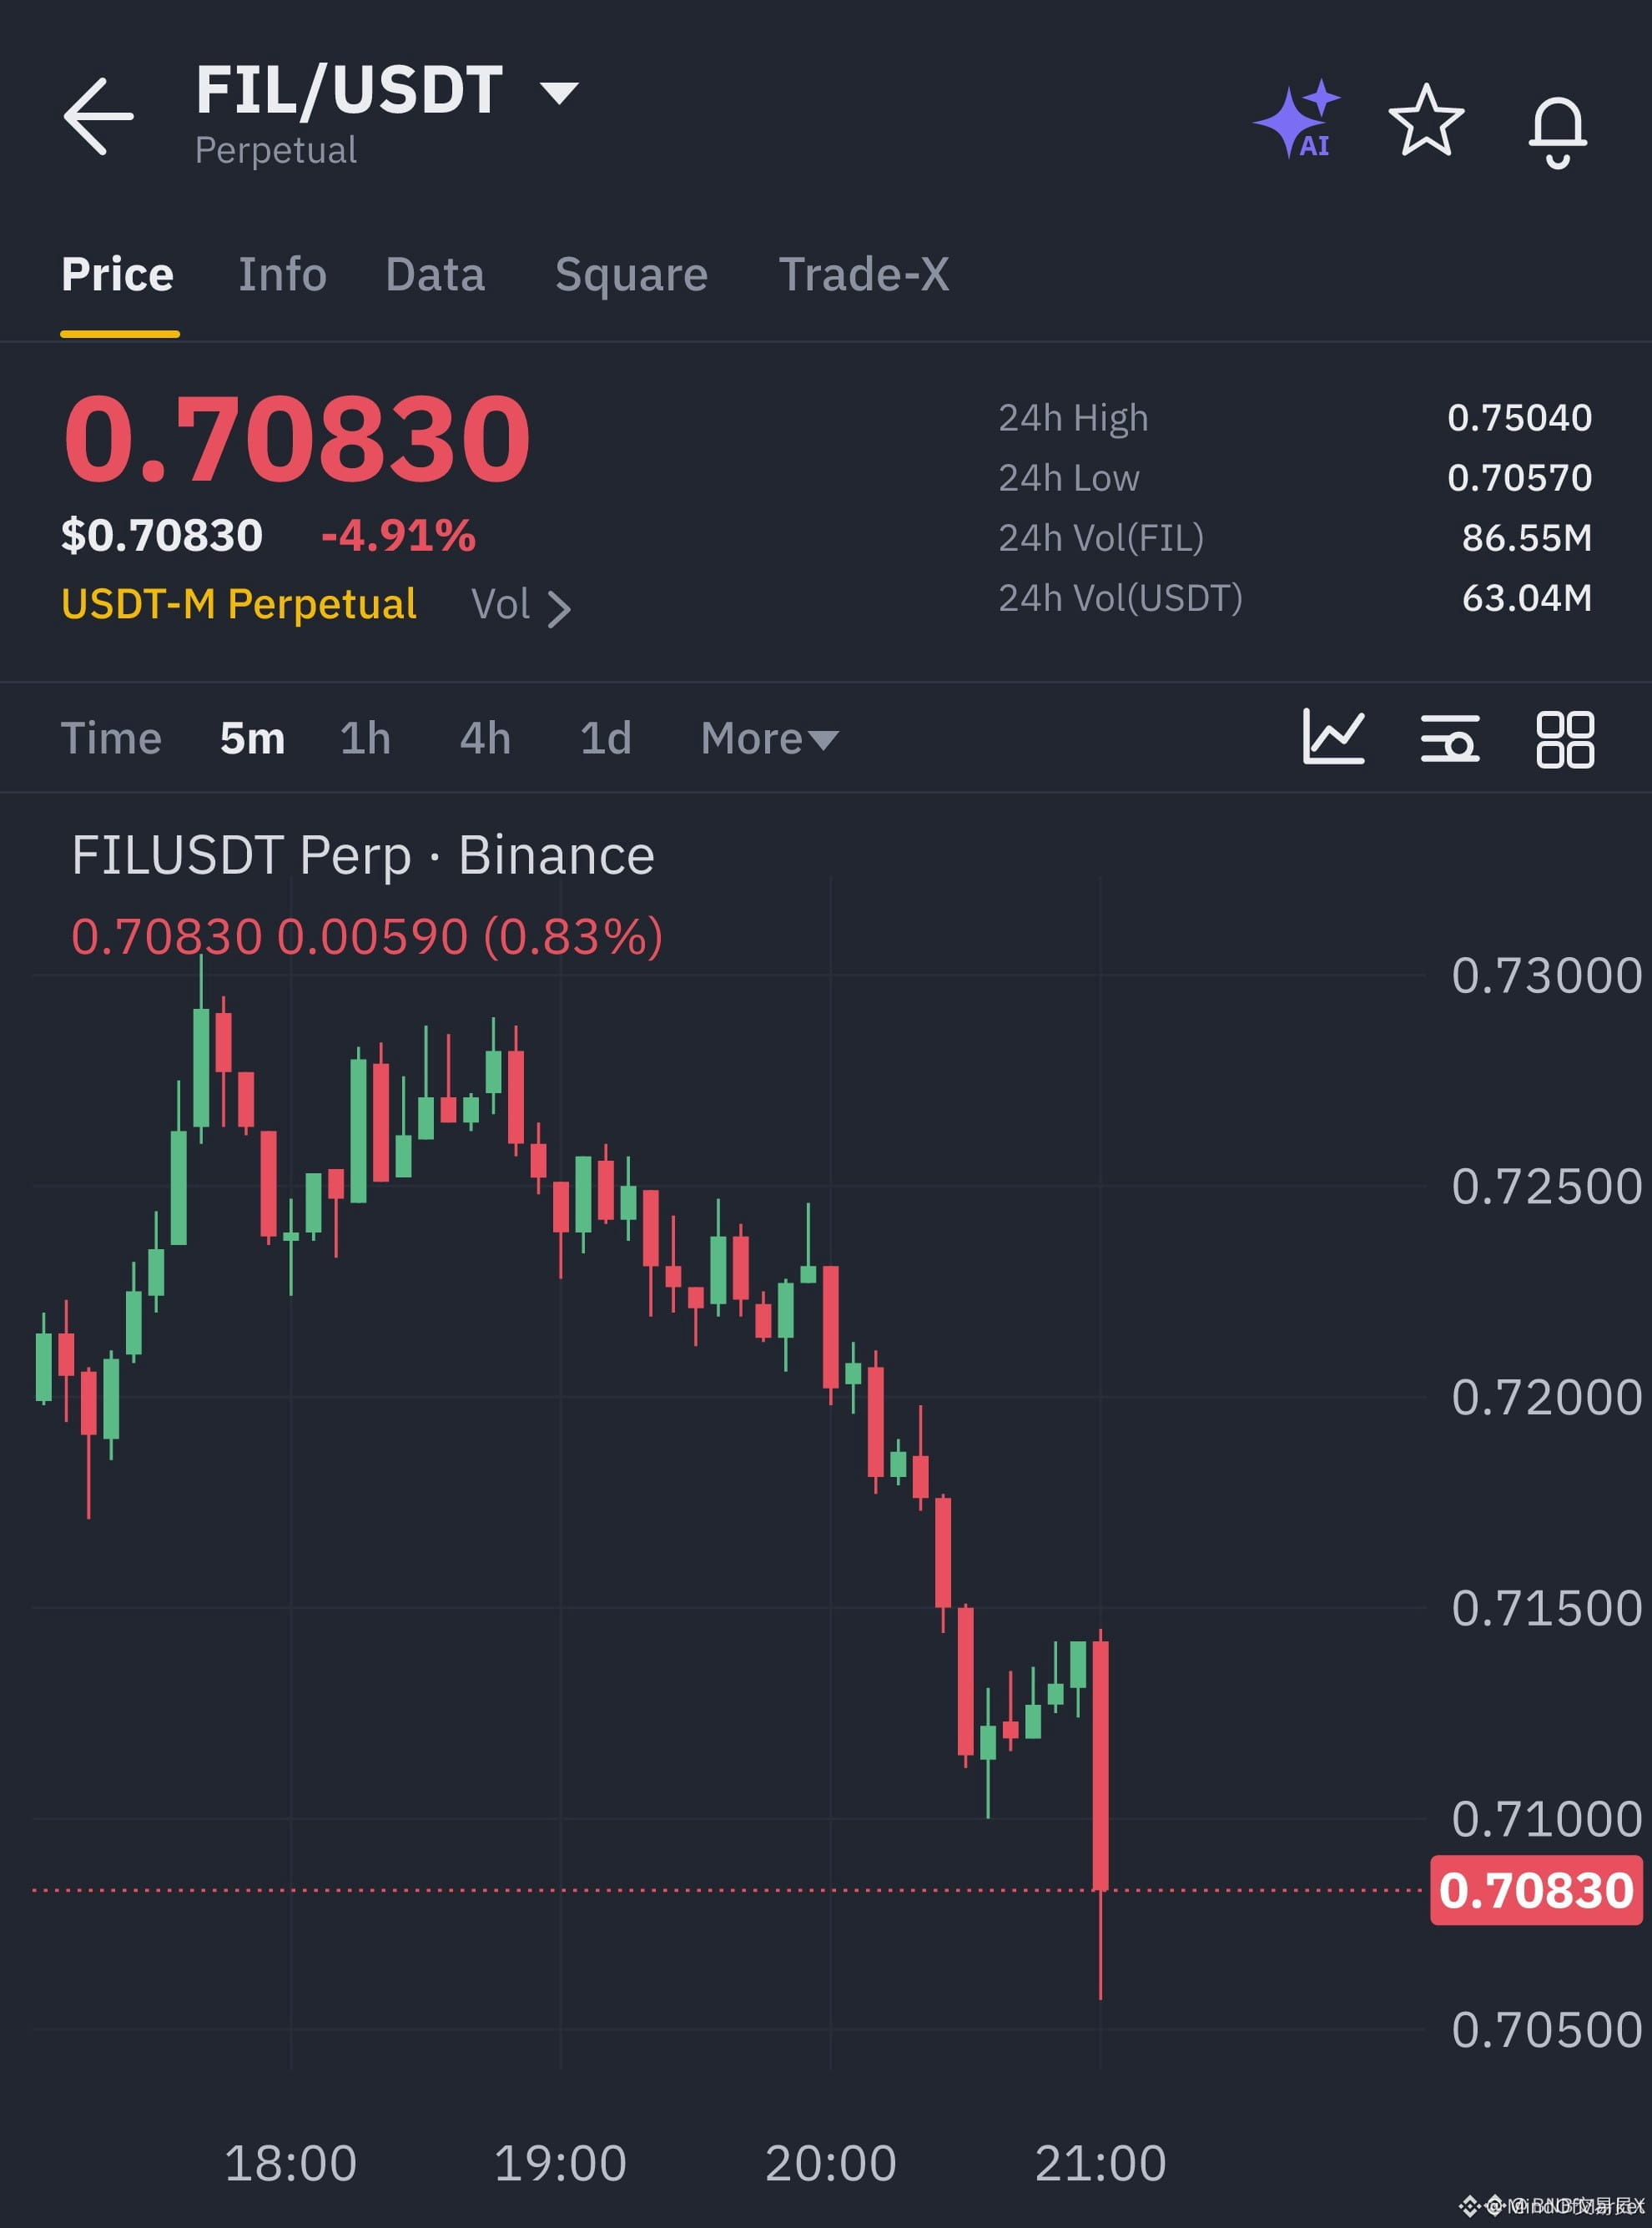
🦈 $FIL SHORT LIQUIDITY HUNT DELIVERS A PRISTINE PURGE ACROSS ALL TARGETS! 📉
Entry: 0.723200 ⚡
Target: 0.706511 🎯
Smart money distribution dominated the order flow as sellers aggressively tapped into institutional supply at the 0.723200 threshold. Price action cleanly swept resting liquidity pools downward, validating the structural shift and executing all targets down to 0.706511 with clinical precision. 📊
Patience in waiting for optimal retests of high timeframe inefficiencies consistently separates disciplined execution from chasing noise in volatile market conditions. 💡
Are you positioning for the next structural sweep on $INJ or $NEAR next? 👇
⚠️ Not financial advice. Always manage your risk. 🛡️
🏷️ #FIL #ShortSetup #LiquidityHunt #Crypto
🔥 🦈
🦈 $FIL SHORT LIQUIDITY HUNT DELIVERS A PRISTINE PURGE ACROSS ALL TARGETS! 📉
Entry: 0.723200 ⚡
Target: 0.706511 🎯
Smart money distribution dominated the order flow as sellers aggressively tapped into institutional supply at the 0.723200 threshold. Price action cleanly swept resting liquidity pools downward, validating the structural shift and executing all targets down to 0.706511 with clinical precision. 📊
Patience in waiting for optimal retests of high timeframe inefficiencies consistently separates disciplined execution from chasing noise in volatile market conditions. 💡
Are you positioning for the next structural sweep on $INJ or $NEAR next? 👇
⚠️ Not financial advice. Always manage your risk. 🛡️
🏷️ #FIL #ShortSetup #LiquidityHunt #Crypto
🔥 🦈
Entry: 0.723200 ⚡
Target: 0.706511 🎯
Smart money distribution dominated the order flow as sellers aggressively tapped into institutional supply at the 0.723200 threshold. Price action cleanly swept resting liquidity pools downward, validating the structural shift and executing all targets down to 0.706511 with clinical precision. 📊
Patience in waiting for optimal retests of high timeframe inefficiencies consistently separates disciplined execution from chasing noise in volatile market conditions. 💡
Are you positioning for the next structural sweep on $INJ or $NEAR next? 👇
⚠️ Not financial advice. Always manage your risk. 🛡️
🏷️ #FIL #ShortSetup #LiquidityHunt #Crypto
🔥 🦈
12

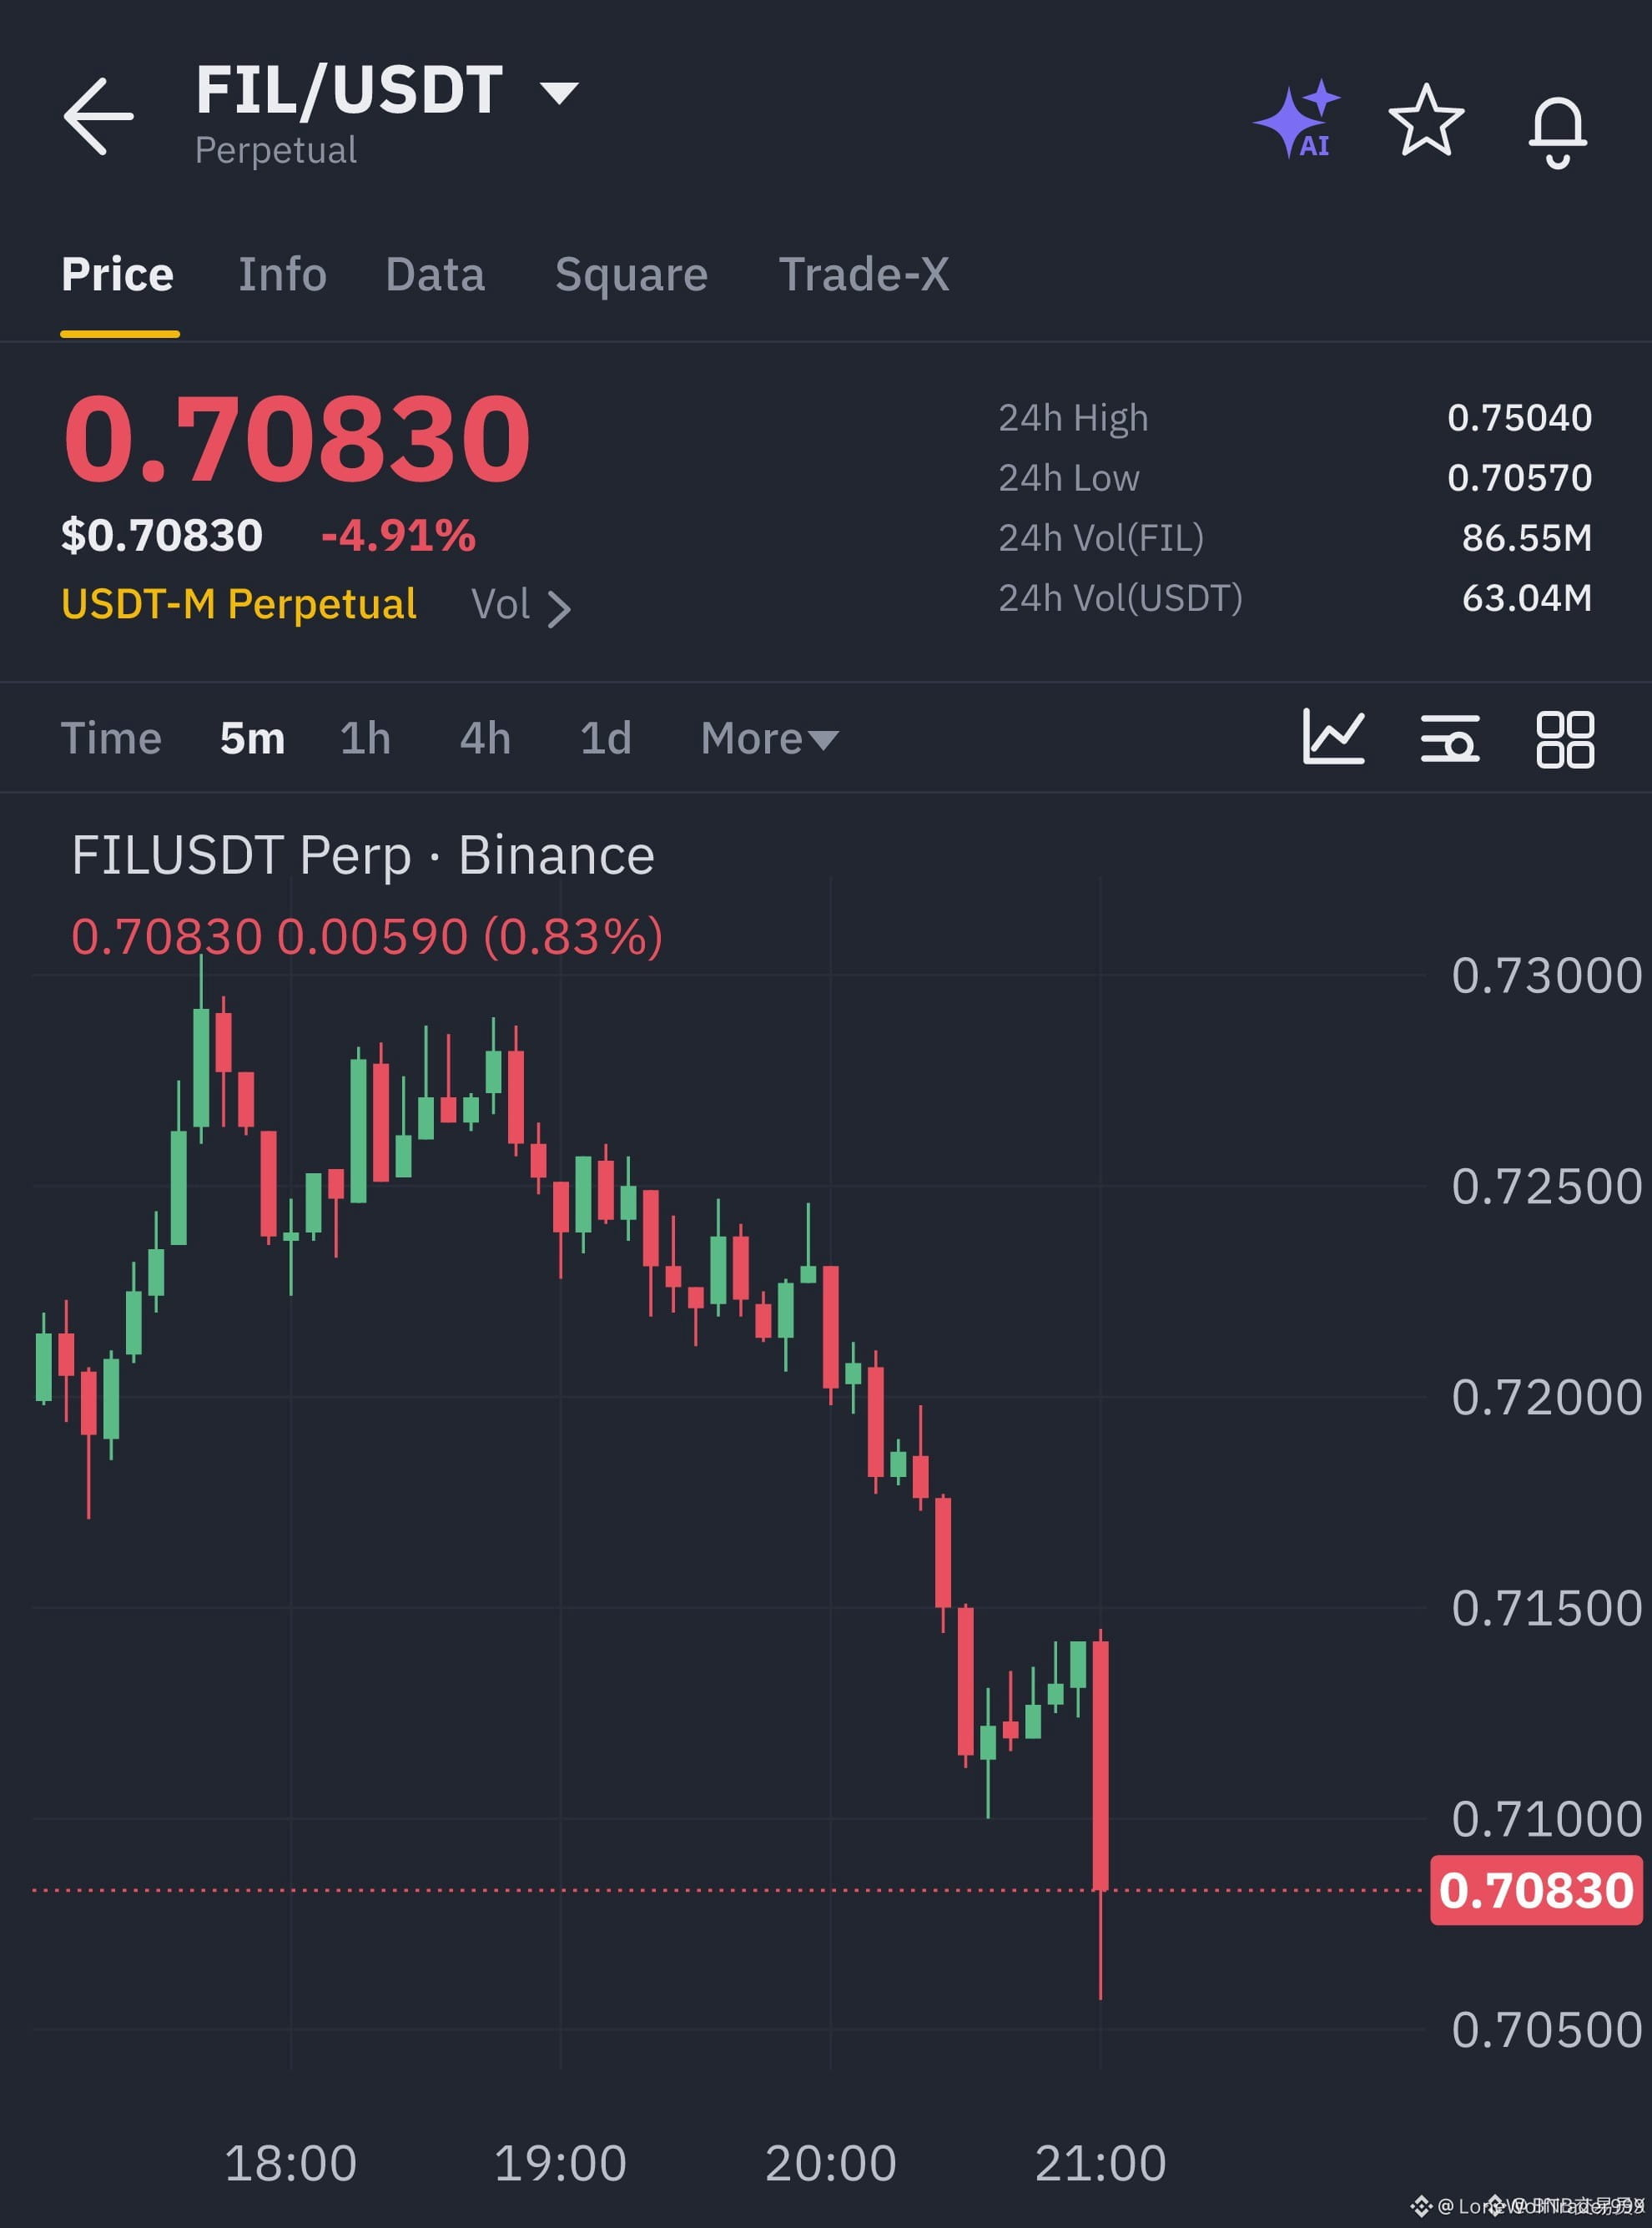
$FIL SHORT SETUP HITS EVERY SINGLE TARGET WITH SURGICAL PRECISION! 📉 🎯
Entry: 0.723200 ⚡
Target: 0.706511 🎯
Bears carved out a textbook masterclass here, sliding straight through the order blocks down to the final liquidity pocket. When momentum tilts and volume confirms the breakdown, patient positioning beats chasing every single time. 📊
Watching correlated assets like $INJ and $NEAR for similar structural exhaustion points as the broader market finds its next major inflection zone. 💡
💬 Are you locking in profits on these macro retracements or holding out for deeper downside expansion? 👇
⚠️ Not financial advice. Always manage your risk. 🛡️
🏷️ #FIL #ShortSetup #PriceAction #Crypto
📉 💎
$FIL SHORT SETUP HITS EVERY SINGLE TARGET WITH SURGICAL PRECISION! 📉 🎯
Entry: 0.723200 ⚡
Target: 0.706511 🎯
Bears carved out a textbook masterclass here, sliding straight through the order blocks down to the final liquidity pocket. When momentum tilts and volume confirms the breakdown, patient positioning beats chasing every single time. 📊
Watching correlated assets like $INJ and $NEAR for similar structural exhaustion points as the broader market finds its next major inflection zone. 💡
💬 Are you locking in profits on these macro retracements or holding out for deeper downside expansion? 👇
⚠️ Not financial advice. Always manage your risk. 🛡️
🏷️ #FIL #ShortSetup #PriceAction #Crypto
📉 💎
Entry: 0.723200 ⚡
Target: 0.706511 🎯
Bears carved out a textbook masterclass here, sliding straight through the order blocks down to the final liquidity pocket. When momentum tilts and volume confirms the breakdown, patient positioning beats chasing every single time. 📊
Watching correlated assets like $INJ and $NEAR for similar structural exhaustion points as the broader market finds its next major inflection zone. 💡
💬 Are you locking in profits on these macro retracements or holding out for deeper downside expansion? 👇
⚠️ Not financial advice. Always manage your risk. 🛡️
🏷️ #FIL #ShortSetup #PriceAction #Crypto
📉 💎
14

·
--
⚔️ $FIL vs $GRT: which one wins?
🔹 $FIL: a decentralized storage network where providers earn FIL. Max supply is 2B.
🔹 $GRT: The Graph is an indexing layer that organizes blockchain data for dApps.
📊 FIL stores data. GRT makes data searchable.
⚠️ Both need real usage growth to justify their valuations.
$FIL or $GRT? 👇
Not financial advice. DYOR.
#FIL #GRT #Binance
⚔️ $FIL vs $GRT : which one wins?
🔹 $FIL : a decentralized storage network where providers earn FIL. Max supply is 2B.
🔹 $GRT : The Graph is an indexing layer that organizes blockchain data for dApps.
📊 FIL stores data. GRT makes data searchable.
⚠️ Both need real usage growth to justify their valuations.
$FIL or $GRT ? 👇
Not financial advice. DYOR.
#FIL #GRT #Binance
🔹 $FIL : a decentralized storage network where providers earn FIL. Max supply is 2B.
🔹 $GRT : The Graph is an indexing layer that organizes blockchain data for dApps.
📊 FIL stores data. GRT makes data searchable.
⚠️ Both need real usage growth to justify their valuations.
$FIL or $GRT ? 👇
Not financial advice. DYOR.
#FIL #GRT #Binance

3
2.3k

·
--
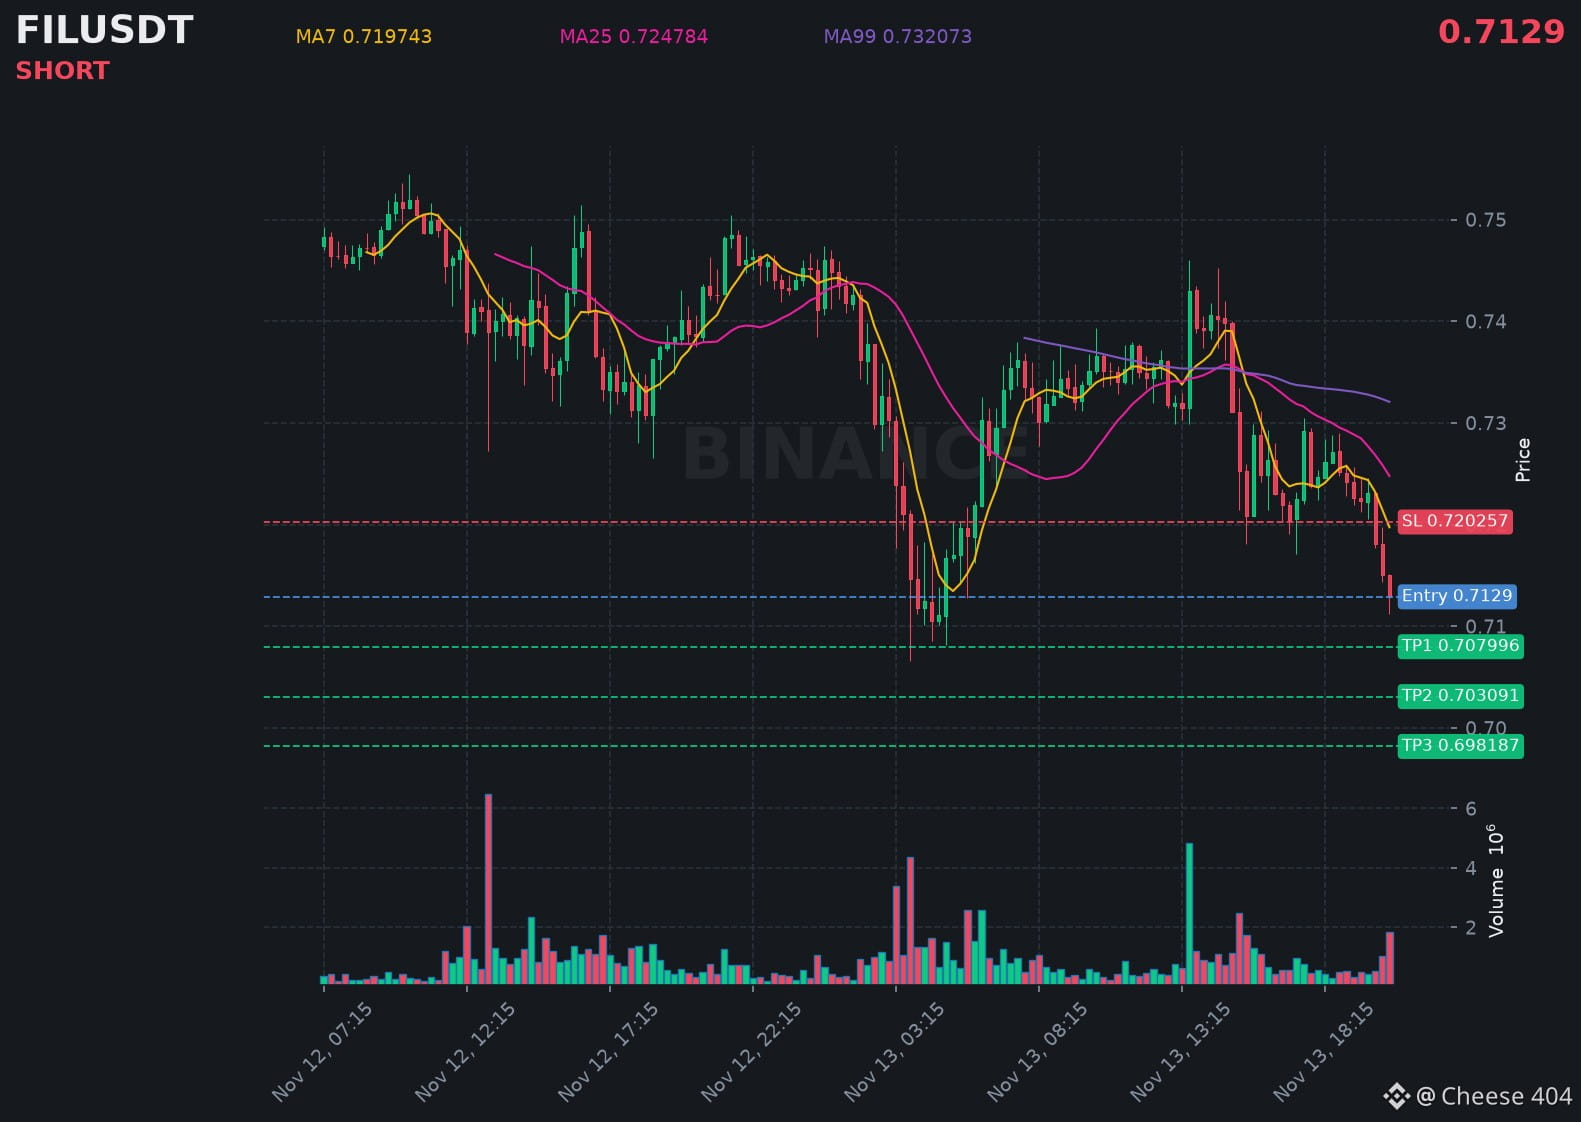
$FIL is losing momentum fast as volume rises and price breaks below key support.
📍 @ 0.7129 | Volume: 1.31M USD
RSI 32 | EMA20: 0.723141 USD
📈 Trade Plan:
📈 Entry: 0.711429 – 0.714371
🛑 Stop Loss: 0.720257
🎯 TP1: 0.707996
🎯 TP2: 0.703091
🎯 TP3: 0.698187
Waiting for confirmation, then riding the downtrend.
👉 $FIL 👈 Catch it
#FIL
$FIL is losing momentum fast as volume rises and price breaks below key support.
📍 @ 0.7129 | Volume: 1.31M USD
RSI 32 | EMA20: 0.723141 USD
📈 Trade Plan:
📈 Entry: 0.711429 – 0.714371
🛑 Stop Loss: 0.720257
🎯 TP1: 0.707996
🎯 TP2: 0.703091
🎯 TP3: 0.698187
Waiting for confirmation, then riding the downtrend.
👉 $FIL 👈 Catch it
#FIL
📍 @ 0.7129 | Volume: 1.31M USD
RSI 32 | EMA20: 0.723141 USD
📈 Trade Plan:
📈 Entry: 0.711429 – 0.714371
🛑 Stop Loss: 0.720257
🎯 TP1: 0.707996
🎯 TP2: 0.703091
🎯 TP3: 0.698187
Waiting for confirmation, then riding the downtrend.
👉 $FIL 👈 Catch it
#FIL
178
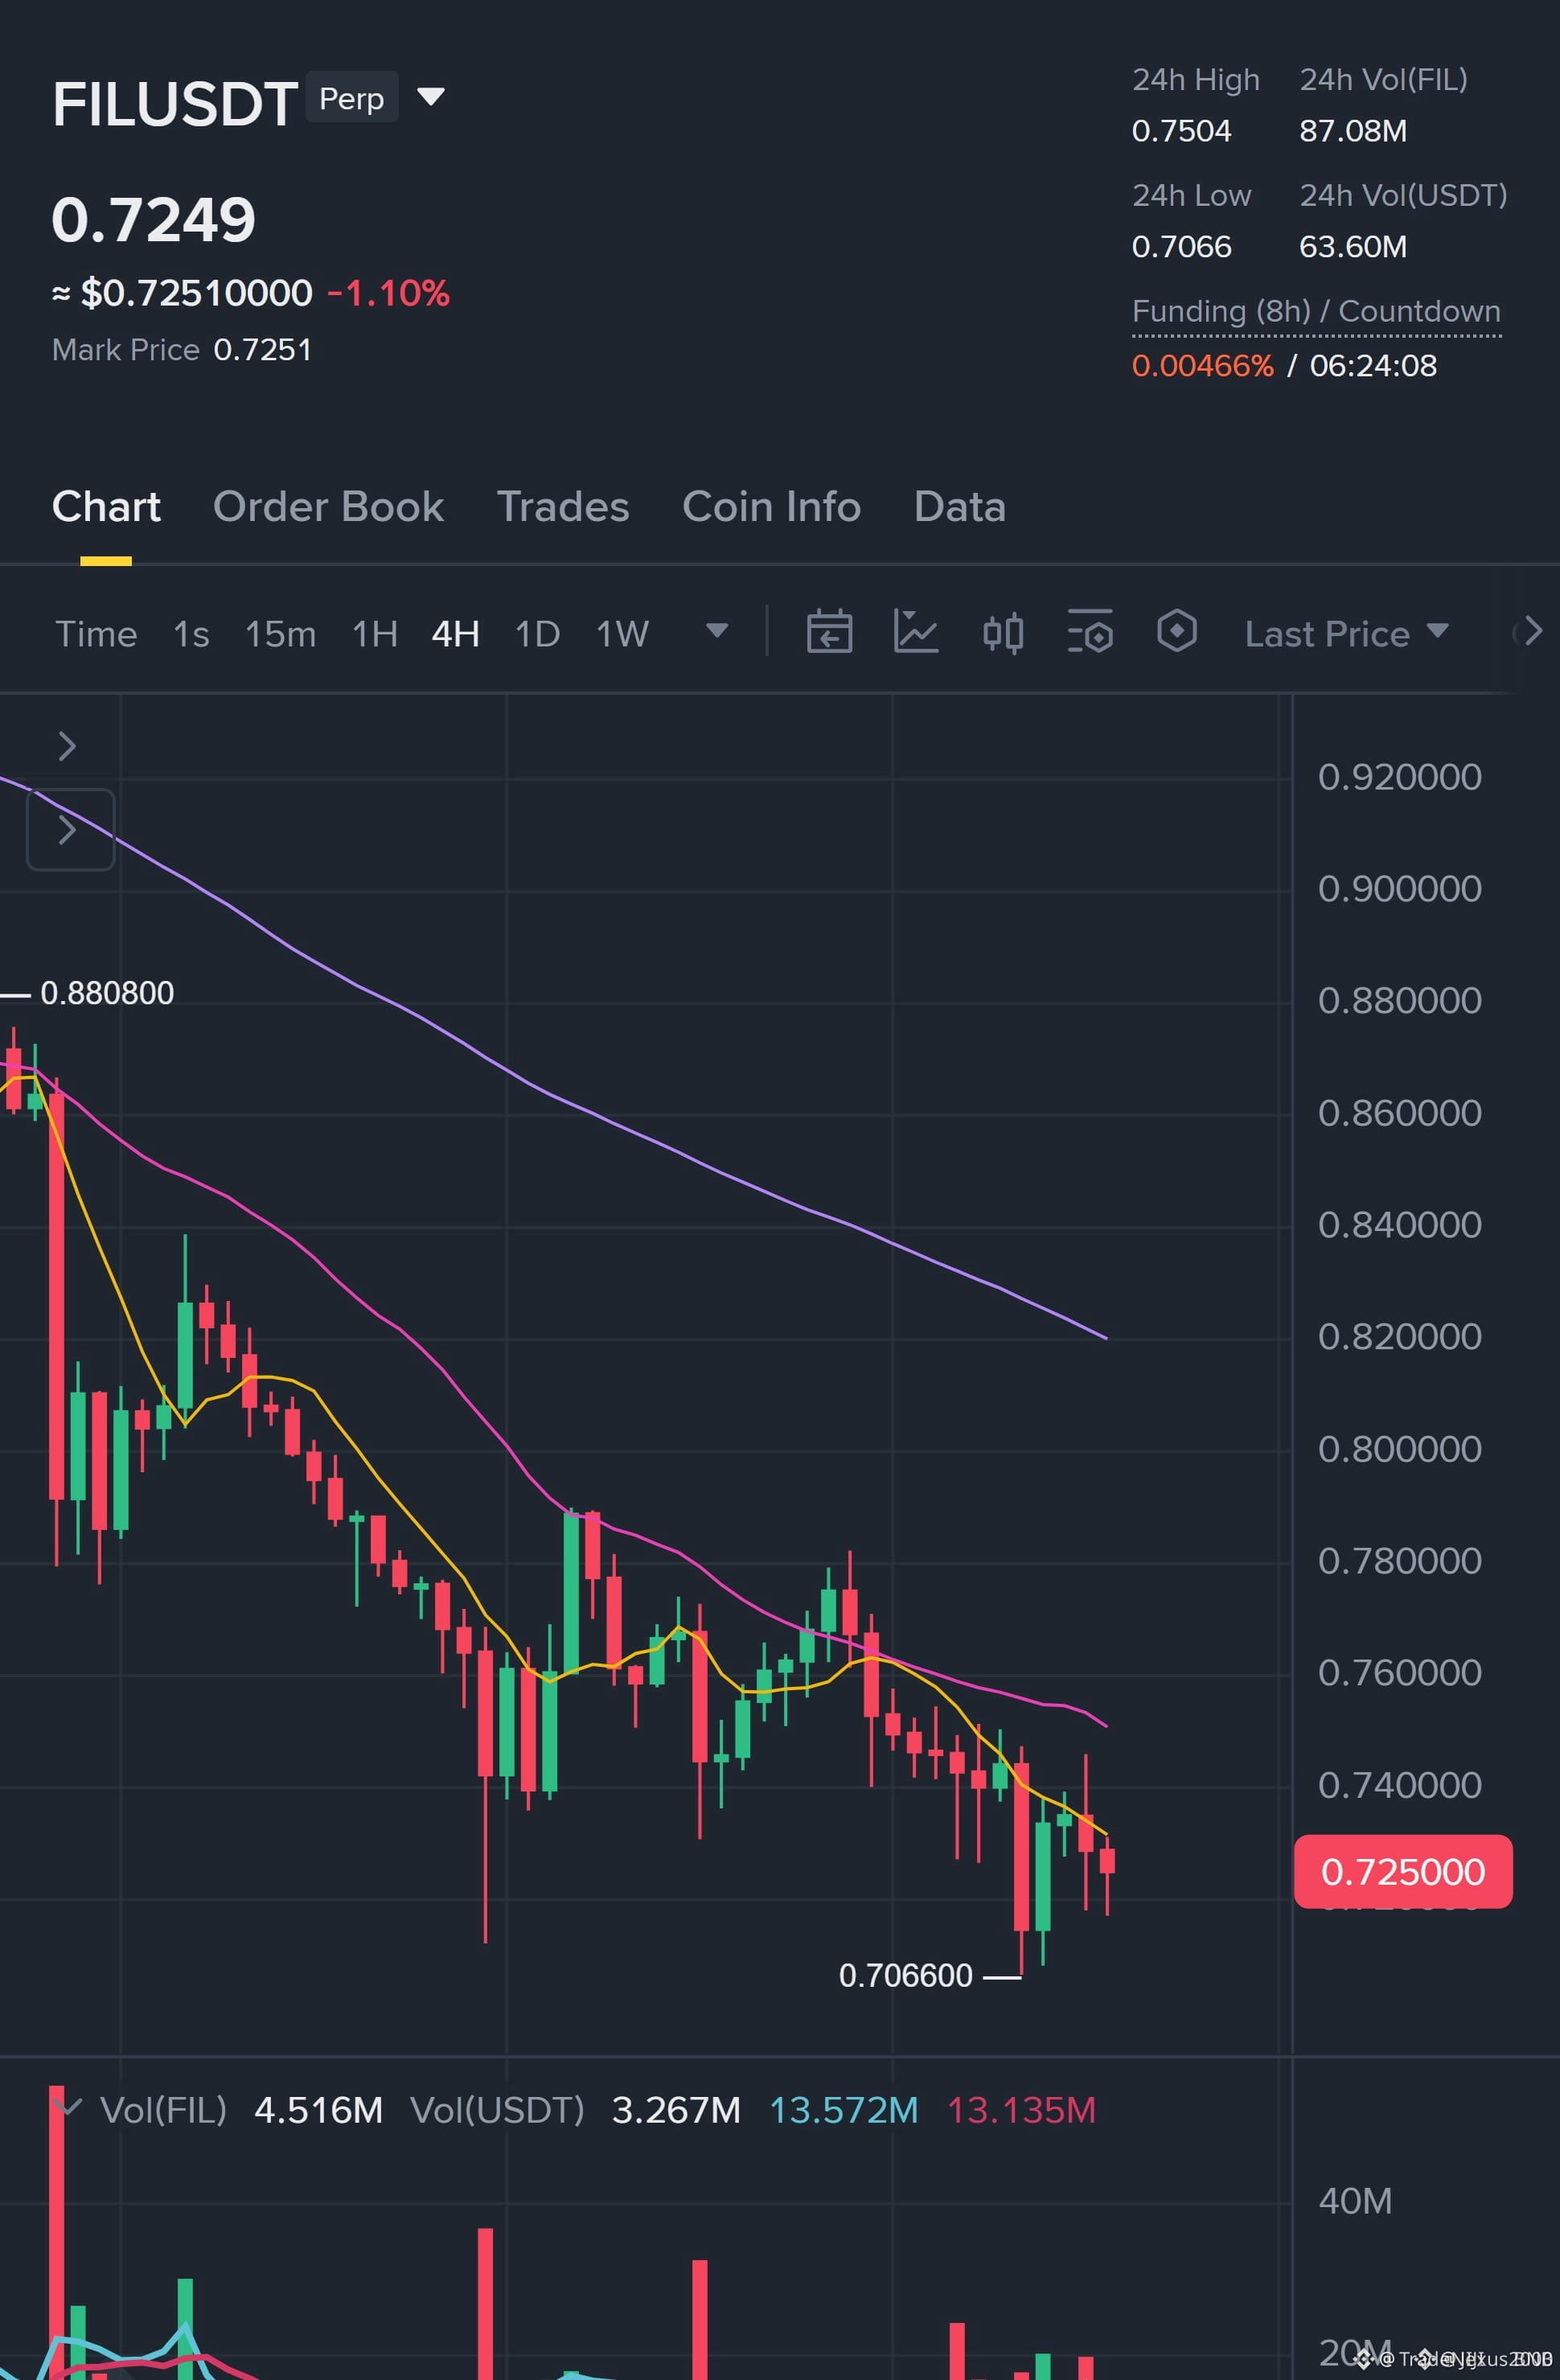
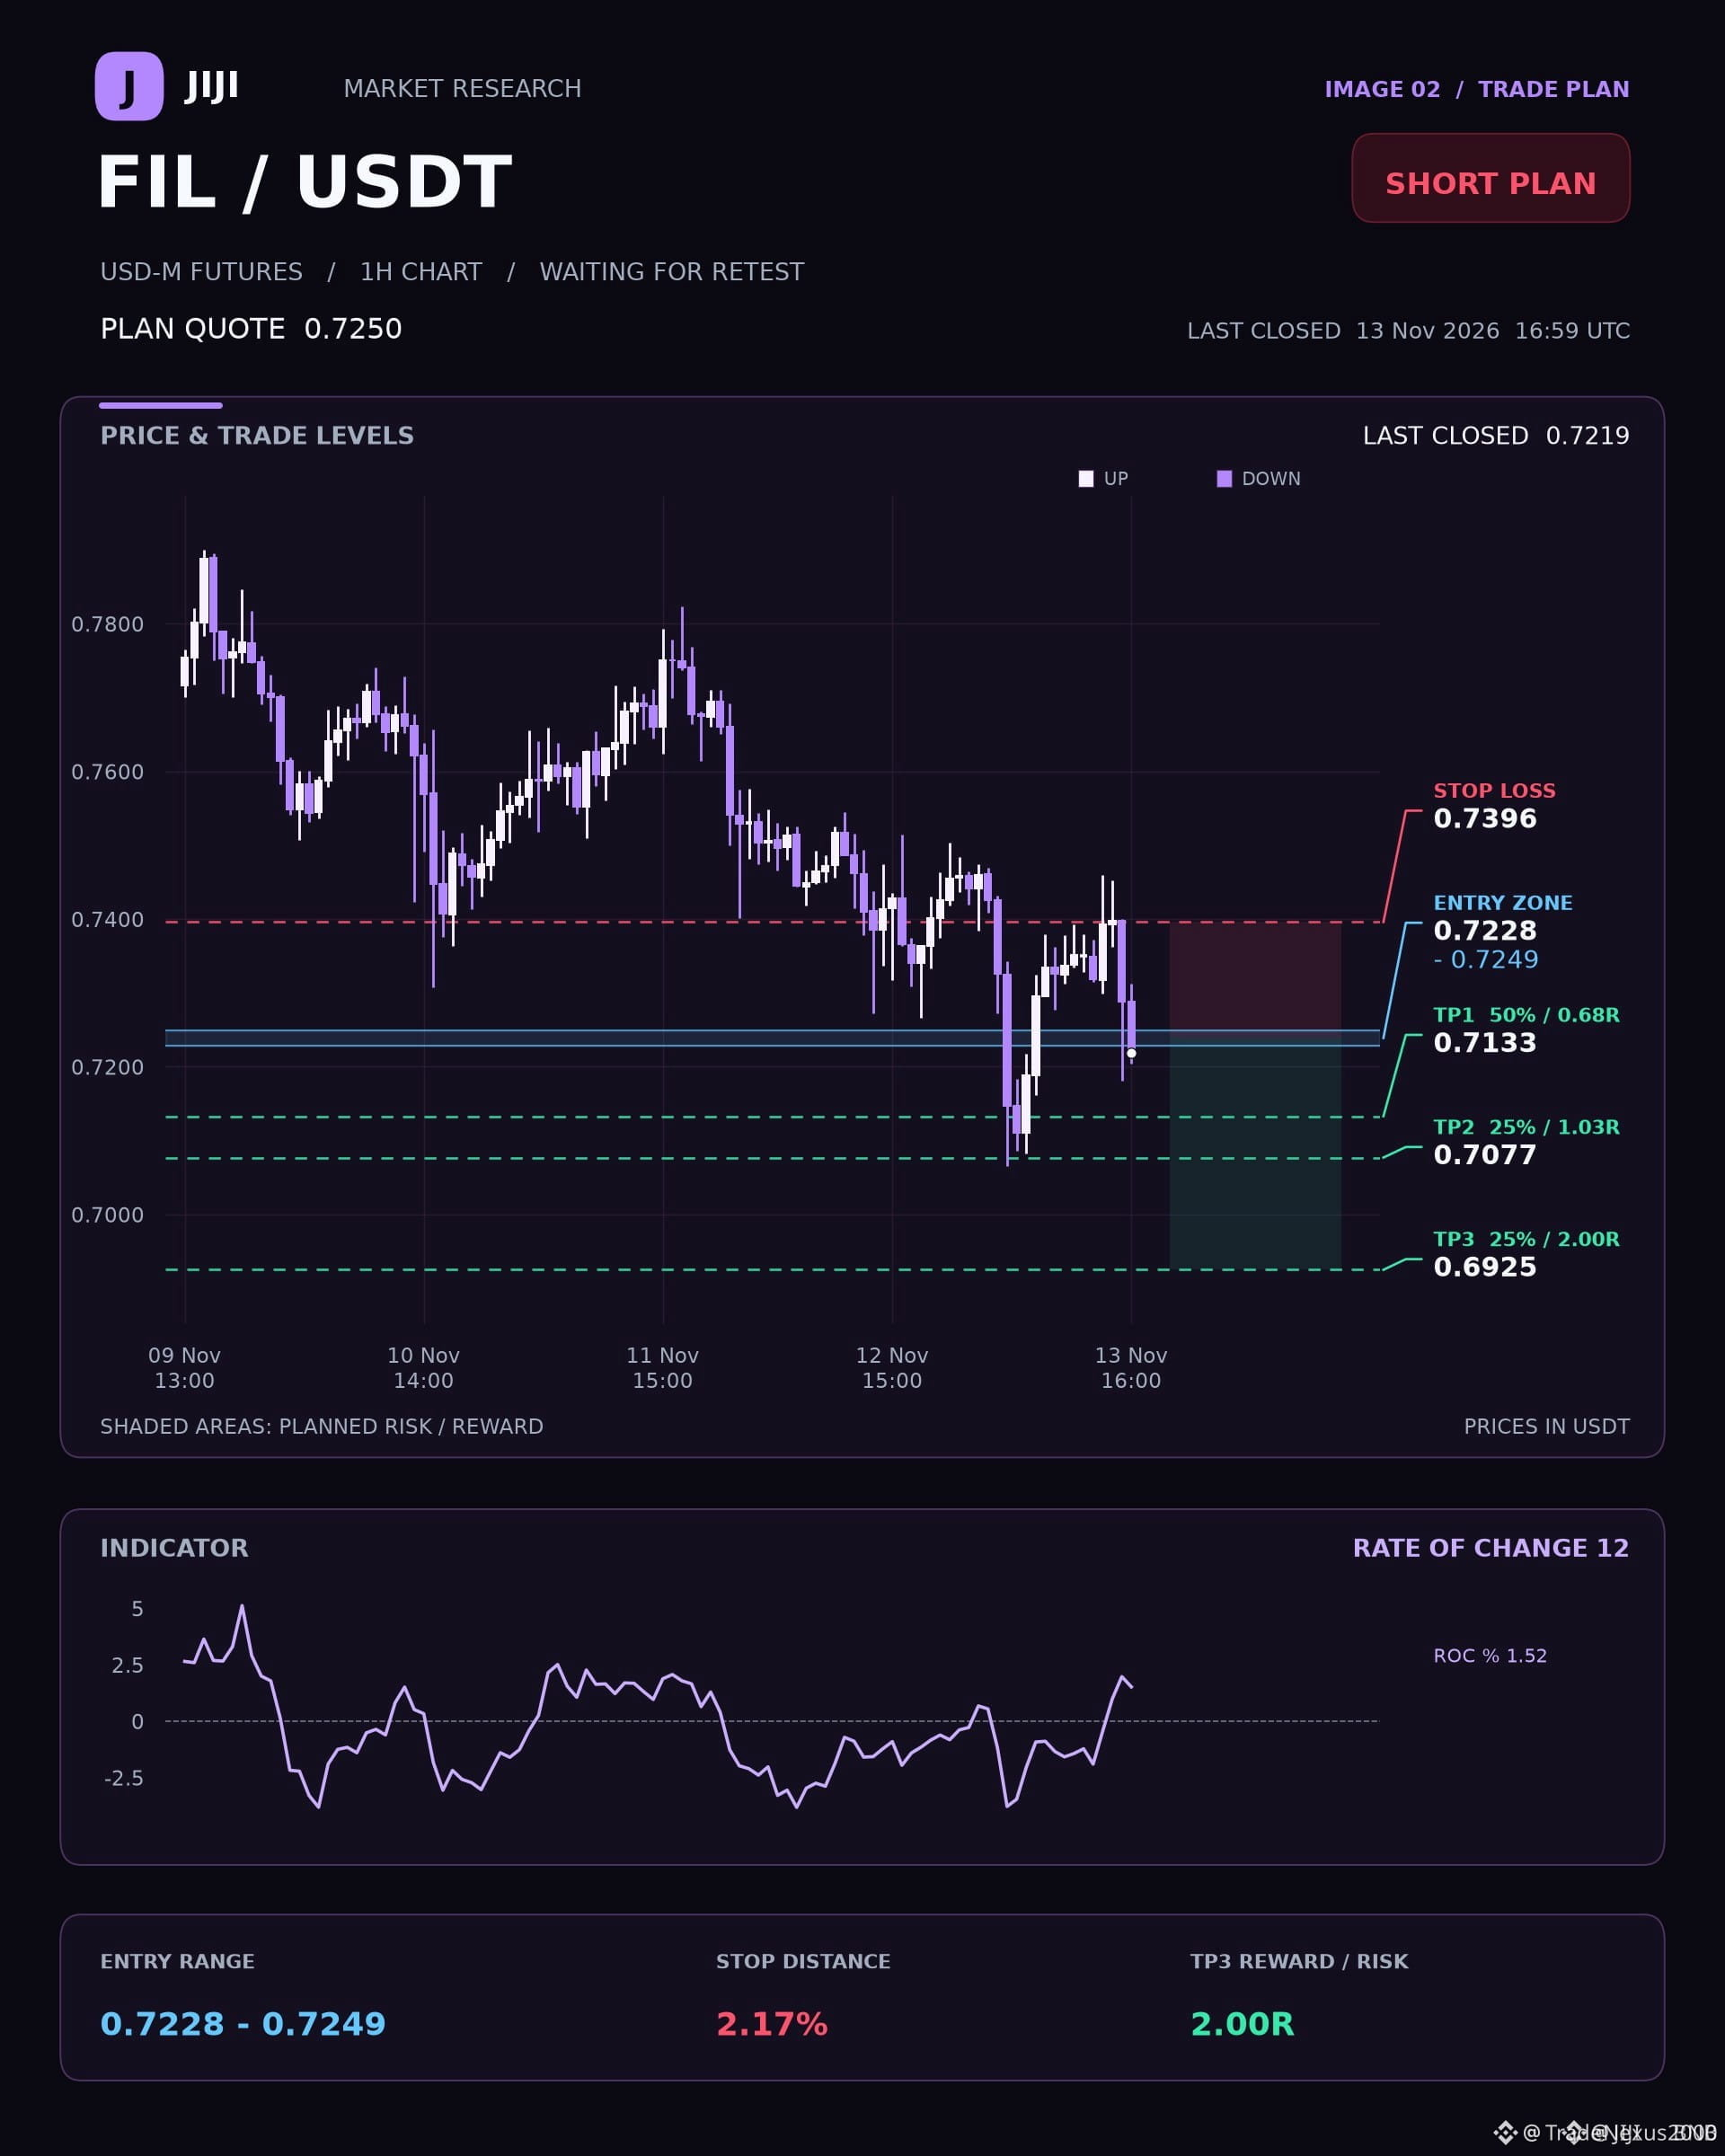
🔴 $FIL BEARISH STRUCTURE ALIGNMENT ACROSS MULTIPLE TIMEFRAMES SIGNALS DOWNSIDE CONTINUATION 📉
Entry: 0.7228 – 0.7249 ⚡
Target: 0.6925 🚀
Stop Loss: 0.7396 ⚠️
Multi-timeframe analysis reveals a synchronized bearish EMA structure on both the four-hour and one-hour charts, confirming persistent supply dominance. Lower-timeframe directional indicators heavily favor sellers as momentum expands toward deeper liquidity pools. 📊
Institutional order flow points to rejection near resistance before a sustained sweep of resting bids. Managing risk dynamically around the defined invalidation zone remains essential as price probes structural inefficiencies. ⚡
💬 Are you anticipating an immediate breakdown through initial support or waiting for a deeper retest? 👇
⚠️ Not financial advice. Always manage your risk. 🛡️
🏷️ #FIL #ShortSetup #CryptoTrading #OrderFlow
🦈 📉
🔴 $FIL BEARISH STRUCTURE ALIGNMENT ACROSS MULTIPLE TIMEFRAMES SIGNALS DOWNSIDE CONTINUATION 📉
Entry: 0.7228 – 0.7249 ⚡
Target: 0.6925 🚀
Stop Loss: 0.7396 ⚠️
Multi-timeframe analysis reveals a synchronized bearish EMA structure on both the four-hour and one-hour charts, confirming persistent supply dominance. Lower-timeframe directional indicators heavily favor sellers as momentum expands toward deeper liquidity pools. 📊
Institutional order flow points to rejection near resistance before a sustained sweep of resting bids. Managing risk dynamically around the defined invalidation zone remains essential as price probes structural inefficiencies. ⚡
💬 Are you anticipating an immediate breakdown through initial support or waiting for a deeper retest? 👇
⚠️ Not financial advice. Always manage your risk. 🛡️
🏷️ #FIL #ShortSetup #CryptoTrading #OrderFlow
🦈 📉
Entry: 0.7228 – 0.7249 ⚡
Target: 0.6925 🚀
Stop Loss: 0.7396 ⚠️
Multi-timeframe analysis reveals a synchronized bearish EMA structure on both the four-hour and one-hour charts, confirming persistent supply dominance. Lower-timeframe directional indicators heavily favor sellers as momentum expands toward deeper liquidity pools. 📊
Institutional order flow points to rejection near resistance before a sustained sweep of resting bids. Managing risk dynamically around the defined invalidation zone remains essential as price probes structural inefficiencies. ⚡
💬 Are you anticipating an immediate breakdown through initial support or waiting for a deeper retest? 👇
⚠️ Not financial advice. Always manage your risk. 🛡️
🏷️ #FIL #ShortSetup #CryptoTrading #OrderFlow
🦈 📉
19
Log in to explore more content
Join global crypto users on Binance Square
⚡️ Get latest and useful information about crypto.
💬 Trusted by the world’s largest crypto exchange.
👍 Discover real insights from verified creators.
Email / Phone number
Trending Topics
1
#WhoWillSucceedJensenHuangatNvidia?
158,250 views
1,597 Discussing
2
#WhatWillDriveCryptoandStocks’NextRebound?
557,937 views
3,436 Discussing
3
#BitcoinActiveSupplyInProfitDropsBelow45%
69,727 views
678 Discussing
4
#KavaSaysAbnormalActivityLimitedToKavaLend
37,694 views
378 Discussing
5
#USSpotXRPETFsSeeLargestWeeklyOutflowIn8Months
29,412 views
330 Discussing
6
#USPPIMissMayEaseBTCPressure
289,166 views
2,232 Discussing
7
#WORPTLetsTouristsConvertCryptoToThaiBaht
9,738 views
89 Discussing
8
#TONStrategyReports$23.97MQ3NetLoss
10,377 views
43 Discussing
9
#PolkadotCommunityApprovesNewStrategyWith97%Vote
27,523 views
286 Discussing
10
#dYdXPlansV9.9UpgradeToShiftUSDCToInjective
25,815 views
247 Discussing