
#eth
eth
4.5G views
27.3M Discussing
Hot
Latest

·
--
#ETH UPDATE- 👀
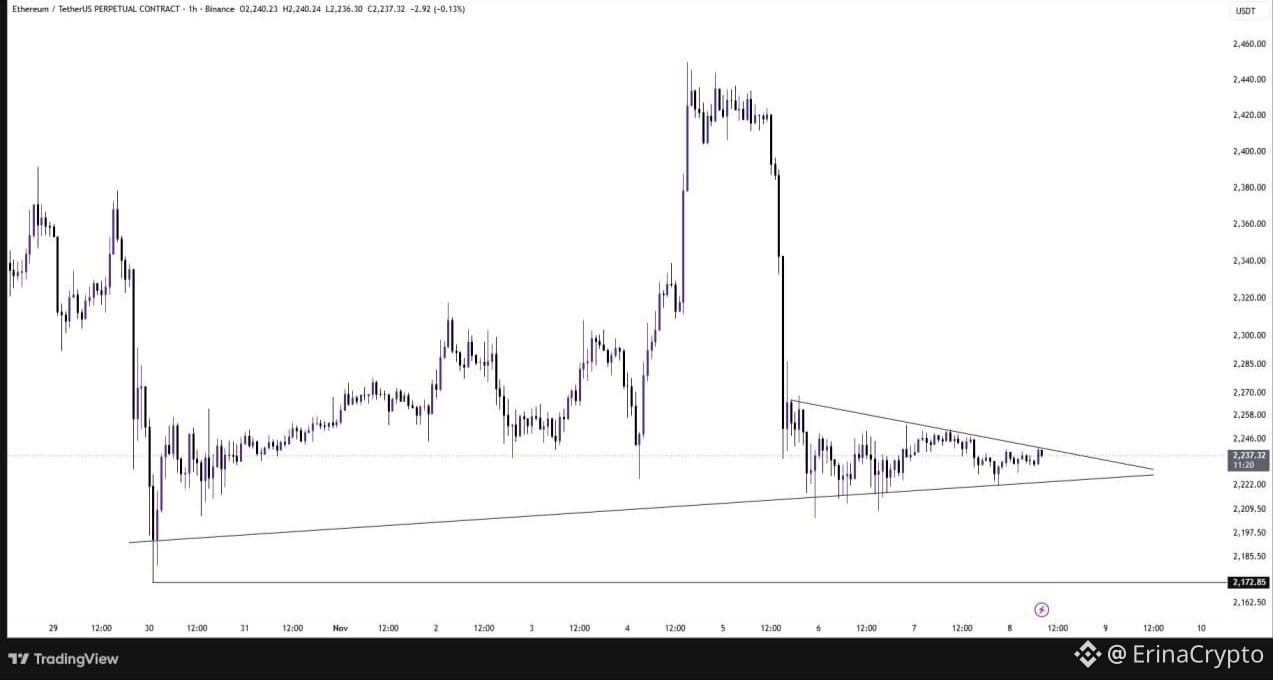
ETHEREUM is consolidating inside a symmetrical triangle on the 1H chart after a sharp rejection from the $2,420–$2,440 zone. Price is approaching the triangle’s apex, suggesting a potential breakout soon.
A breakout above $2,260 could push ETH toward $2,270–$2,285, while a breakdown below $2,220 may expose $2,200 and $2,185 as the next support levels.
$ETH
{spot}(ETHUSDT)
$GNS
{spot}(GNSUSDT)
$HOT
{spot}(HOTUSDT)
#NvidiaInvestigatesAfterHuang’sAffairApology #Erinacrypto #BinancePick #GNS
#ETH UPDATE- 👀
ETHEREUM is consolidating inside a symmetrical triangle on the 1H chart after a sharp rejection from the $2,420–$2,440 zone. Price is approaching the triangle’s apex, suggesting a potential breakout soon.
A breakout above $2,260 could push ETH toward $2,270–$2,285, while a breakdown below $2,220 may expose $2,200 and $2,185 as the next support levels.
$ETH
$GNS
$HOT
#NvidiaInvestigatesAfterHuang’sAffairApology #Erinacrypto #BinancePick #GNS
ETHEREUM is consolidating inside a symmetrical triangle on the 1H chart after a sharp rejection from the $2,420–$2,440 zone. Price is approaching the triangle’s apex, suggesting a potential breakout soon.
A breakout above $2,260 could push ETH toward $2,270–$2,285, while a breakdown below $2,220 may expose $2,200 and $2,185 as the next support levels.
$ETH
$GNS
$HOT
#NvidiaInvestigatesAfterHuang’sAffairApology #Erinacrypto #BinancePick #GNS
1
3
585


·
--
Bullish
$ETH DANGEROUS ALERT ⚠️
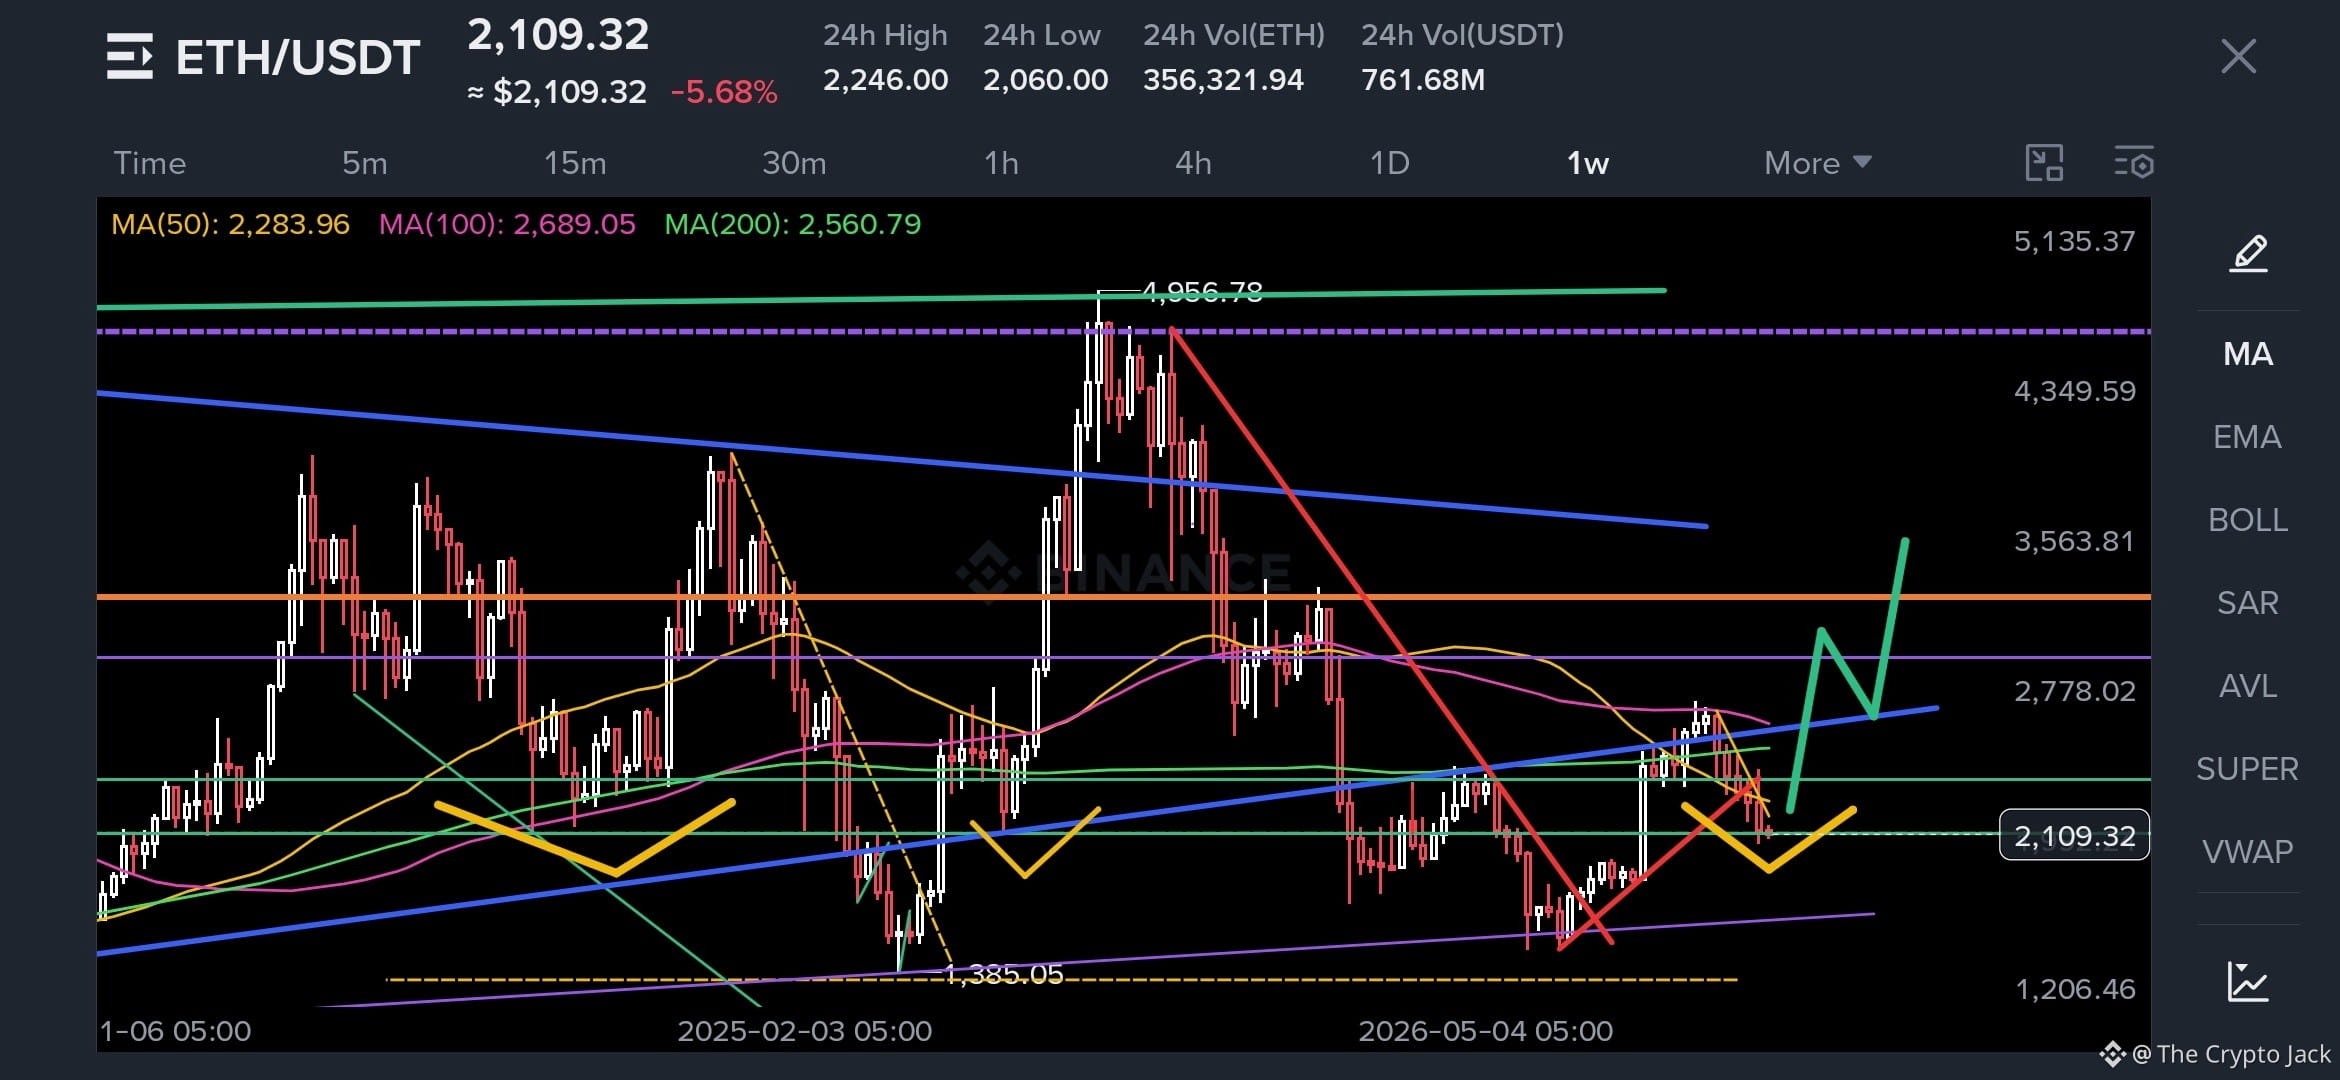
IN ANY CASE WEEKLY CLOSE BELOW $2100 SHOULD NOT OCCUR.
WEEKLY CLOSE BELOW $2100 MEANS THAT WE WILL SEE $1800 AND SUBSEQUENTLY $1500 IF BITCOIN DUMPED A BIT.
FOR NOW I BELIEVE WEEKLY CLOSE WILL BE ABOVE 2100 AND BOUNCE IS DUE NOW.
SO THIS IS THE BEST TIME TO BUILD SWING LONGS AND SPOT.
BUY WHEN OTHERS ARE SCARED TO BUY.
AND SELL WHEN OTHER ARE GREEDY TO BUY.
.
.
.
.
.
.
$JCT $ON
.
.
.
.
#BinanceSquareFamily #BTC #ETH #xrp #solana
$ETH DANGEROUS ALERT ⚠️
IN ANY CASE WEEKLY CLOSE BELOW $2100 SHOULD NOT OCCUR.
WEEKLY CLOSE BELOW $2100 MEANS THAT WE WILL SEE $1800 AND SUBSEQUENTLY $1500 IF BITCOIN DUMPED A BIT.
FOR NOW I BELIEVE WEEKLY CLOSE WILL BE ABOVE 2100 AND BOUNCE IS DUE NOW.
SO THIS IS THE BEST TIME TO BUILD SWING LONGS AND SPOT.
BUY WHEN OTHERS ARE SCARED TO BUY.
AND SELL WHEN OTHER ARE GREEDY TO BUY.
.
.
.
.
.
.
$JCT $ON
.
.
.
.
#BinanceSquareFamily #BTC #ETH #xrp #solana
IN ANY CASE WEEKLY CLOSE BELOW $2100 SHOULD NOT OCCUR.
WEEKLY CLOSE BELOW $2100 MEANS THAT WE WILL SEE $1800 AND SUBSEQUENTLY $1500 IF BITCOIN DUMPED A BIT.
FOR NOW I BELIEVE WEEKLY CLOSE WILL BE ABOVE 2100 AND BOUNCE IS DUE NOW.
SO THIS IS THE BEST TIME TO BUILD SWING LONGS AND SPOT.
BUY WHEN OTHERS ARE SCARED TO BUY.
AND SELL WHEN OTHER ARE GREEDY TO BUY.
.
.
.
.
.
.
$JCT $ON
.
.
.
.
#BinanceSquareFamily #BTC #ETH #xrp #solana
Tradeassi_com:
TradeAssi whale alerts: one HL whale with a 90% win rate closed a ~$2.5M ETH short opened near $2,142 at 9:27 AM, plus INJ and XMR shorts, with ETH now around $2,119. Took the green and stepped aside.
6
4
4.5k

·
--
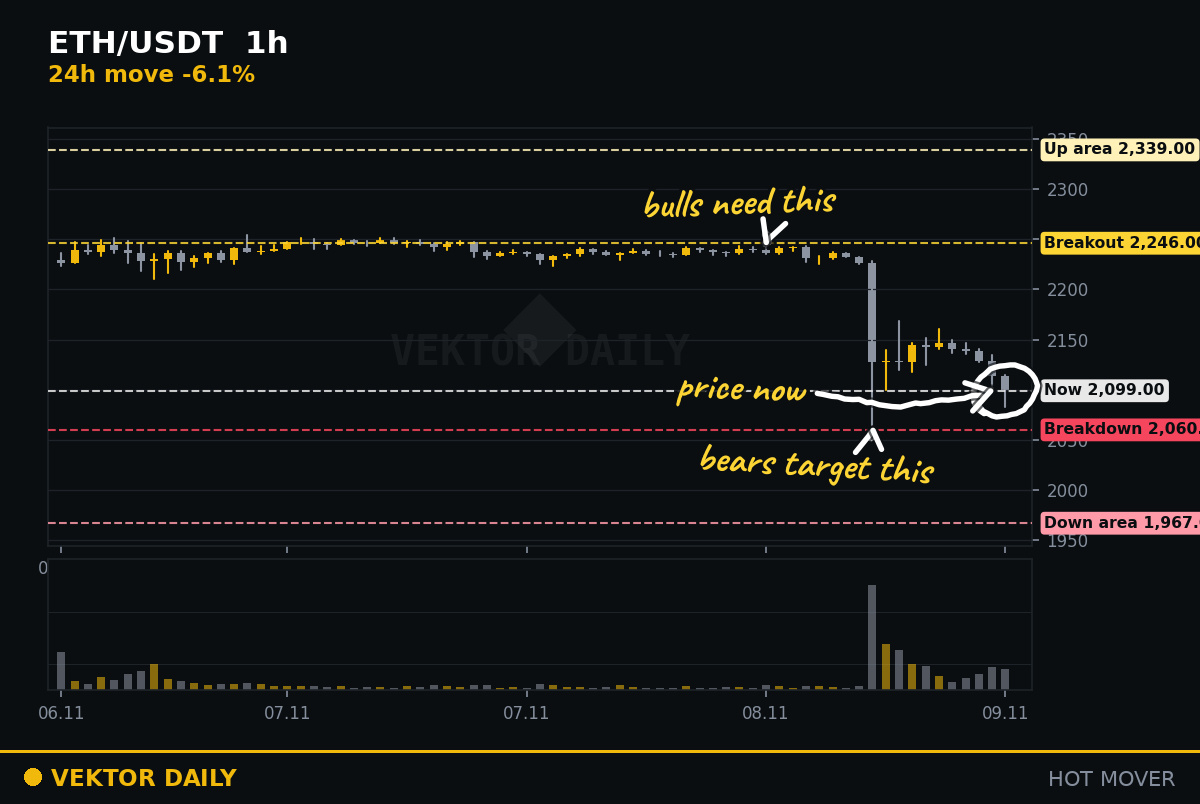
🔻 $ETH is −6.1% on the day
Now 2 099, in the lower part of its 24h range: 2 060 to 2 246.
Bulls: a hold above 2 246 (24h high) opens the way to 2 339 (+11.4%).
Downside scenario: a close under 2 060 and 1 967 (−6.3%) comes into play.
Either way, the idea is wrong once price closes back through 2 153 against you: that is where many traders place the stop, and size the position so that stop costs about 1% of the account.
These are range levels, not a prediction. Moves like this fade as often as they continue.
Not financial advice.
#ETH #VektorDaily
🔻 $ETH is −6.1% on the day
Now 2 099, in the lower part of its 24h range: 2 060 to 2 246.
Bulls: a hold above 2 246 (24h high) opens the way to 2 339 (+11.4%).
Downside scenario: a close under 2 060 and 1 967 (−6.3%) comes into play.
Either way, the idea is wrong once price closes back through 2 153 against you: that is where many traders place the stop, and size the position so that stop costs about 1% of the account.
These are range levels, not a prediction. Moves like this fade as often as they continue.
Not financial advice.
#ETH #VektorDaily
Now 2 099, in the lower part of its 24h range: 2 060 to 2 246.
Bulls: a hold above 2 246 (24h high) opens the way to 2 339 (+11.4%).
Downside scenario: a close under 2 060 and 1 967 (−6.3%) comes into play.
Either way, the idea is wrong once price closes back through 2 153 against you: that is where many traders place the stop, and size the position so that stop costs about 1% of the account.
These are range levels, not a prediction. Moves like this fade as often as they continue.
Not financial advice.
#ETH #VektorDaily
335

·
--
Bearish
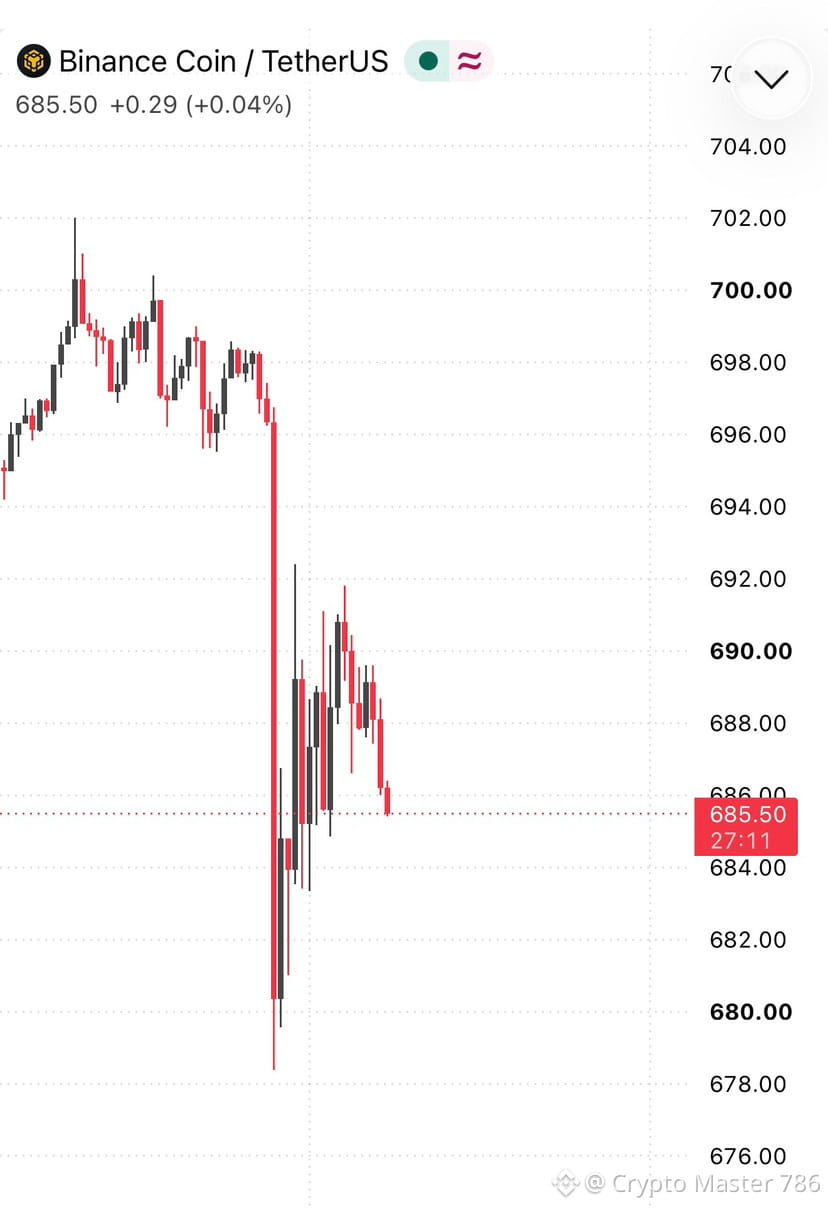
Attention Traders‼️ $ETH & $BNB Dropping Again!
#ETH and $BNB are facing fresh selling pressure after a brief recovery. Bears are taking control again, and another drop could be coming!
Stay alert, Fam! Are you still holding your short positions with me??
Attention Traders‼️ $ETH & $BNB Dropping Again!
#ETH and $BNB are facing fresh selling pressure after a brief recovery. Bears are taking control again, and another drop could be coming!
Stay alert, Fam! Are you still holding your short positions with me??
#ETH and $BNB are facing fresh selling pressure after a brief recovery. Bears are taking control again, and another drop could be coming!
Stay alert, Fam! Are you still holding your short positions with me??
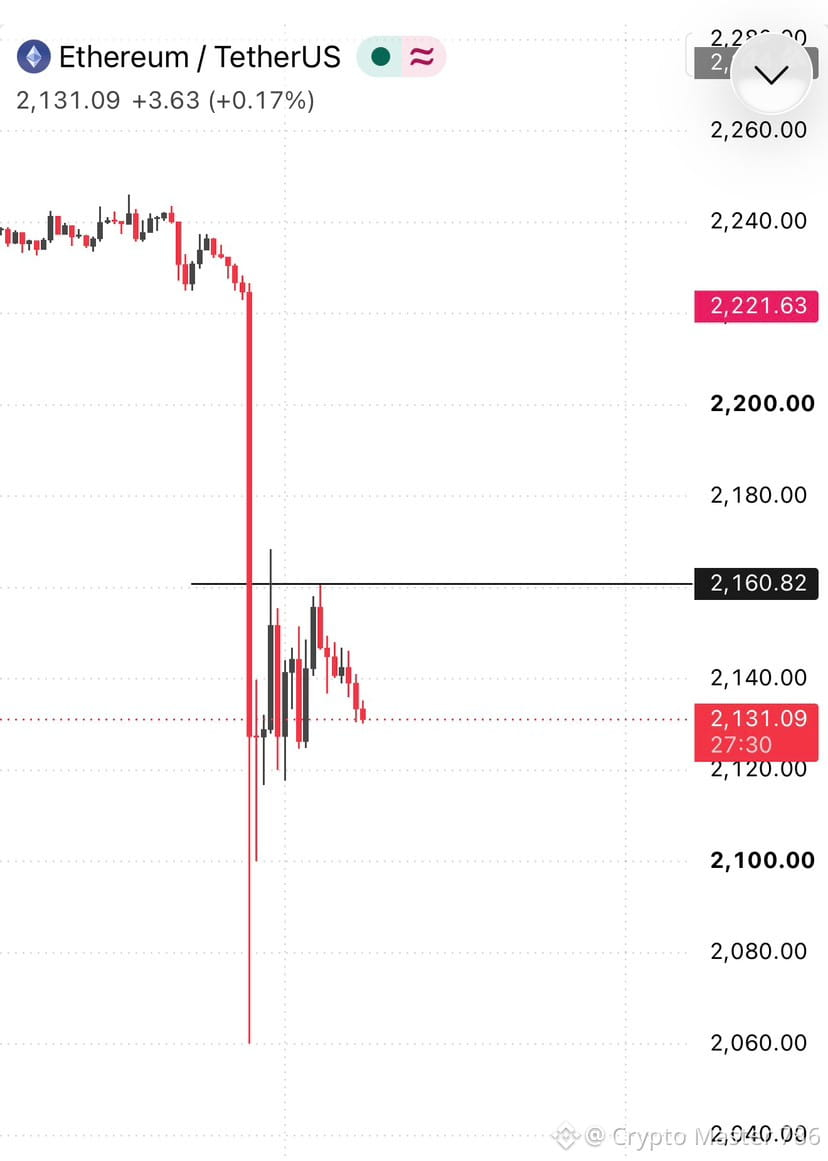
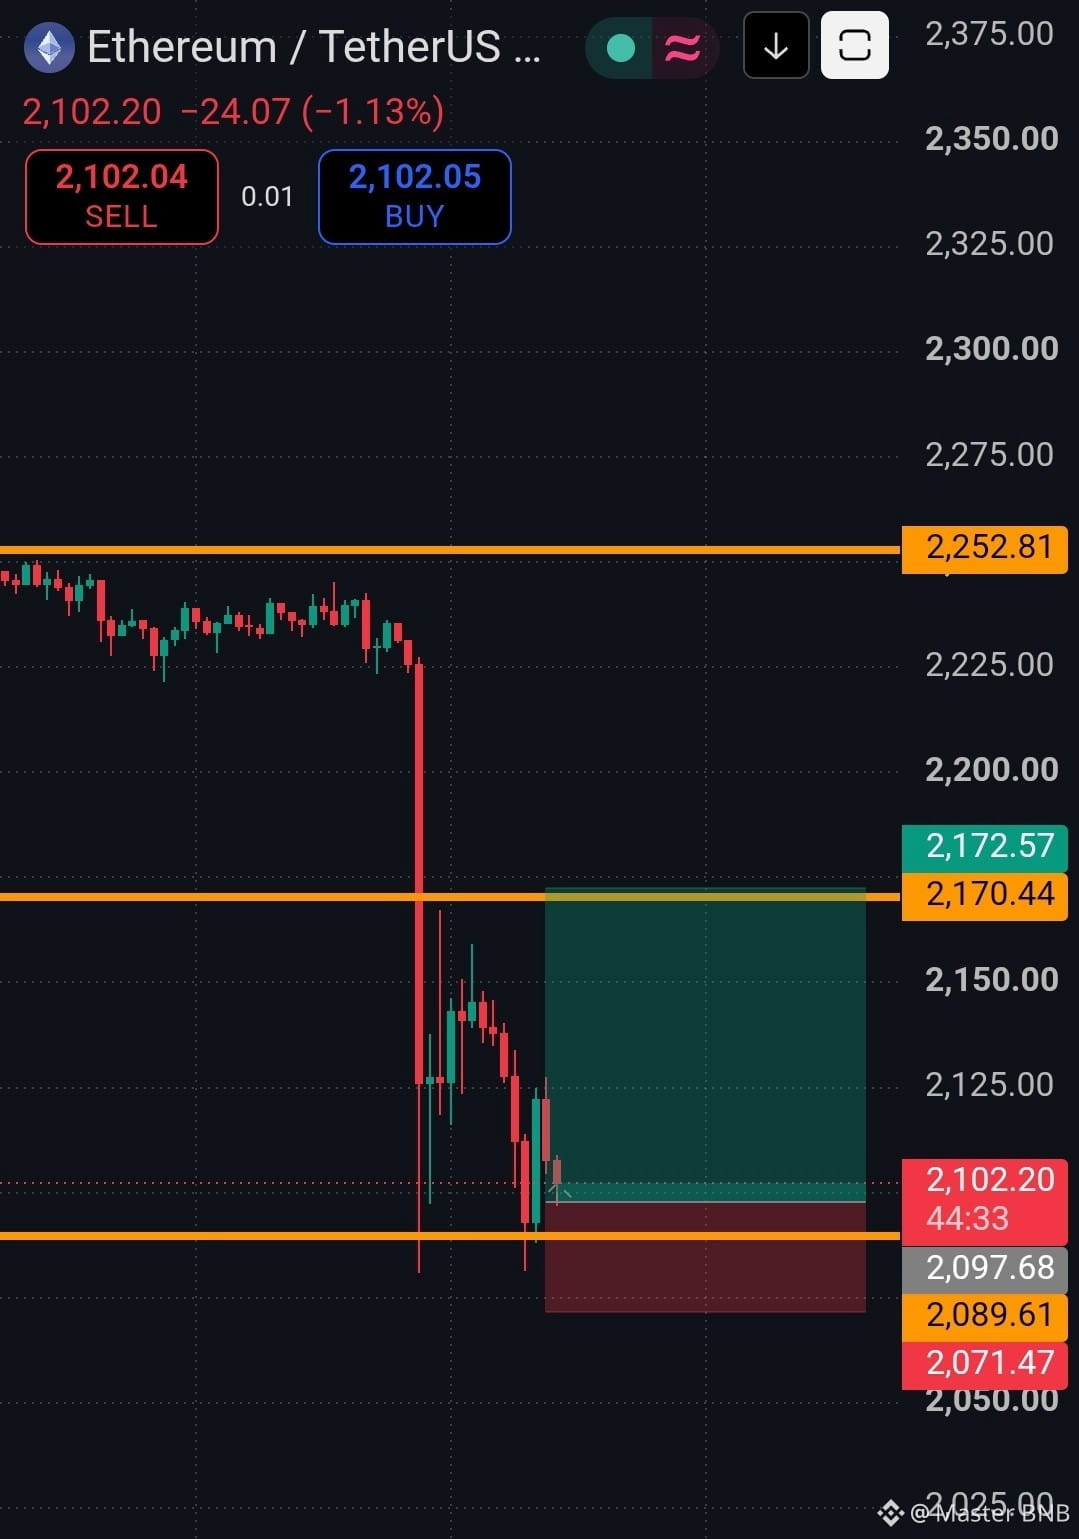
Square-Creator-7f2410be6beffeaf4c93:
Лонг??
2
6
2.9k


·
--
🐳 Whales Are Buying the Ethereum Dip as Market Selling Pressure Builds.
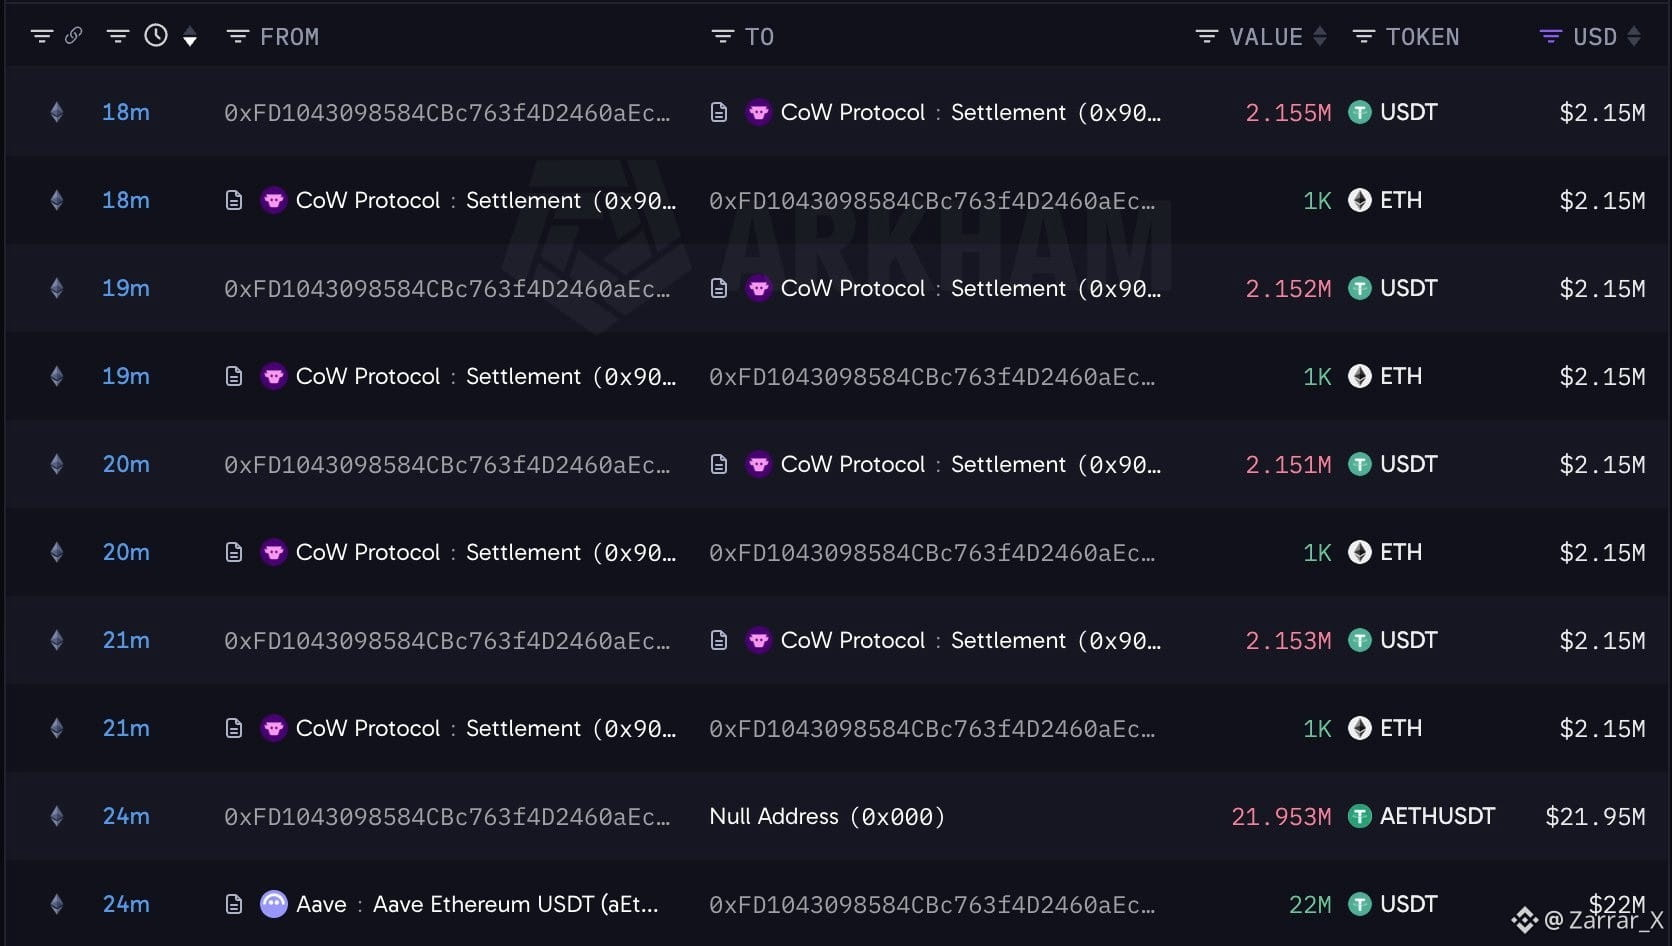
On-chain data shared by Lookonchain shows large investors accumulating $ETH despite the broader market downturn. One wallet borrowed $22 million in USDT from Aave and used approximately $21.55 million to purchase 10,000 ETH at an average price of $2,155.
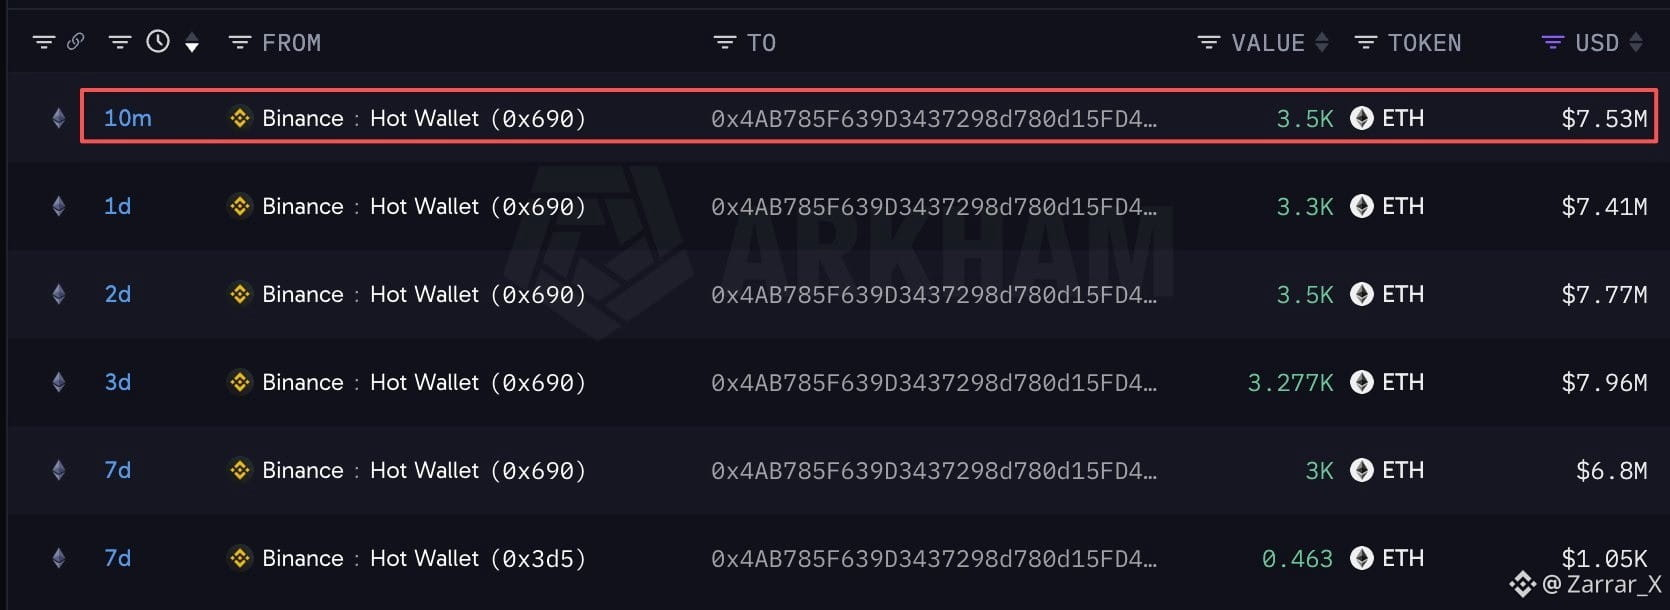
Another whale withdrew an additional 3,500 ETH worth around $7.53 million from Binance. This brings the wallet’s total withdrawals over the past week to 16,577 ETH, valued at approximately $37.5 million.
The activity suggests some large holders are using the market weakness to increase their ETH exposure. However, accumulation by a few wallets does not guarantee an immediate recovery, particularly while broader selling pressure remains high.
{future}(ETHUSDT)
#ETH
🐳 Whales Are Buying the Ethereum Dip as Market Selling Pressure Builds.
On-chain data shared by Lookonchain shows large investors accumulating $ETH despite the broader market downturn. One wallet borrowed $22 million in USDT from Aave and used approximately $21.55 million to purchase 10,000 ETH at an average price of $2,155.
Another whale withdrew an additional 3,500 ETH worth around $7.53 million from Binance. This brings the wallet’s total withdrawals over the past week to 16,577 ETH, valued at approximately $37.5 million.
The activity suggests some large holders are using the market weakness to increase their ETH exposure. However, accumulation by a few wallets does not guarantee an immediate recovery, particularly while broader selling pressure remains high.
#ETH
On-chain data shared by Lookonchain shows large investors accumulating $ETH despite the broader market downturn. One wallet borrowed $22 million in USDT from Aave and used approximately $21.55 million to purchase 10,000 ETH at an average price of $2,155.
Another whale withdrew an additional 3,500 ETH worth around $7.53 million from Binance. This brings the wallet’s total withdrawals over the past week to 16,577 ETH, valued at approximately $37.5 million.
The activity suggests some large holders are using the market weakness to increase their ETH exposure. However, accumulation by a few wallets does not guarantee an immediate recovery, particularly while broader selling pressure remains high.
#ETH
1
498

·
--
🚨 Ethereum ETFs Just Logged a Sixth Straight Week of Outflows
Most traders only watched the daily candle.
Three confirmed facts stand out.
First — U.S. spot Ether ETFs lost about $365 million last week.
That extends the outflow streak to six consecutive weeks.
Second — BitMine is still accumulating.
Corporate holdings were reported near 6.06 million ETH as of early November — still close to the firm’s publicly stated 5% supply target.
Third — large wallets showed net buying during the pullback.
On-chain trackers reported multiple whale wallets adding tens of thousands of ETH even while ETF flows stayed negative.
ETF money left.
Treasury and whale wallets kept buying.
Both sides of that split are measurable.
Click $ETH below and check the live price right now.
$ETH
{future}(ETHUSDT)
.
.
.
#ETH #write2earn
Not financial advice. DYOR.
🚨 Ethereum ETFs Just Logged a Sixth Straight Week of Outflows
Most traders only watched the daily candle.
Three confirmed facts stand out.
First — U.S. spot Ether ETFs lost about $365 million last week.
That extends the outflow streak to six consecutive weeks.
Second — BitMine is still accumulating.
Corporate holdings were reported near 6.06 million ETH as of early November — still close to the firm’s publicly stated 5% supply target.
Third — large wallets showed net buying during the pullback.
On-chain trackers reported multiple whale wallets adding tens of thousands of ETH even while ETF flows stayed negative.
ETF money left.
Treasury and whale wallets kept buying.
Both sides of that split are measurable.
Click $ETH below and check the live price right now.
$ETH
.
.
.
#ETH #write2earn
Not financial advice. DYOR.
Most traders only watched the daily candle.
Three confirmed facts stand out.
First — U.S. spot Ether ETFs lost about $365 million last week.
That extends the outflow streak to six consecutive weeks.
Second — BitMine is still accumulating.
Corporate holdings were reported near 6.06 million ETH as of early November — still close to the firm’s publicly stated 5% supply target.
Third — large wallets showed net buying during the pullback.
On-chain trackers reported multiple whale wallets adding tens of thousands of ETH even while ETF flows stayed negative.
ETF money left.
Treasury and whale wallets kept buying.
Both sides of that split are measurable.
Click $ETH below and check the live price right now.
$ETH
.
.
.
#ETH #write2earn
Not financial advice. DYOR.



267

·
--
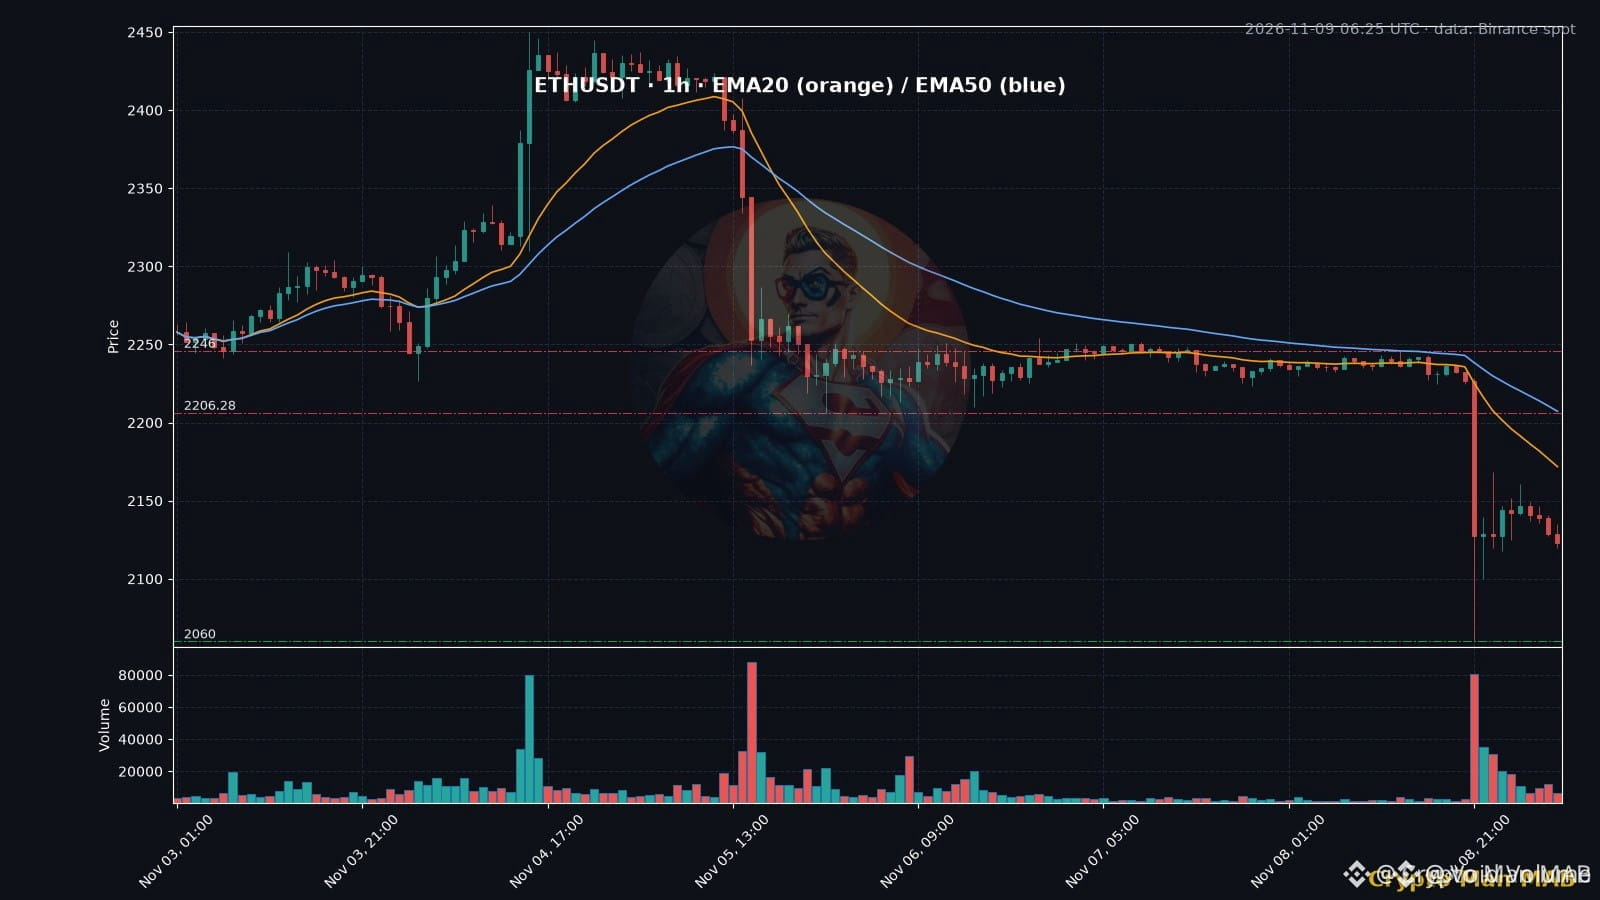
🚨 $ETH LIQUIDITY SWEEP AT 2060 TESTS RANGE INTEGRITY AND ORDER FLOW STRUCTURE! 🦈
Entry: 2100 ⚡
Target: 2225 🚀
Stop Loss: 2060 ⚠️
Following a compressed consolidation between 2235 and 2250, institutional order flow delivered a sharp liquidity sweep down to the 2060 handle accompanied by heavy volume. 📊
Price is currently leaking back toward the 2100 structural pivot, acting as the immediate line in the sand for buyers. 📌 Reclaiming 2170 and 2206 is necessary to invalidate this breakdown before sellers step in at the 2225 range floor. 🔍 💬 Are you positioning for a defense at 2100 or waiting for a retest of the 2060 liquidity pool? 👇
⚠️ Not financial advice. Always manage your risk. 🛡️
🏷️ #ETH #SmartMoney #OrderFlow #Crypto
🦈 ⚖️
🚨 $ETH LIQUIDITY SWEEP AT 2060 TESTS RANGE INTEGRITY AND ORDER FLOW STRUCTURE! 🦈
Entry: 2100 ⚡
Target: 2225 🚀
Stop Loss: 2060 ⚠️
Following a compressed consolidation between 2235 and 2250, institutional order flow delivered a sharp liquidity sweep down to the 2060 handle accompanied by heavy volume. 📊
Price is currently leaking back toward the 2100 structural pivot, acting as the immediate line in the sand for buyers. 📌 Reclaiming 2170 and 2206 is necessary to invalidate this breakdown before sellers step in at the 2225 range floor. 🔍 💬 Are you positioning for a defense at 2100 or waiting for a retest of the 2060 liquidity pool? 👇
⚠️ Not financial advice. Always manage your risk. 🛡️
🏷️ #ETH #SmartMoney #OrderFlow #Crypto
🦈 ⚖️
Entry: 2100 ⚡
Target: 2225 🚀
Stop Loss: 2060 ⚠️
Following a compressed consolidation between 2235 and 2250, institutional order flow delivered a sharp liquidity sweep down to the 2060 handle accompanied by heavy volume. 📊
Price is currently leaking back toward the 2100 structural pivot, acting as the immediate line in the sand for buyers. 📌 Reclaiming 2170 and 2206 is necessary to invalidate this breakdown before sellers step in at the 2225 range floor. 🔍 💬 Are you positioning for a defense at 2100 or waiting for a retest of the 2060 liquidity pool? 👇
⚠️ Not financial advice. Always manage your risk. 🛡️
🏷️ #ETH #SmartMoney #OrderFlow #Crypto
🦈 ⚖️
14

$ETH Long-ge is starting to cut back on his long positions! Fuck, the trend is clearly bearish. Why the hell am I still going long? By December, I’ll have missed the boat! #ETH #ETHETFsApproved #Binance #AishCryptoTraders
{spot}(ETHUSDT)
$ETH Long-ge is starting to cut back on his long positions! Fuck, the trend is clearly bearish. Why the hell am I still going long? By December, I’ll have missed the boat! #ETH #ETHETFsApproved #Binance #AishCryptoTraders

2
383

·
--

CryptoWithDaniyal
·
--
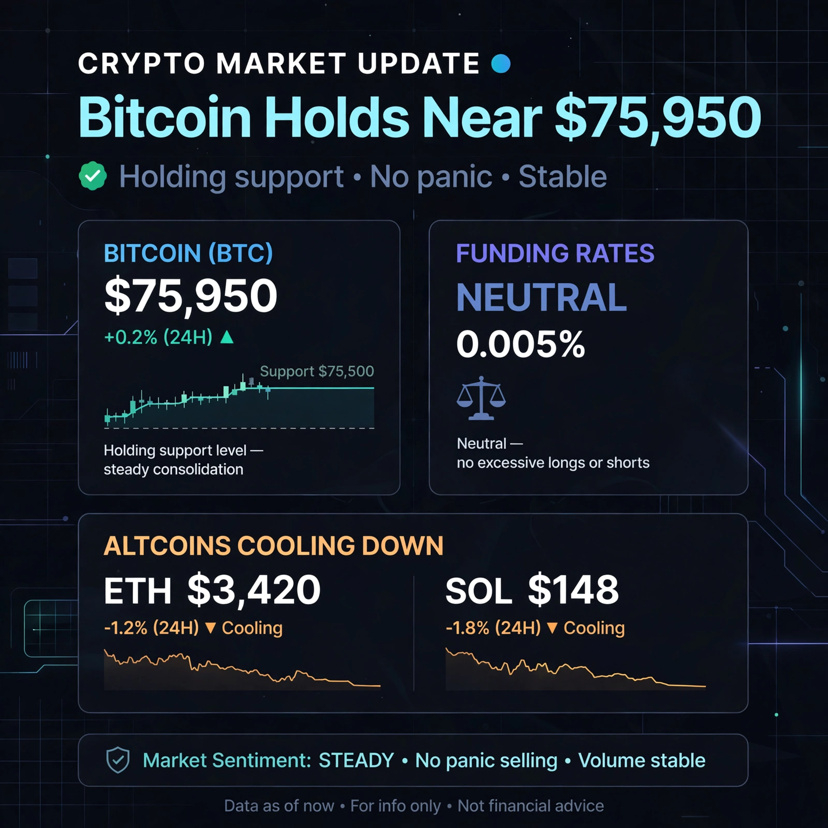
$BTC is holding near $75,950 right now 🔥
Not pumping, not dumping. Just holding strong after last week's fall.
Funding is neutral. No panic, no over leverage. Both sides are calm.
ETH is also looking better. Bearish feeling is easing up.
Market is not bullish yet, but it's not scared anymore. It's waiting for the next move.
Are you buying $BTC and $ETH in this calm, or waiting for a big pump?
#binancepick #btc #ETH #BTC #BinanceSquareTalks
Not pumping, not dumping. Just holding strong after last week's fall.
Funding is neutral. No panic, no over leverage. Both sides are calm.
ETH is also looking better. Bearish feeling is easing up.
Market is not bullish yet, but it's not scared anymore. It's waiting for the next move.
Are you buying $BTC and $ETH in this calm, or waiting for a big pump?
#binancepick #btc #ETH #BTC #BinanceSquareTalks
1
43

·
--
🚨 $ETH AT $2,095 — IS ETHEREUM PREPARING FOR A MASSIVE BOUNCE?
Ethereum is under serious selling pressure, but one signal deserves attention. 👀
📊 ETH MARKET ANALYSIS (1D)
💰 Current Price: $2,095.52
📉 Daily RSI (6): 24.87 — Deep Oversold
📊 MA(50): $2,472.15
🔻 Recent Low: $2,060
🔥 IMPORTANT PRICE LEVELS
🟢 Support Zone: $2,060 – $2,024
🎯 Target 1: $2,180
🎯 Target 2: $2,340
🎯 Target 3: $2,470
⚠️ MY STRATEGY
ETH is trading significantly below its 50-day moving average.
RSI near 25 indicates deeply oversold conditions, but oversold doesn't automatically mean a reversal.
I'm watching $2,060 closely.
A strong recovery above $2,180 could be the first sign of buyers returning.
If support breaks, another downside move remains possible.
🔥 THE BIG QUESTION:
Is this the opportunity ETH buyers have been waiting for, or could $2,000 be next?
🐂 BULLISH or 🐻 BEARISH?
Drop your $ETH prediction below!
FOLLOW ✅ @Square-Creator-654537bd38e1
{future}(ETHUSDT)
#Ethereum #ETH #cryptotrading #BinanceSquare
🚨 $ETH AT $2,095 — IS ETHEREUM PREPARING FOR A MASSIVE BOUNCE?
Ethereum is under serious selling pressure, but one signal deserves attention. 👀
📊 ETH MARKET ANALYSIS (1D)
💰 Current Price: $2,095.52
📉 Daily RSI (6): 24.87 — Deep Oversold
📊 MA(50): $2,472.15
🔻 Recent Low: $2,060
🔥 IMPORTANT PRICE LEVELS
🟢 Support Zone: $2,060 – $2,024
🎯 Target 1: $2,180
🎯 Target 2: $2,340
🎯 Target 3: $2,470
⚠️ MY STRATEGY
ETH is trading significantly below its 50-day moving average.
RSI near 25 indicates deeply oversold conditions, but oversold doesn't automatically mean a reversal.
I'm watching $2,060 closely.
A strong recovery above $2,180 could be the first sign of buyers returning.
If support breaks, another downside move remains possible.
🔥 THE BIG QUESTION:
Is this the opportunity ETH buyers have been waiting for, or could $2,000 be next?
🐂 BULLISH or 🐻 BEARISH?
Drop your $ETH prediction below!
FOLLOW ✅ @RizXen
#Ethereum #ETH #cryptotrading #BinanceSquare
Ethereum is under serious selling pressure, but one signal deserves attention. 👀
📊 ETH MARKET ANALYSIS (1D)
💰 Current Price: $2,095.52
📉 Daily RSI (6): 24.87 — Deep Oversold
📊 MA(50): $2,472.15
🔻 Recent Low: $2,060
🔥 IMPORTANT PRICE LEVELS
🟢 Support Zone: $2,060 – $2,024
🎯 Target 1: $2,180
🎯 Target 2: $2,340
🎯 Target 3: $2,470
⚠️ MY STRATEGY
ETH is trading significantly below its 50-day moving average.
RSI near 25 indicates deeply oversold conditions, but oversold doesn't automatically mean a reversal.
I'm watching $2,060 closely.
A strong recovery above $2,180 could be the first sign of buyers returning.
If support breaks, another downside move remains possible.
🔥 THE BIG QUESTION:
Is this the opportunity ETH buyers have been waiting for, or could $2,000 be next?
🐂 BULLISH or 🐻 BEARISH?
Drop your $ETH prediction below!
FOLLOW ✅ @RizXen
#Ethereum #ETH #cryptotrading #BinanceSquare

134

·
--
Bearish
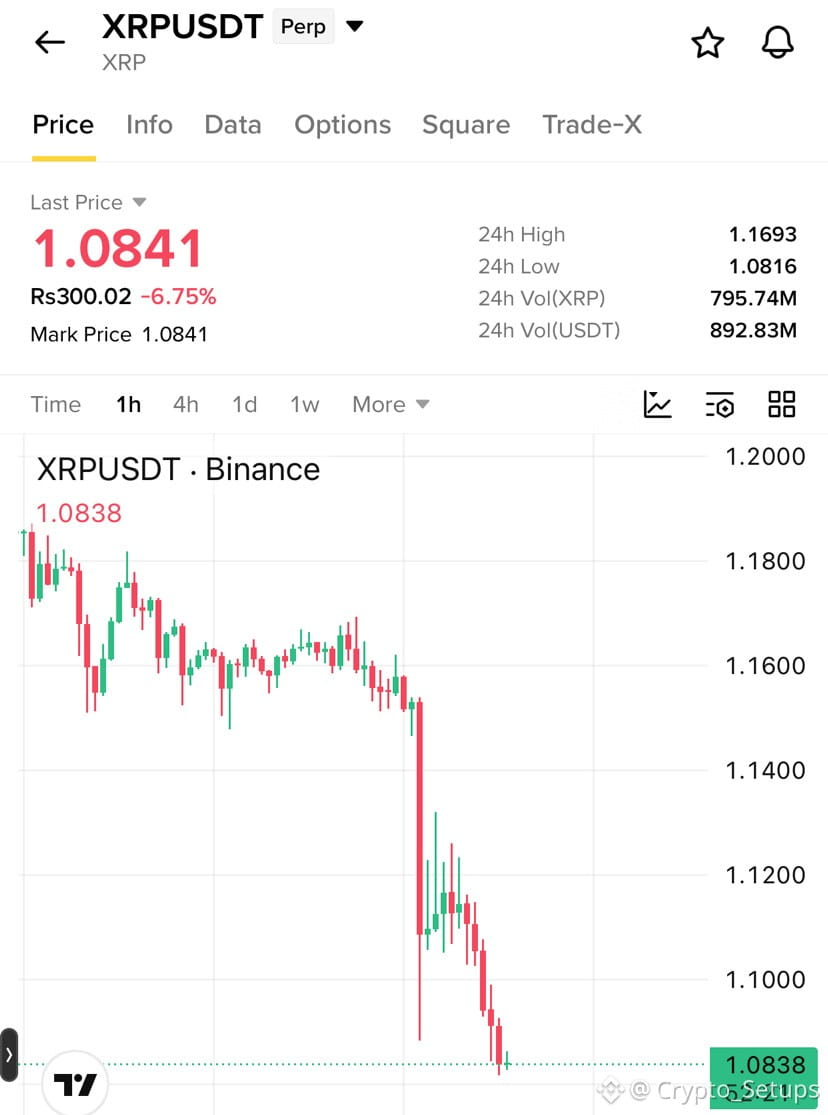
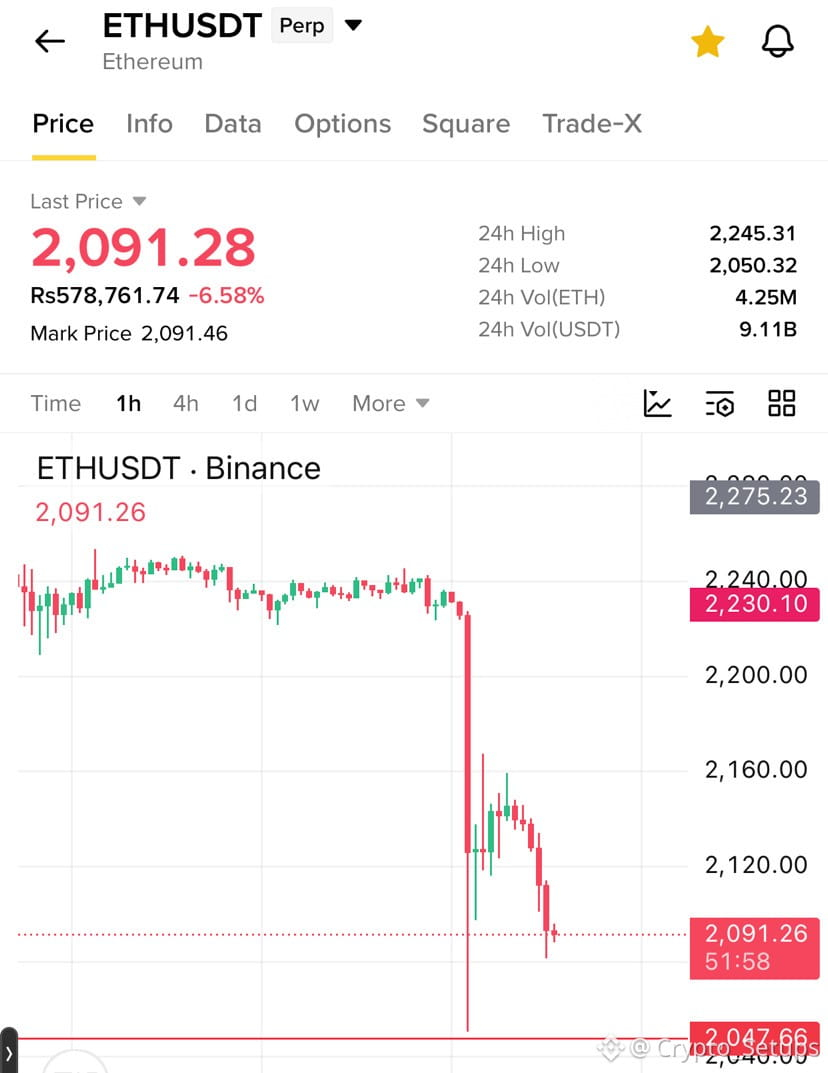
Guys, look closely! $XRP , $ETH , and $BNB are all showing serious selling pressure. Buyers are struggling to defend their levels, and the next move could surprise everyone.
I'm watching these 3 coins for SHORT opportunities. Here are my levels:
1. $XRP SHORT
Entry: 1.090 – 1.105
TP1: 1.075
TP2: 1.060
TP3: 1.040
SL: 1.125
2. #eth SHORT
Entry: 2,105 – 2,125
TP1: 2,075
TP2: 2,050
TP3: 2,020
SL: 2,155
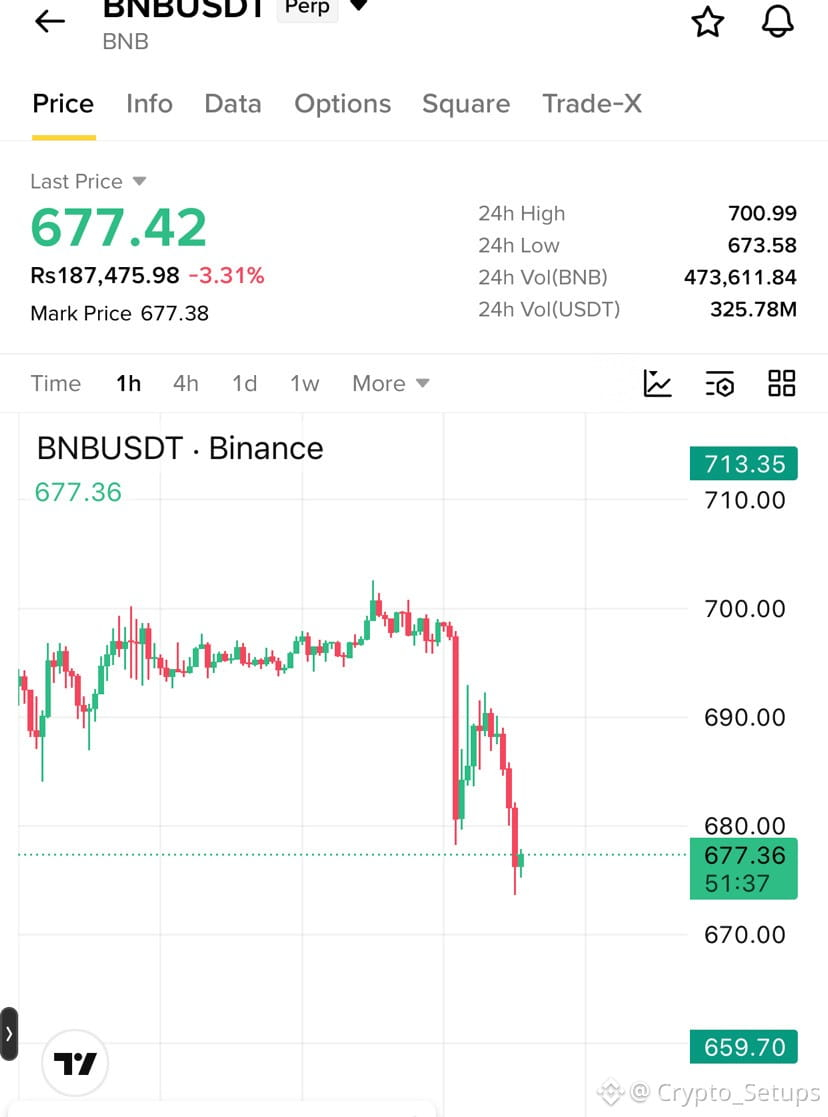
3. $BNB SHORT
Entry: 680 – 685
TP1: 672
TP2: 665
TP3: 655
SL: 692
Will sellers push the market even lower? Stay alert. Don't miss the next move, and always manage your risk!
Remeber guys!! Will watch long after liquidity sweep as wellll
{future}(ETHUSDT)
{future}(XRPUSDT)
Guys, look closely! $XRP , $ETH , and $BNB are all showing serious selling pressure. Buyers are struggling to defend their levels, and the next move could surprise everyone.
I'm watching these 3 coins for SHORT opportunities. Here are my levels:
1. $XRP SHORT
Entry: 1.090 – 1.105
TP1: 1.075
TP2: 1.060
TP3: 1.040
SL: 1.125
2. #eth SHORT
Entry: 2,105 – 2,125
TP1: 2,075
TP2: 2,050
TP3: 2,020
SL: 2,155
3. $BNB SHORT
Entry: 680 – 685
TP1: 672
TP2: 665
TP3: 655
SL: 692
Will sellers push the market even lower? Stay alert. Don't miss the next move, and always manage your risk!
Remeber guys!! Will watch long after liquidity sweep as wellll
I'm watching these 3 coins for SHORT opportunities. Here are my levels:
1. $XRP SHORT
Entry: 1.090 – 1.105
TP1: 1.075
TP2: 1.060
TP3: 1.040
SL: 1.125
2. #eth SHORT
Entry: 2,105 – 2,125
TP1: 2,075
TP2: 2,050
TP3: 2,020
SL: 2,155
3. $BNB SHORT
Entry: 680 – 685
TP1: 672
TP2: 665
TP3: 655
SL: 692
Will sellers push the market even lower? Stay alert. Don't miss the next move, and always manage your risk!
Remeber guys!! Will watch long after liquidity sweep as wellll
20


·
--
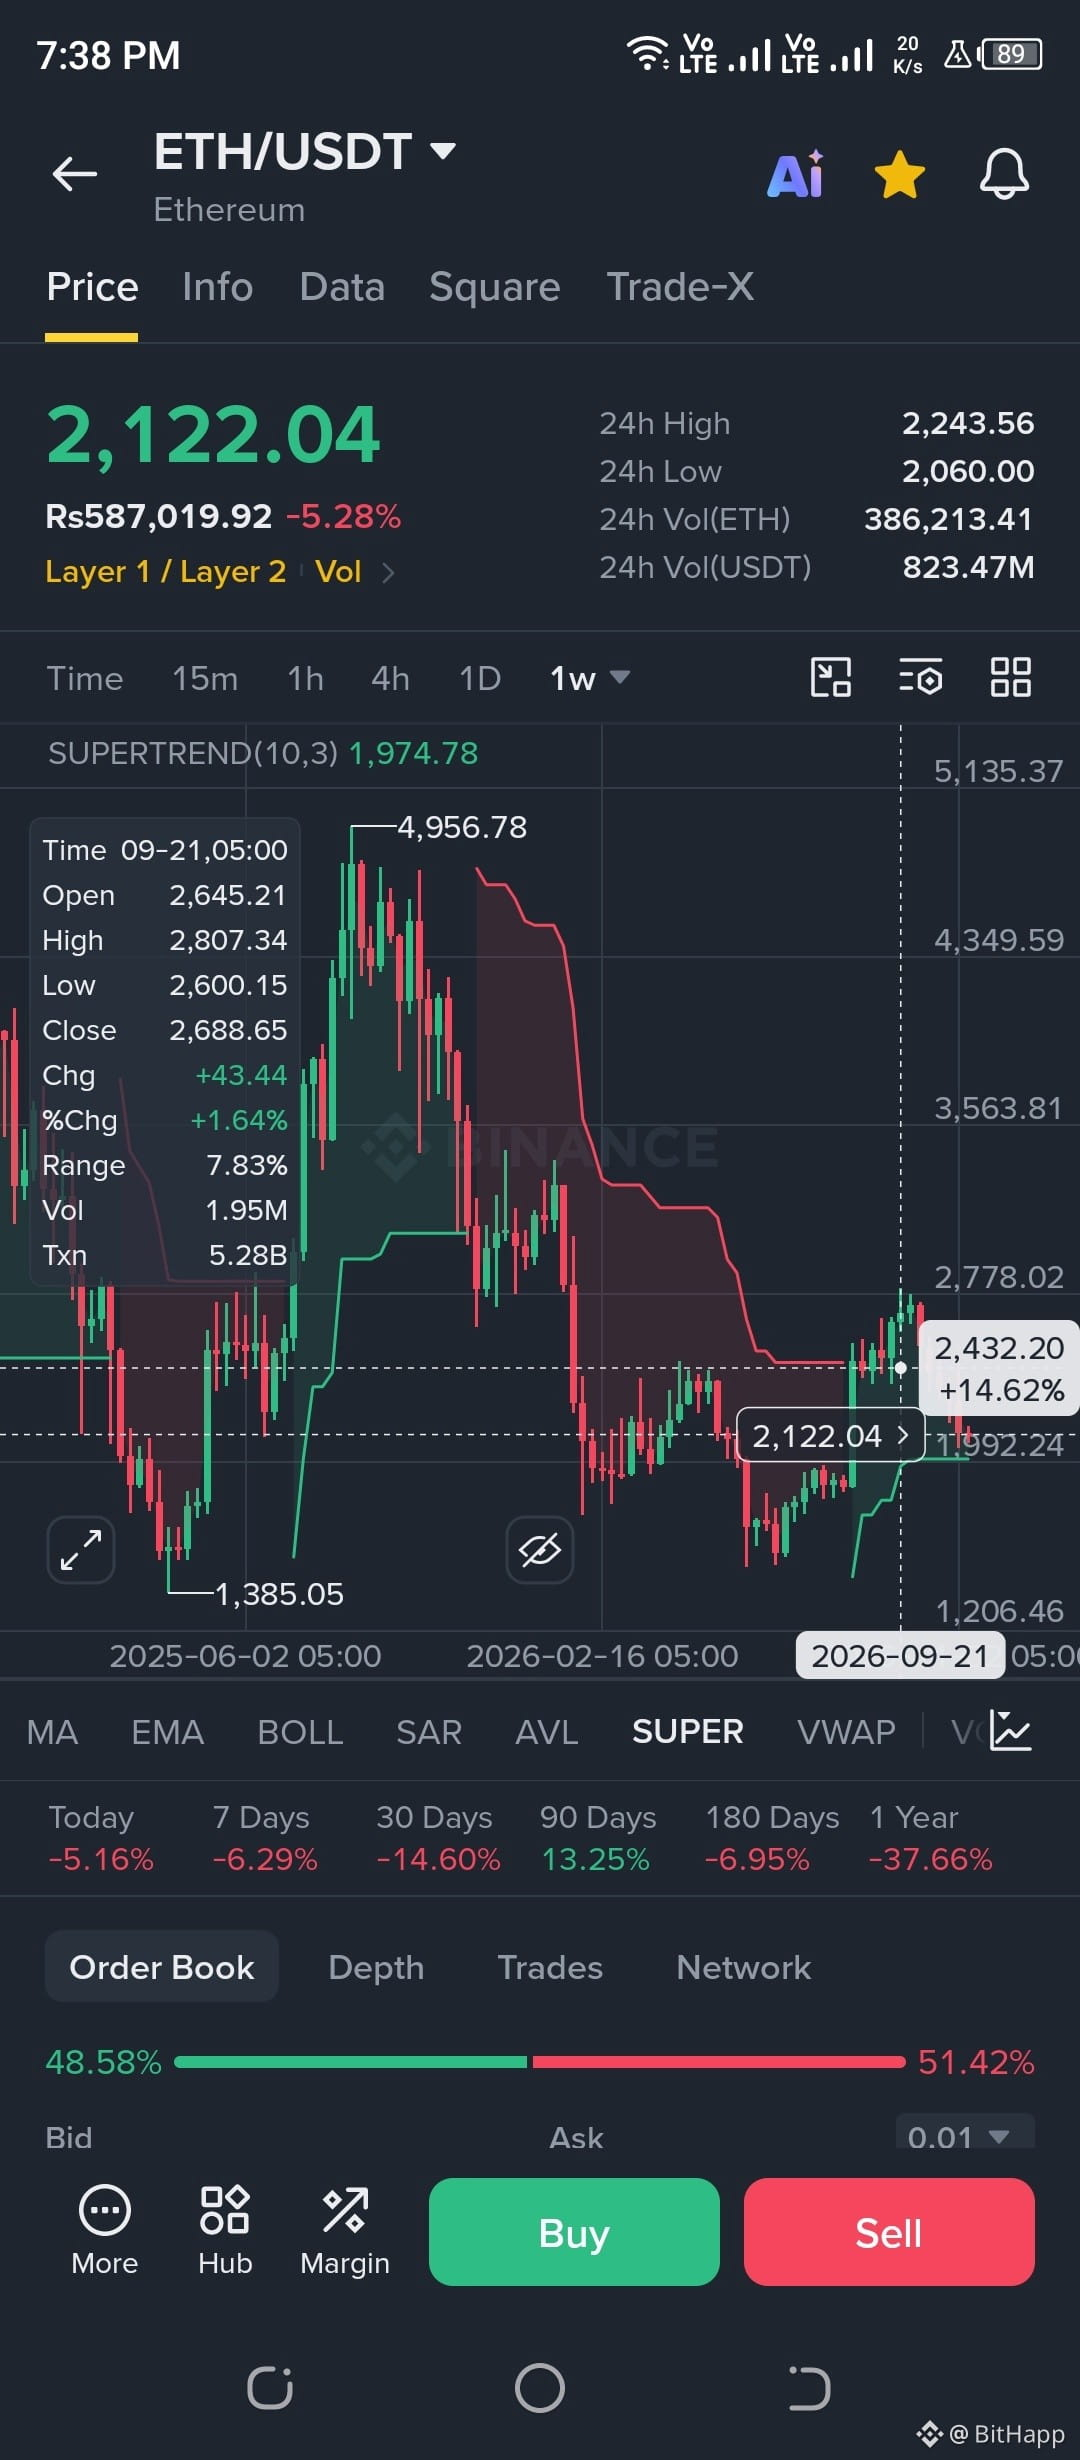
🚨 ETH BOTTOM ZONE — BUYING OPPORTUNITY?
$ETH is trading near a potential weekly support zone. 👀
📊 Buyers are watching this level closely.
📈 A bounce could open the door for a recovery.
🎯 Smart spot traders are watching for confirmation before entering.
Buying the dip or waiting for confirmation?
#ETH #Ethereum #Crypto #BinanceSquare #SpotTrading
Not Financial Advice. High Risk.
🚨 ETH BOTTOM ZONE — BUYING OPPORTUNITY?
$ETH is trading near a potential weekly support zone. 👀
📊 Buyers are watching this level closely.
📈 A bounce could open the door for a recovery.
🎯 Smart spot traders are watching for confirmation before entering.
Buying the dip or waiting for confirmation?
#ETH #Ethereum #Crypto #BinanceSquare #SpotTrading
Not Financial Advice. High Risk.
$ETH is trading near a potential weekly support zone. 👀
📊 Buyers are watching this level closely.
📈 A bounce could open the door for a recovery.
🎯 Smart spot traders are watching for confirmation before entering.
Buying the dip or waiting for confirmation?
#ETH #Ethereum #Crypto #BinanceSquare #SpotTrading
Not Financial Advice. High Risk.
Lion profit:
May the days of plenty come your way too
3
1
24

·
--
Bearish
30D trade $ETH 134.5 USDT
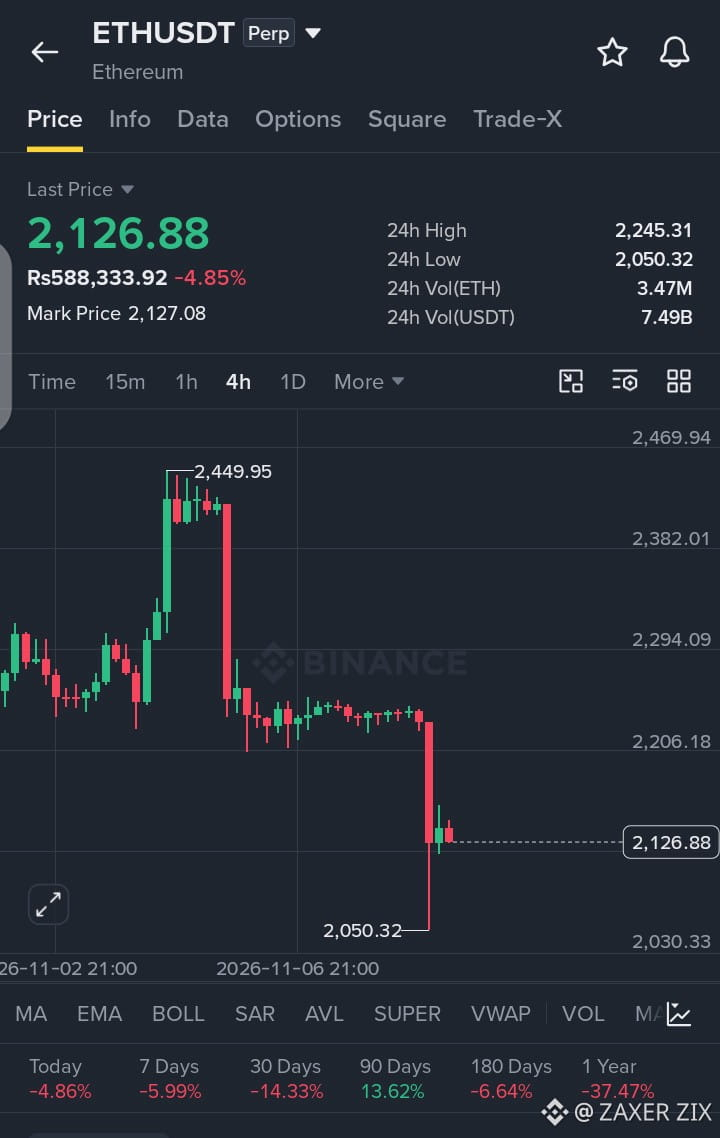
$ETH is trading around $2,126 on the 4H chart after a sharp sell-off from the $2,245 area. The bounce from $2,050 looks weak so far, and sellers are still putting pressure on the price.
SHORT BIAS: Below $2,170
KEY SUPPORT: $2,100
TP1: $2,050
TP2: $2,000
BULLISH INVALIDATION: Reclaiming the $2,170–$2,200 zone
If ETH breaks below $2,100, another move toward $2,050 could follow. A failure to hold $2,050 may open the way toward $2,000. Bulls need to reclaim $2,170–$2,200 to weaken the bearish outlook.
{future}(ETHUSDT)
Manage your risk and don’t overleverage.
#BinanceReopensWithdrawalsForMoreAssets #ETH
$ETH is trading around $2,126 on the 4H chart after a sharp sell-off from the $2,245 area. The bounce from $2,050 looks weak so far, and sellers are still putting pressure on the price.
SHORT BIAS: Below $2,170
KEY SUPPORT: $2,100
TP1: $2,050
TP2: $2,000
BULLISH INVALIDATION: Reclaiming the $2,170–$2,200 zone
If ETH breaks below $2,100, another move toward $2,050 could follow. A failure to hold $2,050 may open the way toward $2,000. Bulls need to reclaim $2,170–$2,200 to weaken the bearish outlook.
Manage your risk and don’t overleverage.
#BinanceReopensWithdrawalsForMoreAssets #ETH
SHORT BIAS: Below $2,170
KEY SUPPORT: $2,100
TP1: $2,050
TP2: $2,000
BULLISH INVALIDATION: Reclaiming the $2,170–$2,200 zone
If ETH breaks below $2,100, another move toward $2,050 could follow. A failure to hold $2,050 may open the way toward $2,000. Bulls need to reclaim $2,170–$2,200 to weaken the bearish outlook.
Manage your risk and don’t overleverage.
#BinanceReopensWithdrawalsForMoreAssets #ETH
1
94


·
--
Article
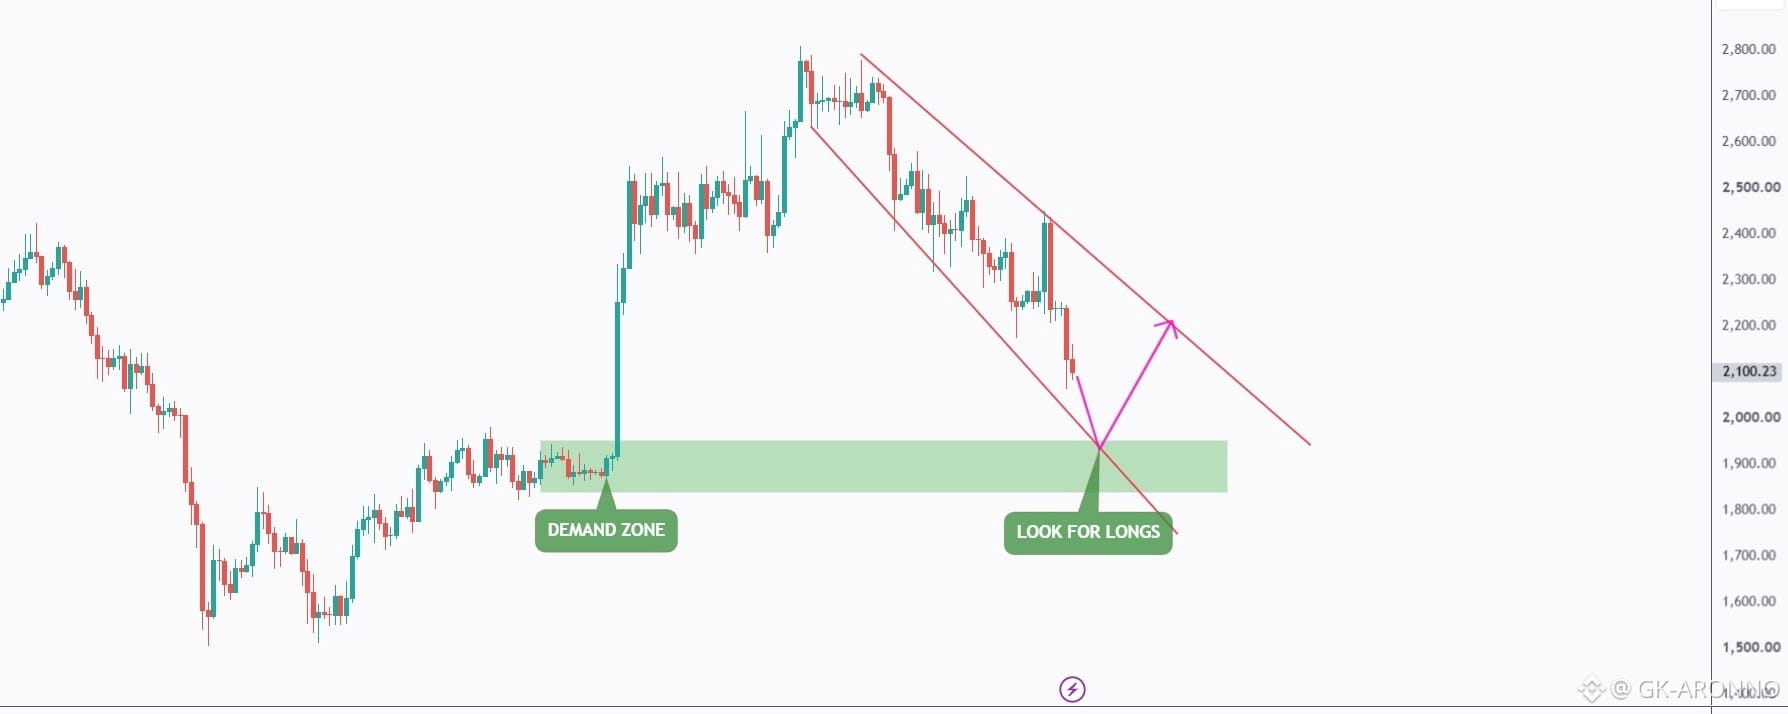
ETH - Oversold at a Strong Demand Zone🧨ETH has been overall bearish, trading within the falling wedge pattern marked in red, with sellers maintaining control of the recent price action.
However, ETH is now approaching an interesting area where multiple technical factors come together.
📊 Technical Outlook
ETH is retesting the lower boundary of its falling wedge, which is considered a potential oversold zone.
Moreover, this lower red trendline intersects with a strong demand zone marked in green, around $1,840–$1,950.
This creates an interesting confluence of two technical factors:
Lower wedge boundary: A potential area for bullish reactions.
Demand zone: A key support area where buyers previously stepped in.
📈 Preferred Scenario
As long as this intersection holds, we will be looking for bullish confirmation and buy setups, anticipating a potential recovery toward the upper boundary of the falling wedge.
A confirmed breakout above the upper red trendline would further strengthen the bullish scenario and suggest a potential shift in momentum.
📌 Important Note
Although ETH remains bearish, buying opportunities can still emerge within a downtrend, especially around strong support areas.
The key is not to predict the exact bottom, but to wait for buyers to confirm their presence before considering an entry.
⚠️ Disclaimer: This analysis is for educational purposes only and does not constitute financial advice. Always manage your risk.
Plan Your Trade and Trade Your Plan. 🍀
$ETH
{future}(ETHUSDT)
#ETH
ETH - Oversold at a Strong Demand Zone🧨
ETH has been overall bearish, trading within the falling wedge pattern marked in red, with sellers maintaining control of the recent price action.
However, ETH is now approaching an interesting area where multiple technical factors come together.
📊 Technical Outlook
ETH is retesting the lower boundary of its falling wedge, which is considered a potential oversold zone.
Moreover, this lower red trendline intersects with a strong demand zone marked in green, around $1,840–$1,950.
This creates an interesting confluence of two technical factors:
Lower wedge boundary: A potential area for bullish reactions.
Demand zone: A key support area where buyers previously stepped in.
📈 Preferred Scenario
As long as this intersection holds, we will be looking for bullish confirmation and buy setups, anticipating a potential recovery toward the upper boundary of the falling wedge.
A confirmed breakout above the upper red trendline would further strengthen the bullish scenario and suggest a potential shift in momentum.
📌 Important Note
Although ETH remains bearish, buying opportunities can still emerge within a downtrend, especially around strong support areas.
The key is not to predict the exact bottom, but to wait for buyers to confirm their presence before considering an entry.
⚠️ Disclaimer: This analysis is for educational purposes only and does not constitute financial advice. Always manage your risk.
Plan Your Trade and Trade Your Plan. 🍀
$ETH
#ETH
However, ETH is now approaching an interesting area where multiple technical factors come together.
📊 Technical Outlook
ETH is retesting the lower boundary of its falling wedge, which is considered a potential oversold zone.
Moreover, this lower red trendline intersects with a strong demand zone marked in green, around $1,840–$1,950.
This creates an interesting confluence of two technical factors:
Lower wedge boundary: A potential area for bullish reactions.
Demand zone: A key support area where buyers previously stepped in.
📈 Preferred Scenario
As long as this intersection holds, we will be looking for bullish confirmation and buy setups, anticipating a potential recovery toward the upper boundary of the falling wedge.
A confirmed breakout above the upper red trendline would further strengthen the bullish scenario and suggest a potential shift in momentum.
📌 Important Note
Although ETH remains bearish, buying opportunities can still emerge within a downtrend, especially around strong support areas.
The key is not to predict the exact bottom, but to wait for buyers to confirm their presence before considering an entry.
⚠️ Disclaimer: This analysis is for educational purposes only and does not constitute financial advice. Always manage your risk.
Plan Your Trade and Trade Your Plan. 🍀
$ETH
#ETH
39

·
--
Bearish
🚨 $ETH – Critical Price Zone! Will Bulls Recover or Bears Push Lower?
Ethereum is facing strong selling pressure after breaking below its $2,200–$2,240 base.
📉 Current Market Structure
- Previous High: $2,449.95
- Sell-Side Liquidity Sweep: $2,050.32
- Current Imbalance Zone: $2,150–$2,225
- Price remains below both EMAs.
🟡 Key Resistance & Supply
The $2,230–$2,245 zone represents the Order Block formed by the final bullish candles before the major drop.
A rejection from this area could put $2,050.32 back in focus.
🟢 What Could Change the Trend?
A confirmed close above $2,260 could signal a shift in market structure, reclaiming supply and breaking the lower-high sequence.
👀 Two Levels to Watch:
- $2,245 retest first?
- Or another liquidity sweep toward $2,050?
Which scenario do you think comes next?
📩 More market reads like this are shared daily in my group. Find the access link in my bio!
#ETH #Ethereum #altcoinseason #PriceAnalysis #TechnicalAnalysise
🚨 $ETH – Critical Price Zone! Will Bulls Recover or Bears Push Lower?
Ethereum is facing strong selling pressure after breaking below its $2,200–$2,240 base.
📉 Current Market Structure
- Previous High: $2,449.95
- Sell-Side Liquidity Sweep: $2,050.32
- Current Imbalance Zone: $2,150–$2,225
- Price remains below both EMAs.
🟡 Key Resistance & Supply
The $2,230–$2,245 zone represents the Order Block formed by the final bullish candles before the major drop.
A rejection from this area could put $2,050.32 back in focus.
🟢 What Could Change the Trend?
A confirmed close above $2,260 could signal a shift in market structure, reclaiming supply and breaking the lower-high sequence.
👀 Two Levels to Watch:
- $2,245 retest first?
- Or another liquidity sweep toward $2,050?
Which scenario do you think comes next?
📩 More market reads like this are shared daily in my group. Find the access link in my bio!
#ETH #Ethereum #altcoinseason #PriceAnalysis #TechnicalAnalysise
Ethereum is facing strong selling pressure after breaking below its $2,200–$2,240 base.
📉 Current Market Structure
- Previous High: $2,449.95
- Sell-Side Liquidity Sweep: $2,050.32
- Current Imbalance Zone: $2,150–$2,225
- Price remains below both EMAs.
🟡 Key Resistance & Supply
The $2,230–$2,245 zone represents the Order Block formed by the final bullish candles before the major drop.
A rejection from this area could put $2,050.32 back in focus.
🟢 What Could Change the Trend?
A confirmed close above $2,260 could signal a shift in market structure, reclaiming supply and breaking the lower-high sequence.
👀 Two Levels to Watch:
- $2,245 retest first?
- Or another liquidity sweep toward $2,050?
Which scenario do you think comes next?
📩 More market reads like this are shared daily in my group. Find the access link in my bio!
#ETH #Ethereum #altcoinseason #PriceAnalysis #TechnicalAnalysise

162
·
--
Article
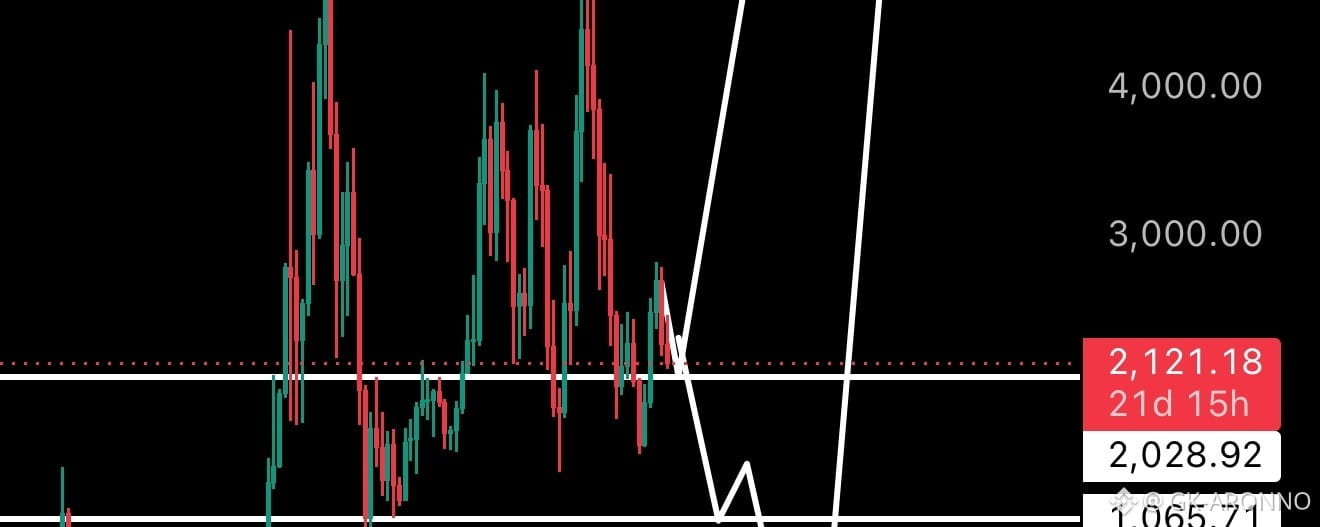
ETH Monthly — Moon Shot or Hell Shot🔱🔥ETH is testing the major $2,000–$2,100 horizontal support on the monthly chart. This zone has acted as both support and resistance multiple times since 2021.
Levels:
• Current: ~$2,118
• First support: $2,000–$2,100
• Intermediate: ~$1,200 (if $2k fails)
• Deep support: $500–$380 zone (marked on chart)
Two paths:
• Hold $2,000–$2,100 and reclaim higher range → moon-shot setup toward $5k+
• Clean monthly close below $2,000 → opens $1,200, then potentially the $500 zone
The next 1–2 monthly closes around this level will likely decide the direction.
What are you seeing — moon shot or hell shot?
Not financial advice. Chart for discussion only.
$ETH
{future}(ETHUSDT)
#ETH
ETH Monthly — Moon Shot or Hell Shot🔱🔥
ETH is testing the major $2,000–$2,100 horizontal support on the monthly chart. This zone has acted as both support and resistance multiple times since 2021.
Levels:
• Current: ~$2,118
• First support: $2,000–$2,100
• Intermediate: ~$1,200 (if $2k fails)
• Deep support: $500–$380 zone (marked on chart)
Two paths:
• Hold $2,000–$2,100 and reclaim higher range → moon-shot setup toward $5k+
• Clean monthly close below $2,000 → opens $1,200, then potentially the $500 zone
The next 1–2 monthly closes around this level will likely decide the direction.
What are you seeing — moon shot or hell shot?
Not financial advice. Chart for discussion only.
$ETH
#ETH
Levels:
• Current: ~$2,118
• First support: $2,000–$2,100
• Intermediate: ~$1,200 (if $2k fails)
• Deep support: $500–$380 zone (marked on chart)
Two paths:
• Hold $2,000–$2,100 and reclaim higher range → moon-shot setup toward $5k+
• Clean monthly close below $2,000 → opens $1,200, then potentially the $500 zone
The next 1–2 monthly closes around this level will likely decide the direction.
What are you seeing — moon shot or hell shot?
Not financial advice. Chart for discussion only.
$ETH
#ETH
72

·
--
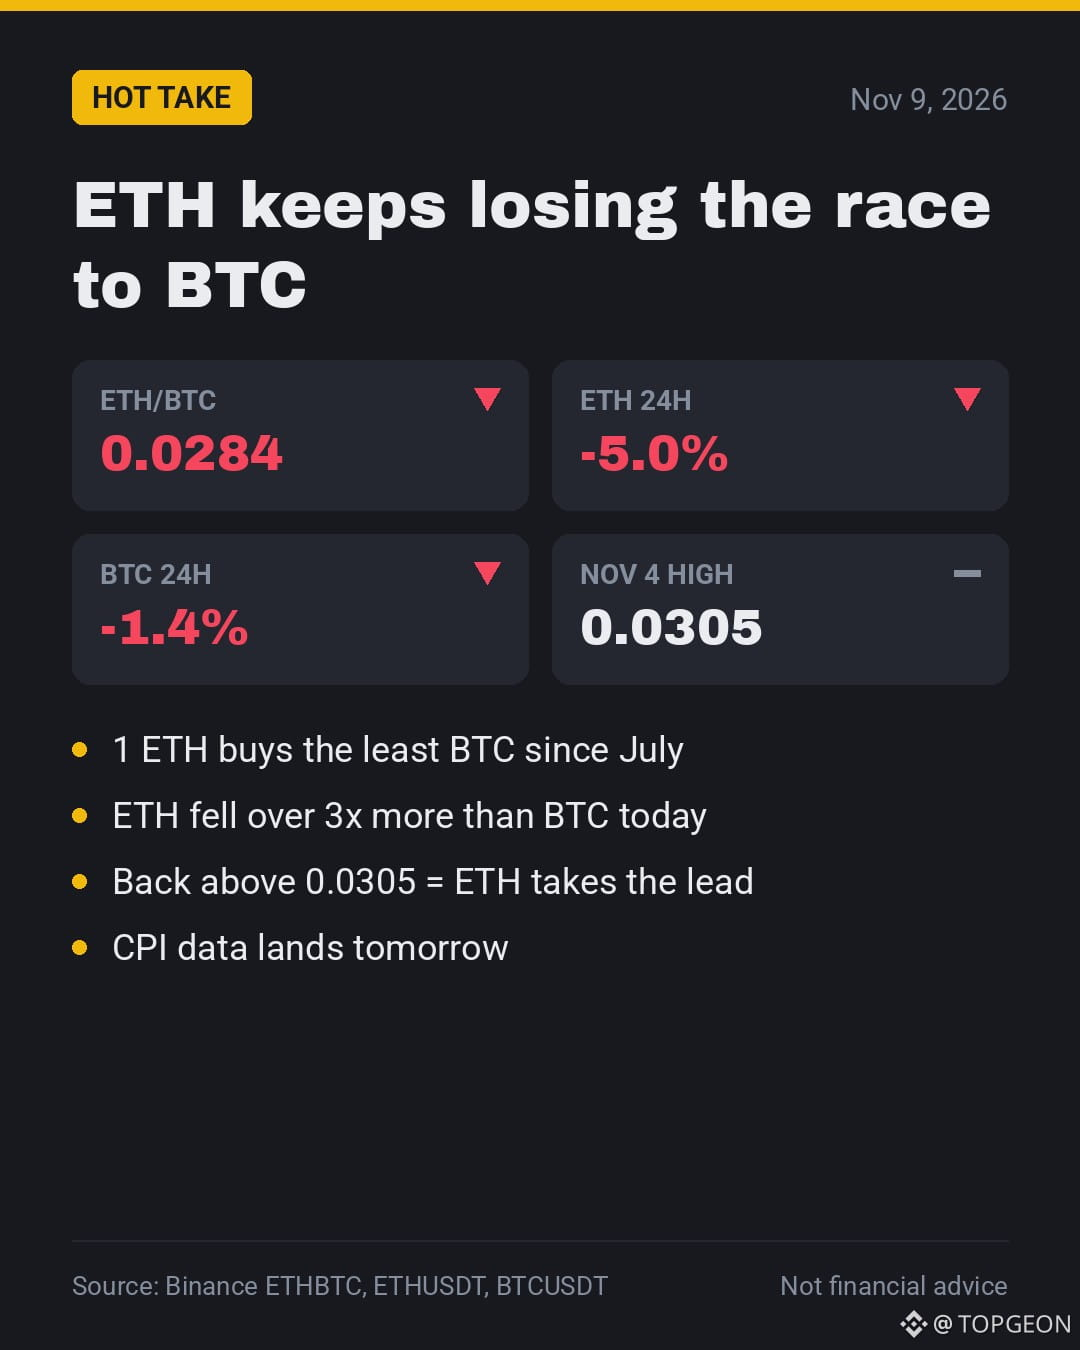
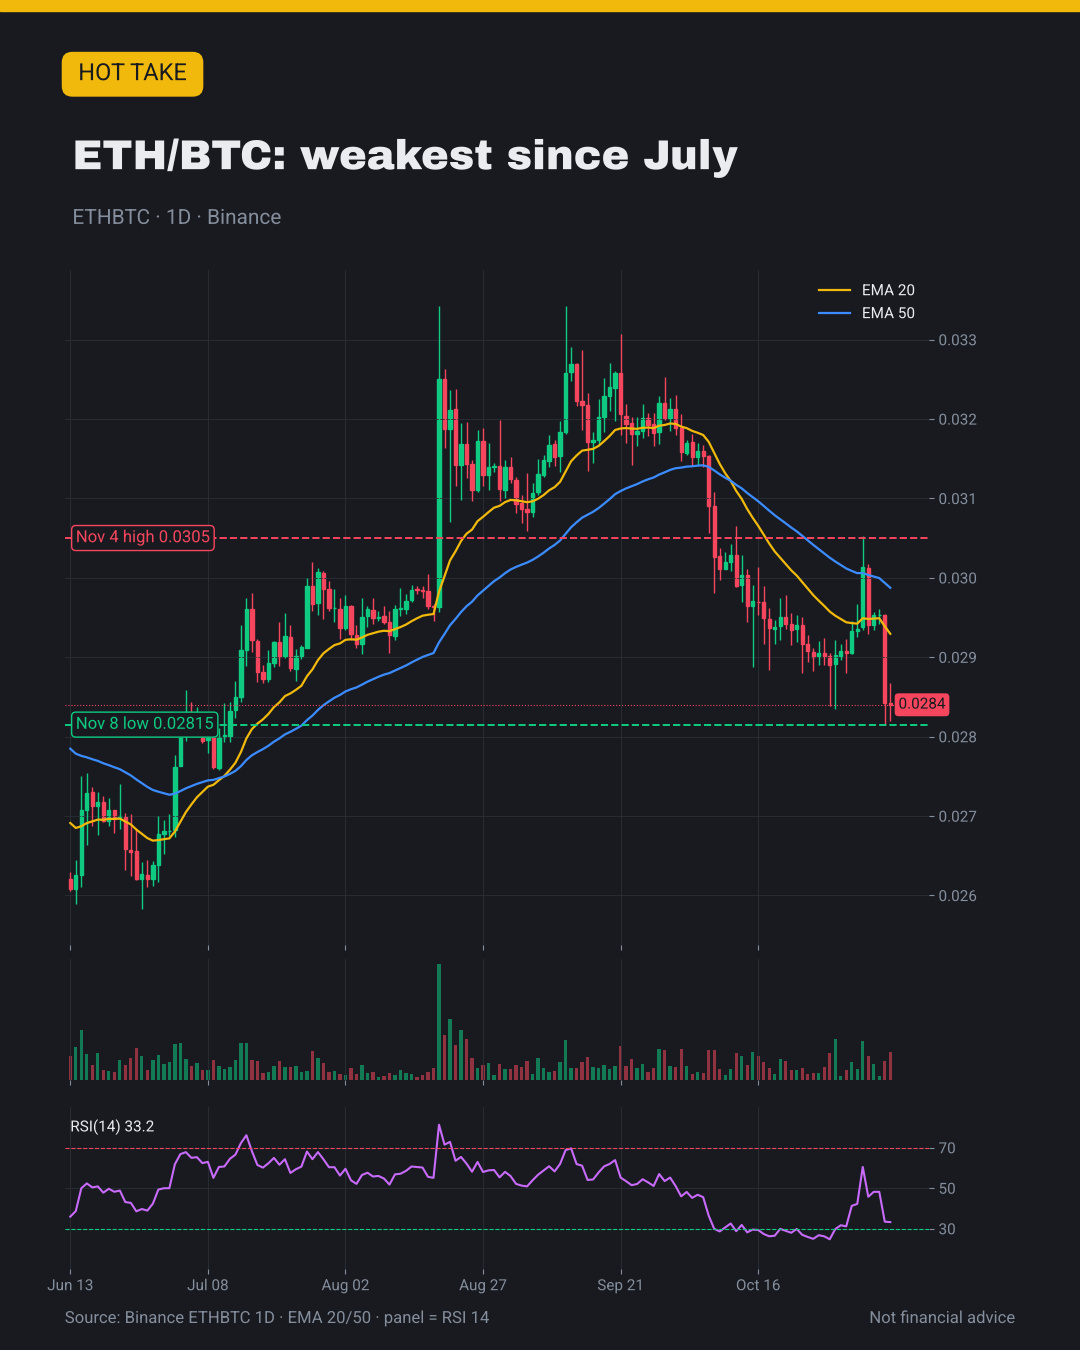
🐢 $ETH keeps losing to $BTC. One ETH now buys just 0.0284 BTC.
📉 That's the least since July, and ETH fell over 3x more than BTC today.
🎯 My take: no altcoin season while this keeps sliding.
💬 Does ETH catch up soon, or is BTC still the safer bet? 👇
#Ethereum #ETH
🐢 $ETH keeps losing to $BTC . One ETH now buys just 0.0284 BTC.
📉 That's the least since July, and ETH fell over 3x more than BTC today.
🎯 My take: no altcoin season while this keeps sliding.
💬 Does ETH catch up soon, or is BTC still the safer bet? 👇
#Ethereum #ETH
📉 That's the least since July, and ETH fell over 3x more than BTC today.
🎯 My take: no altcoin season while this keeps sliding.
💬 Does ETH catch up soon, or is BTC still the safer bet? 👇
#Ethereum #ETH
123
Log in to explore more content
Join global crypto users on Binance Square
⚡️ Get latest and useful information about crypto.
💬 Trusted by the world’s largest crypto exchange.
👍 Discover real insights from verified creators.
Email / Phone number
Trending Topics
1
#NvidiaInvestigatesAfterHuang’sAffairApology
102,187 views
1,123 Discussing
2
#BitcoinFiveWeeklyLosses
125,302 views
1,576 Discussing
3
#AIChipSlumpNasdaq
64,138 views
975 Discussing
4
#CPITestsDecemberRateOutlook
553,012 views
2,397 Discussing
5
#AnthropicRejectsIPODelayValuationinQuestion
10,348 views
214 Discussing
6
#CryptoLiquidationsReach$1.16BIn24Hours
804 views
14 Discussing
7
#BrentCrudeDrops3.8%To$94.56
364 views
8 Discussing
8
#EUInstitutionsInviteIndustryToSetTokenizedSecuritiesStandards
435 views
4 Discussing
9
#ChinaCACListsFiveIssuesAffectingBlockchainFilings
2,917 views
62 Discussing
10
#UKBanksCanNowApplyToConductCryptoAssetBusiness
2,034 views
44 Discussing