
#xpd
xpd
54,224 views
470 Discussing
Hot
Latest

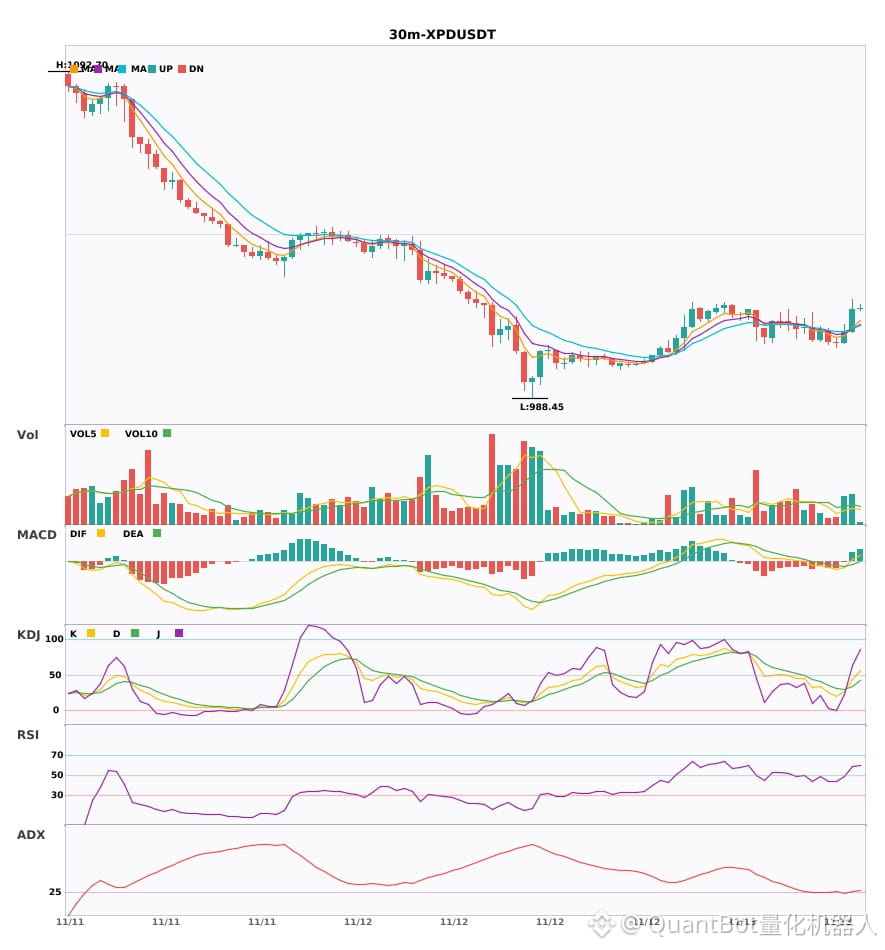
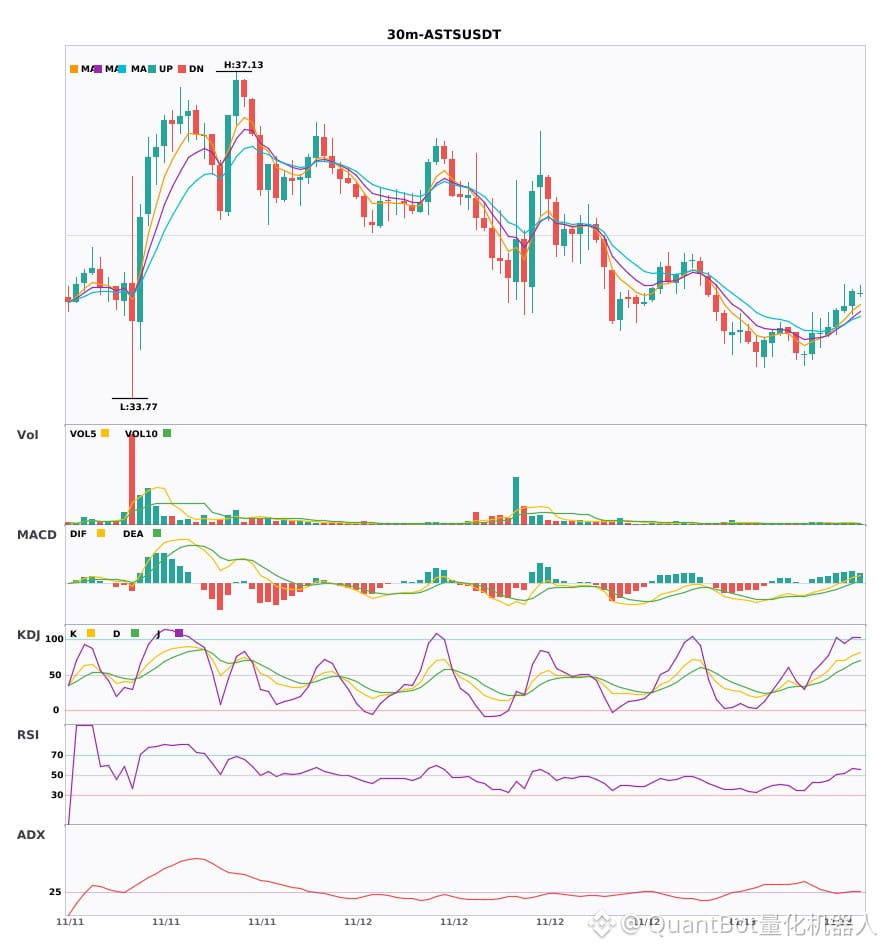
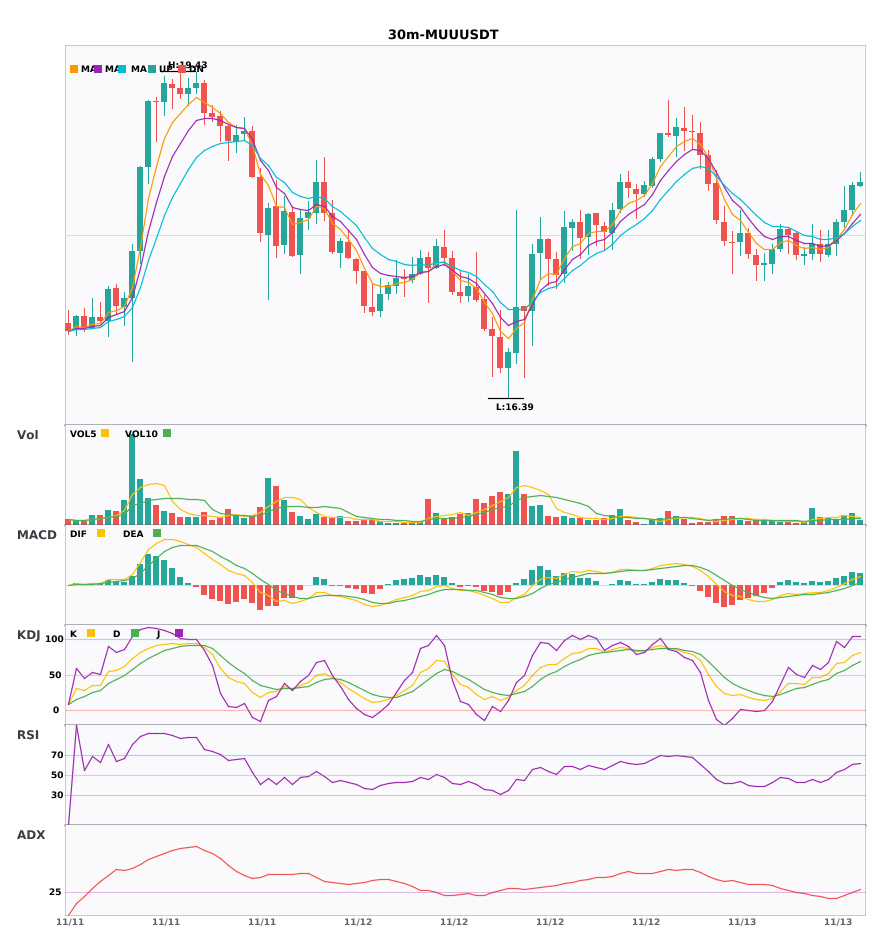
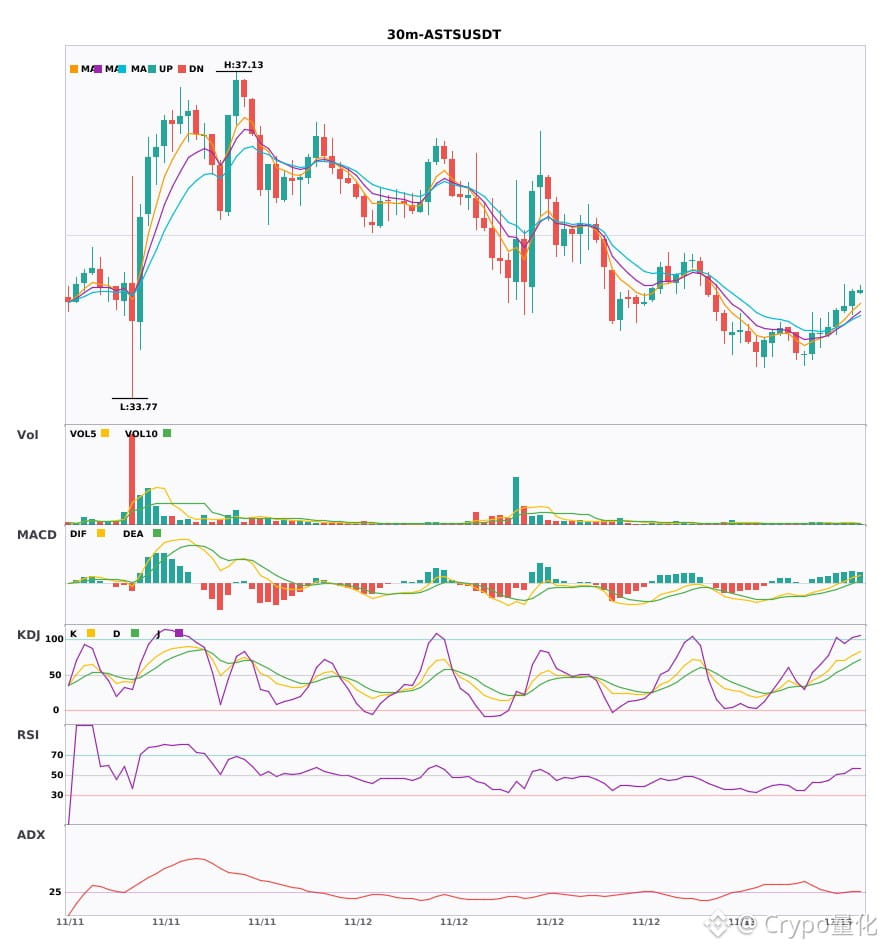
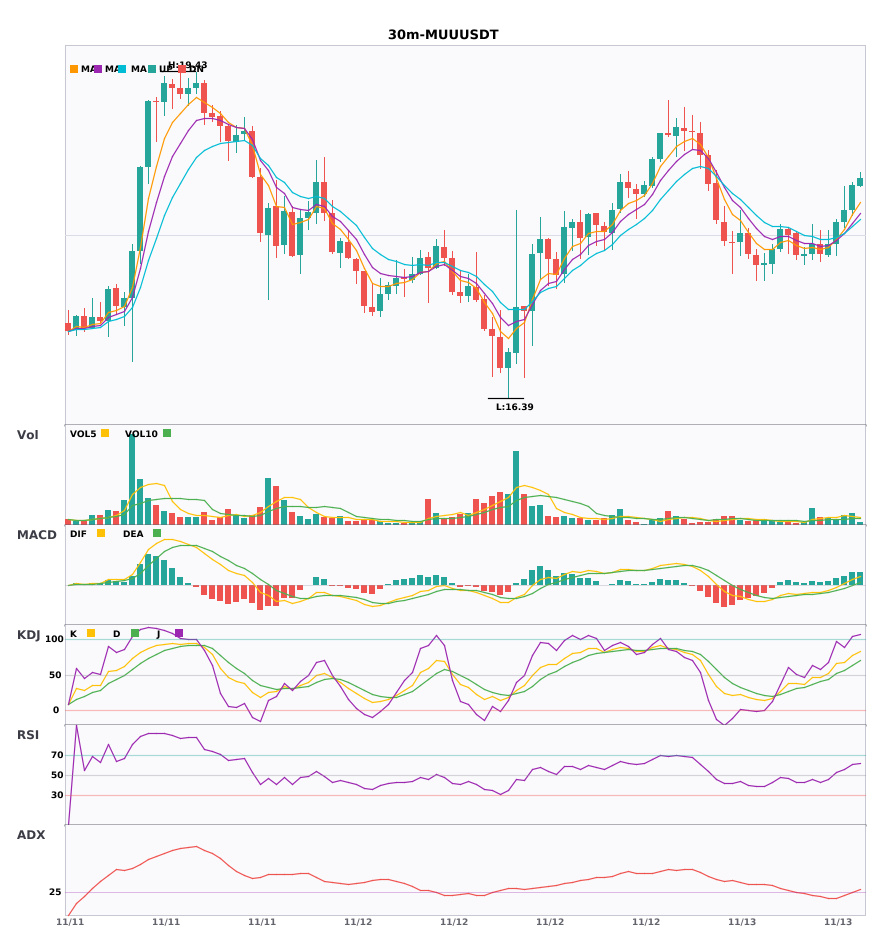
$XPD/$ASTS/$MUU 30-minute multi-timeframe confluence long signal
📈 $XPD | 30-minute bullish signal
━━━━━━━━━━━━━━━━━━
Technical analysis: ADX(28) confirms the trend; entry is possible. MACD bullish crossover above zero, releasing bullish momentum. EMA5 crosses above EMA8, signaling a short-term bullish shift. KDJ bullish crossover (K44.1/D34.3), short-term outlook is bullish. Volume increased 1.5x, confirming the price move.
Price change: 0.7100%
📈 $ASTS | 30-minute bullish signal
━━━━━━━━━━━━━━━━━━
Technical analysis: ADX(28) shows early signs of a trend, presenting an opportunity to participate. MACD DIF breaks above the zero line, signaling a bullish trend shift. EMA5>EMA8>EMA13 bullish alignment. KDJ is elevated, with bulls in control (K:71.0/D:59.4). Volume increased 1.6x.
Price change: 0.1200%
📈 $MUU | 30-minute bullish signal
━━━━━━━━━━━━━━━━━━
Technical analysis: ADX(28) indicates an established trend; entry is possible. MACD is bullish, with strengthening momentum. EMA5>EMA8>EMA13 bullish alignment. KDJ is strong (K77.0/D63.6), and volume increased 1.7x.
Price change: 1.2700%
━━━━━━━━━━━━━━━━━━
#技术分析 #XPD #ASTS #MUU
📌 The above is for reference only and does not constitute investment advice
$XPD /$ASTS /$MUU 30-minute multi-timeframe confluence long signal
📈 $XPD | 30-minute bullish signal
━━━━━━━━━━━━━━━━━━
Technical analysis: ADX(28) confirms the trend; entry is possible. MACD bullish crossover above zero, releasing bullish momentum. EMA5 crosses above EMA8, signaling a short-term bullish shift. KDJ bullish crossover (K44.1/D34.3), short-term outlook is bullish. Volume increased 1.5x, confirming the price move.
Price change: 0.7100%
📈 $ASTS | 30-minute bullish signal
━━━━━━━━━━━━━━━━━━
Technical analysis: ADX(28) shows early signs of a trend, presenting an opportunity to participate. MACD DIF breaks above the zero line, signaling a bullish trend shift. EMA5>EMA8>EMA13 bullish alignment. KDJ is elevated, with bulls in control (K:71.0/D:59.4). Volume increased 1.6x.
Price change: 0.1200%
📈 $MUU | 30-minute bullish signal
━━━━━━━━━━━━━━━━━━
Technical analysis: ADX(28) indicates an established trend; entry is possible. MACD is bullish, with strengthening momentum. EMA5>EMA8>EMA13 bullish alignment. KDJ is strong (K77.0/D63.6), and volume increased 1.7x.
Price change: 1.2700%
━━━━━━━━━━━━━━━━━━
#技术分析 #XPD #ASTS #MUU
📌 The above is for reference only and does not constitute investment advice
📈 $XPD | 30-minute bullish signal
━━━━━━━━━━━━━━━━━━
Technical analysis: ADX(28) confirms the trend; entry is possible. MACD bullish crossover above zero, releasing bullish momentum. EMA5 crosses above EMA8, signaling a short-term bullish shift. KDJ bullish crossover (K44.1/D34.3), short-term outlook is bullish. Volume increased 1.5x, confirming the price move.
Price change: 0.7100%
📈 $ASTS | 30-minute bullish signal
━━━━━━━━━━━━━━━━━━
Technical analysis: ADX(28) shows early signs of a trend, presenting an opportunity to participate. MACD DIF breaks above the zero line, signaling a bullish trend shift. EMA5>EMA8>EMA13 bullish alignment. KDJ is elevated, with bulls in control (K:71.0/D:59.4). Volume increased 1.6x.
Price change: 0.1200%
📈 $MUU | 30-minute bullish signal
━━━━━━━━━━━━━━━━━━
Technical analysis: ADX(28) indicates an established trend; entry is possible. MACD is bullish, with strengthening momentum. EMA5>EMA8>EMA13 bullish alignment. KDJ is strong (K77.0/D63.6), and volume increased 1.7x.
Price change: 1.2700%
━━━━━━━━━━━━━━━━━━
#技术分析 #XPD #ASTS #MUU
📌 The above is for reference only and does not constitute investment advice
1

·
--
$XPD / $ASTS / $MUU 30-minute golden cross with increased volume, bullish bias; short-term confluence favors going long 🔥
════════════════════
🔴 $XPD 30-minute bullish signal
⚠️ Technicals: ADX trend is just forming, MACD golden cross above zero, EMA5 crossed above EMA8, KDJ golden cross with K above D and not overbought; volume is up 1.5x, so it may be worth participating.
════════════════════
🔴 $ASTS 30-minute bullish signal
⚠️ Technicals: ADX trend is just starting to emerge; after the MACD golden cross, DIF moved above the zero line, turning bullish; moving averages are in a bullish alignment and spreading upward; in KDJ, K crossed above D and is running strongly; volume is up 1.6x, with bulls in control, so it may be worth participating.
════════════════════
🔴 $MUU 30-minute bullish signal
⚠️ Technicals: ADX trend has emerged, so entry is possible | MACD golden cross, with rising volume and expanding red bars | Moving averages are in a bullish alignment and trending upward | K in KDJ crossed above D; not overbought, with bulls in control | Volume is up 1.7x
════════════════════
🔔 Follow for first-hand market alerts 🔔
#技术分析 #XPD #ASTS #MUU
📌 When trading, pay attention to whether the candlestick pattern meets expectations
$XPD / $ASTS / $MUU 30-minute golden cross with increased volume, bullish bias; short-term confluence favors going long 🔥
════════════════════
🔴 $XPD 30-minute bullish signal
⚠️ Technicals: ADX trend is just forming, MACD golden cross above zero, EMA5 crossed above EMA8, KDJ golden cross with K above D and not overbought; volume is up 1.5x, so it may be worth participating.
════════════════════
🔴 $ASTS 30-minute bullish signal
⚠️ Technicals: ADX trend is just starting to emerge; after the MACD golden cross, DIF moved above the zero line, turning bullish; moving averages are in a bullish alignment and spreading upward; in KDJ, K crossed above D and is running strongly; volume is up 1.6x, with bulls in control, so it may be worth participating.
════════════════════
🔴 $MUU 30-minute bullish signal
⚠️ Technicals: ADX trend has emerged, so entry is possible | MACD golden cross, with rising volume and expanding red bars | Moving averages are in a bullish alignment and trending upward | K in KDJ crossed above D; not overbought, with bulls in control | Volume is up 1.7x
════════════════════
🔔 Follow for first-hand market alerts 🔔
#技术分析 #XPD #ASTS #MUU
📌 When trading, pay attention to whether the candlestick pattern meets expectations
════════════════════
🔴 $XPD 30-minute bullish signal
⚠️ Technicals: ADX trend is just forming, MACD golden cross above zero, EMA5 crossed above EMA8, KDJ golden cross with K above D and not overbought; volume is up 1.5x, so it may be worth participating.
════════════════════
🔴 $ASTS 30-minute bullish signal
⚠️ Technicals: ADX trend is just starting to emerge; after the MACD golden cross, DIF moved above the zero line, turning bullish; moving averages are in a bullish alignment and spreading upward; in KDJ, K crossed above D and is running strongly; volume is up 1.6x, with bulls in control, so it may be worth participating.
════════════════════
🔴 $MUU 30-minute bullish signal
⚠️ Technicals: ADX trend has emerged, so entry is possible | MACD golden cross, with rising volume and expanding red bars | Moving averages are in a bullish alignment and trending upward | K in KDJ crossed above D; not overbought, with bulls in control | Volume is up 1.7x
════════════════════
🔔 Follow for first-hand market alerts 🔔
#技术分析 #XPD #ASTS #MUU
📌 When trading, pay attention to whether the candlestick pattern meets expectations
11
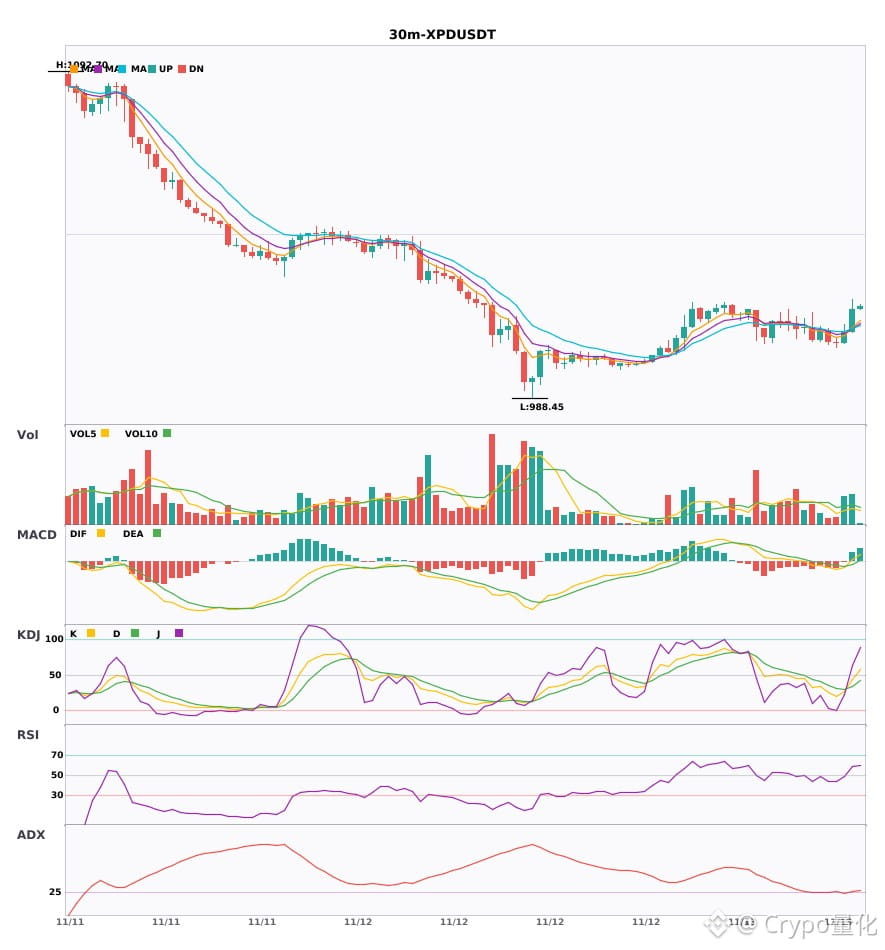
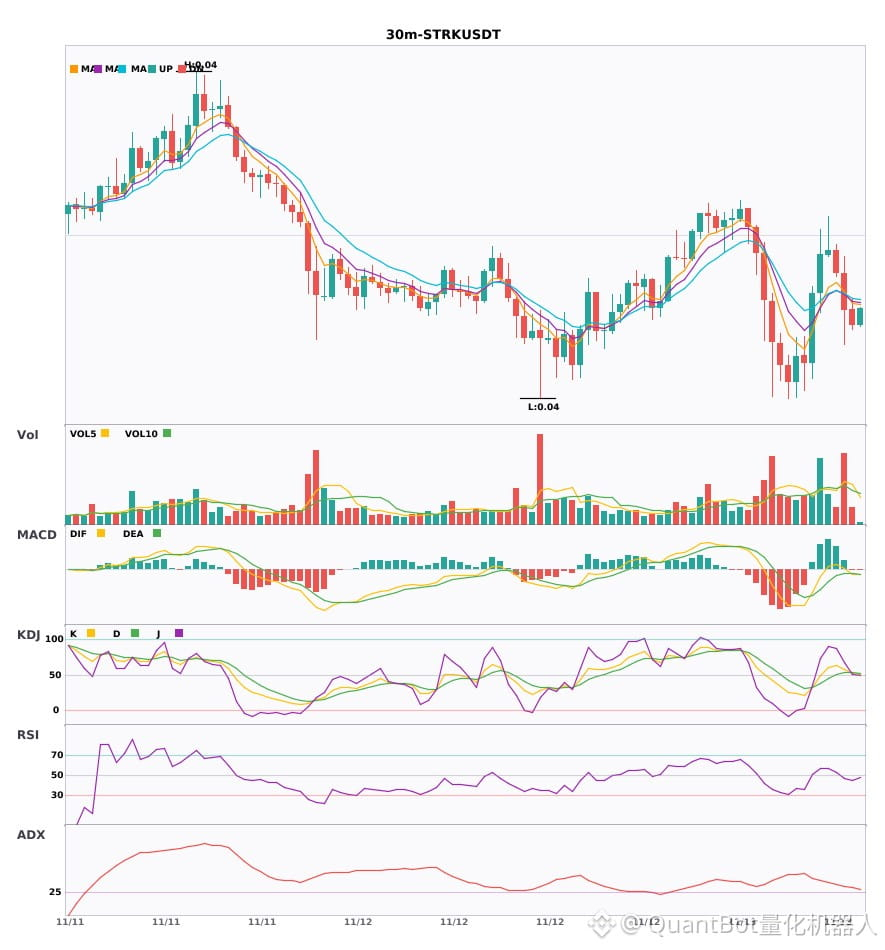
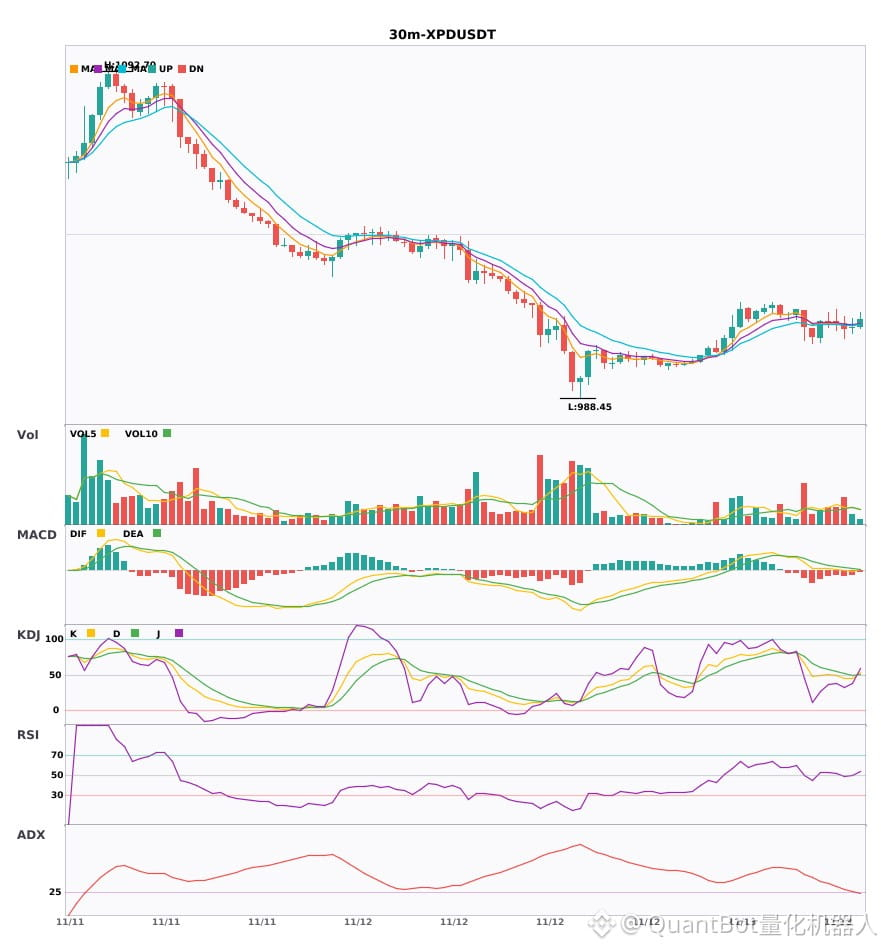
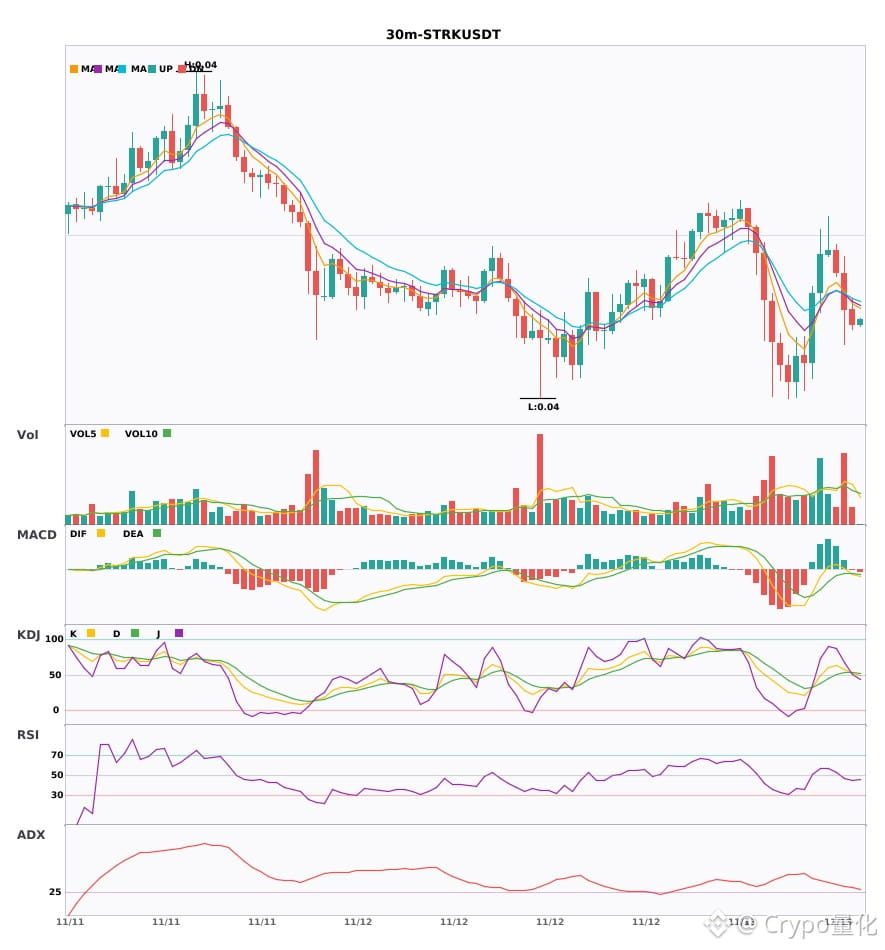
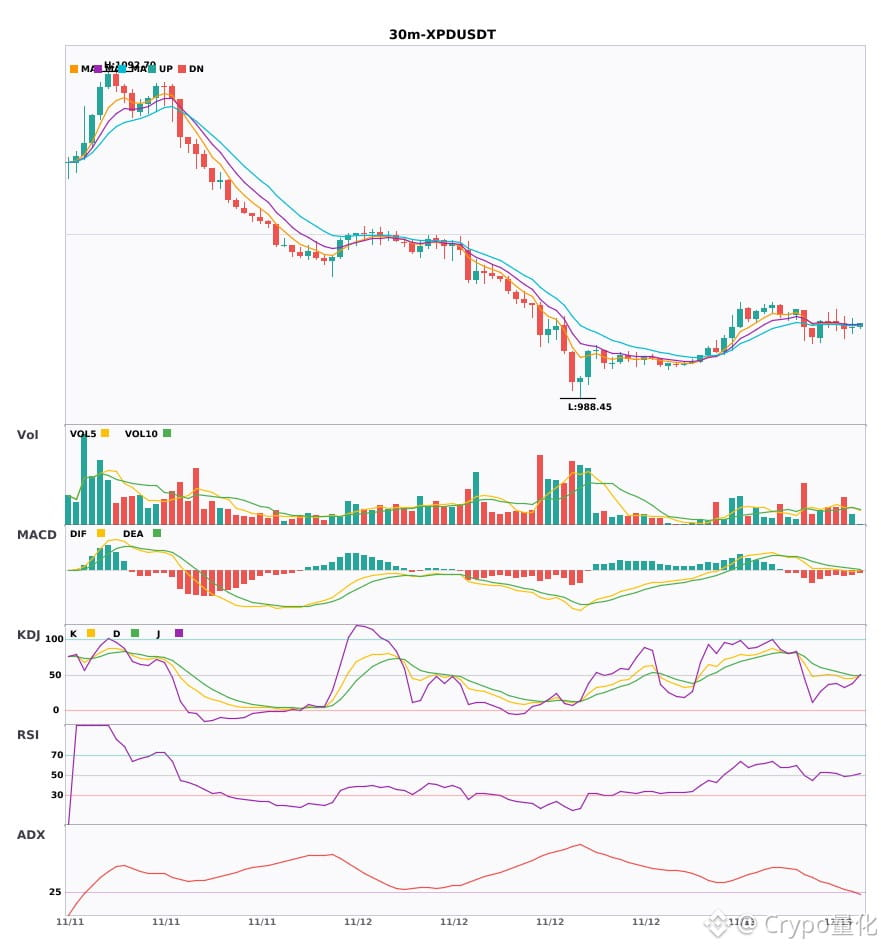
30-minute timeframe bearish alert for two coins: $STRK / $XPD
📉 $STRK | 30-minute bearish signal
━━━━━━━━━━━━━━━━━━
Technical analysis: ADX31 trend; MACD bearish crossover below zero; EMA5 crosses below 8, short-term bearish; KDJ bearish crossover, K52.1/D53.1; volume up 1.8x
Price change: -0.4700%
📉 $XPD | 30-minute bearish signal
━━━━━━━━━━━━━━━━━━
Technical analysis: ADX(26) indicates a trend is taking shape, presenting an opportunity to participate; MACD DIF crosses below the zero line, shifting to a bearish setup; moving averages are converging, with direction yet to be determined; KDJ is trending weakly (K45.7 D49.6), with sellers in control; trading volume up 1.6x.
Price change: 0.0700%
━━━━━━━━━━━━━━━━━━
#技术分析 #STRK #XPD
📌 The above is for reference only and does not constitute investment advice
30-minute timeframe bearish alert for two coins: $STRK / $XPD
📉 $STRK | 30-minute bearish signal
━━━━━━━━━━━━━━━━━━
Technical analysis: ADX31 trend; MACD bearish crossover below zero; EMA5 crosses below 8, short-term bearish; KDJ bearish crossover, K52.1/D53.1; volume up 1.8x
Price change: -0.4700%
📉 $XPD | 30-minute bearish signal
━━━━━━━━━━━━━━━━━━
Technical analysis: ADX(26) indicates a trend is taking shape, presenting an opportunity to participate; MACD DIF crosses below the zero line, shifting to a bearish setup; moving averages are converging, with direction yet to be determined; KDJ is trending weakly (K45.7 D49.6), with sellers in control; trading volume up 1.6x.
Price change: 0.0700%
━━━━━━━━━━━━━━━━━━
#技术分析 #STRK #XPD
📌 The above is for reference only and does not constitute investment advice
📉 $STRK | 30-minute bearish signal
━━━━━━━━━━━━━━━━━━
Technical analysis: ADX31 trend; MACD bearish crossover below zero; EMA5 crosses below 8, short-term bearish; KDJ bearish crossover, K52.1/D53.1; volume up 1.8x
Price change: -0.4700%
📉 $XPD | 30-minute bearish signal
━━━━━━━━━━━━━━━━━━
Technical analysis: ADX(26) indicates a trend is taking shape, presenting an opportunity to participate; MACD DIF crosses below the zero line, shifting to a bearish setup; moving averages are converging, with direction yet to be determined; KDJ is trending weakly (K45.7 D49.6), with sellers in control; trading volume up 1.6x.
Price change: 0.0700%
━━━━━━━━━━━━━━━━━━
#技术分析 #STRK #XPD
📌 The above is for reference only and does not constitute investment advice
9
·
--
$STRK / $XPD 30-minute bearish bias, pressured by bearishly aligned moving averages 🔥
════════════════════
🟢 $STRK 30-minute bearish signal
⚠️Technical analysis: ADX 31 indicates a clear trend; the MACD death cross is accelerating bearish momentum; moving averages have just crossed bearishly; the KDJ death cross signals downside; volume is up about 1.8x.
════════════════════
🟢 $XPD 30-minute bearish signal
⚠️Technical analysis: The ADX trend is just starting and may be followed; the MACD death cross has fallen below the zero line, indicating a bearish bias; moving averages are converging as the market awaits direction; KDJ is weak but not oversold, with K crossing below D; volume is up 1.6x.
════════════════════
🔔 Follow us for first-hand market updates 🔔
#技术分析 #STRK #XPD
📌 When trading, watch whether the candlestick pattern confirms the setup
$STRK / $XPD 30-minute bearish bias, pressured by bearishly aligned moving averages 🔥
════════════════════
🟢 $STRK 30-minute bearish signal
⚠️Technical analysis: ADX 31 indicates a clear trend; the MACD death cross is accelerating bearish momentum; moving averages have just crossed bearishly; the KDJ death cross signals downside; volume is up about 1.8x.
════════════════════
🟢 $XPD 30-minute bearish signal
⚠️Technical analysis: The ADX trend is just starting and may be followed; the MACD death cross has fallen below the zero line, indicating a bearish bias; moving averages are converging as the market awaits direction; KDJ is weak but not oversold, with K crossing below D; volume is up 1.6x.
════════════════════
🔔 Follow us for first-hand market updates 🔔
#技术分析 #STRK #XPD
📌 When trading, watch whether the candlestick pattern confirms the setup
════════════════════
🟢 $STRK 30-minute bearish signal
⚠️Technical analysis: ADX 31 indicates a clear trend; the MACD death cross is accelerating bearish momentum; moving averages have just crossed bearishly; the KDJ death cross signals downside; volume is up about 1.8x.
════════════════════
🟢 $XPD 30-minute bearish signal
⚠️Technical analysis: The ADX trend is just starting and may be followed; the MACD death cross has fallen below the zero line, indicating a bearish bias; moving averages are converging as the market awaits direction; KDJ is weak but not oversold, with K crossing below D; volume is up 1.6x.
════════════════════
🔔 Follow us for first-hand market updates 🔔
#技术分析 #STRK #XPD
📌 When trading, watch whether the candlestick pattern confirms the setup
7
·
--
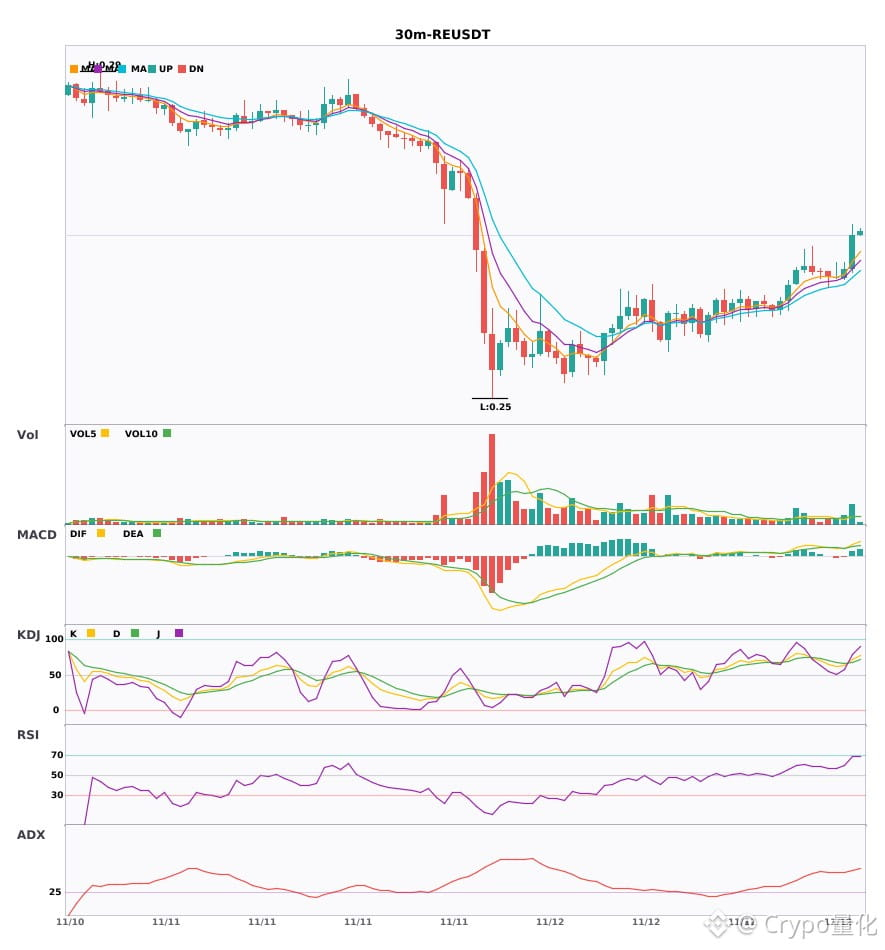
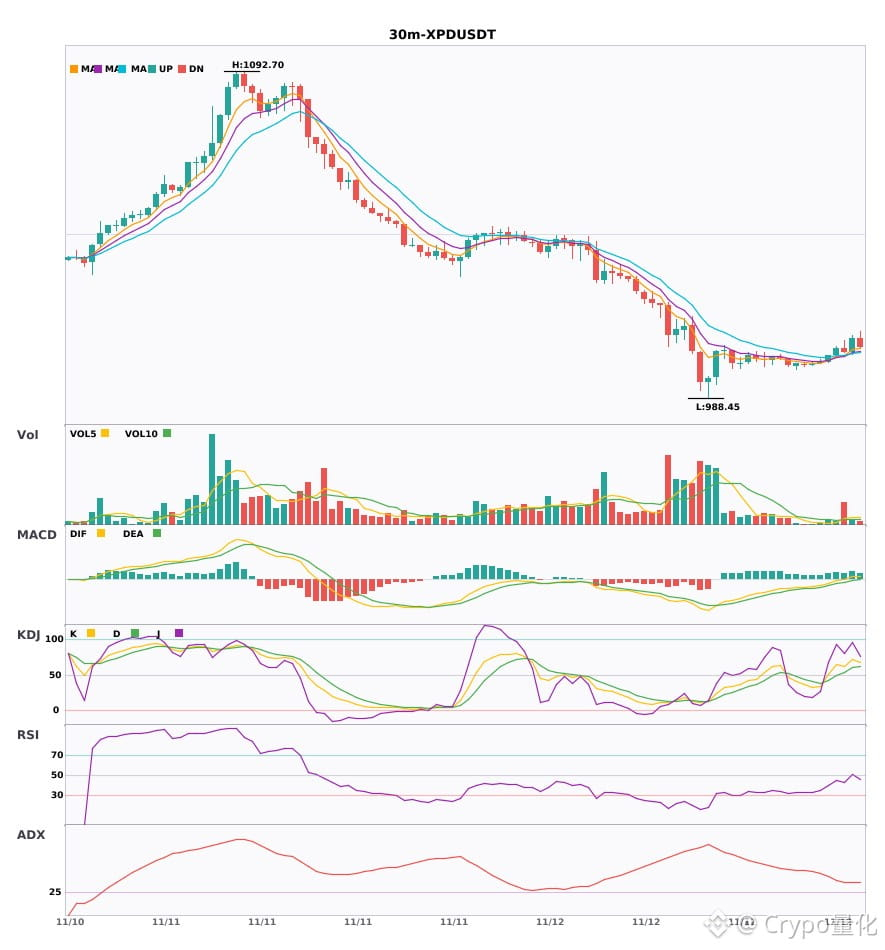
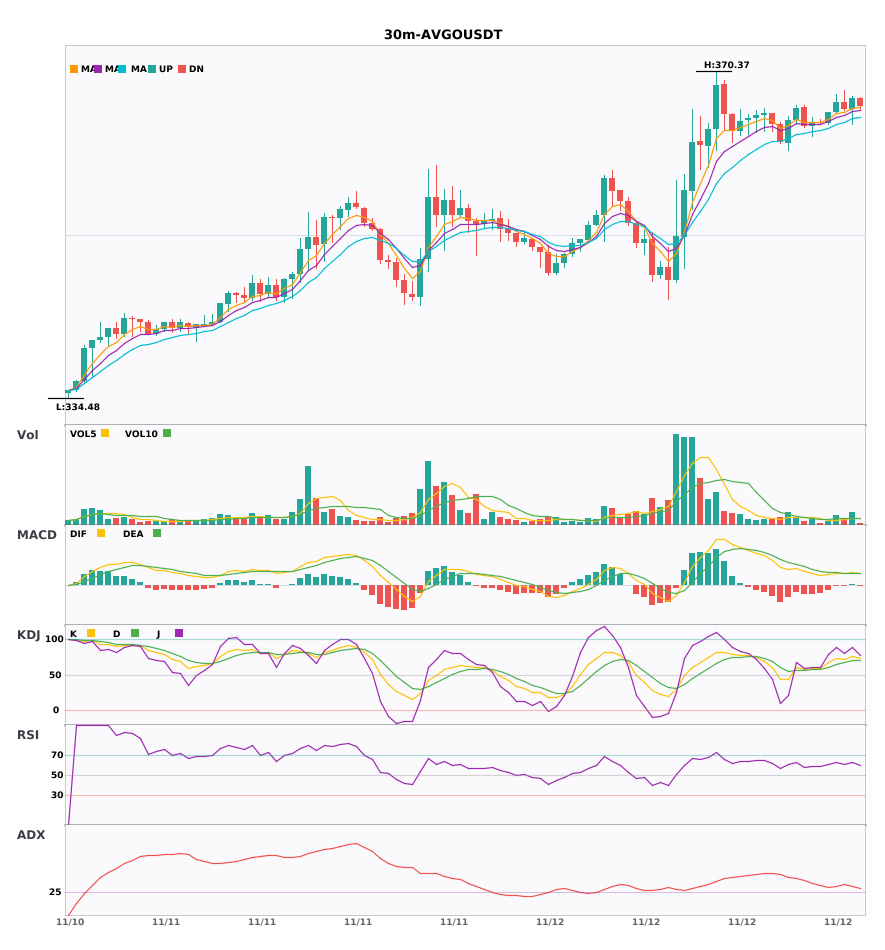
$RE / $XPD / $AVGO 30-minute technical indicators are strengthening in sync—which has greater explosive potential? 🔥
════════════════════
🔴 $RE 30-minute bullish signal
⚠️Technical analysis: ADX(52) very strong trend (beware of an overheated pullback) | MACD golden cross above zero, bullish momentum released | EMA5 > EMA8 > EMA13, bullish alignment | KDJ golden cross, bullish short-term outlook (K=71.5, D=68.0) | Volume expanded (2.3x)
════════════════════
🔴 $XPD 30-minute bullish signal
⚠️Technical analysis: ADX(36) clear trending market | MACD DIF breaks above the zero line, trend turns bullish | EMA5 > EMA8 > EMA13, bullish alignment | KDJ showing strength, bulls in control (K=71.8, D=59.9) | Volume surges (3.9x)
════════════════════
🔴 $AVGO 30-minute bullish signal
⚠️Technical analysis: ADX(29) trend is forming, opportunity to participate | MACD golden cross above zero, bullish momentum released | EMA5 > EMA8 > EMA13, bullish alignment | KDJ showing strength, bulls in control (K=76.2, D=70.1) | Volume expanded (1.8x)
════════════════════
🔔 Follow for first-hand market alerts 🔔
#技术分析 #RE #XPD #AVGO
📌 When trading, pay attention to whether the candlestick pattern is confirming
$RE / $XPD / $AVGO 30-minute technical indicators are strengthening in sync—which has greater explosive potential? 🔥
════════════════════
🔴 $RE 30-minute bullish signal
⚠️Technical analysis: ADX(52) very strong trend (beware of an overheated pullback) | MACD golden cross above zero, bullish momentum released | EMA5 > EMA8 > EMA13, bullish alignment | KDJ golden cross, bullish short-term outlook (K=71.5, D=68.0) | Volume expanded (2.3x)
════════════════════
🔴 $XPD 30-minute bullish signal
⚠️Technical analysis: ADX(36) clear trending market | MACD DIF breaks above the zero line, trend turns bullish | EMA5 > EMA8 > EMA13, bullish alignment | KDJ showing strength, bulls in control (K=71.8, D=59.9) | Volume surges (3.9x)
════════════════════
🔴 $AVGO 30-minute bullish signal
⚠️Technical analysis: ADX(29) trend is forming, opportunity to participate | MACD golden cross above zero, bullish momentum released | EMA5 > EMA8 > EMA13, bullish alignment | KDJ showing strength, bulls in control (K=76.2, D=70.1) | Volume expanded (1.8x)
════════════════════
🔔 Follow for first-hand market alerts 🔔
#技术分析 #RE #XPD #AVGO
📌 When trading, pay attention to whether the candlestick pattern is confirming
════════════════════
🔴 $RE 30-minute bullish signal
⚠️Technical analysis: ADX(52) very strong trend (beware of an overheated pullback) | MACD golden cross above zero, bullish momentum released | EMA5 > EMA8 > EMA13, bullish alignment | KDJ golden cross, bullish short-term outlook (K=71.5, D=68.0) | Volume expanded (2.3x)
════════════════════
🔴 $XPD 30-minute bullish signal
⚠️Technical analysis: ADX(36) clear trending market | MACD DIF breaks above the zero line, trend turns bullish | EMA5 > EMA8 > EMA13, bullish alignment | KDJ showing strength, bulls in control (K=71.8, D=59.9) | Volume surges (3.9x)
════════════════════
🔴 $AVGO 30-minute bullish signal
⚠️Technical analysis: ADX(29) trend is forming, opportunity to participate | MACD golden cross above zero, bullish momentum released | EMA5 > EMA8 > EMA13, bullish alignment | KDJ showing strength, bulls in control (K=76.2, D=70.1) | Volume expanded (1.8x)
════════════════════
🔔 Follow for first-hand market alerts 🔔
#技术分析 #RE #XPD #AVGO
📌 When trading, pay attention to whether the candlestick pattern is confirming
37

·
--
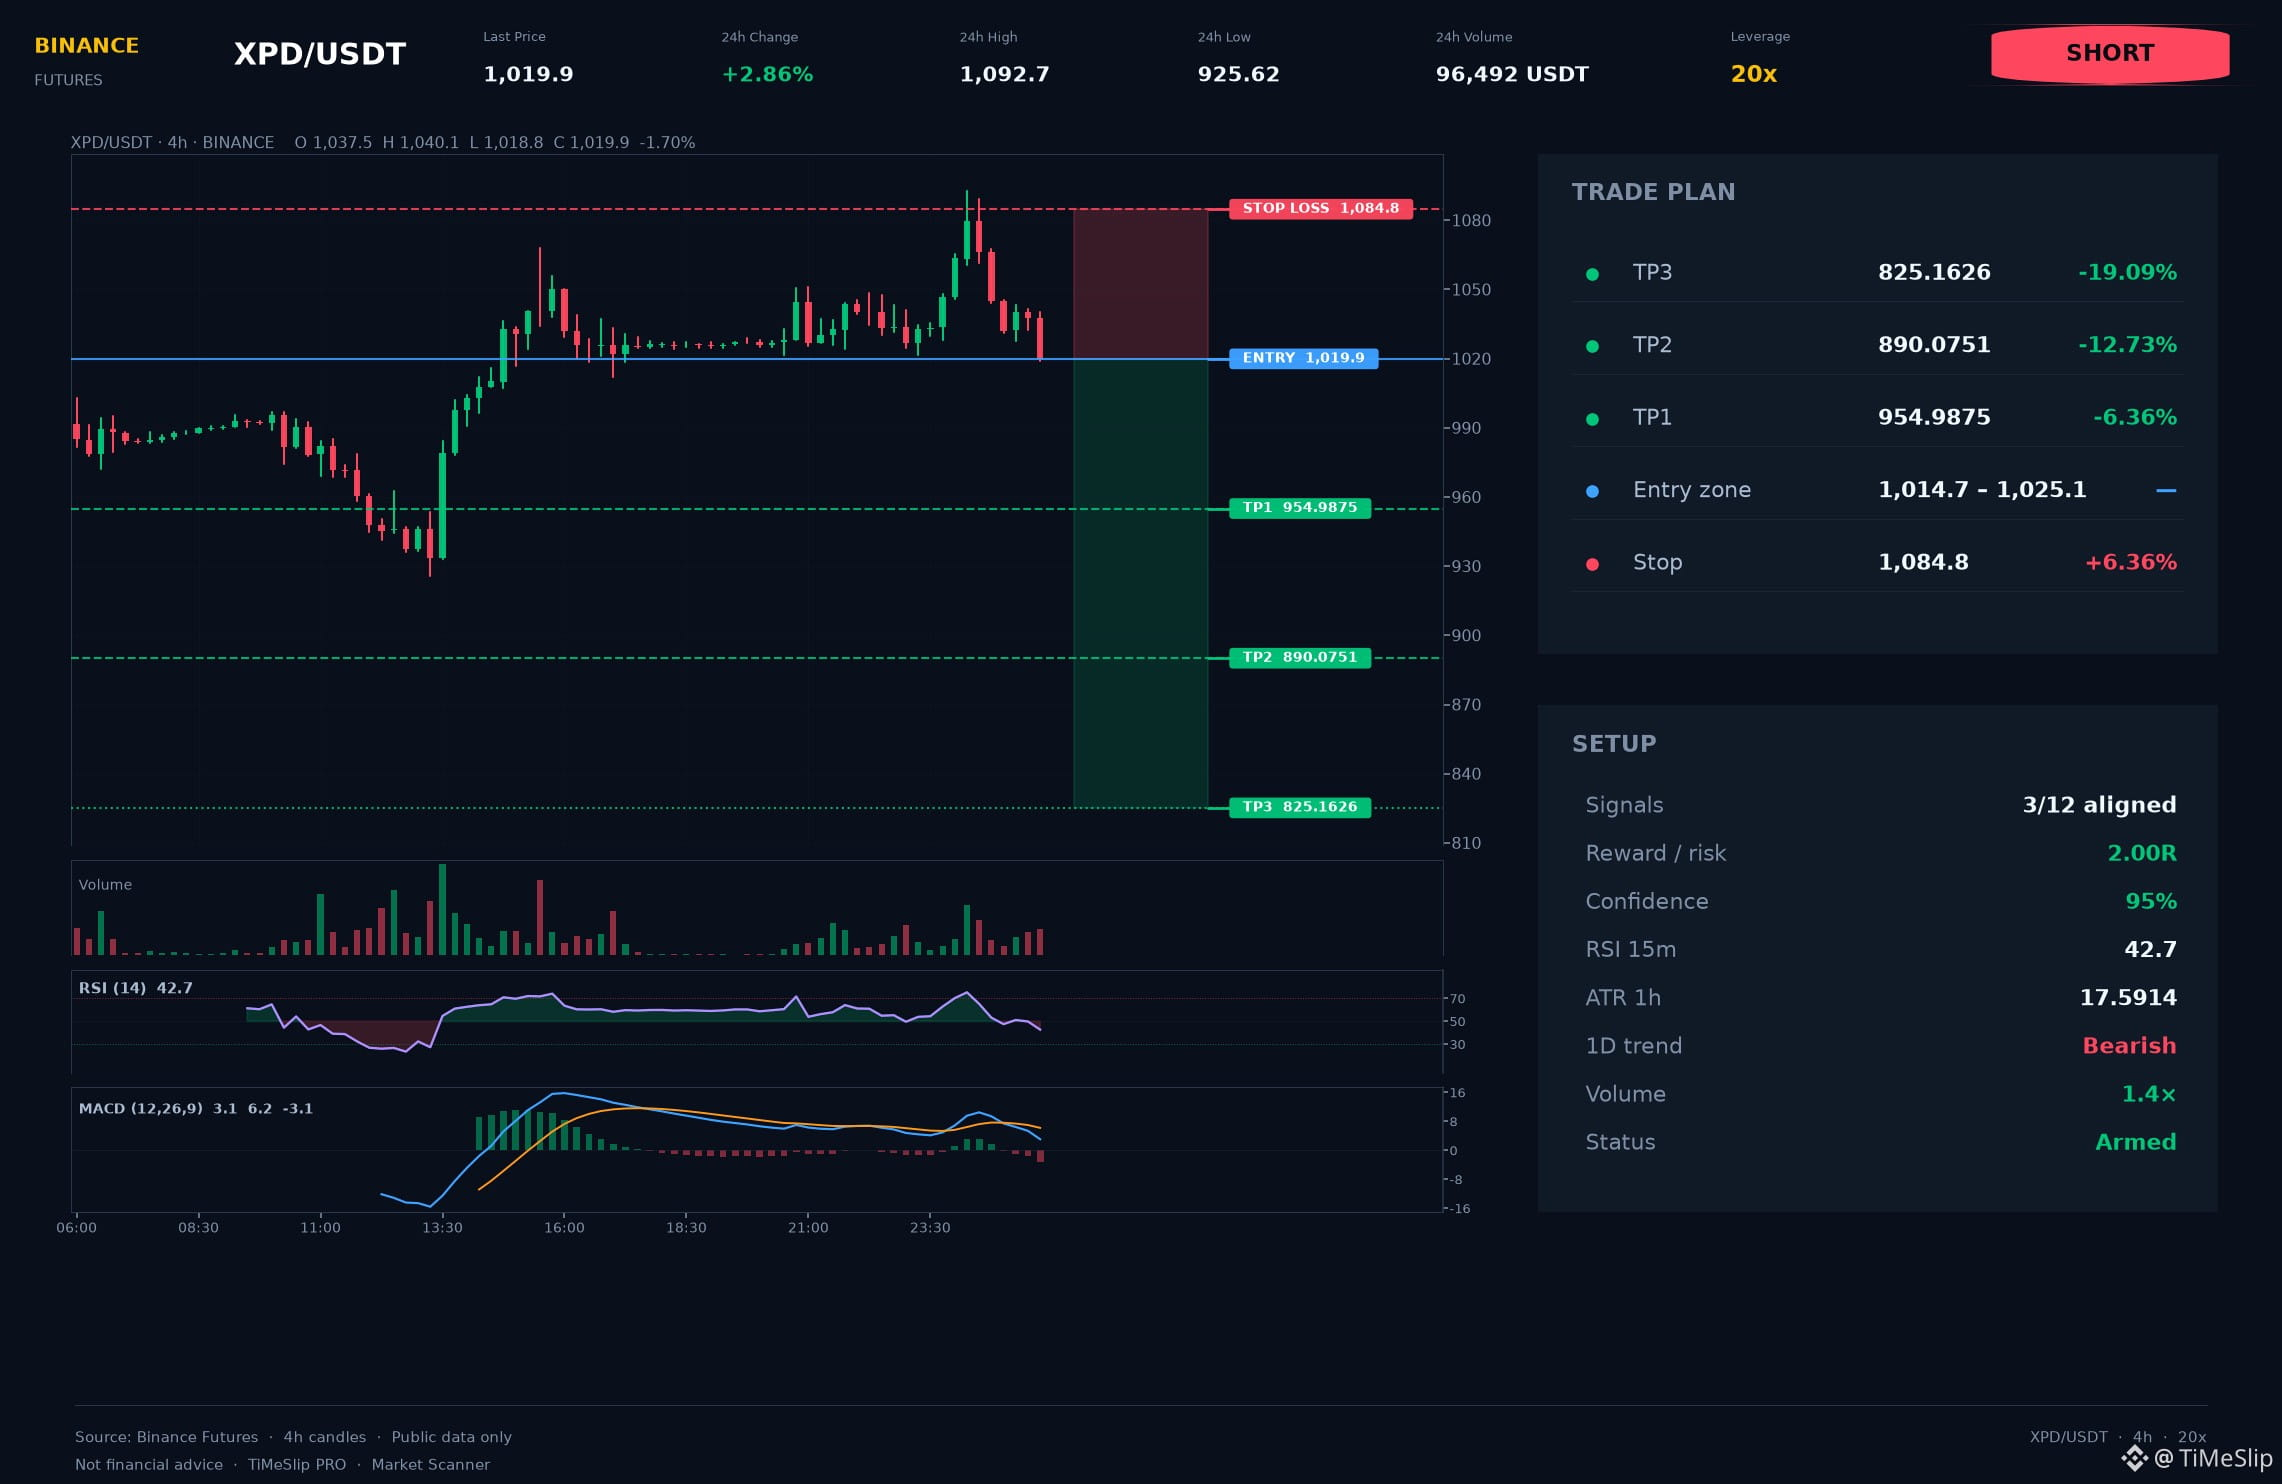
$XPD 🔴 (SELL)
ENTRY: 1019.90
STOP: 1084.81
• TP1: 954.988
• TP2: 890.075
• TP3: 825.163
🎯 Golden rule: take TP1, then move the stop to break-even to protect your capital.
On the 4h timeframe, the short on XPD looks tradable. It’s not guaranteed — the stop defines the invalidation level.
Setup score: 95/100. A professional approach requires a firm stop-loss. ⚠️ High risk at the stop (6.36%): reduce your position size.
📚 Order Flow: order book imbalance -67.7%; aggressive buying 11.7%. Based on these data, the flow supports the signal direction.
Price broke support at 1040.26 and formed a short entry after the retest. Risk at the stop: 6.36%. Alignment: 12h, 1d, 1w. ATR(14): 17.591.
Volume slightly above normal (1.4×).
📲 Follow us for in-depth analysis and selected setups!
All information is for analytical purposes only. You make your own decisions and assume the risk of your trades.
#XPD #XPDNews $XPD 👈 Tap to trade
$XPD 🔴 (SELL)
ENTRY: 1019.90
STOP: 1084.81
• TP1: 954.988
• TP2: 890.075
• TP3: 825.163
🎯 Golden rule: take TP1, then move the stop to break-even to protect your capital.
On the 4h timeframe, the short on XPD looks tradable. It’s not guaranteed — the stop defines the invalidation level.
Setup score: 95/100. A professional approach requires a firm stop-loss. ⚠️ High risk at the stop (6.36%): reduce your position size.
📚 Order Flow: order book imbalance -67.7%; aggressive buying 11.7%. Based on these data, the flow supports the signal direction.
Price broke support at 1040.26 and formed a short entry after the retest. Risk at the stop: 6.36%. Alignment: 12h, 1d, 1w. ATR(14): 17.591.
Volume slightly above normal (1.4×).
📲 Follow us for in-depth analysis and selected setups!
All information is for analytical purposes only. You make your own decisions and assume the risk of your trades.
#XPD #XPDNews $XPD 👈 Tap to trade
ENTRY: 1019.90
STOP: 1084.81
• TP1: 954.988
• TP2: 890.075
• TP3: 825.163
🎯 Golden rule: take TP1, then move the stop to break-even to protect your capital.
On the 4h timeframe, the short on XPD looks tradable. It’s not guaranteed — the stop defines the invalidation level.
Setup score: 95/100. A professional approach requires a firm stop-loss. ⚠️ High risk at the stop (6.36%): reduce your position size.
📚 Order Flow: order book imbalance -67.7%; aggressive buying 11.7%. Based on these data, the flow supports the signal direction.
Price broke support at 1040.26 and formed a short entry after the retest. Risk at the stop: 6.36%. Alignment: 12h, 1d, 1w. ATR(14): 17.591.
Volume slightly above normal (1.4×).
📲 Follow us for in-depth analysis and selected setups!
All information is for analytical purposes only. You make your own decisions and assume the risk of your trades.
#XPD #XPDNews $XPD 👈 Tap to trade
43
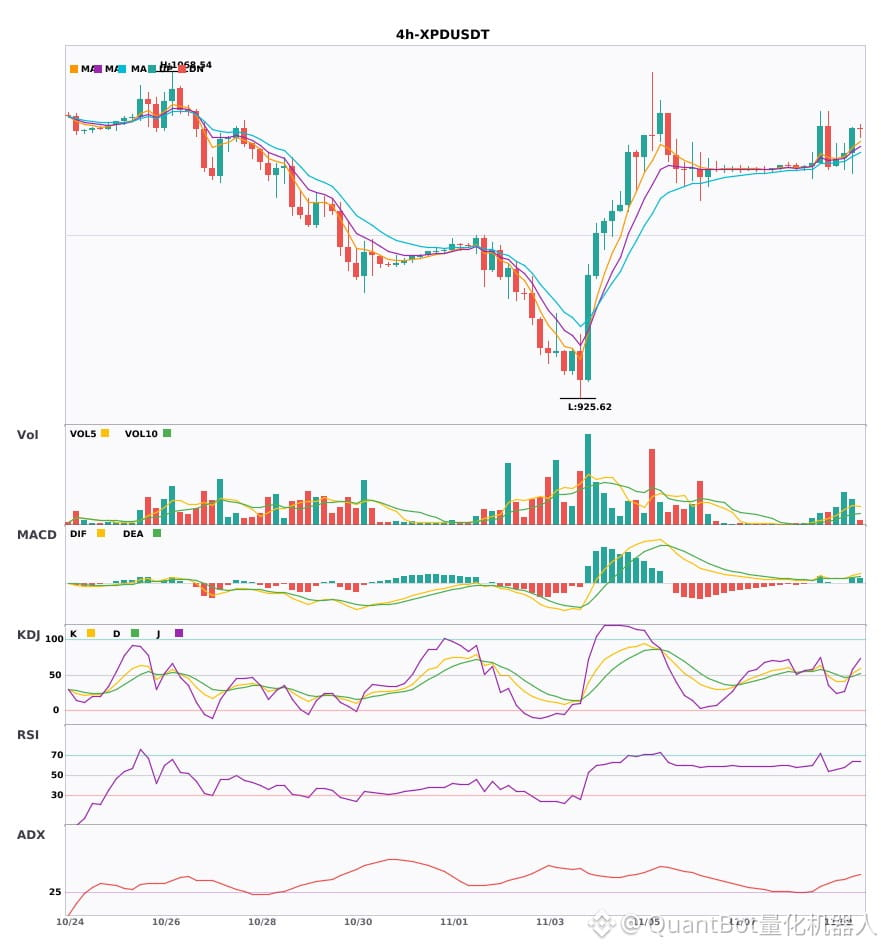
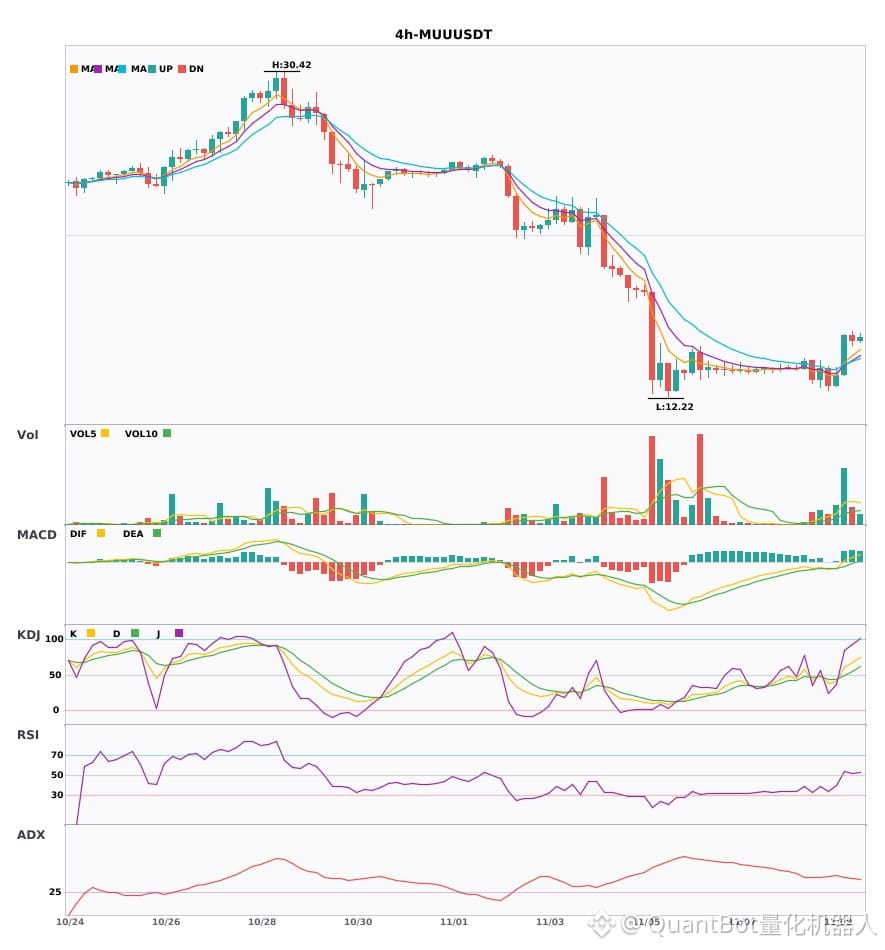
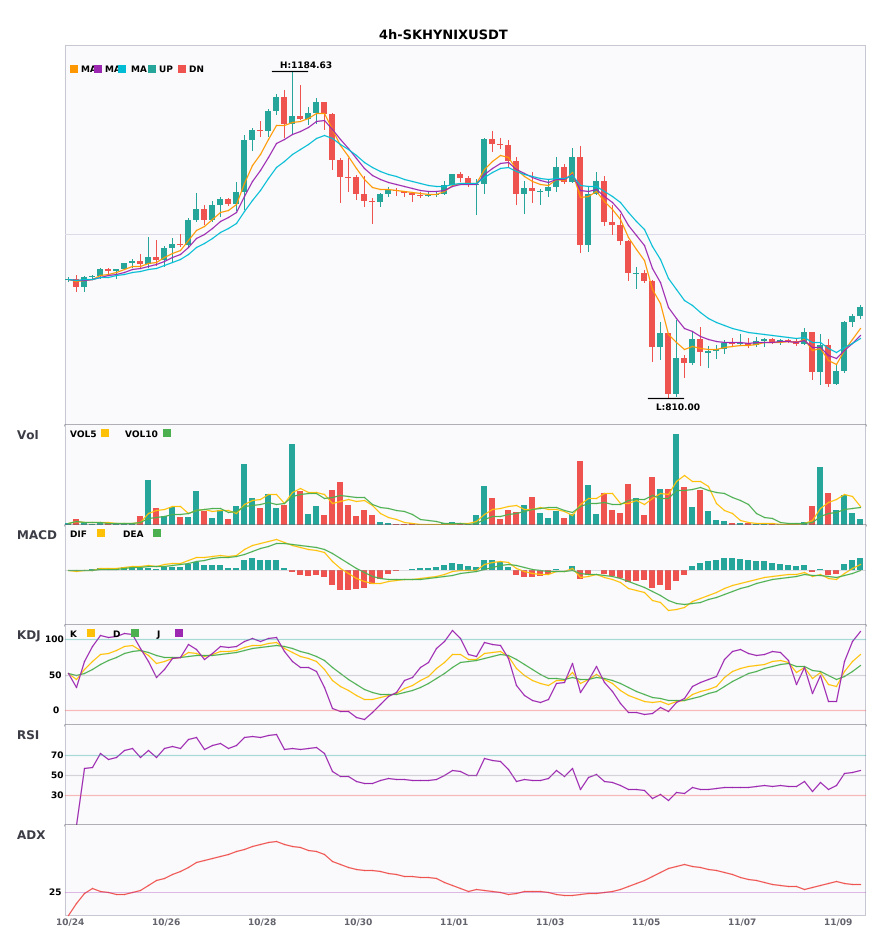
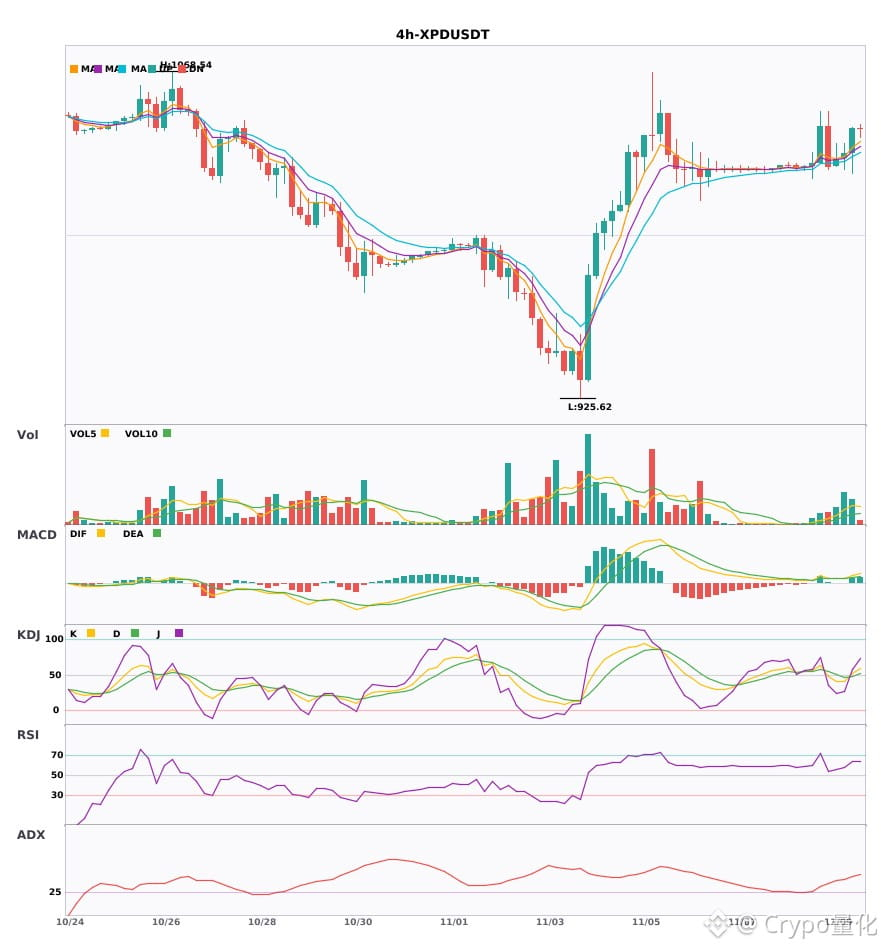
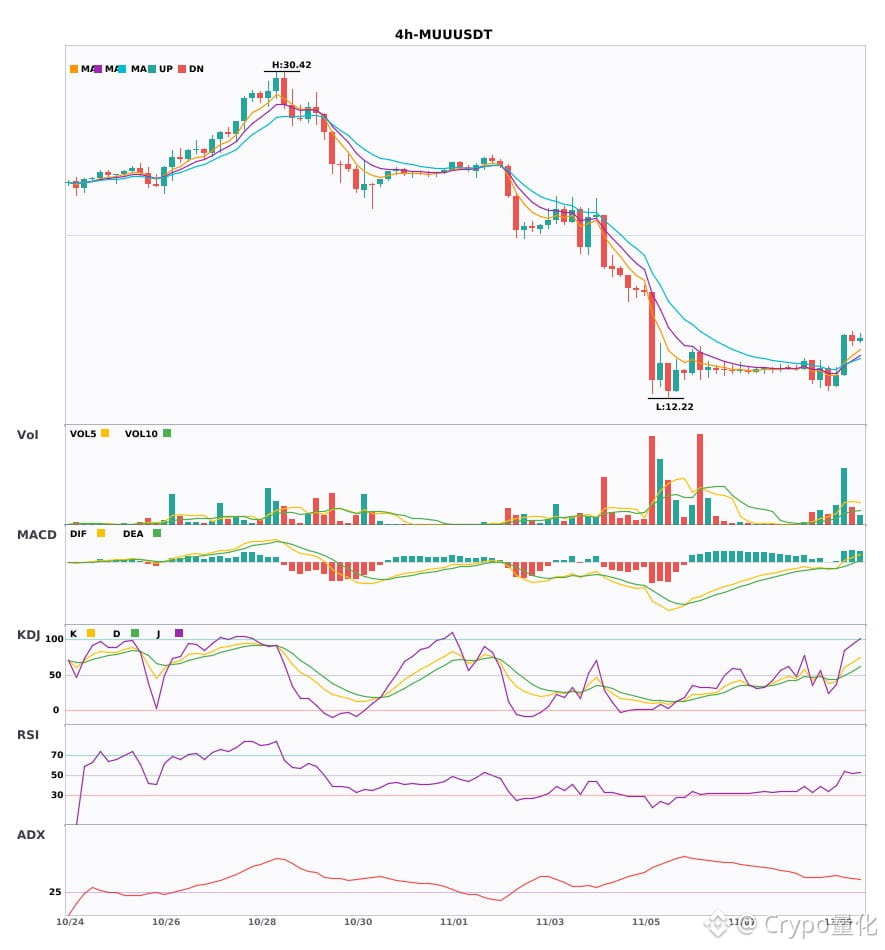
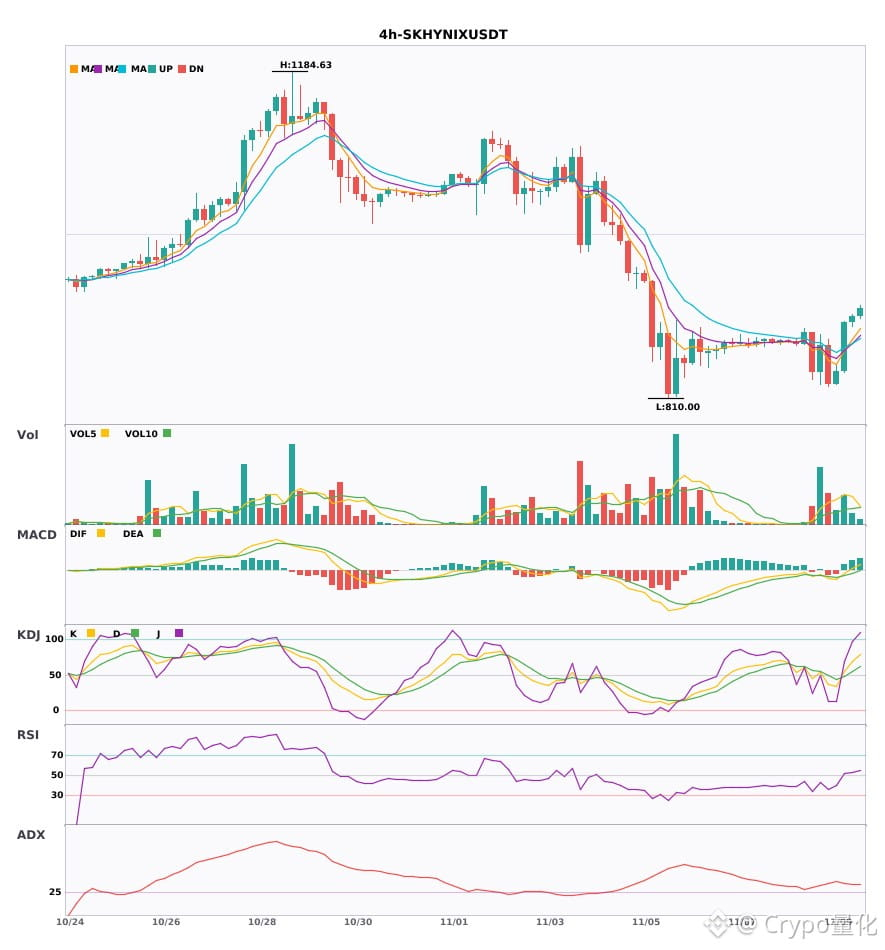
$XPD / $MUU / $SKHYNIX 4-hour technical indicators are strengthening in sync. Which has greater breakout potential?
📈 $XPD | 4-hour Bullish Signal
━━━━━━━━━━━━━━━━━━
Technical analysis: ADX(45): clear trending market | MACD golden cross above zero, bullish momentum emerging | EMA5 > EMA8 > EMA13, bullish alignment | KDJ golden cross, short-term bullish (K: 51.7, D: 48.5) | Volume surge (3.8x)
Price change: 1.0600%
📈 $MUU | 4-hour Bullish Signal
━━━━━━━━━━━━━━━━━━
Technical analysis: ADX(40): clear trending market | MACD bullish, strong trend, increasing momentum | EMA5 > EMA8 > EMA13, bullish alignment | KDJ strong, bulls have the upper hand (K: 67.8, D: 55.2) | Volume surge (4.8x)
Price change: -2.3500%
📈 $SKHYNIX | 4-hour Bullish Signal
━━━━━━━━━━━━━━━━━━
Technical analysis: ADX(35): clear trending market | MACD DIF breaks above the zero line, trend turns bullish | EMA5 > EMA8 > EMA13, bullish alignment | KDJ strong, bulls have the upper hand (K: 68.8, D: 54.6) | Volume increases (1.9x)
Price change: 0.8400%
━━━━━━━━━━━━━━━━━━
#技术分析 #XPD #MUU #SKHYNIX
📌 The above is for reference only and does not constitute investment advice
$XPD / $MUU / $SKHYNIX 4-hour technical indicators are strengthening in sync. Which has greater breakout potential?
📈 $XPD | 4-hour Bullish Signal
━━━━━━━━━━━━━━━━━━
Technical analysis: ADX(45): clear trending market | MACD golden cross above zero, bullish momentum emerging | EMA5 > EMA8 > EMA13, bullish alignment | KDJ golden cross, short-term bullish (K: 51.7, D: 48.5) | Volume surge (3.8x)
Price change: 1.0600%
📈 $MUU | 4-hour Bullish Signal
━━━━━━━━━━━━━━━━━━
Technical analysis: ADX(40): clear trending market | MACD bullish, strong trend, increasing momentum | EMA5 > EMA8 > EMA13, bullish alignment | KDJ strong, bulls have the upper hand (K: 67.8, D: 55.2) | Volume surge (4.8x)
Price change: -2.3500%
📈 $SKHYNIX | 4-hour Bullish Signal
━━━━━━━━━━━━━━━━━━
Technical analysis: ADX(35): clear trending market | MACD DIF breaks above the zero line, trend turns bullish | EMA5 > EMA8 > EMA13, bullish alignment | KDJ strong, bulls have the upper hand (K: 68.8, D: 54.6) | Volume increases (1.9x)
Price change: 0.8400%
━━━━━━━━━━━━━━━━━━
#技术分析 #XPD #MUU #SKHYNIX
📌 The above is for reference only and does not constitute investment advice
📈 $XPD | 4-hour Bullish Signal
━━━━━━━━━━━━━━━━━━
Technical analysis: ADX(45): clear trending market | MACD golden cross above zero, bullish momentum emerging | EMA5 > EMA8 > EMA13, bullish alignment | KDJ golden cross, short-term bullish (K: 51.7, D: 48.5) | Volume surge (3.8x)
Price change: 1.0600%
📈 $MUU | 4-hour Bullish Signal
━━━━━━━━━━━━━━━━━━
Technical analysis: ADX(40): clear trending market | MACD bullish, strong trend, increasing momentum | EMA5 > EMA8 > EMA13, bullish alignment | KDJ strong, bulls have the upper hand (K: 67.8, D: 55.2) | Volume surge (4.8x)
Price change: -2.3500%
📈 $SKHYNIX | 4-hour Bullish Signal
━━━━━━━━━━━━━━━━━━
Technical analysis: ADX(35): clear trending market | MACD DIF breaks above the zero line, trend turns bullish | EMA5 > EMA8 > EMA13, bullish alignment | KDJ strong, bulls have the upper hand (K: 68.8, D: 54.6) | Volume increases (1.9x)
Price change: 0.8400%
━━━━━━━━━━━━━━━━━━
#技术分析 #XPD #MUU #SKHYNIX
📌 The above is for reference only and does not constitute investment advice
28
·
--
3 simultaneous 4-hour bullish signals: $XPD / $MUU / $SKHYNIX🔥
════════════════════
🔴 $XPD 4-hour bullish signal
⚠️Technical analysis: ADX(45) indicates a clear trend | MACD bullish crossover above zero, bullish momentum emerging | EMA5 > EMA8 > EMA13, bullish alignment | KDJ bullish crossover, short-term outlook bullish (K: 51.7, D: 48.5) | Volume surge (3.8x)
════════════════════
🔴 $MUU 4-hour bullish signal
⚠️Technical analysis: ADX(40) indicates a clear trend | MACD is bullish, trend is strong and momentum is increasing | EMA5 > EMA8 > EMA13, bullish alignment | KDJ is strong, bulls have the upper hand (K: 67.8, D: 55.2) | Volume surge (4.8x)
════════════════════
🔴 $SKHYNIX 4-hour bullish signal
⚠️Technical analysis: ADX(35) indicates a clear trend | MACD DIF breaks above zero, trend turns bullish | EMA5 > EMA8 > EMA13, bullish alignment | KDJ is strong, bulls have the upper hand (K: 68.8, D: 54.6) | Volume increase (1.9x)
════════════════════
🔔 Follow for real-time market alerts 🔔
#技术分析 #XPD #MUU #SKHYNIX
📌 When trading, pay attention to whether the candlestick pattern aligns
3 simultaneous 4-hour bullish signals: $XPD / $MUU / $SKHYNIX 🔥
════════════════════
🔴 $XPD 4-hour bullish signal
⚠️Technical analysis: ADX(45) indicates a clear trend | MACD bullish crossover above zero, bullish momentum emerging | EMA5 > EMA8 > EMA13, bullish alignment | KDJ bullish crossover, short-term outlook bullish (K: 51.7, D: 48.5) | Volume surge (3.8x)
════════════════════
🔴 $MUU 4-hour bullish signal
⚠️Technical analysis: ADX(40) indicates a clear trend | MACD is bullish, trend is strong and momentum is increasing | EMA5 > EMA8 > EMA13, bullish alignment | KDJ is strong, bulls have the upper hand (K: 67.8, D: 55.2) | Volume surge (4.8x)
════════════════════
🔴 $SKHYNIX 4-hour bullish signal
⚠️Technical analysis: ADX(35) indicates a clear trend | MACD DIF breaks above zero, trend turns bullish | EMA5 > EMA8 > EMA13, bullish alignment | KDJ is strong, bulls have the upper hand (K: 68.8, D: 54.6) | Volume increase (1.9x)
════════════════════
🔔 Follow for real-time market alerts 🔔
#技术分析 #XPD #MUU #SKHYNIX
📌 When trading, pay attention to whether the candlestick pattern aligns
════════════════════
🔴 $XPD 4-hour bullish signal
⚠️Technical analysis: ADX(45) indicates a clear trend | MACD bullish crossover above zero, bullish momentum emerging | EMA5 > EMA8 > EMA13, bullish alignment | KDJ bullish crossover, short-term outlook bullish (K: 51.7, D: 48.5) | Volume surge (3.8x)
════════════════════
🔴 $MUU 4-hour bullish signal
⚠️Technical analysis: ADX(40) indicates a clear trend | MACD is bullish, trend is strong and momentum is increasing | EMA5 > EMA8 > EMA13, bullish alignment | KDJ is strong, bulls have the upper hand (K: 67.8, D: 55.2) | Volume surge (4.8x)
════════════════════
🔴 $SKHYNIX 4-hour bullish signal
⚠️Technical analysis: ADX(35) indicates a clear trend | MACD DIF breaks above zero, trend turns bullish | EMA5 > EMA8 > EMA13, bullish alignment | KDJ is strong, bulls have the upper hand (K: 68.8, D: 54.6) | Volume increase (1.9x)
════════════════════
🔔 Follow for real-time market alerts 🔔
#技术分析 #XPD #MUU #SKHYNIX
📌 When trading, pay attention to whether the candlestick pattern aligns
11
·
--
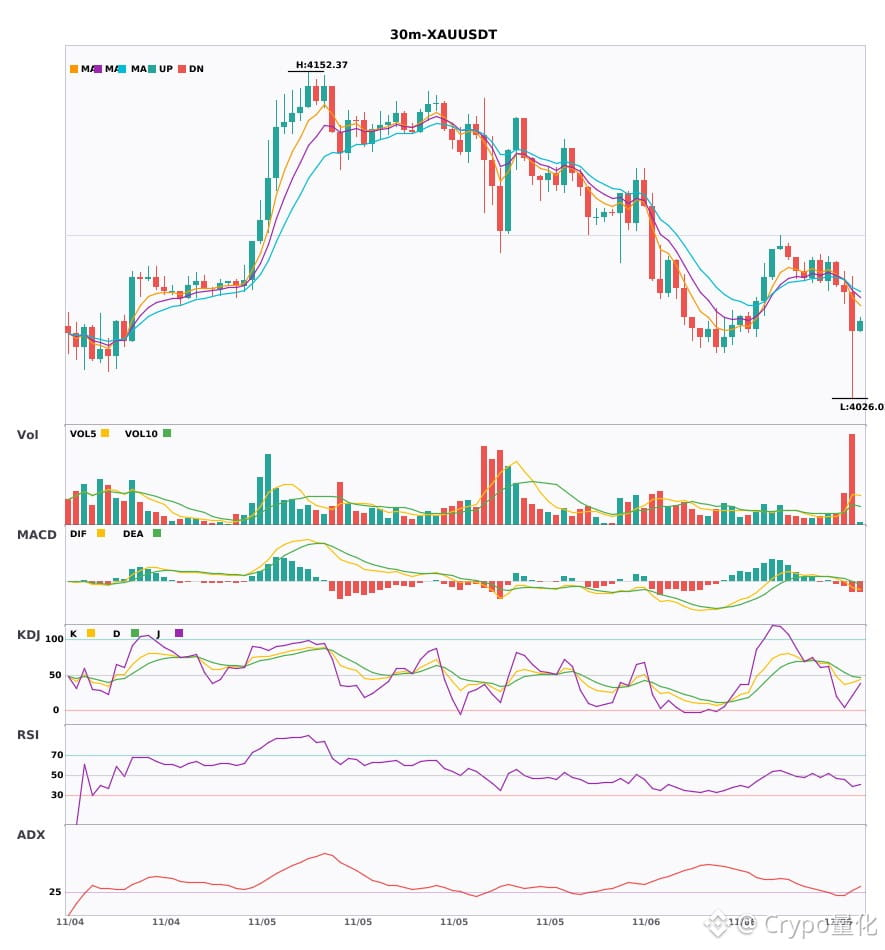
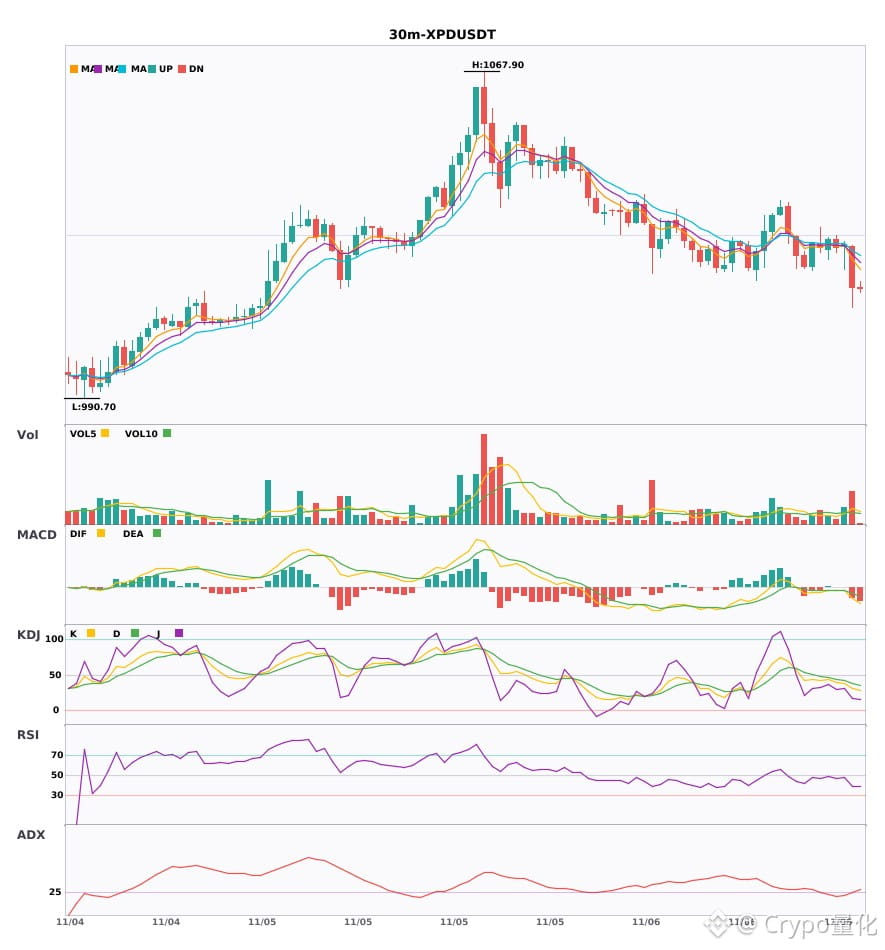
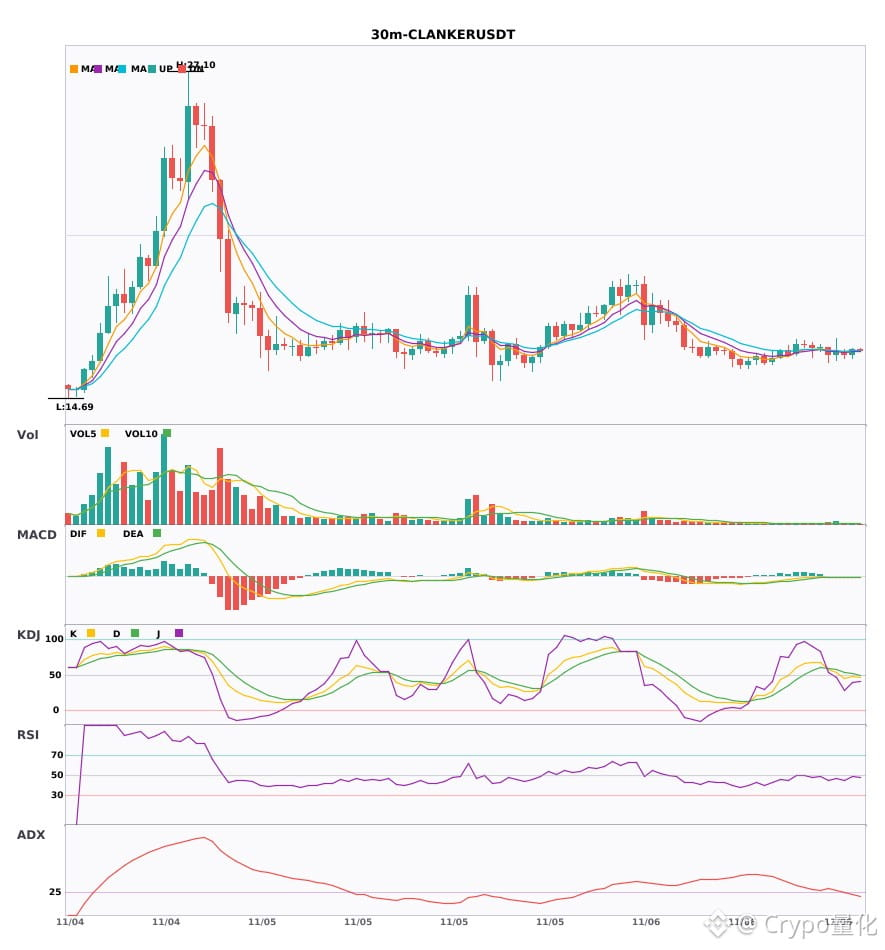
$XAU / $XPD / $CLANKER 30-minute confluence turns bearish, with bearish signals appearing simultaneously 🔥
════════════════════
🟢 $XAU 30-minute bearish signal
⚠️Technical analysis: ADX(29) Trend is forming; entry is possible | MACD DIF has crossed below the zero line, turning the trend bearish | EMA5 < EMA8 < EMA13, bearish alignment | KDJ is weak, with bears in control (K: 39.2, D: 48.3) | Volume surge (4.5x)
════════════════════
🟢 $XPD 30-minute bearish signal
⚠️Technical analysis: ADX(25) Trend is forming; entry is possible | MACD bearish crossover below zero, bearish momentum accelerating | EMA5 < EMA8 < EMA13, bearish alignment | KDJ is weak, with bears in control (K: 31.5, D: 38.5) | Volume surge (2.6x)
════════════════════
🟢 $CLANKER 30-minute bearish signal
⚠️Technical analysis: ADX(25) Trend is forming; entry is possible | MACD bearish crossover below zero, bearish momentum accelerating | EMA5 < EMA8 < EMA13, bearish alignment | Volume increase (2.1x)
════════════════════
🔔 Follow for first-hand market alerts 🔔
#技术分析 #XAU #XPD #CLANKER
📌 When trading, pay attention to whether the candlestick pattern matches
$XAU / $XPD / $CLANKER 30-minute confluence turns bearish, with bearish signals appearing simultaneously 🔥
════════════════════
🟢 $XAU 30-minute bearish signal
⚠️Technical analysis: ADX(29) Trend is forming; entry is possible | MACD DIF has crossed below the zero line, turning the trend bearish | EMA5 < EMA8 < EMA13, bearish alignment | KDJ is weak, with bears in control (K: 39.2, D: 48.3) | Volume surge (4.5x)
════════════════════
🟢 $XPD 30-minute bearish signal
⚠️Technical analysis: ADX(25) Trend is forming; entry is possible | MACD bearish crossover below zero, bearish momentum accelerating | EMA5 < EMA8 < EMA13, bearish alignment | KDJ is weak, with bears in control (K: 31.5, D: 38.5) | Volume surge (2.6x)
════════════════════
🟢 $CLANKER 30-minute bearish signal
⚠️Technical analysis: ADX(25) Trend is forming; entry is possible | MACD bearish crossover below zero, bearish momentum accelerating | EMA5 < EMA8 < EMA13, bearish alignment | Volume increase (2.1x)
════════════════════
🔔 Follow for first-hand market alerts 🔔
#技术分析 #XAU #XPD #CLANKER
📌 When trading, pay attention to whether the candlestick pattern matches
════════════════════
🟢 $XAU 30-minute bearish signal
⚠️Technical analysis: ADX(29) Trend is forming; entry is possible | MACD DIF has crossed below the zero line, turning the trend bearish | EMA5 < EMA8 < EMA13, bearish alignment | KDJ is weak, with bears in control (K: 39.2, D: 48.3) | Volume surge (4.5x)
════════════════════
🟢 $XPD 30-minute bearish signal
⚠️Technical analysis: ADX(25) Trend is forming; entry is possible | MACD bearish crossover below zero, bearish momentum accelerating | EMA5 < EMA8 < EMA13, bearish alignment | KDJ is weak, with bears in control (K: 31.5, D: 38.5) | Volume surge (2.6x)
════════════════════
🟢 $CLANKER 30-minute bearish signal
⚠️Technical analysis: ADX(25) Trend is forming; entry is possible | MACD bearish crossover below zero, bearish momentum accelerating | EMA5 < EMA8 < EMA13, bearish alignment | Volume increase (2.1x)
════════════════════
🔔 Follow for first-hand market alerts 🔔
#技术分析 #XAU #XPD #CLANKER
📌 When trading, pay attention to whether the candlestick pattern matches
9

·
--
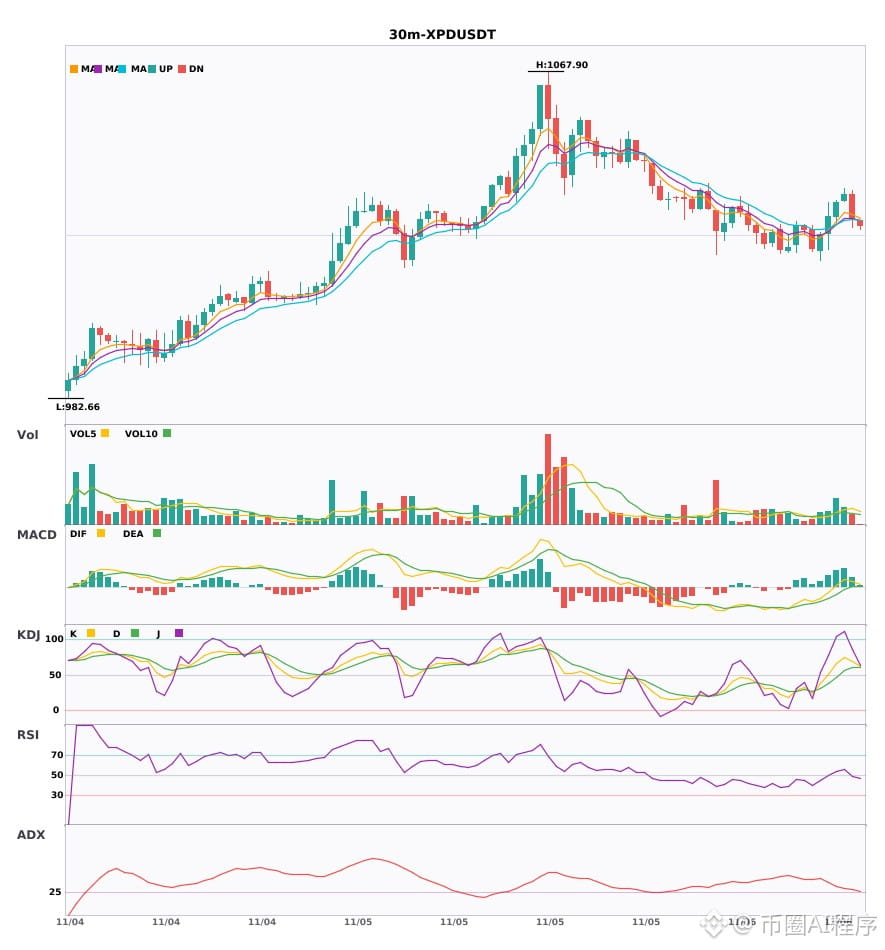
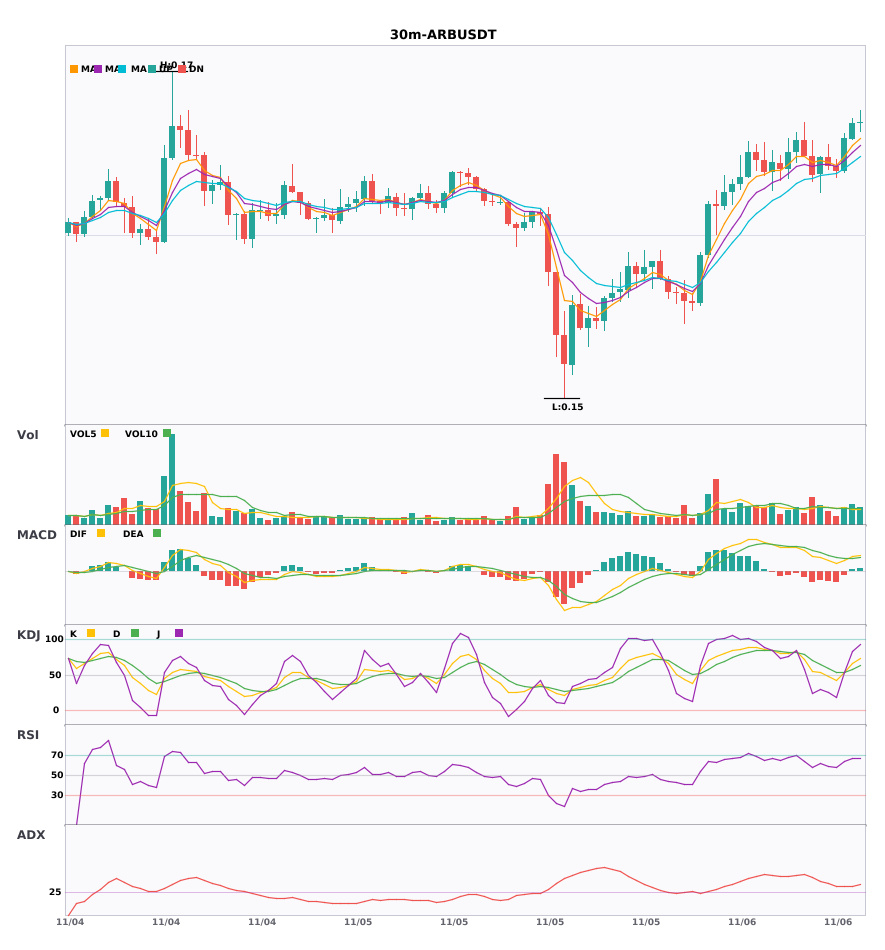
$XPD / $ARB 30-minute bullish + 4-hour bullish alignment; multi-timeframe confluence turns bullish 🔥
════════════════════
🔴 $XPD 30-minute bullish signal
⚠️Technical analysis: 4-hour bullish confluence confirmed | 30-minute entry: MACD is bullish, trend is strong and momentum is increasing | EMA5 > EMA8 > EMA13, bullish alignment | KDJ is strong, bulls have the advantage (K: 74.5, D: 56.3) | Volume increased (2.2x)
════════════════════
🔴 $ARB 30-minute bullish signal
⚠️Technical analysis: 4-hour bullish confluence confirmed | 30-minute entry: MACD golden cross above zero, bullish momentum released | EMA5 > EMA8 > EMA13, bullish alignment | KDJ golden cross, bullish short-term outlook (K: 66.5, D: 57.9) | Volume is normal (1.3x)
════════════════════
🔔 Follow to get first-hand market alerts 🔔
#多周期共振 #XPD #ARB
📌 When trading, pay attention to whether the candlestick patterns meet expectations
$XPD / $ARB 30-minute bullish + 4-hour bullish alignment; multi-timeframe confluence turns bullish 🔥
════════════════════
🔴 $XPD 30-minute bullish signal
⚠️Technical analysis: 4-hour bullish confluence confirmed | 30-minute entry: MACD is bullish, trend is strong and momentum is increasing | EMA5 > EMA8 > EMA13, bullish alignment | KDJ is strong, bulls have the advantage (K: 74.5, D: 56.3) | Volume increased (2.2x)
════════════════════
🔴 $ARB 30-minute bullish signal
⚠️Technical analysis: 4-hour bullish confluence confirmed | 30-minute entry: MACD golden cross above zero, bullish momentum released | EMA5 > EMA8 > EMA13, bullish alignment | KDJ golden cross, bullish short-term outlook (K: 66.5, D: 57.9) | Volume is normal (1.3x)
════════════════════
🔔 Follow to get first-hand market alerts 🔔
#多周期共振 #XPD #ARB
📌 When trading, pay attention to whether the candlestick patterns meet expectations
════════════════════
🔴 $XPD 30-minute bullish signal
⚠️Technical analysis: 4-hour bullish confluence confirmed | 30-minute entry: MACD is bullish, trend is strong and momentum is increasing | EMA5 > EMA8 > EMA13, bullish alignment | KDJ is strong, bulls have the advantage (K: 74.5, D: 56.3) | Volume increased (2.2x)
════════════════════
🔴 $ARB 30-minute bullish signal
⚠️Technical analysis: 4-hour bullish confluence confirmed | 30-minute entry: MACD golden cross above zero, bullish momentum released | EMA5 > EMA8 > EMA13, bullish alignment | KDJ golden cross, bullish short-term outlook (K: 66.5, D: 57.9) | Volume is normal (1.3x)
════════════════════
🔔 Follow to get first-hand market alerts 🔔
#多周期共振 #XPD #ARB
📌 When trading, pay attention to whether the candlestick patterns meet expectations
5
·
--
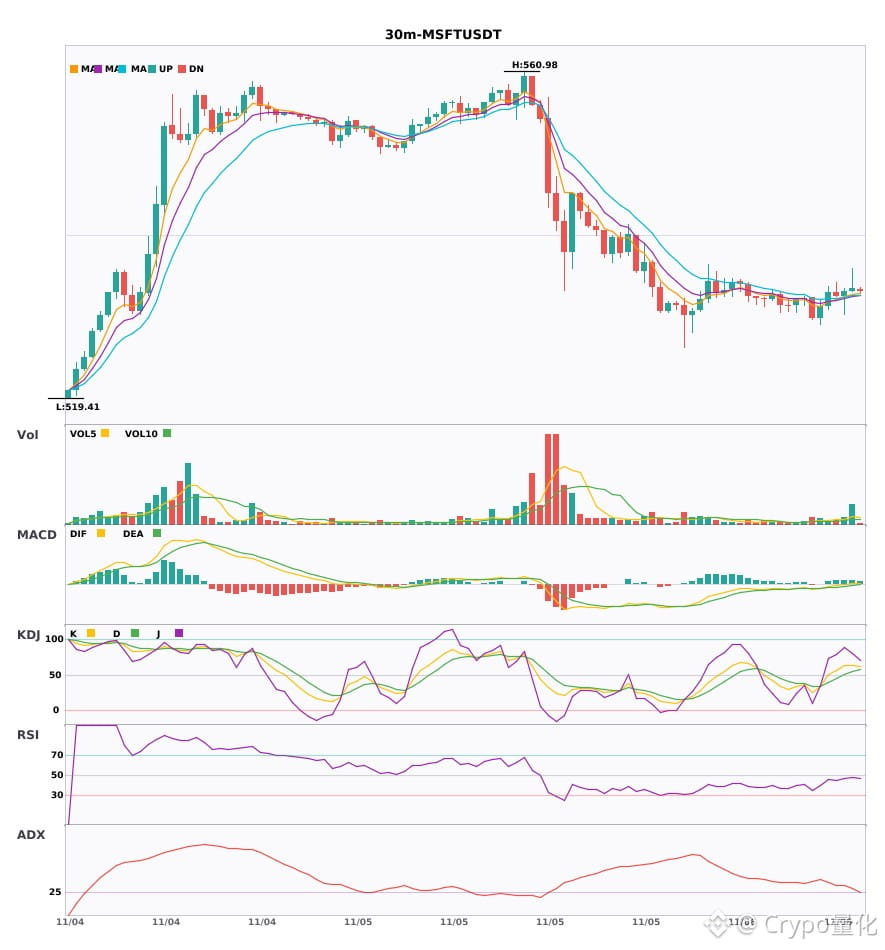
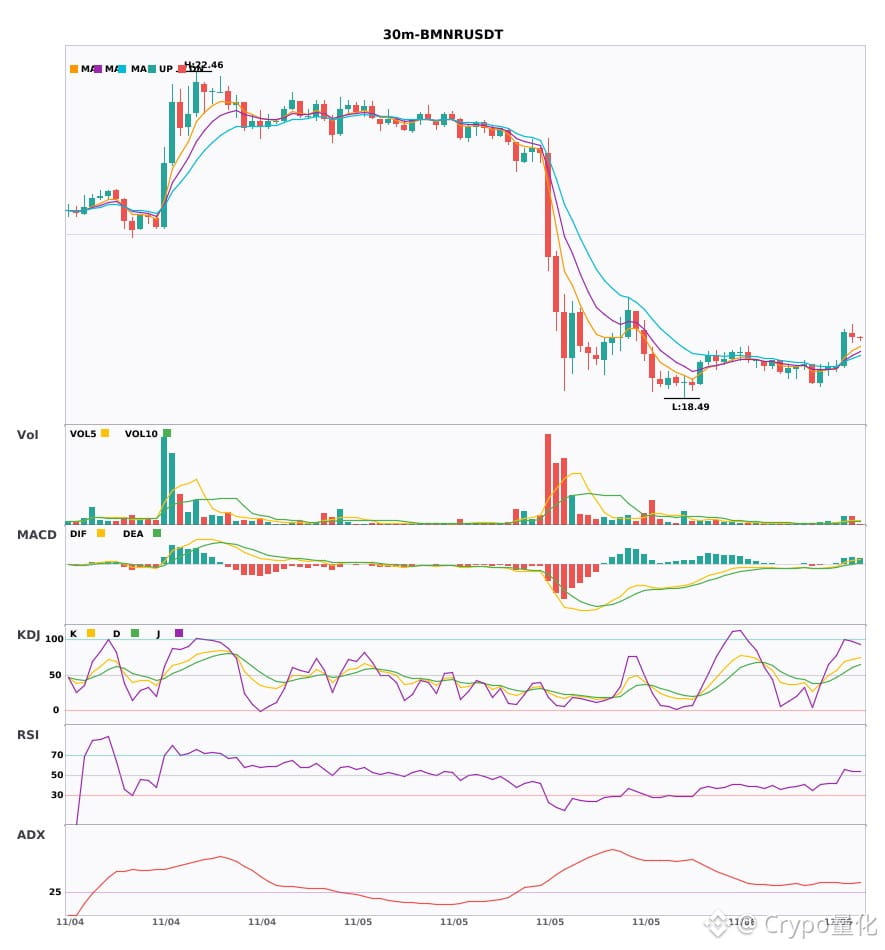
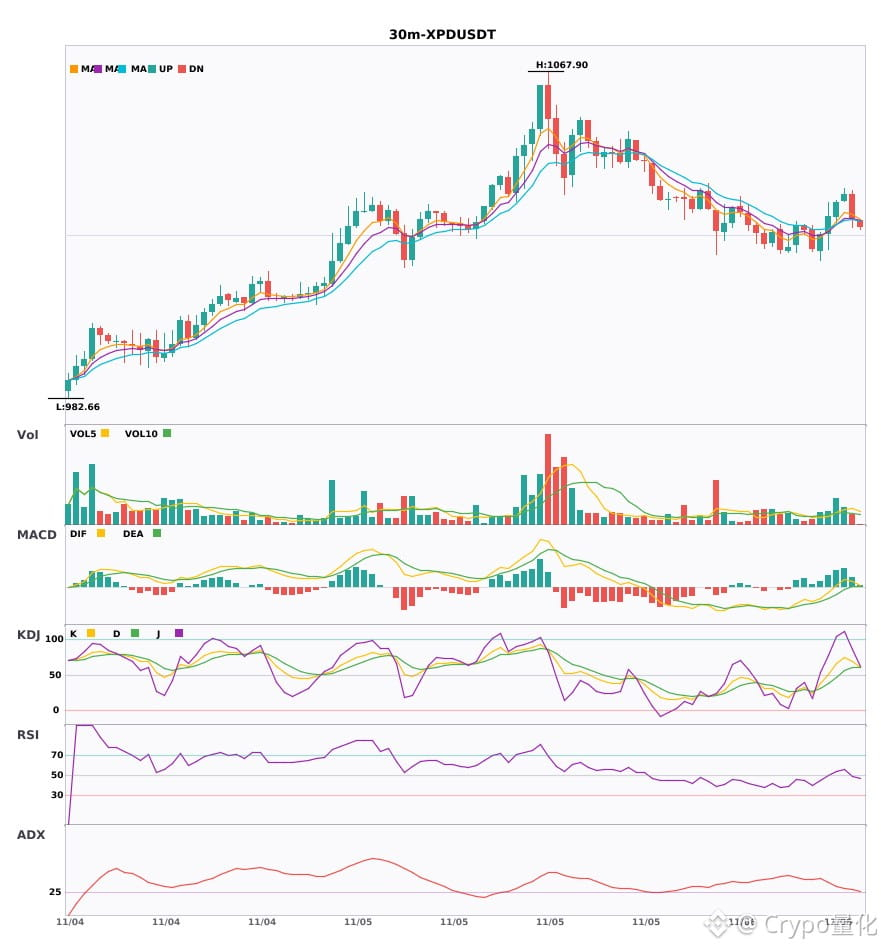
Three 30-minute bullish signals appeared simultaneously: $MSFT / $BMNR / $XPD🔥
════════════════════
🔴 $MSFT 30-minute bullish signal
⚠️Technical analysis: ADX (27): Trend is forming; opportunity to participate | MACD DIF crossed above zero; trend turns bullish | Moving averages are converging, building momentum; a direction is imminent | KDJ is running strong, bulls have the upper hand (K: 63.6, D: 55.4) | Volume surged (3.4x)
════════════════════
🔴 $BMNR 30-minute bullish signal
⚠️Technical analysis: ADX (35): Clear trending market | MACD DIF crossed above zero; trend turns bullish | EMA5 crossed above EMA8; short-term trend turns bullish | KDJ is running strong, bulls have the upper hand (K: 69.1, D: 54.0) | Volume surged (3.4x)
════════════════════
🔴 $XPD 30-minute bullish signal
⚠️Technical analysis: ADX (31): Clear trending market | MACD is bullish, with a strong trend and strengthening momentum | EMA5 > EMA8 > EMA13; bullish alignment | KDJ is running strong, bulls have the upper hand (K: 74.5, D: 56.3) | Volume increased (2.2x)
════════════════════
🔔 Follow us for real-time market alerts 🔔
#技术分析 #MSFT #BMNR #XPD
📌 When trading, pay attention to whether the candlestick pattern confirms the signal
Three 30-minute bullish signals appeared simultaneously: $MSFT / $BMNR / $XPD 🔥
════════════════════
🔴 $MSFT 30-minute bullish signal
⚠️Technical analysis: ADX (27): Trend is forming; opportunity to participate | MACD DIF crossed above zero; trend turns bullish | Moving averages are converging, building momentum; a direction is imminent | KDJ is running strong, bulls have the upper hand (K: 63.6, D: 55.4) | Volume surged (3.4x)
════════════════════
🔴 $BMNR 30-minute bullish signal
⚠️Technical analysis: ADX (35): Clear trending market | MACD DIF crossed above zero; trend turns bullish | EMA5 crossed above EMA8; short-term trend turns bullish | KDJ is running strong, bulls have the upper hand (K: 69.1, D: 54.0) | Volume surged (3.4x)
════════════════════
🔴 $XPD 30-minute bullish signal
⚠️Technical analysis: ADX (31): Clear trending market | MACD is bullish, with a strong trend and strengthening momentum | EMA5 > EMA8 > EMA13; bullish alignment | KDJ is running strong, bulls have the upper hand (K: 74.5, D: 56.3) | Volume increased (2.2x)
════════════════════
🔔 Follow us for real-time market alerts 🔔
#技术分析 #MSFT #BMNR #XPD
📌 When trading, pay attention to whether the candlestick pattern confirms the signal
════════════════════
🔴 $MSFT 30-minute bullish signal
⚠️Technical analysis: ADX (27): Trend is forming; opportunity to participate | MACD DIF crossed above zero; trend turns bullish | Moving averages are converging, building momentum; a direction is imminent | KDJ is running strong, bulls have the upper hand (K: 63.6, D: 55.4) | Volume surged (3.4x)
════════════════════
🔴 $BMNR 30-minute bullish signal
⚠️Technical analysis: ADX (35): Clear trending market | MACD DIF crossed above zero; trend turns bullish | EMA5 crossed above EMA8; short-term trend turns bullish | KDJ is running strong, bulls have the upper hand (K: 69.1, D: 54.0) | Volume surged (3.4x)
════════════════════
🔴 $XPD 30-minute bullish signal
⚠️Technical analysis: ADX (31): Clear trending market | MACD is bullish, with a strong trend and strengthening momentum | EMA5 > EMA8 > EMA13; bullish alignment | KDJ is running strong, bulls have the upper hand (K: 74.5, D: 56.3) | Volume increased (2.2x)
════════════════════
🔔 Follow us for real-time market alerts 🔔
#技术分析 #MSFT #BMNR #XPD
📌 When trading, pay attention to whether the candlestick pattern confirms the signal
9
·
--
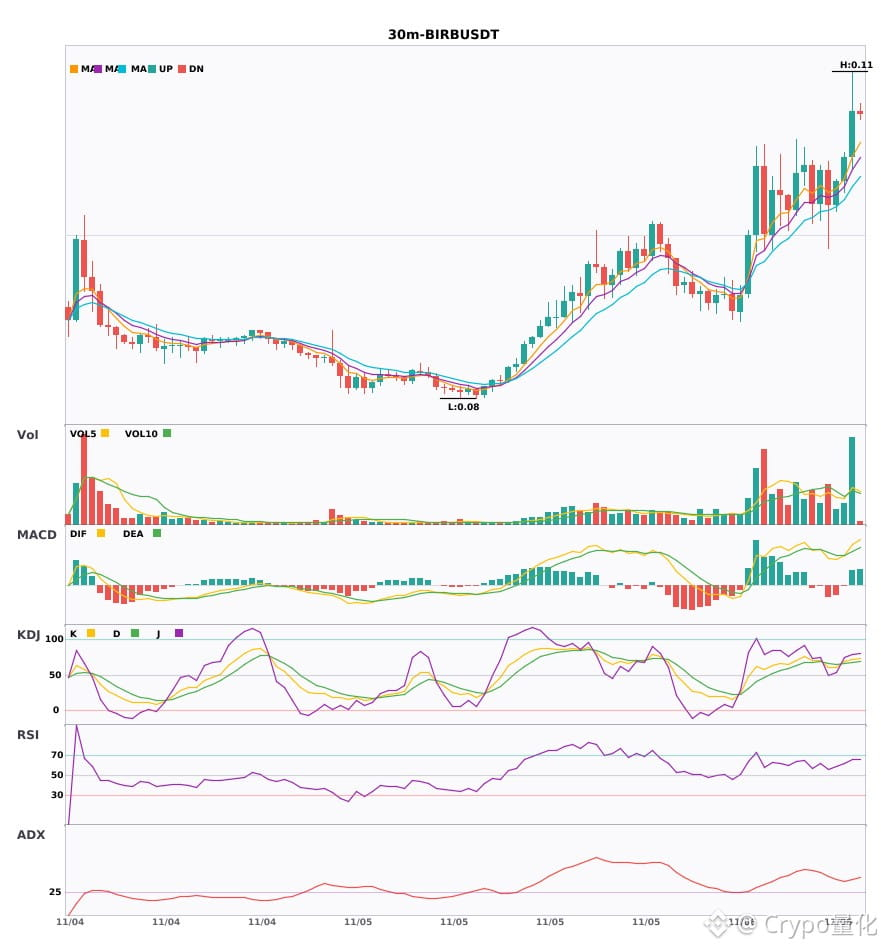
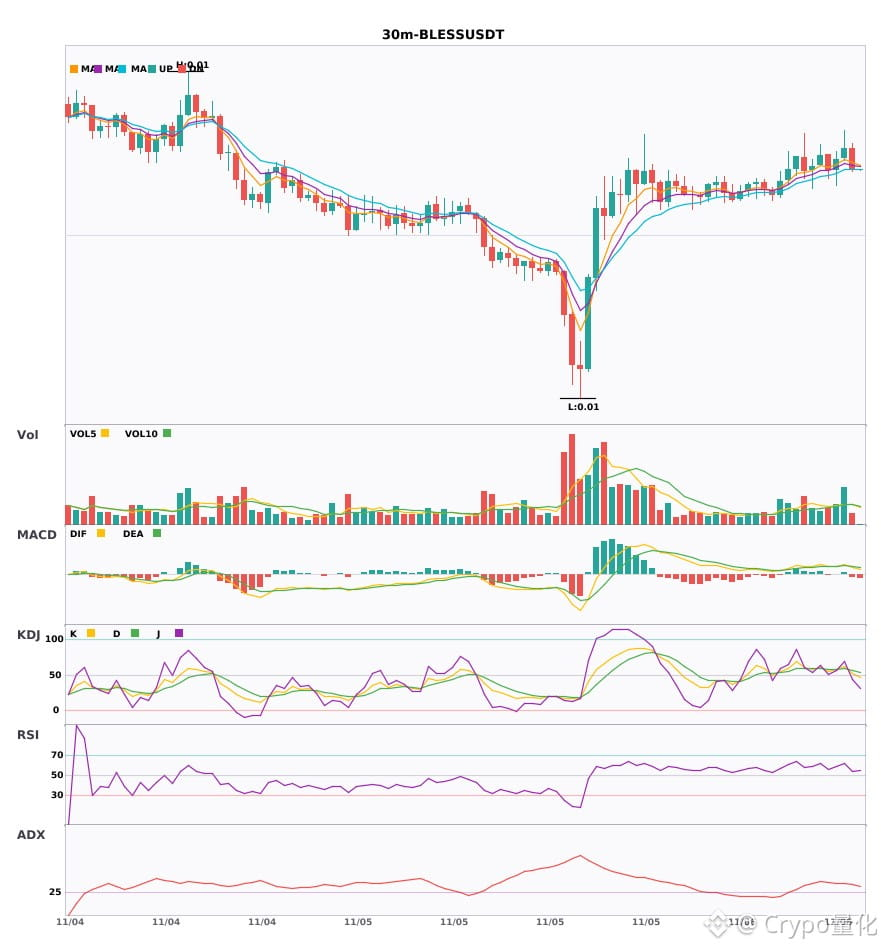
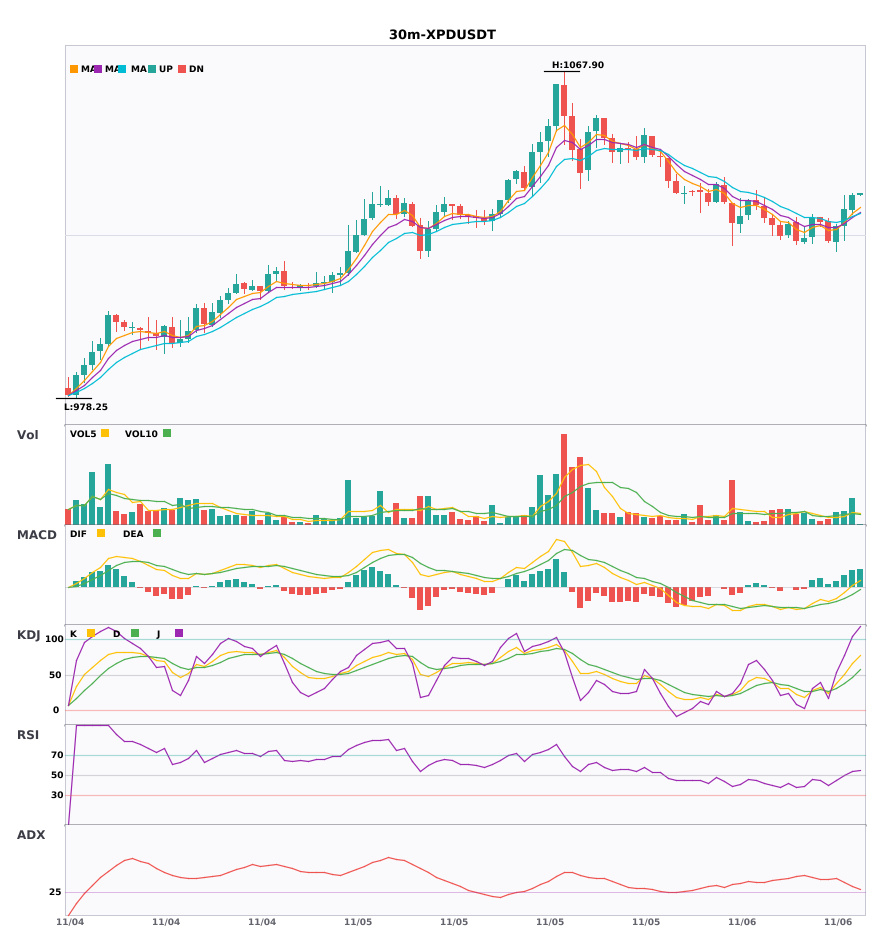
$BIRB / $BLESS / $XPD 30-minute technicals are strengthening in tandem—which has more explosive potential? 🔥
════════════════════
🔴 $BIRB 30-minute bullish signals
⚠️ Technicals: ADX (39), a clear trending market | MACD golden cross above zero, bullish momentum unleashed | EMA5 > EMA8 > EMA13, bullish alignment | KDJ running strongly, bulls in control (K: 71.3, D: 67.5) | Volume surge (2.5x)
════════════════════
🔴 $BLESS 30-minute bullish signals
⚠️ Technicals: ADX (37), a clear trending market | MACD golden cross above zero, bullish momentum unleashed | EMA5 > EMA8 > EMA13, bullish alignment | KDJ golden cross, short-term outlook bullish (K: 62.4, D: 59.3) | Volume increase (1.8x)
════════════════════
🔴 $XPD 30-minute bullish signals
⚠️ Technicals: ADX (32), a clear trending market | MACD DIF breaks above zero, trend turns bullish | Moving averages converge as momentum builds; direction to be determined soon | Volume increase (2.2x)
════════════════════
🔔 Follow for real-time market updates 🔔
#技术分析 #BIRB #BLESS #XPD
📌 When trading, pay attention to whether the candlestick patterns align
$BIRB / $BLESS / $XPD 30-minute technicals are strengthening in tandem—which has more explosive potential? 🔥
════════════════════
🔴 $BIRB 30-minute bullish signals
⚠️ Technicals: ADX (39), a clear trending market | MACD golden cross above zero, bullish momentum unleashed | EMA5 > EMA8 > EMA13, bullish alignment | KDJ running strongly, bulls in control (K: 71.3, D: 67.5) | Volume surge (2.5x)
════════════════════
🔴 $BLESS 30-minute bullish signals
⚠️ Technicals: ADX (37), a clear trending market | MACD golden cross above zero, bullish momentum unleashed | EMA5 > EMA8 > EMA13, bullish alignment | KDJ golden cross, short-term outlook bullish (K: 62.4, D: 59.3) | Volume increase (1.8x)
════════════════════
🔴 $XPD 30-minute bullish signals
⚠️ Technicals: ADX (32), a clear trending market | MACD DIF breaks above zero, trend turns bullish | Moving averages converge as momentum builds; direction to be determined soon | Volume increase (2.2x)
════════════════════
🔔 Follow for real-time market updates 🔔
#技术分析 #BIRB #BLESS #XPD
📌 When trading, pay attention to whether the candlestick patterns align
════════════════════
🔴 $BIRB 30-minute bullish signals
⚠️ Technicals: ADX (39), a clear trending market | MACD golden cross above zero, bullish momentum unleashed | EMA5 > EMA8 > EMA13, bullish alignment | KDJ running strongly, bulls in control (K: 71.3, D: 67.5) | Volume surge (2.5x)
════════════════════
🔴 $BLESS 30-minute bullish signals
⚠️ Technicals: ADX (37), a clear trending market | MACD golden cross above zero, bullish momentum unleashed | EMA5 > EMA8 > EMA13, bullish alignment | KDJ golden cross, short-term outlook bullish (K: 62.4, D: 59.3) | Volume increase (1.8x)
════════════════════
🔴 $XPD 30-minute bullish signals
⚠️ Technicals: ADX (32), a clear trending market | MACD DIF breaks above zero, trend turns bullish | Moving averages converge as momentum builds; direction to be determined soon | Volume increase (2.2x)
════════════════════
🔔 Follow for real-time market updates 🔔
#技术分析 #BIRB #BLESS #XPD
📌 When trading, pay attention to whether the candlestick patterns align
11

·
--
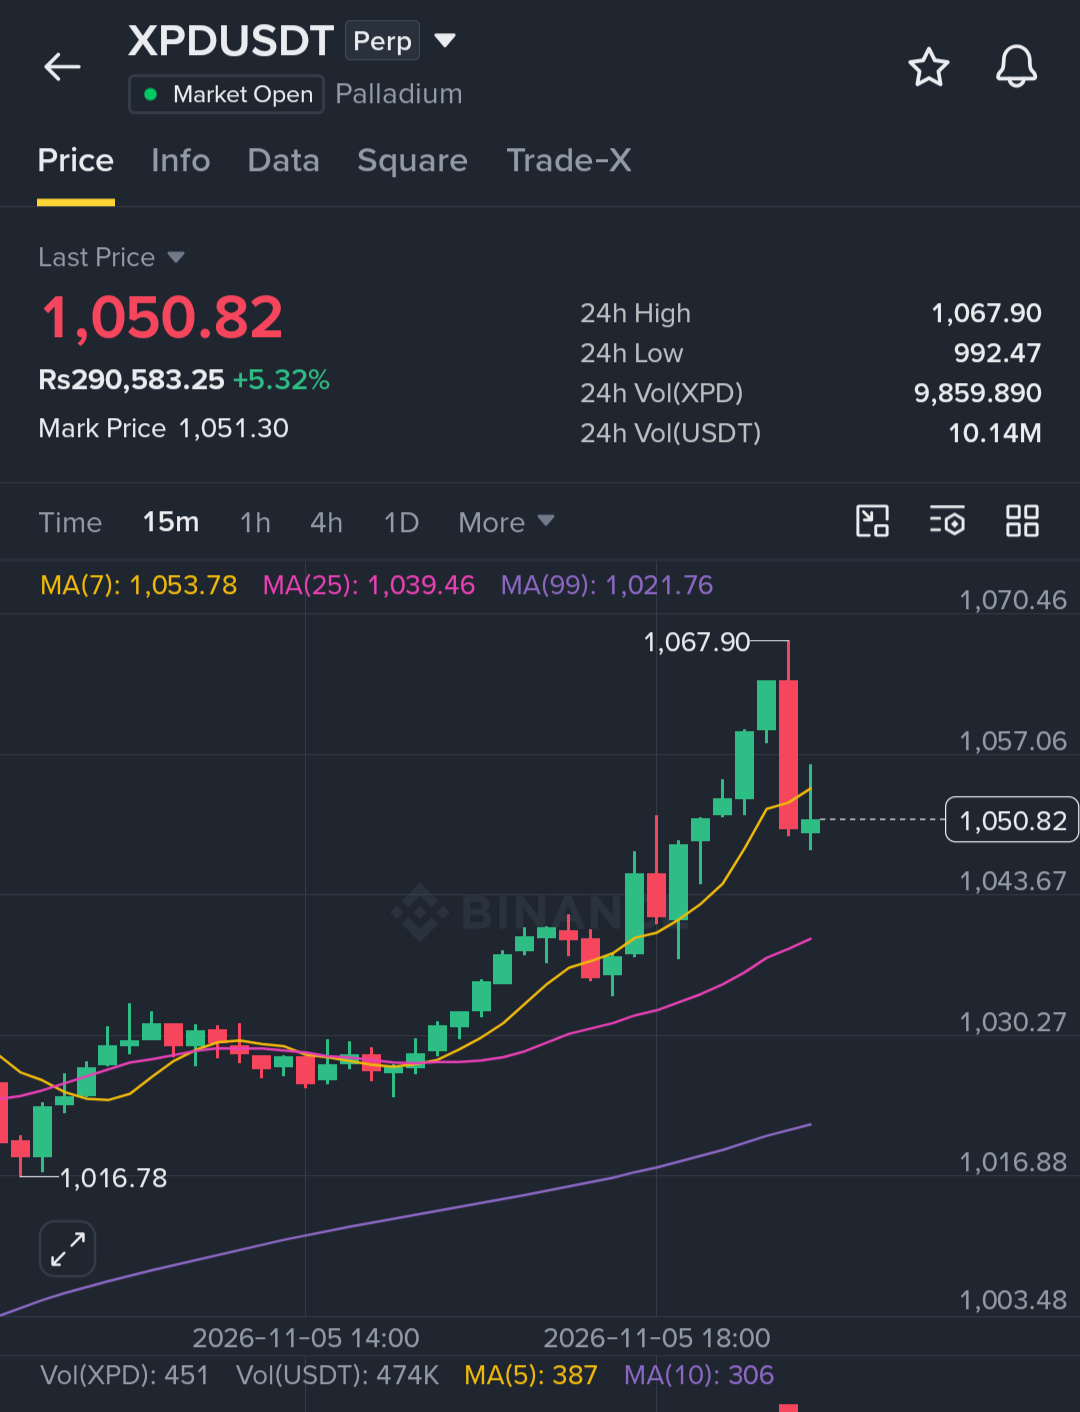
$XPD is pulling back from the 1,067.90 high, with price holding above the MA25 and MA99 and buyers defending the dip. Structure stays constructive while it holds this zone.
Key Level:
🟢 Bullish above: 1,058
Trade Setup (Long):
🟢 Entry Zone: 1,038 – 1,049
🎯 Targets: 1,061 / 1,073 / 1,089
⛔ Stop Loss: 1,022
Price is holding above the trend lines after the pullback, so enter on dips and manage risk carefully.
Click here to buy now 👉 $XPD
{future}(XPDUSDT)
#XPD #USMidterms-WhatAreMarketsExpecting?
$XPD is pulling back from the 1,067.90 high, with price holding above the MA25 and MA99 and buyers defending the dip. Structure stays constructive while it holds this zone.
Key Level:
🟢 Bullish above: 1,058
Trade Setup (Long):
🟢 Entry Zone: 1,038 – 1,049
🎯 Targets: 1,061 / 1,073 / 1,089
⛔ Stop Loss: 1,022
Price is holding above the trend lines after the pullback, so enter on dips and manage risk carefully.
Click here to buy now 👉 $XPD
#XPD #USMidterms-WhatAreMarketsExpecting?
Key Level:
🟢 Bullish above: 1,058
Trade Setup (Long):
🟢 Entry Zone: 1,038 – 1,049
🎯 Targets: 1,061 / 1,073 / 1,089
⛔ Stop Loss: 1,022
Price is holding above the trend lines after the pullback, so enter on dips and manage risk carefully.
Click here to buy now 👉 $XPD
#XPD #USMidterms-WhatAreMarketsExpecting?
1
23

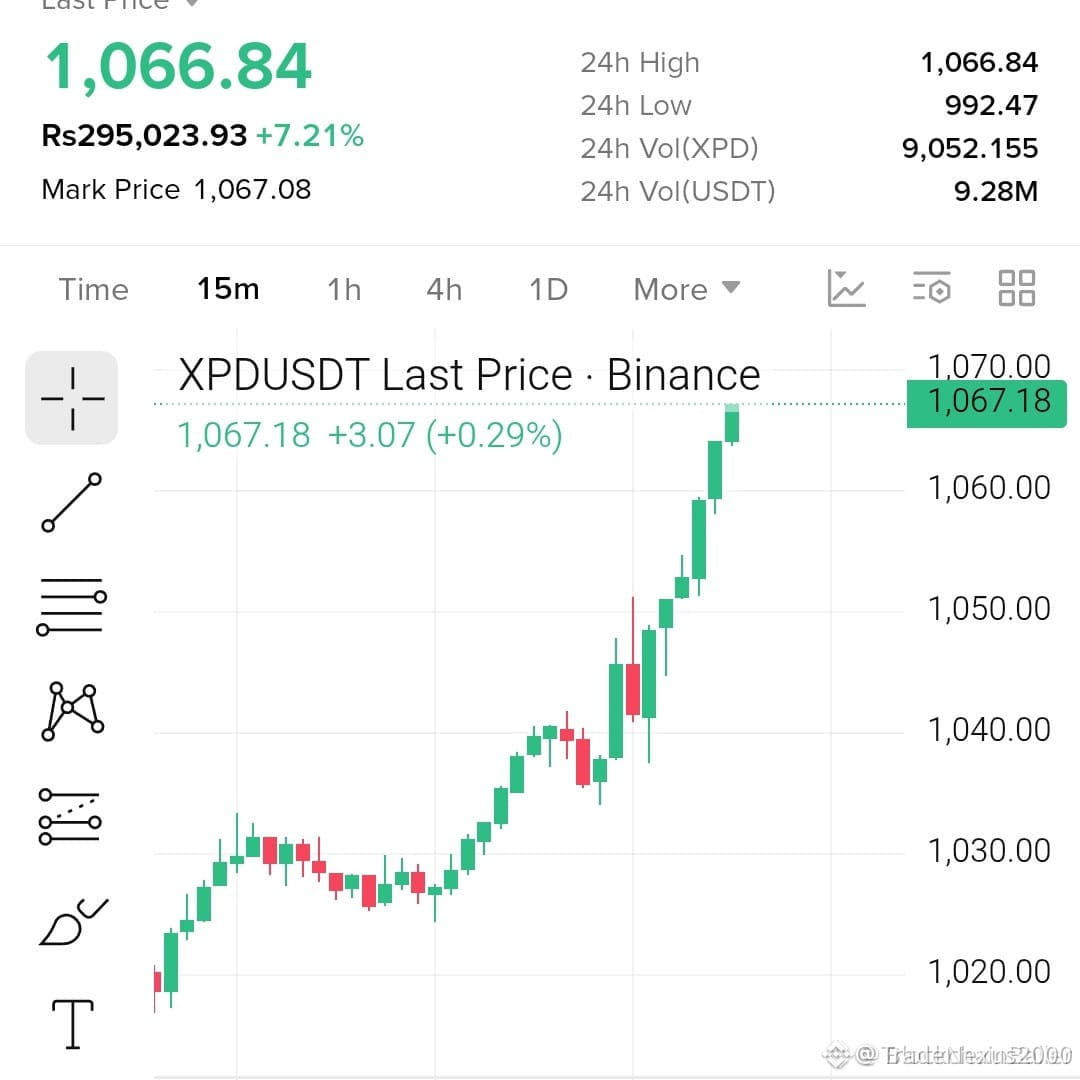
🚨 $XPD BULLISH SWEEP ABOVE 1060 – LIQUIDITY HUNT UNFOLDS! 💥
Entry: 1060.00-1066.84 ⚡
Target: 1110.00 🚀
Stop Loss: 1045.00 ⚠️
📊 The demand zone anchored between 1060‑1066.84 has repeatedly absorbed sell pressure, signaling smart‑money accumulation. 📈 Volume on the 4H is expanding, while the order block sits just above recent liquidity pools, setting the stage for a clean upside thrust. 🦈 A decisive break here could cascade through the TP ladder, rewarding disciplined entries.
💬 Are you positioning for the full run to 1110 or scaling in as each TP clears? 👇
⚠️ Not financial advice. Always manage your risk. 🛡️
🏷️ #XPD #LongSetup #Liquidity #SmartMoney #Crypto
🔥 💎
🚨 $XPD BULLISH SWEEP ABOVE 1060 – LIQUIDITY HUNT UNFOLDS! 💥
Entry: 1060.00-1066.84 ⚡
Target: 1110.00 🚀
Stop Loss: 1045.00 ⚠️
📊 The demand zone anchored between 1060‑1066.84 has repeatedly absorbed sell pressure, signaling smart‑money accumulation. 📈 Volume on the 4H is expanding, while the order block sits just above recent liquidity pools, setting the stage for a clean upside thrust. 🦈 A decisive break here could cascade through the TP ladder, rewarding disciplined entries.
💬 Are you positioning for the full run to 1110 or scaling in as each TP clears? 👇
⚠️ Not financial advice. Always manage your risk. 🛡️
🏷️ #XPD #LongSetup #Liquidity #SmartMoney #Crypto
🔥 💎
Entry: 1060.00-1066.84 ⚡
Target: 1110.00 🚀
Stop Loss: 1045.00 ⚠️
📊 The demand zone anchored between 1060‑1066.84 has repeatedly absorbed sell pressure, signaling smart‑money accumulation. 📈 Volume on the 4H is expanding, while the order block sits just above recent liquidity pools, setting the stage for a clean upside thrust. 🦈 A decisive break here could cascade through the TP ladder, rewarding disciplined entries.
💬 Are you positioning for the full run to 1110 or scaling in as each TP clears? 👇
⚠️ Not financial advice. Always manage your risk. 🛡️
🏷️ #XPD #LongSetup #Liquidity #SmartMoney #Crypto
🔥 💎
2

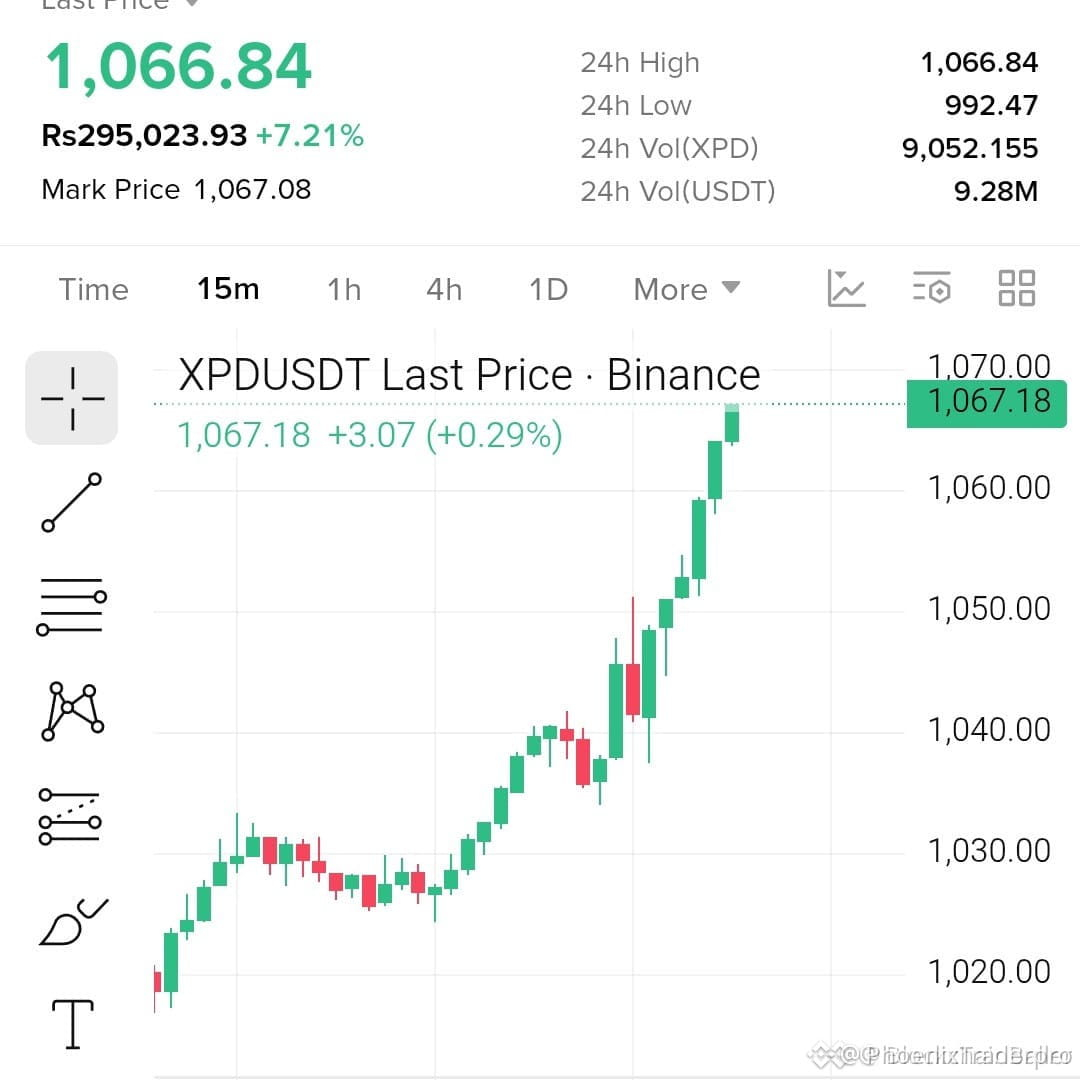
🚀 $XPD SURFACES THROUGH LIQUIDITY WALL, BULLISH RUSH AHEAD! 🟢
Entry: 1060-1066.84 ⚡
Target: 1075 🚀
Target: 1090 🚀
Target: 1110 🚀
Stop Loss: 1045 ⚠️
📊 Smart money has been gobbling the 1060‑1066.84 order block, flipping sell pressure into fresh buying thrust. 🌊 Volume spikes on the 4H chart signal a genuine demand surge, and the RSI is flirting with over‑bought territory, hinting at a short‑term pull‑back before the next leg. 💡 The risk‑to‑reward profile stretches comfortably past 1:3, making each target a clean ladder climb for aggressive longs.
💬 Who’s ready to ride the wave up to 1110? 👇
⚠️ Not financial advice. Always manage your risk. 🛡️
🏷️ #XPD #LongSetup #Bullish #Crypto
🔥 💎
🚀 $XPD SURFACES THROUGH LIQUIDITY WALL, BULLISH RUSH AHEAD! 🟢
Entry: 1060-1066.84 ⚡
Target: 1075 🚀
Target: 1090 🚀
Target: 1110 🚀
Stop Loss: 1045 ⚠️
📊 Smart money has been gobbling the 1060‑1066.84 order block, flipping sell pressure into fresh buying thrust. 🌊 Volume spikes on the 4H chart signal a genuine demand surge, and the RSI is flirting with over‑bought territory, hinting at a short‑term pull‑back before the next leg. 💡 The risk‑to‑reward profile stretches comfortably past 1:3, making each target a clean ladder climb for aggressive longs.
💬 Who’s ready to ride the wave up to 1110? 👇
⚠️ Not financial advice. Always manage your risk. 🛡️
🏷️ #XPD #LongSetup #Bullish #Crypto
🔥 💎
Entry: 1060-1066.84 ⚡
Target: 1075 🚀
Target: 1090 🚀
Target: 1110 🚀
Stop Loss: 1045 ⚠️
📊 Smart money has been gobbling the 1060‑1066.84 order block, flipping sell pressure into fresh buying thrust. 🌊 Volume spikes on the 4H chart signal a genuine demand surge, and the RSI is flirting with over‑bought territory, hinting at a short‑term pull‑back before the next leg. 💡 The risk‑to‑reward profile stretches comfortably past 1:3, making each target a clean ladder climb for aggressive longs.
💬 Who’s ready to ride the wave up to 1110? 👇
⚠️ Not financial advice. Always manage your risk. 🛡️
🏷️ #XPD #LongSetup #Bullish #Crypto
🔥 💎
7

·
--
$XPD Is Showing Signs of a Bullish Reversal — Can Buyers Push It Higher?
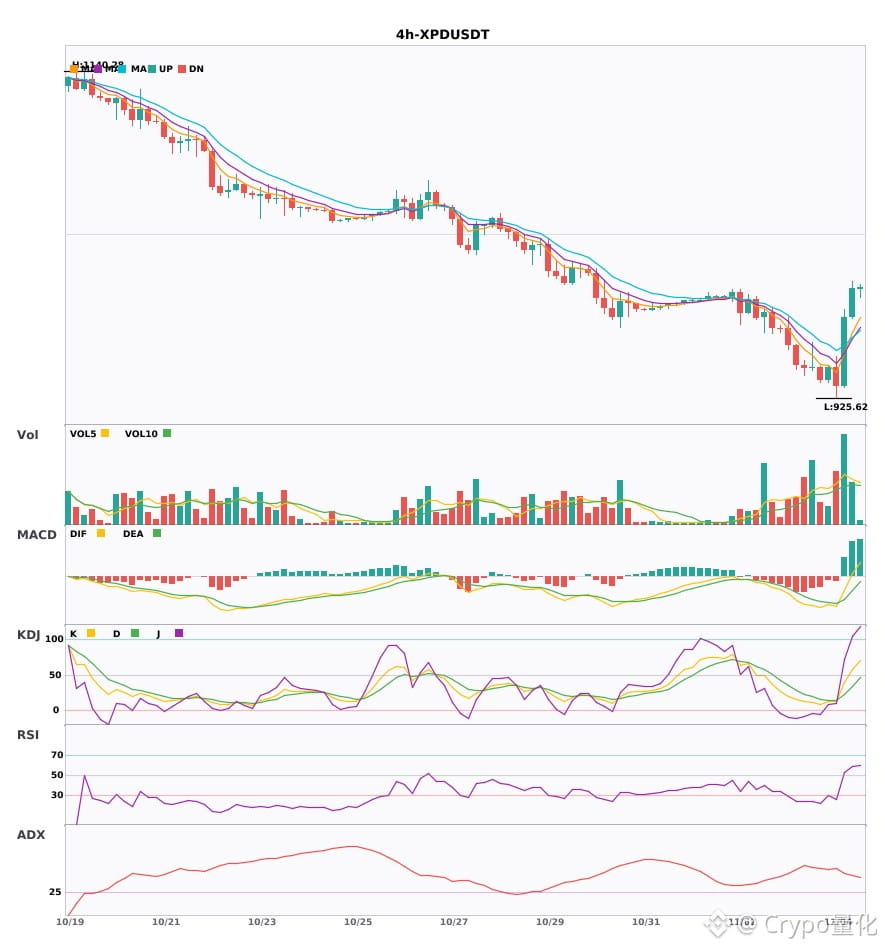
After rebounding strongly from the $925 area, $XPD is showing renewed buying interest. The recovery looks promising, but bulls still need to overcome the resistance zone to confirm stronger upside momentum.
Bullish Trade Setup
- Entry Zone: $1,050 – $1,060
- TP1: $1,080
- TP2: $1,130
- TP3: $1,180
- Final Target: $1,270
- Stop Loss: $940
What I'm Watching:
The $940 level is an important support zone. Holding above it could keep the recovery scenario alive.
The major hurdle is around $1,140. A convincing breakout above this resistance could open the door toward $1,180 and potentially $1,270.
My Take: Bullish bias while support holds, but confirmation matters. Watch the breakout before chasing the move.
What do you think — can $XPD reach $1,270?
#XPD #CryptoTrading #BinanceSquare
$XPD Is Showing Signs of a Bullish Reversal — Can Buyers Push It Higher?
After rebounding strongly from the $925 area, $XPD is showing renewed buying interest. The recovery looks promising, but bulls still need to overcome the resistance zone to confirm stronger upside momentum.
Bullish Trade Setup
- Entry Zone: $1,050 – $1,060
- TP1: $1,080
- TP2: $1,130
- TP3: $1,180
- Final Target: $1,270
- Stop Loss: $940
What I'm Watching:
The $940 level is an important support zone. Holding above it could keep the recovery scenario alive.
The major hurdle is around $1,140. A convincing breakout above this resistance could open the door toward $1,180 and potentially $1,270.
My Take: Bullish bias while support holds, but confirmation matters. Watch the breakout before chasing the move.
What do you think — can $XPD reach $1,270?
#XPD #CryptoTrading #BinanceSquare
After rebounding strongly from the $925 area, $XPD is showing renewed buying interest. The recovery looks promising, but bulls still need to overcome the resistance zone to confirm stronger upside momentum.
Bullish Trade Setup
- Entry Zone: $1,050 – $1,060
- TP1: $1,080
- TP2: $1,130
- TP3: $1,180
- Final Target: $1,270
- Stop Loss: $940
What I'm Watching:
The $940 level is an important support zone. Holding above it could keep the recovery scenario alive.
The major hurdle is around $1,140. A convincing breakout above this resistance could open the door toward $1,180 and potentially $1,270.
My Take: Bullish bias while support holds, but confirmation matters. Watch the breakout before chasing the move.
What do you think — can $XPD reach $1,270?
#XPD #CryptoTrading #BinanceSquare
80
·
--
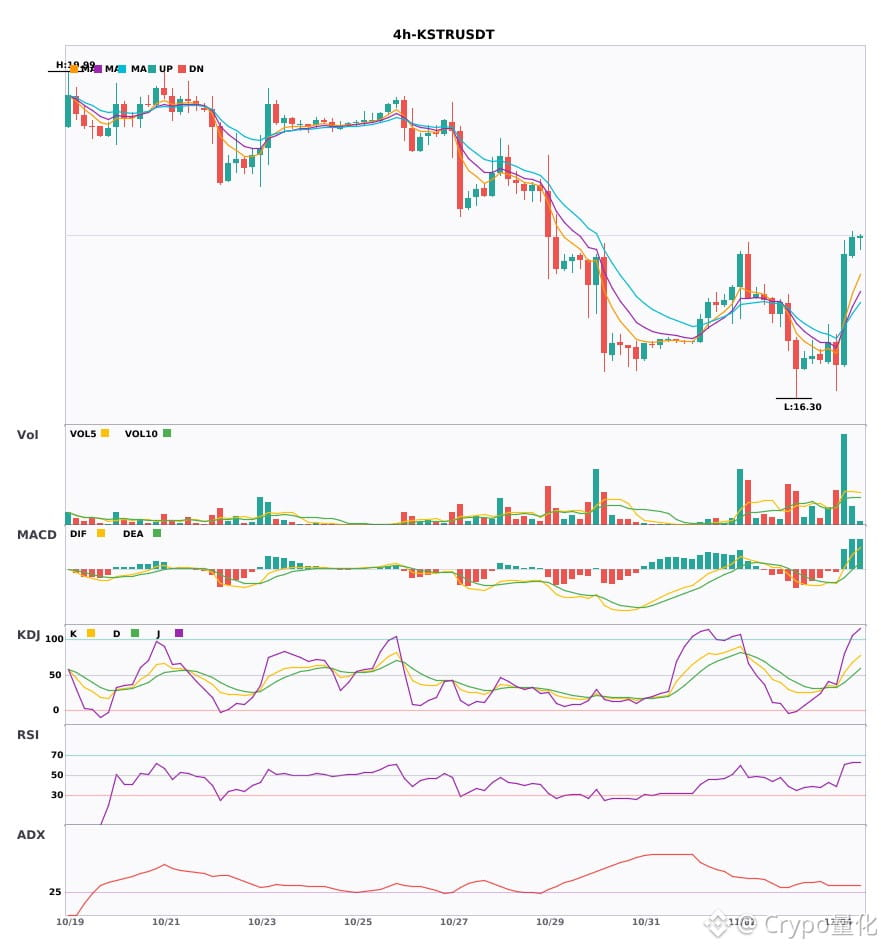
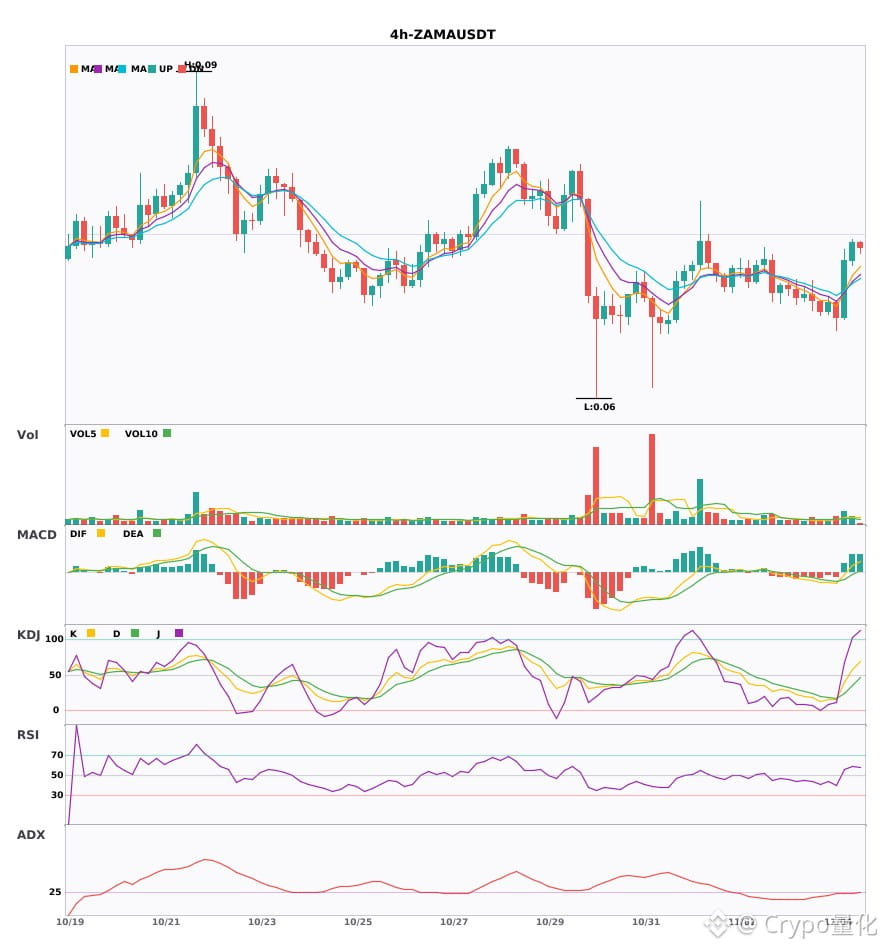
$KSTR / $ZAMA / $XPD 4-hour confluence turns bullish; bullish signals appear simultaneously🔥
════════════════════
🔴 $KSTR 4-hour bullish signal
⚠️Technical analysis: ADX(34) indicates a clear trending market | MACD golden cross above zero, bullish momentum released | EMA5 crosses above EMA8, short-term outlook turns bullish | Volume surge (3.5x)
════════════════════
🔴 $ZAMA 4-hour bullish signal
⚠️Technical analysis: ADX(28) trend is forming, potential entry | MACD DIF breaks above the zero line, trend turns bullish | EMA5 > EMA8 > EMA13, bullish alignment | Volume increases (2.1x)
════════════════════
🔴 $XPD 4-hour bullish signal
⚠️Technical analysis: ADX(45) indicates a clear trending market | MACD DIF breaks above the zero line, trend turns bullish | EMA5 crosses above EMA8, short-term outlook turns bullish | Volume increases (2.4x)
════════════════════
🔔 Follow for the latest market movements 🔔
#技术分析 #KSTR #ZAMA #XPD
📌 When trading, pay attention to whether the candlestick pattern confirms the signal
$KSTR / $ZAMA / $XPD 4-hour confluence turns bullish; bullish signals appear simultaneously🔥
════════════════════
🔴 $KSTR 4-hour bullish signal
⚠️Technical analysis: ADX(34) indicates a clear trending market | MACD golden cross above zero, bullish momentum released | EMA5 crosses above EMA8, short-term outlook turns bullish | Volume surge (3.5x)
════════════════════
🔴 $ZAMA 4-hour bullish signal
⚠️Technical analysis: ADX(28) trend is forming, potential entry | MACD DIF breaks above the zero line, trend turns bullish | EMA5 > EMA8 > EMA13, bullish alignment | Volume increases (2.1x)
════════════════════
🔴 $XPD 4-hour bullish signal
⚠️Technical analysis: ADX(45) indicates a clear trending market | MACD DIF breaks above the zero line, trend turns bullish | EMA5 crosses above EMA8, short-term outlook turns bullish | Volume increases (2.4x)
════════════════════
🔔 Follow for the latest market movements 🔔
#技术分析 #KSTR #ZAMA #XPD
📌 When trading, pay attention to whether the candlestick pattern confirms the signal
════════════════════
🔴 $KSTR 4-hour bullish signal
⚠️Technical analysis: ADX(34) indicates a clear trending market | MACD golden cross above zero, bullish momentum released | EMA5 crosses above EMA8, short-term outlook turns bullish | Volume surge (3.5x)
════════════════════
🔴 $ZAMA 4-hour bullish signal
⚠️Technical analysis: ADX(28) trend is forming, potential entry | MACD DIF breaks above the zero line, trend turns bullish | EMA5 > EMA8 > EMA13, bullish alignment | Volume increases (2.1x)
════════════════════
🔴 $XPD 4-hour bullish signal
⚠️Technical analysis: ADX(45) indicates a clear trending market | MACD DIF breaks above the zero line, trend turns bullish | EMA5 crosses above EMA8, short-term outlook turns bullish | Volume increases (2.4x)
════════════════════
🔔 Follow for the latest market movements 🔔
#技术分析 #KSTR #ZAMA #XPD
📌 When trading, pay attention to whether the candlestick pattern confirms the signal
22
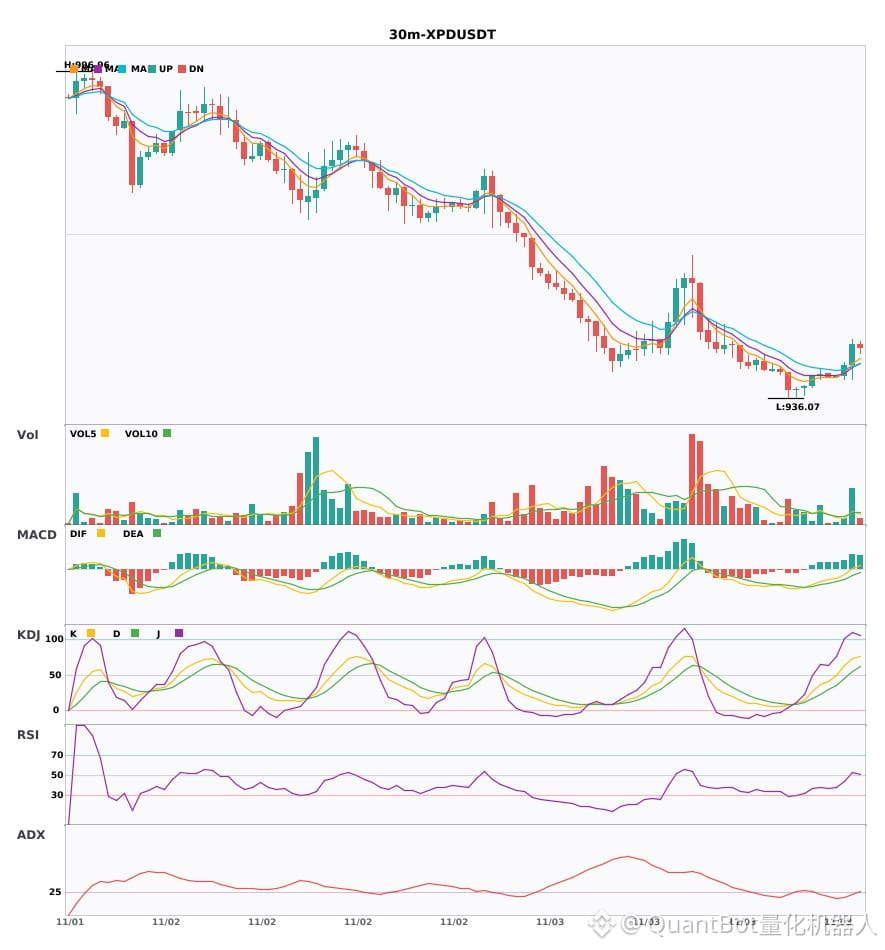
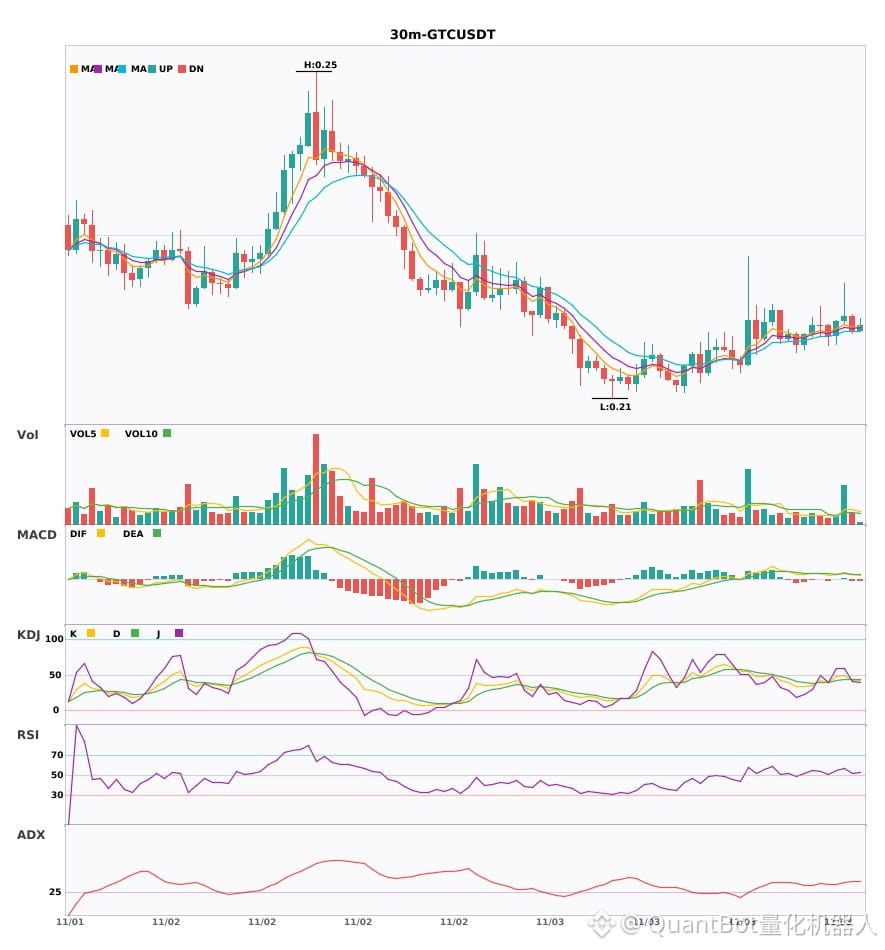
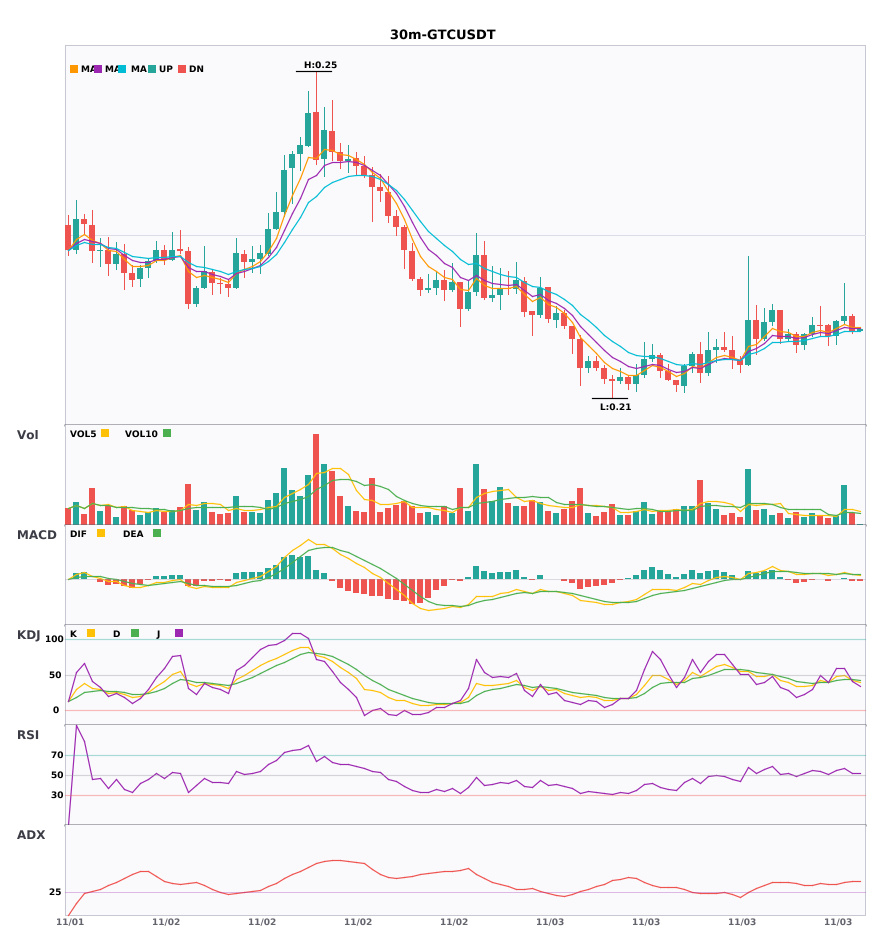
$XPD / $GTC 30-minute timeframe bullish, short-term confluence opportunity
📈 $XPD | 30-minute bullish signal
━━━━━━━━━━━━━━━━━━
Technical analysis: ADX(25) Trend is forming, participation is possible | MACD DIF broke above the zero line, trend turning bullish | Moving averages converging, building momentum and about to choose a direction | KDJ running strong, bulls have the advantage (K: 72.9, D: 54.3) | Volume surge (2.9x)
Price change: 0.4200%
📈 $GTC | 30-minute bullish signal
━━━━━━━━━━━━━━━━━━
Technical analysis: ADX(37) Clear trending market | MACD golden cross above zero, bullish momentum released | EMA5 > EMA8 > EMA13, bullish alignment | KDJ running weak, bears have the advantage (K: 49.2, D: 44.4) | Volume surge (3.2x)
Price change: 0.2800%
━━━━━━━━━━━━━━━━━━
#技术分析 #XPD #GTC
📌 The above content is for reference only and does not constitute investment advice
$XPD / $GTC 30-minute timeframe bullish, short-term confluence opportunity
📈 $XPD | 30-minute bullish signal
━━━━━━━━━━━━━━━━━━
Technical analysis: ADX(25) Trend is forming, participation is possible | MACD DIF broke above the zero line, trend turning bullish | Moving averages converging, building momentum and about to choose a direction | KDJ running strong, bulls have the advantage (K: 72.9, D: 54.3) | Volume surge (2.9x)
Price change: 0.4200%
📈 $GTC | 30-minute bullish signal
━━━━━━━━━━━━━━━━━━
Technical analysis: ADX(37) Clear trending market | MACD golden cross above zero, bullish momentum released | EMA5 > EMA8 > EMA13, bullish alignment | KDJ running weak, bears have the advantage (K: 49.2, D: 44.4) | Volume surge (3.2x)
Price change: 0.2800%
━━━━━━━━━━━━━━━━━━
#技术分析 #XPD #GTC
📌 The above content is for reference only and does not constitute investment advice
📈 $XPD | 30-minute bullish signal
━━━━━━━━━━━━━━━━━━
Technical analysis: ADX(25) Trend is forming, participation is possible | MACD DIF broke above the zero line, trend turning bullish | Moving averages converging, building momentum and about to choose a direction | KDJ running strong, bulls have the advantage (K: 72.9, D: 54.3) | Volume surge (2.9x)
Price change: 0.4200%
📈 $GTC | 30-minute bullish signal
━━━━━━━━━━━━━━━━━━
Technical analysis: ADX(37) Clear trending market | MACD golden cross above zero, bullish momentum released | EMA5 > EMA8 > EMA13, bullish alignment | KDJ running weak, bears have the advantage (K: 49.2, D: 44.4) | Volume surge (3.2x)
Price change: 0.2800%
━━━━━━━━━━━━━━━━━━
#技术分析 #XPD #GTC
📌 The above content is for reference only and does not constitute investment advice
72
·
--
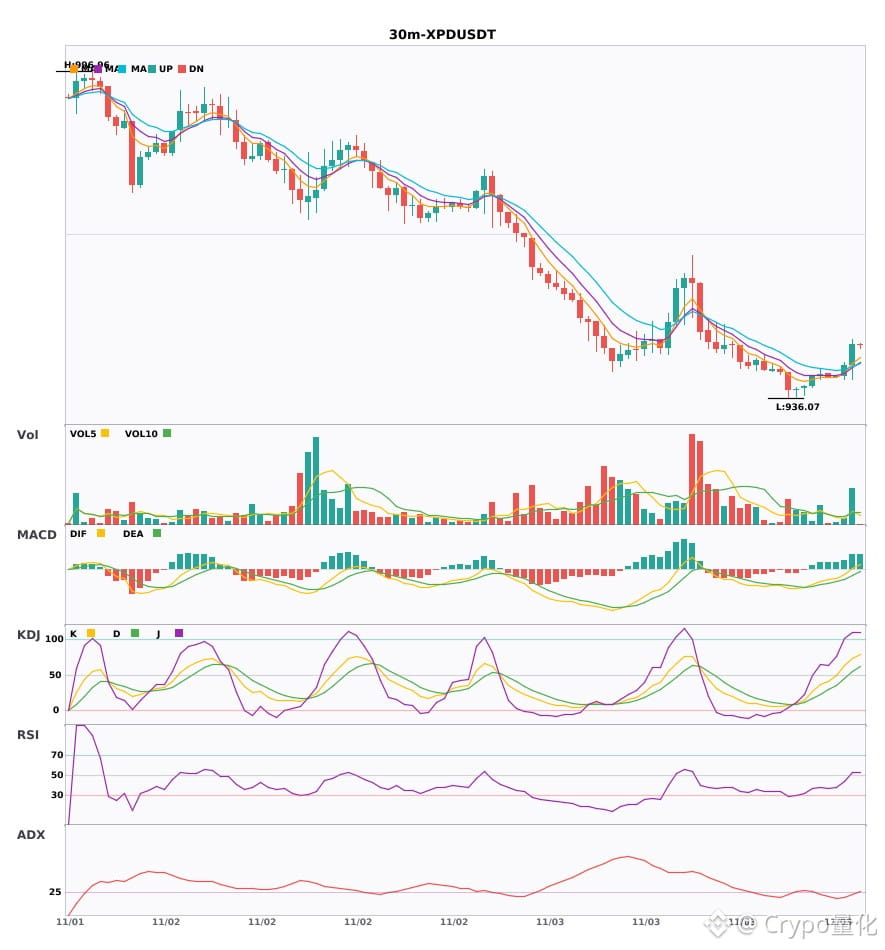
$XPD / $GTC 30-minute technicals are strengthening together—which has more explosive potential? 🔥
════════════════════
🔴 $XPD 30-minute bullish signal
⚠️ Technicals: ADX(25): A trend is forming; opportunity to participate | MACD DIF breaks above the zero line, turning the trend bullish | Moving averages are converging and building momentum, with a directional move imminent | KDJ is running strong, with bulls in control (K: 72.9, D: 54.3) | Volume surge (2.9x)
════════════════════
🔴 $GTC 30-minute bullish signal
⚠️ Technicals: ADX(37): A clear trending market | MACD golden cross above zero, releasing bullish momentum | EMA5 > EMA8 > EMA13: bullish alignment | KDJ is running weak, with bears in control (K: 49.2, D: 44.4) | Volume surge (3.2x)
════════════════════
🔔 Follow for real-time market alerts 🔔
#技术分析 #XPD #GTC
📌 When trading, watch for confirmation from the candlestick pattern
$XPD / $GTC 30-minute technicals are strengthening together—which has more explosive potential? 🔥
════════════════════
🔴 $XPD 30-minute bullish signal
⚠️ Technicals: ADX(25): A trend is forming; opportunity to participate | MACD DIF breaks above the zero line, turning the trend bullish | Moving averages are converging and building momentum, with a directional move imminent | KDJ is running strong, with bulls in control (K: 72.9, D: 54.3) | Volume surge (2.9x)
════════════════════
🔴 $GTC 30-minute bullish signal
⚠️ Technicals: ADX(37): A clear trending market | MACD golden cross above zero, releasing bullish momentum | EMA5 > EMA8 > EMA13: bullish alignment | KDJ is running weak, with bears in control (K: 49.2, D: 44.4) | Volume surge (3.2x)
════════════════════
🔔 Follow for real-time market alerts 🔔
#技术分析 #XPD #GTC
📌 When trading, watch for confirmation from the candlestick pattern
════════════════════
🔴 $XPD 30-minute bullish signal
⚠️ Technicals: ADX(25): A trend is forming; opportunity to participate | MACD DIF breaks above the zero line, turning the trend bullish | Moving averages are converging and building momentum, with a directional move imminent | KDJ is running strong, with bulls in control (K: 72.9, D: 54.3) | Volume surge (2.9x)
════════════════════
🔴 $GTC 30-minute bullish signal
⚠️ Technicals: ADX(37): A clear trending market | MACD golden cross above zero, releasing bullish momentum | EMA5 > EMA8 > EMA13: bullish alignment | KDJ is running weak, with bears in control (K: 49.2, D: 44.4) | Volume surge (3.2x)
════════════════════
🔔 Follow for real-time market alerts 🔔
#技术分析 #XPD #GTC
📌 When trading, watch for confirmation from the candlestick pattern
73

·
--
Article
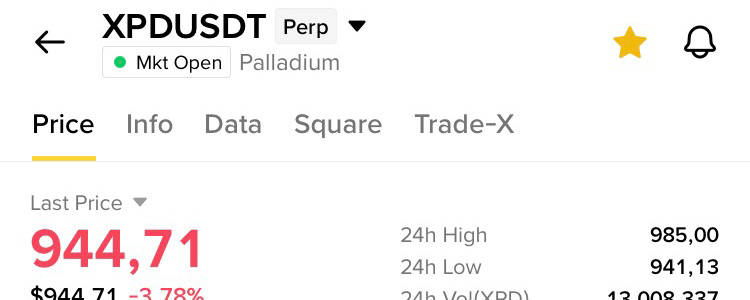
🚨 $XPD — Is a powerful comeback on the horizon? 📈🐳As you all know, $XPD has dropped back near its previous levels! 😳🔥
Could this be the setup for a strong recovery?
I am keeping a close eye on the potential for a bullish reversal. If buying pressure returns, we could see an impressive rally. 🚀
🎯 Target level to watch: 1,150.45
Is anyone else tracking $XPD? Are we gearing up for a comeback, or is there further downside ahead?
⚠️ High risk. Please conduct your own research before entering the market (opening a trade).
#Write2Earn
#XPD #Crypto #altcoins #trading
{future}(XPDUSDT)
🚨 $XPD — Is a powerful comeback on the horizon? 📈🐳
As you all know, $XPD has dropped back near its previous levels! 😳🔥
Could this be the setup for a strong recovery?
I am keeping a close eye on the potential for a bullish reversal. If buying pressure returns, we could see an impressive rally. 🚀
🎯 Target level to watch: 1,150.45
Is anyone else tracking $XPD ? Are we gearing up for a comeback, or is there further downside ahead?
⚠️ High risk. Please conduct your own research before entering the market (opening a trade).
#Write2Earn
#XPD #Crypto #altcoins #trading
Could this be the setup for a strong recovery?
I am keeping a close eye on the potential for a bullish reversal. If buying pressure returns, we could see an impressive rally. 🚀
🎯 Target level to watch: 1,150.45
Is anyone else tracking $XPD ? Are we gearing up for a comeback, or is there further downside ahead?
⚠️ High risk. Please conduct your own research before entering the market (opening a trade).
#Write2Earn
#XPD #Crypto #altcoins #trading
179
Log in to explore more content
Join global crypto users on Binance Square
⚡️ Get latest and useful information about crypto.
💬 Trusted by the world’s largest crypto exchange.
👍 Discover real insights from verified creators.
Email / Phone number
Trending Topics
1
#WhoWillSucceedJensenHuangatNvidia?
192,714 views
1,759 Discussing
2
#WhatWillDriveCryptoandStocks’NextRebound?
607,124 views
3,590 Discussing
3
#TradFiForBeginners
744,592 views
4,562 Discussing
4
#BitcoinActiveSupplyInProfitDropsBelow45%
86,864 views
787 Discussing
5
#KavaSaysAbnormalActivityLimitedToKavaLend
51,504 views
444 Discussing
6
#USSpotXRPETFsSeeLargestWeeklyOutflowIn8Months
36,684 views
385 Discussing
7
#USPPIMissMayEaseBTCPressure
321,748 views
2,311 Discussing
8
#WORPTLetsTouristsConvertCryptoToThaiBaht
11,451 views
109 Discussing
9
#TONStrategyReports$23.97MQ3NetLoss
11,128 views
49 Discussing
10
#PolkadotCommunityApprovesNewStrategyWith97%Vote
31,211 views
301 Discussing