
#kstr
kstr
10,764 views
203 Discussing
Hot
Latest

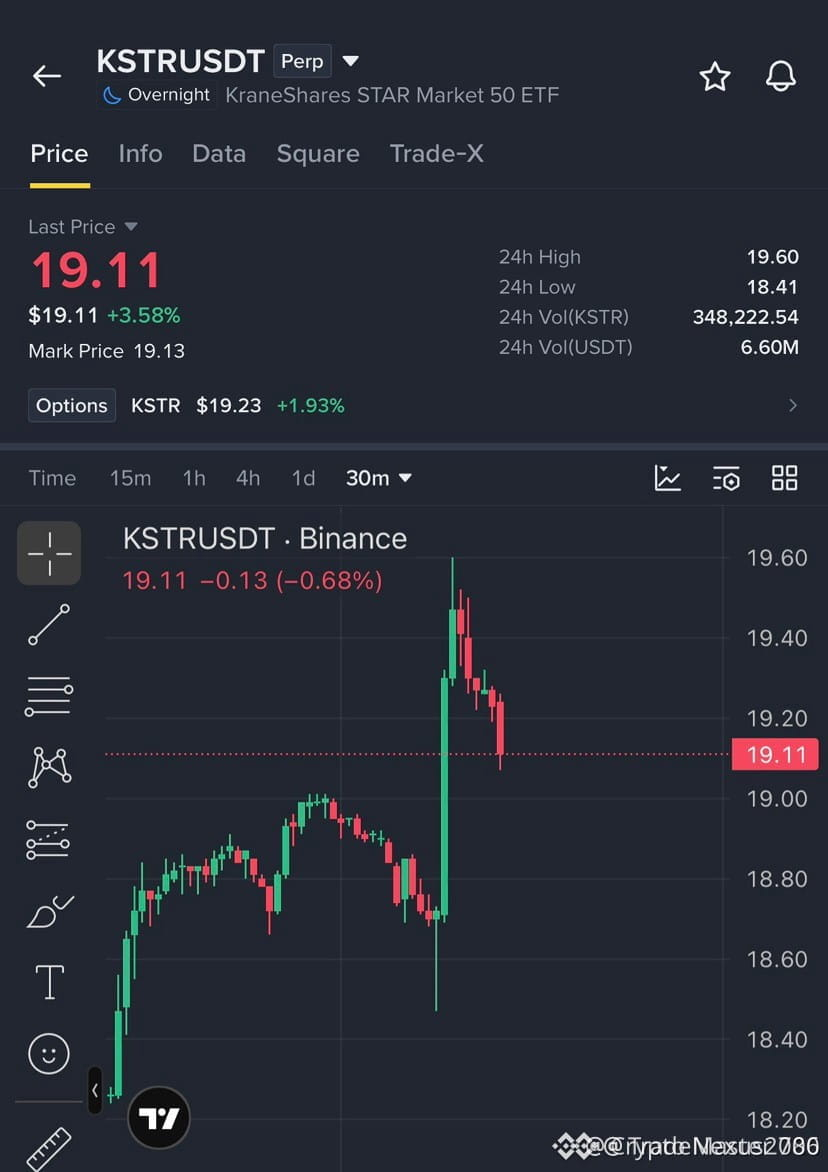
🔴 $KSTR REJECTS AT RESISTANCE AS SMART MONEY PREPARES FOR A LIQUIDITY SWEEP! 📉
Entry: 19.10 - 19.25 ⚡
Target: 19.00 / 18.80 / 18.60 🚀
Stop Loss: 19.65 ⚠️
Sellers stepped in with heavy institutional volume right at the 19.60 block, creating a clean rejection fractal. 📊 Order flow shows distribution building up as momentum shifts in favor of the bears. ⚡
If price slips under 19.10, expect a rapid descent toward lower liquidity pools as trapped longs face forced liquidation. 🌊 Keep a close eye on how volume reacts at each target level. 🔍
💬 Are you positioning for this downside continuation or waiting for a reclaim above resistance? 👇
⚠️ Not financial advice. Always manage your risk. 🛡️
🏷️ #KSTR #ShortSetup #Bearish #OrderFlow #Crypto
🦈 📉
🔴 $KSTR REJECTS AT RESISTANCE AS SMART MONEY PREPARES FOR A LIQUIDITY SWEEP! 📉
Entry: 19.10 - 19.25 ⚡
Target: 19.00 / 18.80 / 18.60 🚀
Stop Loss: 19.65 ⚠️
Sellers stepped in with heavy institutional volume right at the 19.60 block, creating a clean rejection fractal. 📊 Order flow shows distribution building up as momentum shifts in favor of the bears. ⚡
If price slips under 19.10, expect a rapid descent toward lower liquidity pools as trapped longs face forced liquidation. 🌊 Keep a close eye on how volume reacts at each target level. 🔍
💬 Are you positioning for this downside continuation or waiting for a reclaim above resistance? 👇
⚠️ Not financial advice. Always manage your risk. 🛡️
🏷️ #KSTR #ShortSetup #Bearish #OrderFlow #Crypto
🦈 📉
Entry: 19.10 - 19.25 ⚡
Target: 19.00 / 18.80 / 18.60 🚀
Stop Loss: 19.65 ⚠️
Sellers stepped in with heavy institutional volume right at the 19.60 block, creating a clean rejection fractal. 📊 Order flow shows distribution building up as momentum shifts in favor of the bears. ⚡
If price slips under 19.10, expect a rapid descent toward lower liquidity pools as trapped longs face forced liquidation. 🌊 Keep a close eye on how volume reacts at each target level. 🔍
💬 Are you positioning for this downside continuation or waiting for a reclaim above resistance? 👇
⚠️ Not financial advice. Always manage your risk. 🛡️
🏷️ #KSTR #ShortSetup #Bearish #OrderFlow #Crypto
🦈 📉
11

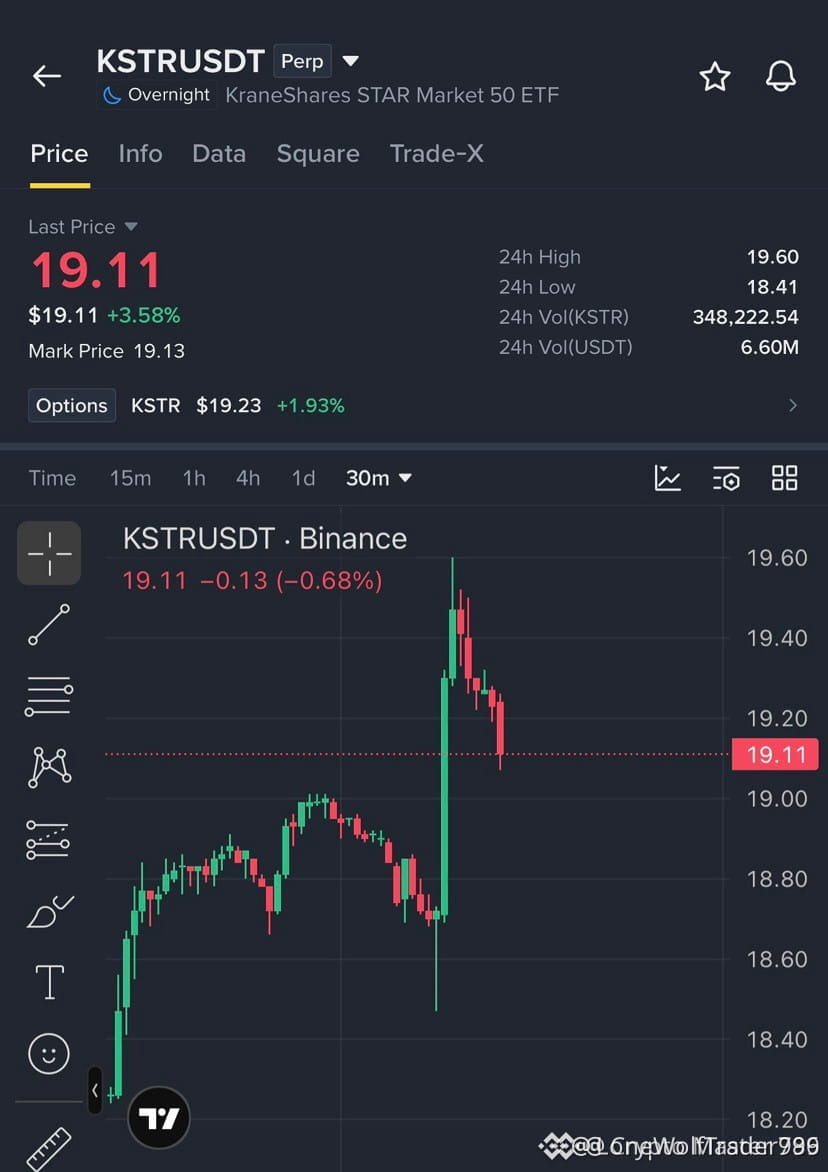
🔴 $KSTR FACES A BRUTAL REJECTION AS SELLERS SQUEEZE THE ORDER BOOK 📉
Entry: 19.10 - 19.25 ⚡
Target: 19.00 / 18.80 / 18.60 🎯
Stop Loss: 19.65 ⚠️
Overhead resistance at 19.60 acted like an iron ceiling, shutting down buyer enthusiasm with heavy distribution. 📊 Order flow shows aggressive selling pressure stepping in right as bids thin out below the key pivot. ⚡
If momentum confirms a breakdown beneath 19.10, expect a fast slide toward lower liquidity pockets as trapped longs scramble to exit. 📉 Are you positioning for this downside continuation or waiting for a deeper flush? 🤔
⚠️ Not financial advice. Always manage your risk. 🛡️
🏷️ #KSTR #ShortSetup #Bearish #Trading #Crypto
📉 🩸
🔴 $KSTR FACES A BRUTAL REJECTION AS SELLERS SQUEEZE THE ORDER BOOK 📉
Entry: 19.10 - 19.25 ⚡
Target: 19.00 / 18.80 / 18.60 🎯
Stop Loss: 19.65 ⚠️
Overhead resistance at 19.60 acted like an iron ceiling, shutting down buyer enthusiasm with heavy distribution. 📊 Order flow shows aggressive selling pressure stepping in right as bids thin out below the key pivot. ⚡
If momentum confirms a breakdown beneath 19.10, expect a fast slide toward lower liquidity pockets as trapped longs scramble to exit. 📉 Are you positioning for this downside continuation or waiting for a deeper flush? 🤔
⚠️ Not financial advice. Always manage your risk. 🛡️
🏷️ #KSTR #ShortSetup #Bearish #Trading #Crypto
📉 🩸
Entry: 19.10 - 19.25 ⚡
Target: 19.00 / 18.80 / 18.60 🎯
Stop Loss: 19.65 ⚠️
Overhead resistance at 19.60 acted like an iron ceiling, shutting down buyer enthusiasm with heavy distribution. 📊 Order flow shows aggressive selling pressure stepping in right as bids thin out below the key pivot. ⚡
If momentum confirms a breakdown beneath 19.10, expect a fast slide toward lower liquidity pockets as trapped longs scramble to exit. 📉 Are you positioning for this downside continuation or waiting for a deeper flush? 🤔
⚠️ Not financial advice. Always manage your risk. 🛡️
🏷️ #KSTR #ShortSetup #Bearish #Trading #Crypto
📉 🩸
3

·
--
Bearish
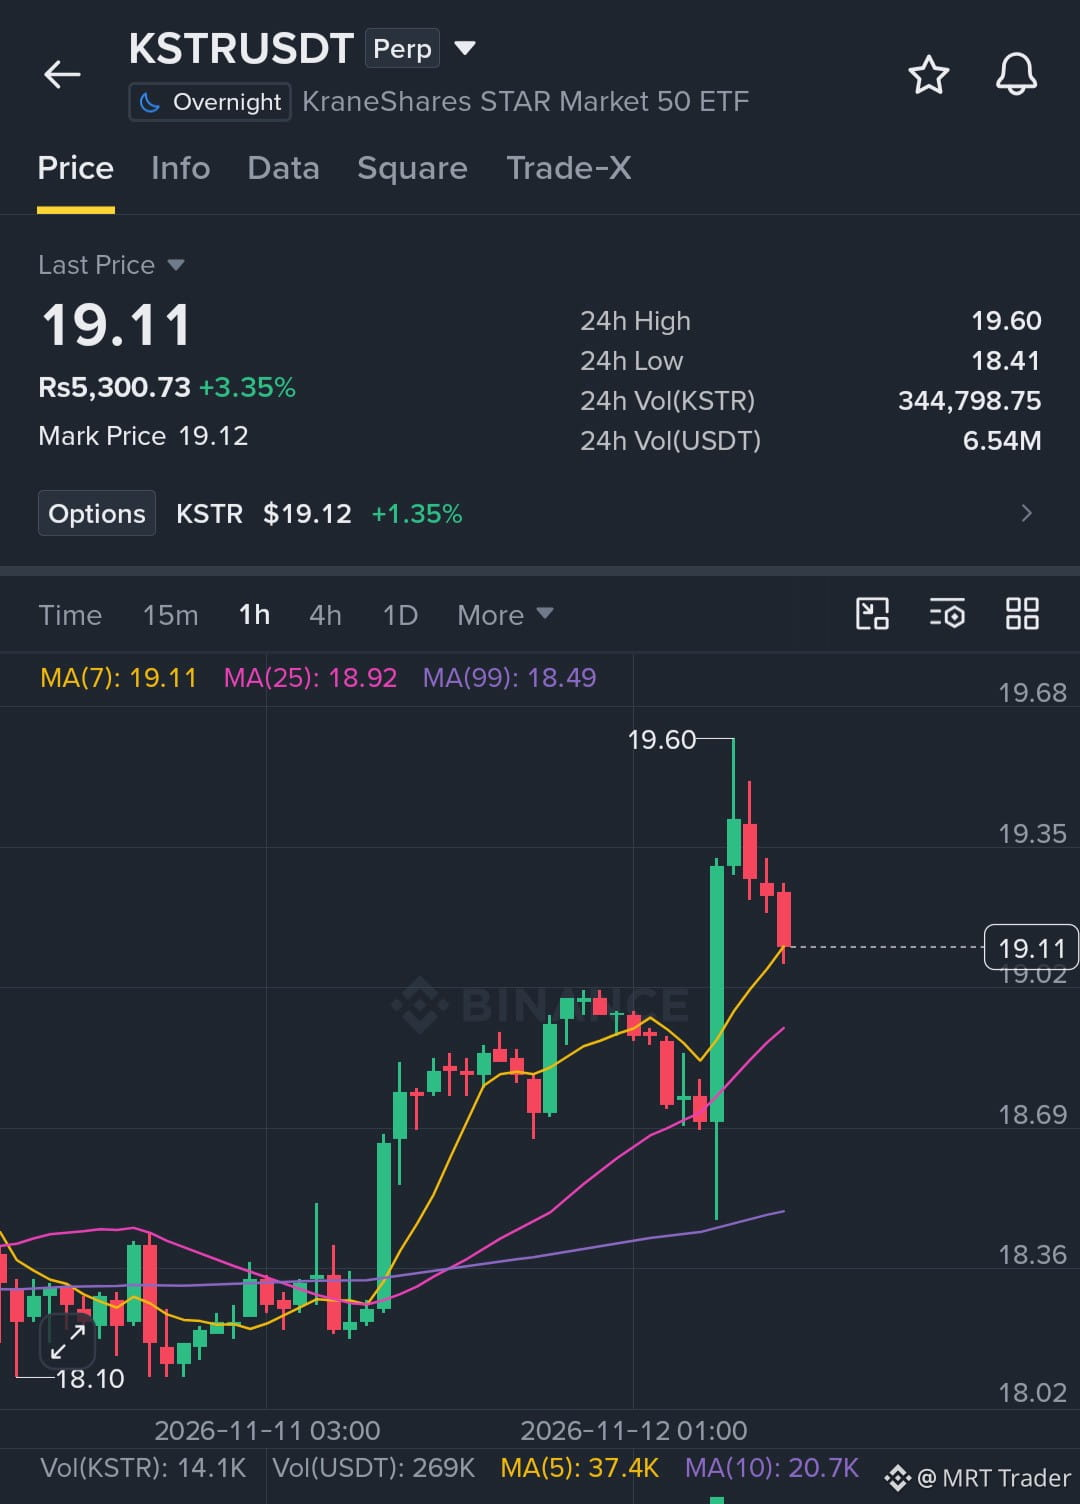
$KSTR is facing a sharp rejection near 19.60, and bears are gaining momentum. A break below 19.10 could trigger another drop. 🔴
Key Level:
🔴 Bearish below: 19.10
Trade Setup (Short):
🔴 Entry Zone: 19.11 – 19.26
🎯 Targets: 19.01 / 18.81 / 18.61
⛔ Stop Loss: 19.66
Price is showing bearish pressure. Look to enter on bounces and manage risk appropriately.
Click here to short now 👉 $KSTR
{future}(KSTRUSDT)
#KSTR #CoreWeaveJumps10%On168%RevenueGrowth
$KSTR is facing a sharp rejection near 19.60, and bears are gaining momentum. A break below 19.10 could trigger another drop. 🔴
Key Level:
🔴 Bearish below: 19.10
Trade Setup (Short):
🔴 Entry Zone: 19.11 – 19.26
🎯 Targets: 19.01 / 18.81 / 18.61
⛔ Stop Loss: 19.66
Price is showing bearish pressure. Look to enter on bounces and manage risk appropriately.
Click here to short now 👉 $KSTR
#KSTR #CoreWeaveJumps10%On168%RevenueGrowth
Key Level:
🔴 Bearish below: 19.10
Trade Setup (Short):
🔴 Entry Zone: 19.11 – 19.26
🎯 Targets: 19.01 / 18.81 / 18.61
⛔ Stop Loss: 19.66
Price is showing bearish pressure. Look to enter on bounces and manage risk appropriately.
Click here to short now 👉 $KSTR
#KSTR #CoreWeaveJumps10%On168%RevenueGrowth
4
34

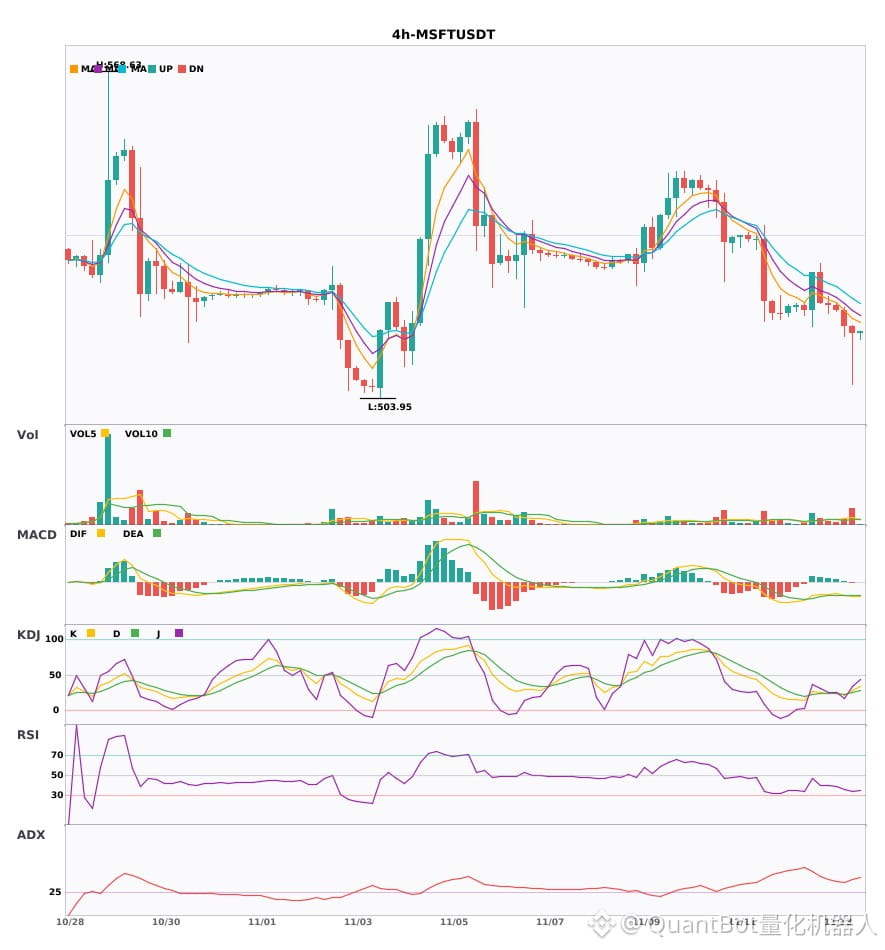
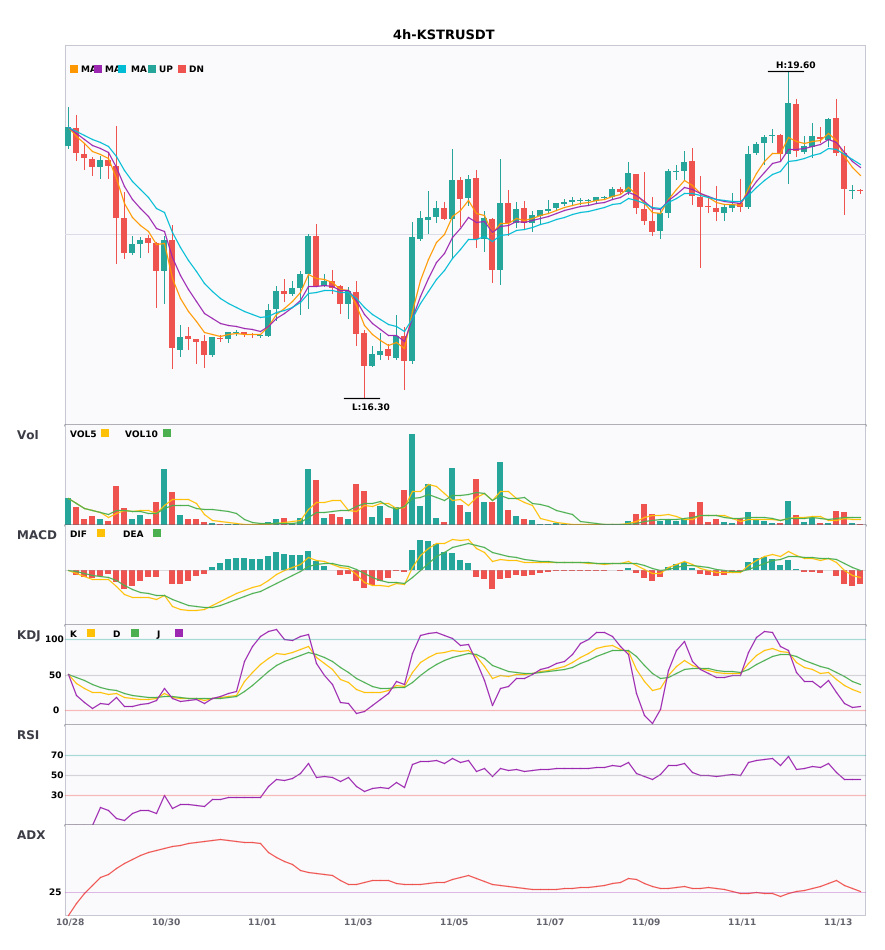
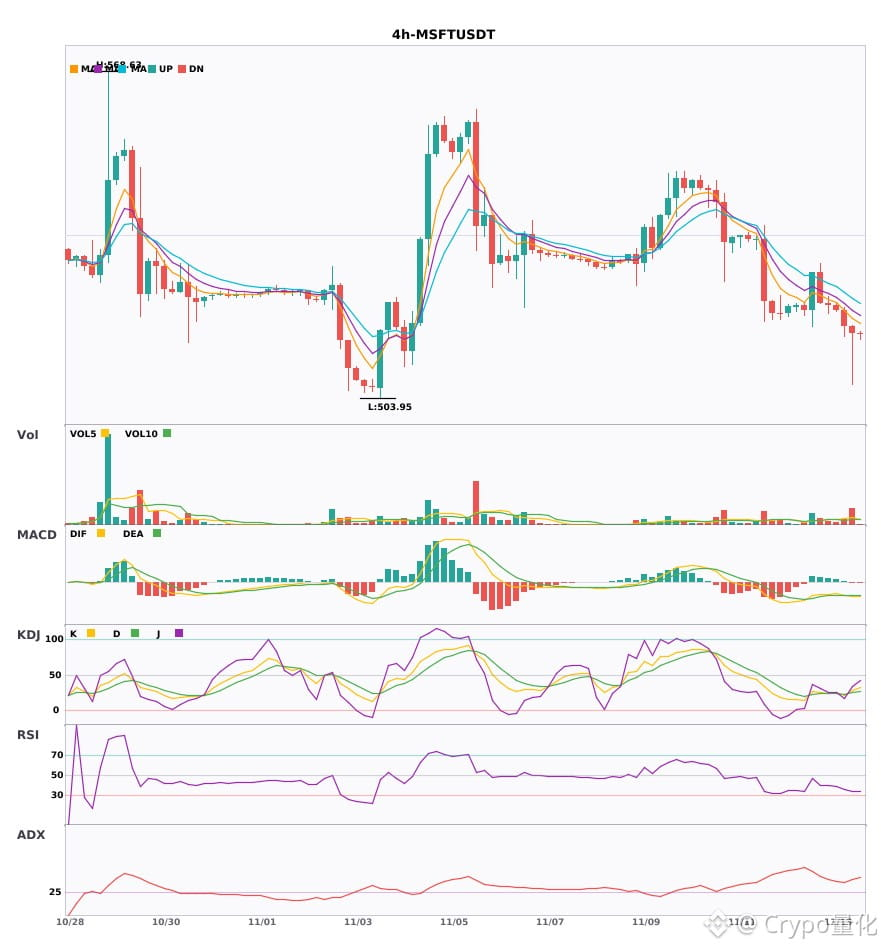
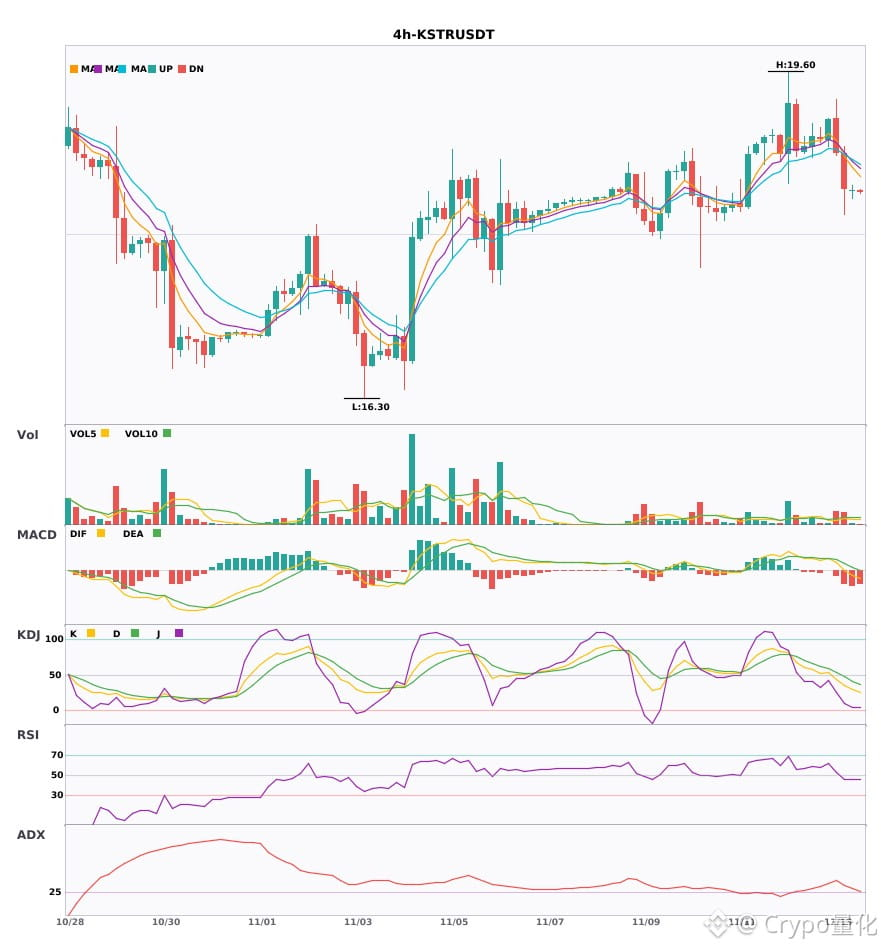
$MSFT and the $KSTR 4-hour cycle converge to turn bearish, confirming synchronized bearish signals
📉 $MSFT | 4-hour bearish signal
━━━━━━━━━━━━━━━━━━
Technical analysis: ADX (39) indicates a pronounced trend; MACD has formed a death cross below zero, with bearish momentum strengthening; EMA5<EMA8<EMA13 shows bearish alignment; KDJ golden cross (K=28.1, D=24.8), with a short-term bullish bias; volume increased approximately 2.9-fold.
Price change: -0.2600%
📉 $KSTR | 4-hour bearish signal
━━━━━━━━━━━━━━━━━━
Technical analysis: ADX 32 indicates a strong trend; MACD DIF has fallen below the zero line, turning bearish; EMAs are bearishly aligned; KDJ is weak at K29.1/D41.5; volume increased 1.7-fold.
Price change: -0.0500%
━━━━━━━━━━━━━━━━━━
#技术分析 #MSFT #KSTR
📌 The above is for reference only and does not constitute investment advice
$MSFT and the $KSTR 4-hour cycle converge to turn bearish, confirming synchronized bearish signals
📉 $MSFT | 4-hour bearish signal
━━━━━━━━━━━━━━━━━━
Technical analysis: ADX (39) indicates a pronounced trend; MACD has formed a death cross below zero, with bearish momentum strengthening; EMA5<EMA8<EMA13 shows bearish alignment; KDJ golden cross (K=28.1, D=24.8), with a short-term bullish bias; volume increased approximately 2.9-fold.
Price change: -0.2600%
📉 $KSTR | 4-hour bearish signal
━━━━━━━━━━━━━━━━━━
Technical analysis: ADX 32 indicates a strong trend; MACD DIF has fallen below the zero line, turning bearish; EMAs are bearishly aligned; KDJ is weak at K29.1/D41.5; volume increased 1.7-fold.
Price change: -0.0500%
━━━━━━━━━━━━━━━━━━
#技术分析 #MSFT #KSTR
📌 The above is for reference only and does not constitute investment advice
📉 $MSFT | 4-hour bearish signal
━━━━━━━━━━━━━━━━━━
Technical analysis: ADX (39) indicates a pronounced trend; MACD has formed a death cross below zero, with bearish momentum strengthening; EMA5<EMA8<EMA13 shows bearish alignment; KDJ golden cross (K=28.1, D=24.8), with a short-term bullish bias; volume increased approximately 2.9-fold.
Price change: -0.2600%
📉 $KSTR | 4-hour bearish signal
━━━━━━━━━━━━━━━━━━
Technical analysis: ADX 32 indicates a strong trend; MACD DIF has fallen below the zero line, turning bearish; EMAs are bearishly aligned; KDJ is weak at K29.1/D41.5; volume increased 1.7-fold.
Price change: -0.0500%
━━━━━━━━━━━━━━━━━━
#技术分析 #MSFT #KSTR
📌 The above is for reference only and does not constitute investment advice
3

·
--
$MSFT and $KSTR 4-hour trends are weakening in sync. Watch out for a pullback 🔥
════════════════════
🟢 $MSFT 4-hour bearish signal
⚠️ Technicals: ADX at 39 indicates a very strong trend. MACD has formed a bearish cross below zero, accelerating the downtrend. Moving averages are bearishly aligned and trending down. KDJ has formed a golden cross, with K crossing above D and not yet overbought, suggesting a short-term bullish outlook. Trading volume is up 2.9x.
════════════════════
🟢 $KSTR 4-hour bearish signal
⚠️ Technicals: ADX at 32 confirms a clear trending market. MACD's DIF has fallen below the zero line, turning bearish. EMA5, 8, and 13 are bearishly aligned and diverging downward. In KDJ, K has crossed below D and is not yet in the overbought zone, so bears have the upper hand. Trading volume is up 1.7x, reinforcing the downward momentum.
════════════════════
🔔 Follow for the latest market movements 🔔
#技术分析 #MSFT #KSTR
📌 When trading, pay attention to whether the candlestick pattern aligns
$MSFT and $KSTR 4-hour trends are weakening in sync. Watch out for a pullback 🔥
════════════════════
🟢 $MSFT 4-hour bearish signal
⚠️ Technicals: ADX at 39 indicates a very strong trend. MACD has formed a bearish cross below zero, accelerating the downtrend. Moving averages are bearishly aligned and trending down. KDJ has formed a golden cross, with K crossing above D and not yet overbought, suggesting a short-term bullish outlook. Trading volume is up 2.9x.
════════════════════
🟢 $KSTR 4-hour bearish signal
⚠️ Technicals: ADX at 32 confirms a clear trending market. MACD's DIF has fallen below the zero line, turning bearish. EMA5, 8, and 13 are bearishly aligned and diverging downward. In KDJ, K has crossed below D and is not yet in the overbought zone, so bears have the upper hand. Trading volume is up 1.7x, reinforcing the downward momentum.
════════════════════
🔔 Follow for the latest market movements 🔔
#技术分析 #MSFT #KSTR
📌 When trading, pay attention to whether the candlestick pattern aligns
════════════════════
🟢 $MSFT 4-hour bearish signal
⚠️ Technicals: ADX at 39 indicates a very strong trend. MACD has formed a bearish cross below zero, accelerating the downtrend. Moving averages are bearishly aligned and trending down. KDJ has formed a golden cross, with K crossing above D and not yet overbought, suggesting a short-term bullish outlook. Trading volume is up 2.9x.
════════════════════
🟢 $KSTR 4-hour bearish signal
⚠️ Technicals: ADX at 32 confirms a clear trending market. MACD's DIF has fallen below the zero line, turning bearish. EMA5, 8, and 13 are bearishly aligned and diverging downward. In KDJ, K has crossed below D and is not yet in the overbought zone, so bears have the upper hand. Trading volume is up 1.7x, reinforcing the downward momentum.
════════════════════
🔔 Follow for the latest market movements 🔔
#技术分析 #MSFT #KSTR
📌 When trading, pay attention to whether the candlestick pattern aligns
7

·
--
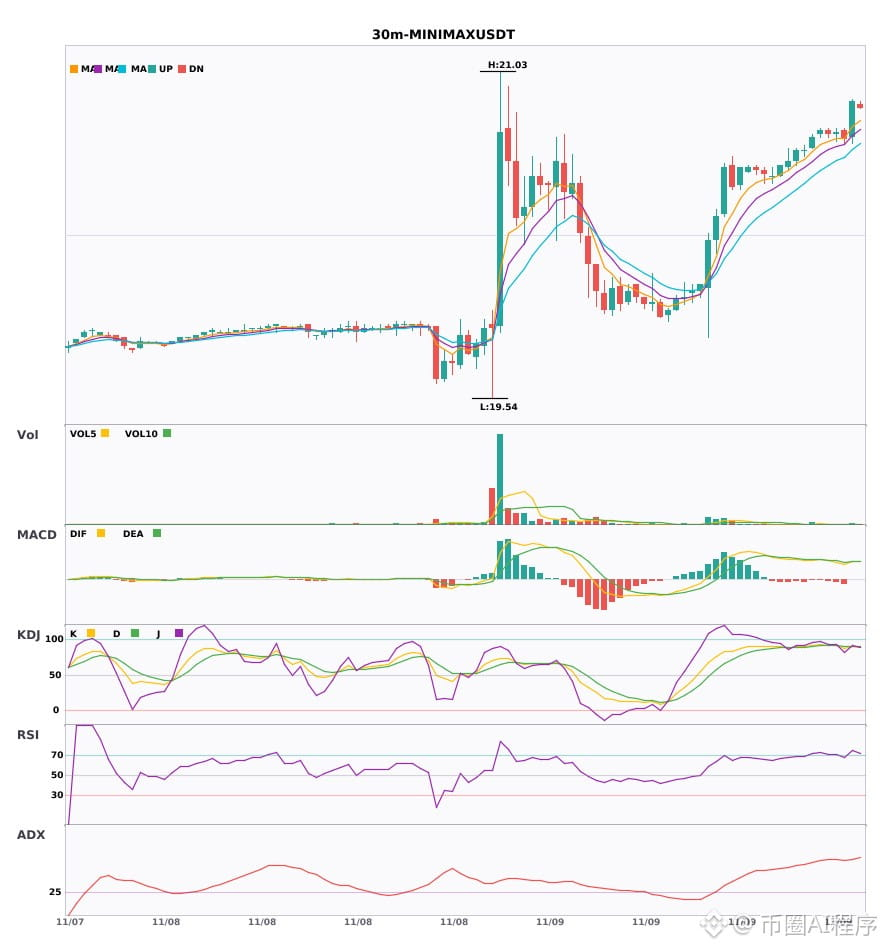
Multi-timeframe confluence: 2 assets bullish on the 30-minute chart + 4-hour bullish trend confirmation🔥
════════════════════
🔴 $MINIMAX 30-minute bullish signal
⚠️Technical analysis: 4-hour bullish confluence confirmed | 30-minute entry: MACD golden cross above zero, bullish momentum released | EMA5 > EMA8 > EMA13, bullish alignment | KDJ golden cross, short-term outlook bullish (K: 90.2, D: 89.9) | Volume increased (2.2x)
════════════════════
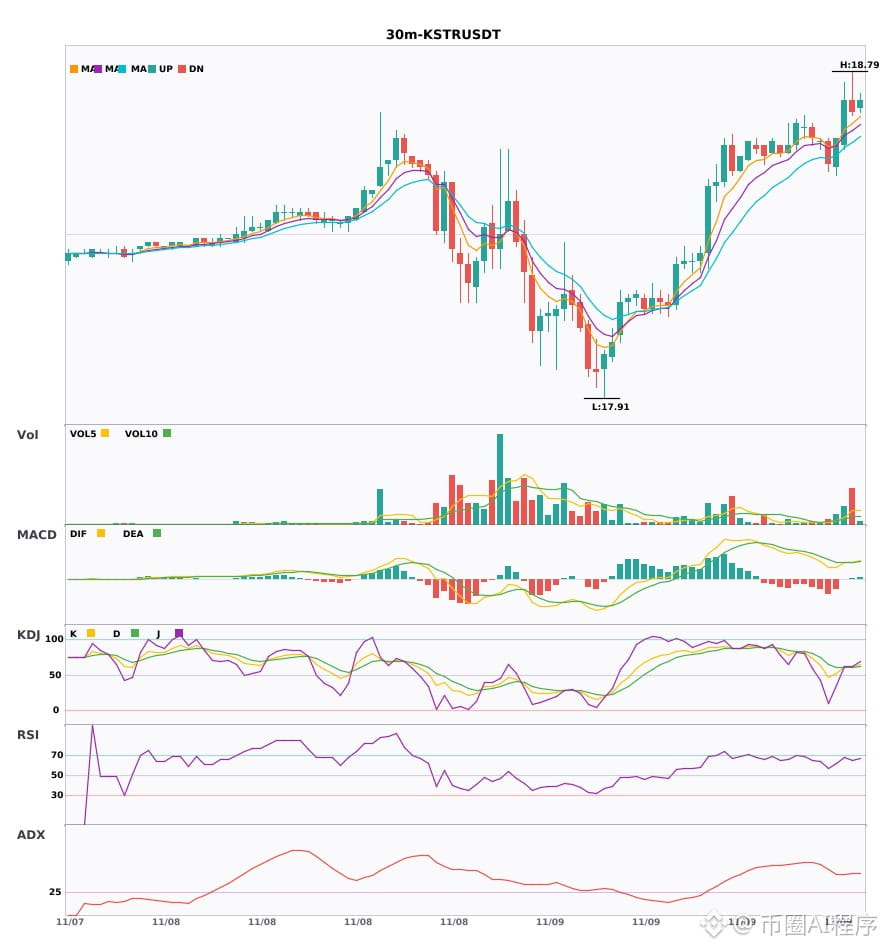
🔴 $KSTR 30-minute bullish signal
⚠️Technical analysis: 4-hour bullish confluence confirmed | 30-minute entry: MACD golden cross above zero, bullish momentum released | EMA5 > EMA8 > EMA13, bullish alignment | KDJ trading strongly, bulls in control (K: 61.2, D: 61.1) | Volume surged (4.3x)
════════════════════
🔔 Follow for first-hand market alerts 🔔
#多周期共振 #MINIMAX #KSTR
📌 When trading, pay attention to whether the candlestick patterns align
Multi-timeframe confluence: 2 assets bullish on the 30-minute chart + 4-hour bullish trend confirmation🔥
════════════════════
🔴 $MINIMAX 30-minute bullish signal
⚠️Technical analysis: 4-hour bullish confluence confirmed | 30-minute entry: MACD golden cross above zero, bullish momentum released | EMA5 > EMA8 > EMA13, bullish alignment | KDJ golden cross, short-term outlook bullish (K: 90.2, D: 89.9) | Volume increased (2.2x)
════════════════════
🔴 $KSTR 30-minute bullish signal
⚠️Technical analysis: 4-hour bullish confluence confirmed | 30-minute entry: MACD golden cross above zero, bullish momentum released | EMA5 > EMA8 > EMA13, bullish alignment | KDJ trading strongly, bulls in control (K: 61.2, D: 61.1) | Volume surged (4.3x)
════════════════════
🔔 Follow for first-hand market alerts 🔔
#多周期共振 #MINIMAX #KSTR
📌 When trading, pay attention to whether the candlestick patterns align
════════════════════
🔴 $MINIMAX 30-minute bullish signal
⚠️Technical analysis: 4-hour bullish confluence confirmed | 30-minute entry: MACD golden cross above zero, bullish momentum released | EMA5 > EMA8 > EMA13, bullish alignment | KDJ golden cross, short-term outlook bullish (K: 90.2, D: 89.9) | Volume increased (2.2x)
════════════════════
🔴 $KSTR 30-minute bullish signal
⚠️Technical analysis: 4-hour bullish confluence confirmed | 30-minute entry: MACD golden cross above zero, bullish momentum released | EMA5 > EMA8 > EMA13, bullish alignment | KDJ trading strongly, bulls in control (K: 61.2, D: 61.1) | Volume surged (4.3x)
════════════════════
🔔 Follow for first-hand market alerts 🔔
#多周期共振 #MINIMAX #KSTR
📌 When trading, pay attention to whether the candlestick patterns align
71
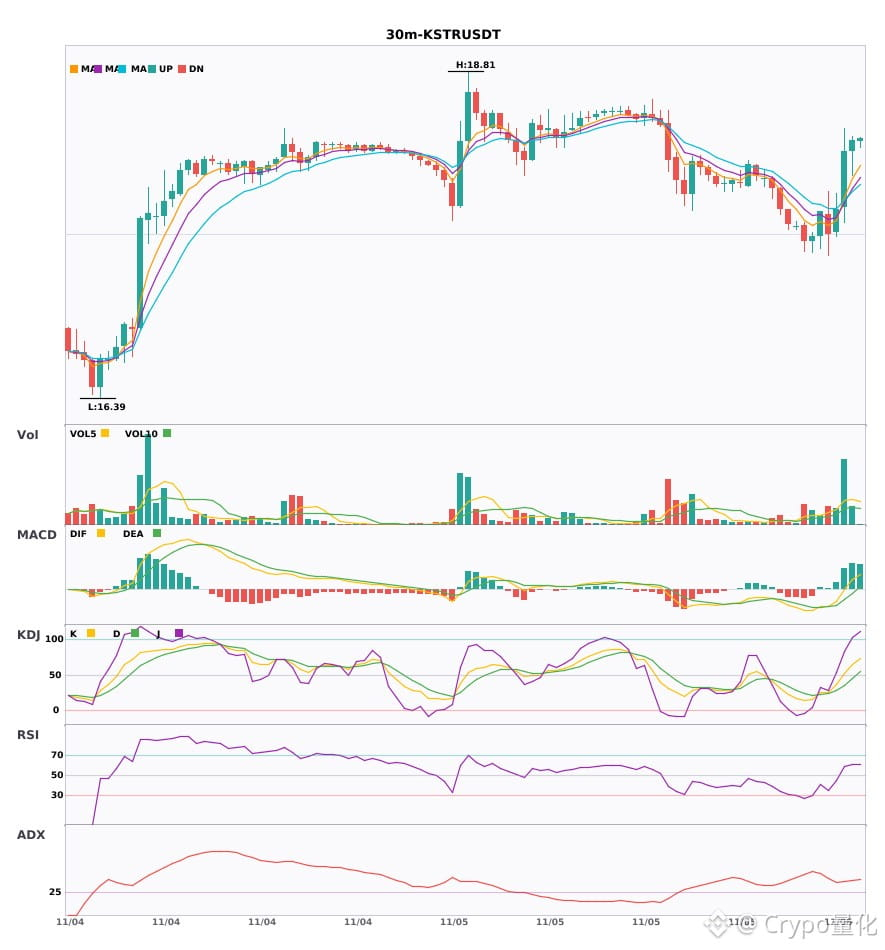
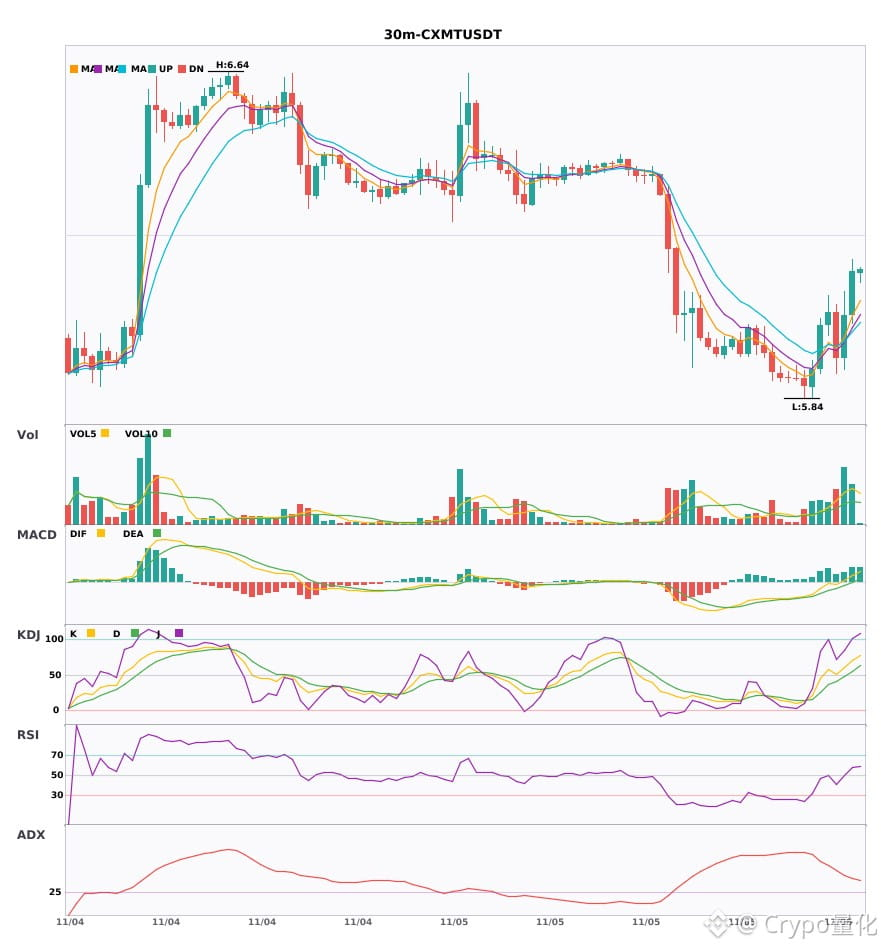
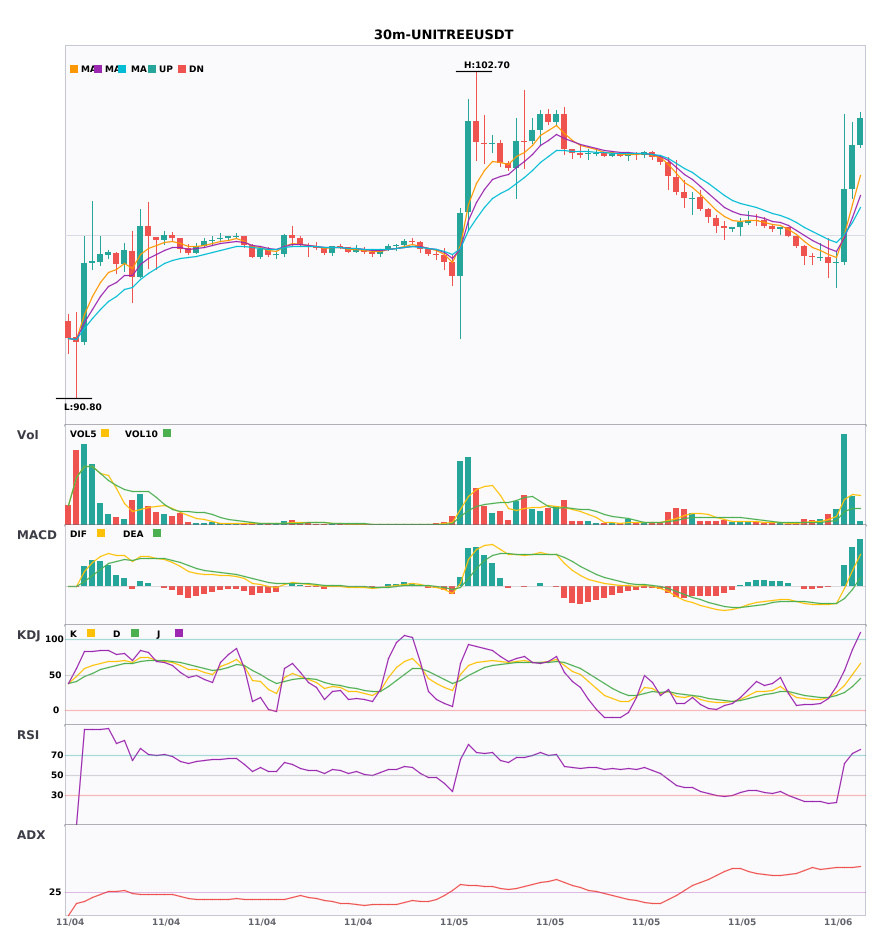
$KSTR / $CXMT / $UNITREE 30-minute technicals are strengthening in sync—which has the greatest breakout potential?
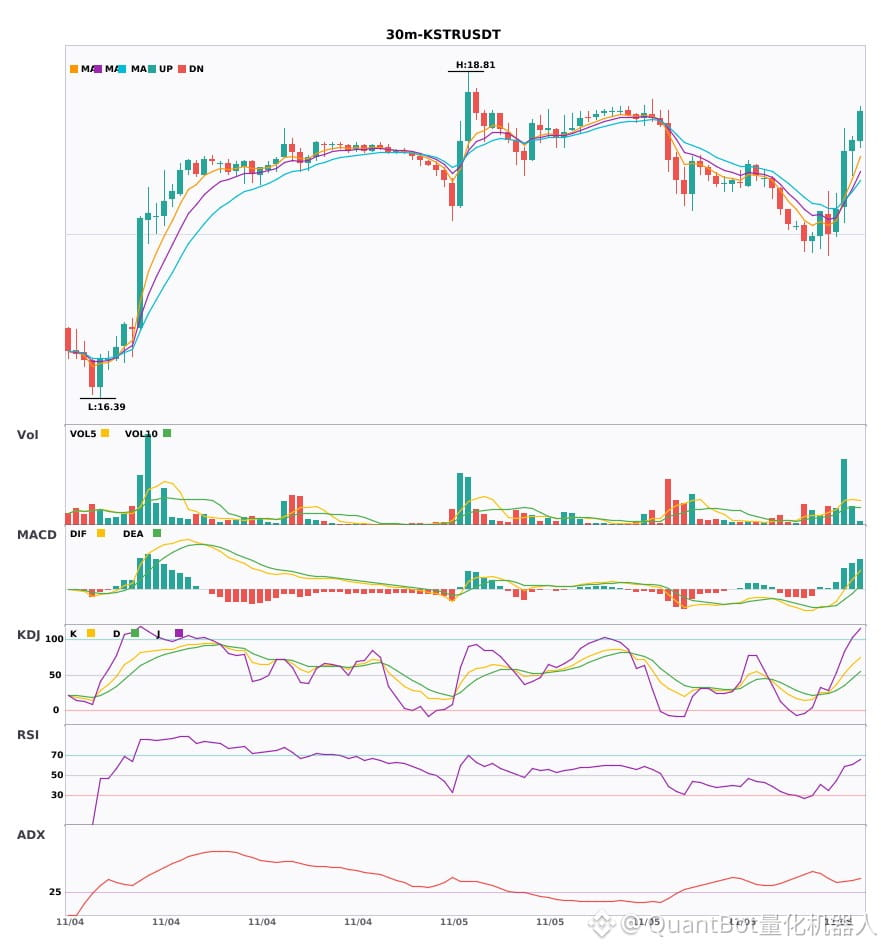
📈 $KSTR | 30-minute bullish signal
━━━━━━━━━━━━━━━━━━
Technical analysis: ADX (41): clear trending market | MACD is bullish; trend is strong and momentum is increasing | EMA5 > EMA8 > EMA13: bullish alignment | Volume surge (4.0x)
Price change: 0.4400%
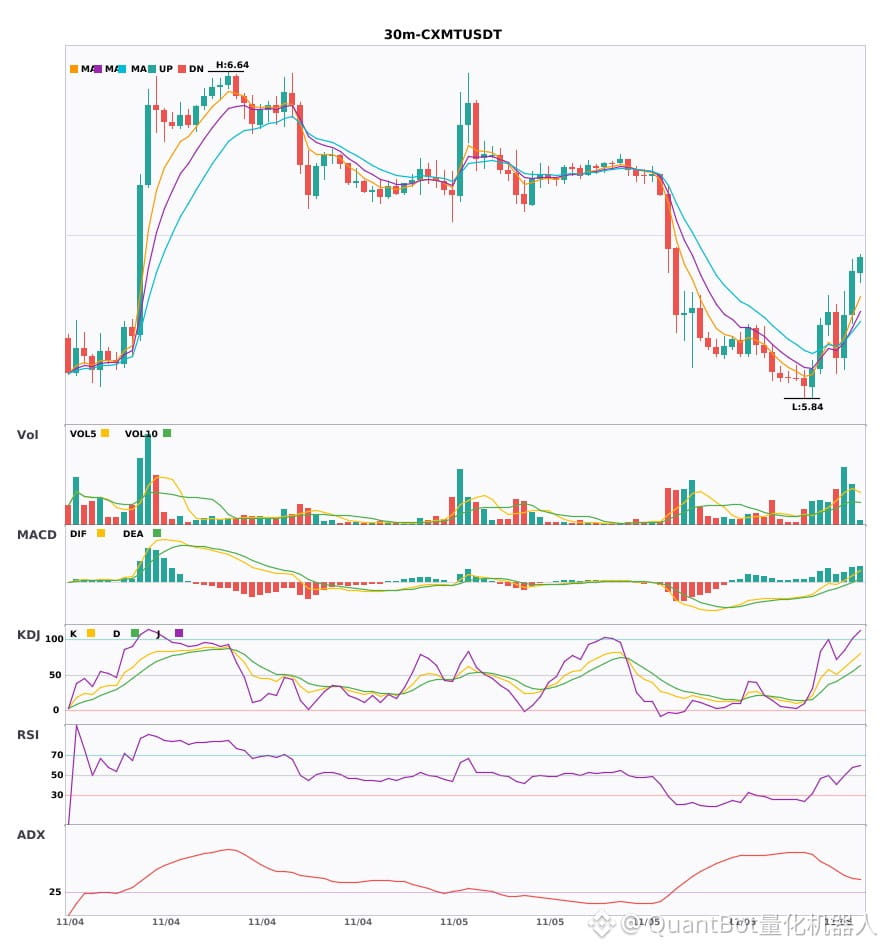
📈 $CXMT | 30-minute bullish signal
━━━━━━━━━━━━━━━━━━
Technical analysis: ADX (40): clear trending market | MACD is bullish; trend is strong and momentum is increasing | EMA5 > EMA8 > EMA13: bullish alignment | KDJ is strong, with bulls in control (K: 70.3, D: 55.1) | Volume surge (2.7x)
Price change: 1.7900%
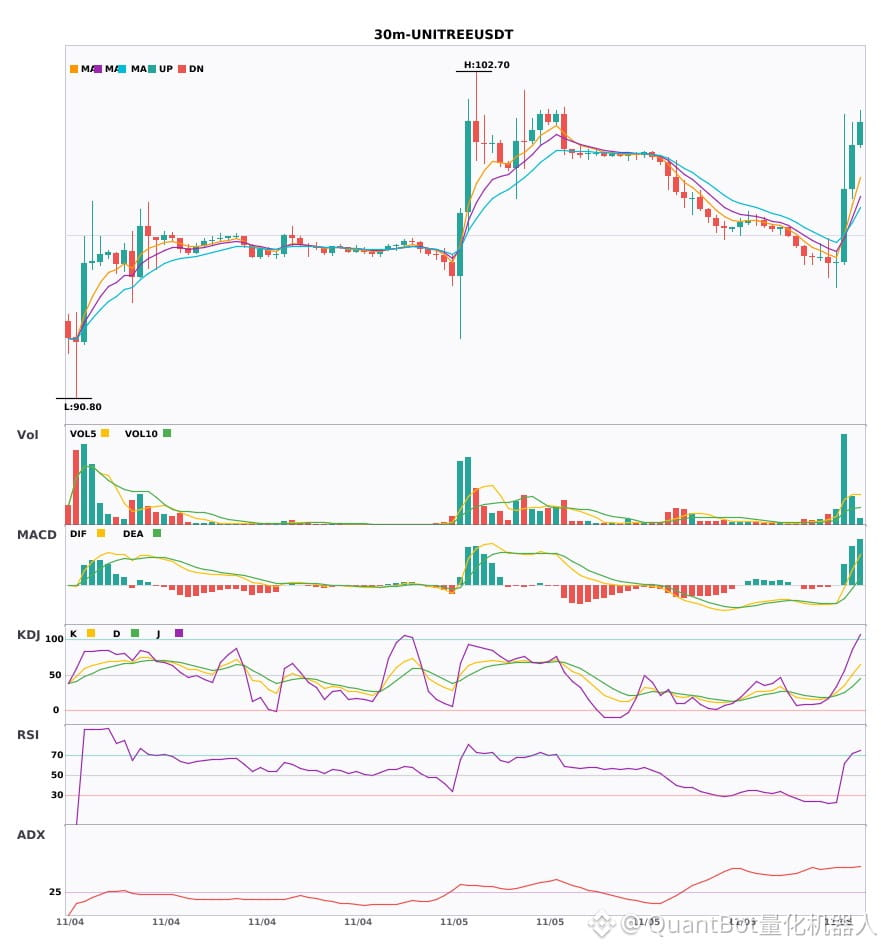
📈 $UNITREE | 30-minute bullish signal
━━━━━━━━━━━━━━━━━━
Technical analysis: ADX (55): very strong trend (beware of a pullback from overbought levels) | MACD DIF breaks above the zero line; trend turns bullish | EMA5 > EMA8 > EMA13: bullish alignment | Volume surge (6.5x)
Price change: 1.6300%
━━━━━━━━━━━━━━━━━━
#技术分析 #KSTR #CXMT #UNITREE
📌 The above is for reference only and does not constitute investment advice
$KSTR / $CXMT / $UNITREE 30-minute technicals are strengthening in sync—which has the greatest breakout potential?
📈 $KSTR | 30-minute bullish signal
━━━━━━━━━━━━━━━━━━
Technical analysis: ADX (41): clear trending market | MACD is bullish; trend is strong and momentum is increasing | EMA5 > EMA8 > EMA13: bullish alignment | Volume surge (4.0x)
Price change: 0.4400%
📈 $CXMT | 30-minute bullish signal
━━━━━━━━━━━━━━━━━━
Technical analysis: ADX (40): clear trending market | MACD is bullish; trend is strong and momentum is increasing | EMA5 > EMA8 > EMA13: bullish alignment | KDJ is strong, with bulls in control (K: 70.3, D: 55.1) | Volume surge (2.7x)
Price change: 1.7900%
📈 $UNITREE | 30-minute bullish signal
━━━━━━━━━━━━━━━━━━
Technical analysis: ADX (55): very strong trend (beware of a pullback from overbought levels) | MACD DIF breaks above the zero line; trend turns bullish | EMA5 > EMA8 > EMA13: bullish alignment | Volume surge (6.5x)
Price change: 1.6300%
━━━━━━━━━━━━━━━━━━
#技术分析 #KSTR #CXMT #UNITREE
📌 The above is for reference only and does not constitute investment advice
📈 $KSTR | 30-minute bullish signal
━━━━━━━━━━━━━━━━━━
Technical analysis: ADX (41): clear trending market | MACD is bullish; trend is strong and momentum is increasing | EMA5 > EMA8 > EMA13: bullish alignment | Volume surge (4.0x)
Price change: 0.4400%
📈 $CXMT | 30-minute bullish signal
━━━━━━━━━━━━━━━━━━
Technical analysis: ADX (40): clear trending market | MACD is bullish; trend is strong and momentum is increasing | EMA5 > EMA8 > EMA13: bullish alignment | KDJ is strong, with bulls in control (K: 70.3, D: 55.1) | Volume surge (2.7x)
Price change: 1.7900%
📈 $UNITREE | 30-minute bullish signal
━━━━━━━━━━━━━━━━━━
Technical analysis: ADX (55): very strong trend (beware of a pullback from overbought levels) | MACD DIF breaks above the zero line; trend turns bullish | EMA5 > EMA8 > EMA13: bullish alignment | Volume surge (6.5x)
Price change: 1.6300%
━━━━━━━━━━━━━━━━━━
#技术分析 #KSTR #CXMT #UNITREE
📌 The above is for reference only and does not constitute investment advice
43
·
--
$KSTR / $CXMT / $UNITREE 30-minute confluence turns bullish, with bullish signals appearing simultaneously 🔥
════════════════════
🔴 $KSTR 30-minute bullish signal
⚠️Technical analysis: ADX(41): clear trending market | MACD is bullish, the trend is strong, and momentum is strengthening | EMA5 > EMA8 > EMA13: bullish alignment | Volume surge (4.0x)
════════════════════
🔴 $CXMT 30-minute bullish signal
⚠️Technical analysis: ADX(40): clear trending market | MACD is bullish, the trend is strong, and momentum is strengthening | EMA5 > EMA8 > EMA13: bullish alignment | KDJ is strong, with bulls in control (K: 70.3, D: 55.1) | Volume surge (2.7x)
════════════════════
🔴 $UNITREE 30-minute bullish signal
⚠️Technical analysis: ADX(55): exceptionally strong trend (beware of an overheated pullback) | MACD DIF breaks above the zero line; trend turns bullish | EMA5 > EMA8 > EMA13: bullish alignment | Volume surge (6.5x)
════════════════════
🔔 Follow for first-hand market alerts 🔔
#技术分析 #KSTR #CXMT #UNITREE
📌 When trading, pay attention to whether the candlestick pattern meets the criteria
$KSTR / $CXMT / $UNITREE 30-minute confluence turns bullish, with bullish signals appearing simultaneously 🔥
════════════════════
🔴 $KSTR 30-minute bullish signal
⚠️Technical analysis: ADX(41): clear trending market | MACD is bullish, the trend is strong, and momentum is strengthening | EMA5 > EMA8 > EMA13: bullish alignment | Volume surge (4.0x)
════════════════════
🔴 $CXMT 30-minute bullish signal
⚠️Technical analysis: ADX(40): clear trending market | MACD is bullish, the trend is strong, and momentum is strengthening | EMA5 > EMA8 > EMA13: bullish alignment | KDJ is strong, with bulls in control (K: 70.3, D: 55.1) | Volume surge (2.7x)
════════════════════
🔴 $UNITREE 30-minute bullish signal
⚠️Technical analysis: ADX(55): exceptionally strong trend (beware of an overheated pullback) | MACD DIF breaks above the zero line; trend turns bullish | EMA5 > EMA8 > EMA13: bullish alignment | Volume surge (6.5x)
════════════════════
🔔 Follow for first-hand market alerts 🔔
#技术分析 #KSTR #CXMT #UNITREE
📌 When trading, pay attention to whether the candlestick pattern meets the criteria
════════════════════
🔴 $KSTR 30-minute bullish signal
⚠️Technical analysis: ADX(41): clear trending market | MACD is bullish, the trend is strong, and momentum is strengthening | EMA5 > EMA8 > EMA13: bullish alignment | Volume surge (4.0x)
════════════════════
🔴 $CXMT 30-minute bullish signal
⚠️Technical analysis: ADX(40): clear trending market | MACD is bullish, the trend is strong, and momentum is strengthening | EMA5 > EMA8 > EMA13: bullish alignment | KDJ is strong, with bulls in control (K: 70.3, D: 55.1) | Volume surge (2.7x)
════════════════════
🔴 $UNITREE 30-minute bullish signal
⚠️Technical analysis: ADX(55): exceptionally strong trend (beware of an overheated pullback) | MACD DIF breaks above the zero line; trend turns bullish | EMA5 > EMA8 > EMA13: bullish alignment | Volume surge (6.5x)
════════════════════
🔔 Follow for first-hand market alerts 🔔
#技术分析 #KSTR #CXMT #UNITREE
📌 When trading, pay attention to whether the candlestick pattern meets the criteria
18


·
--
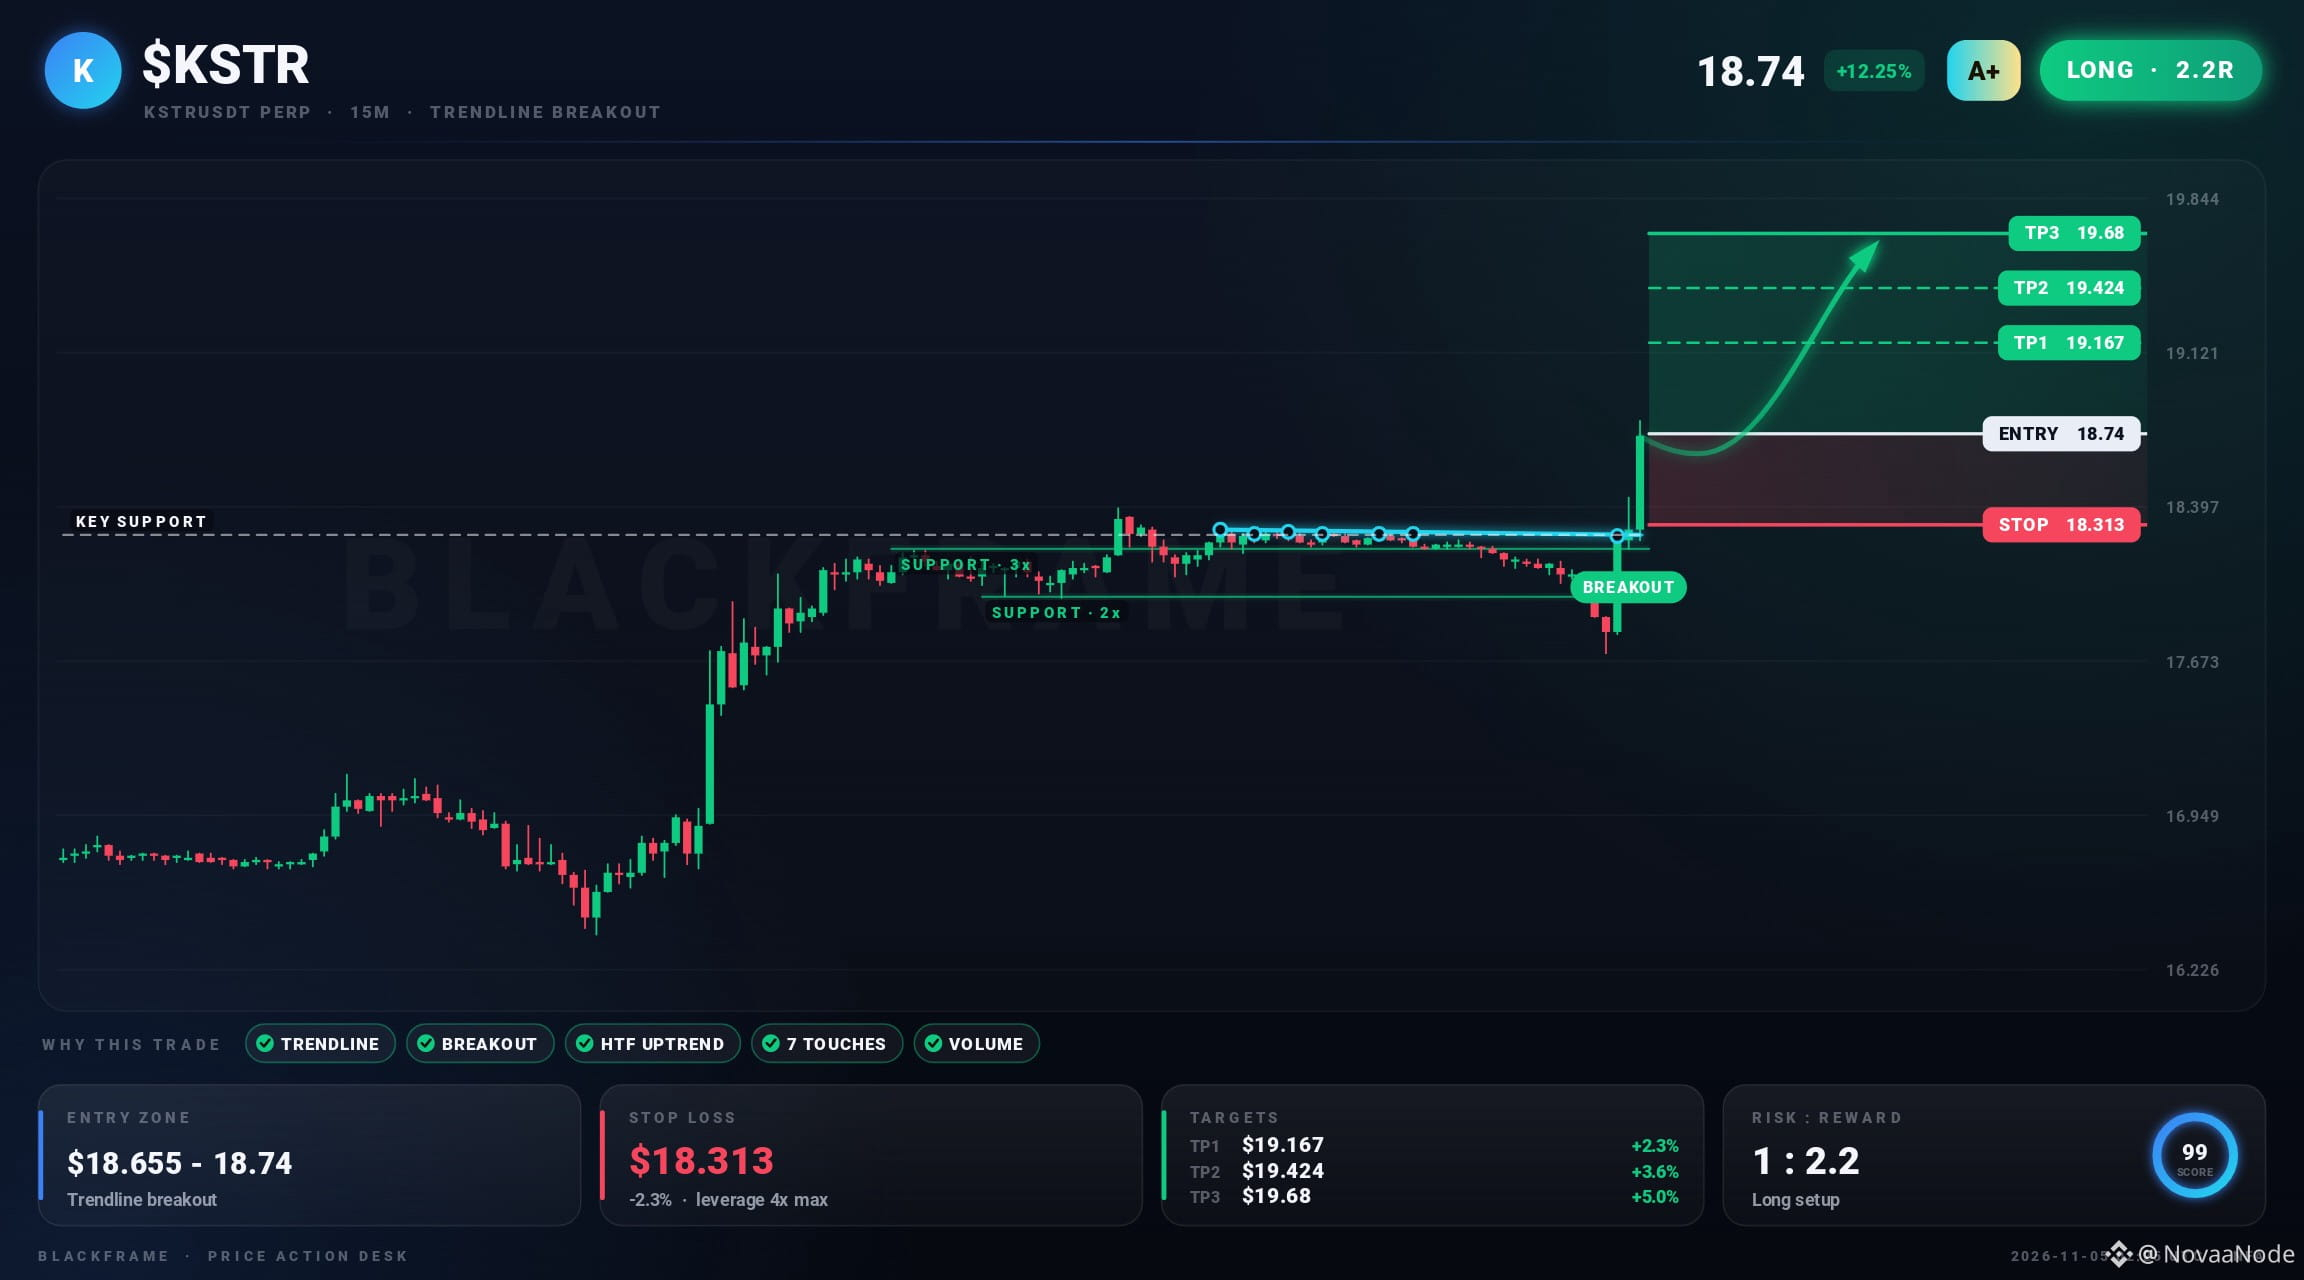
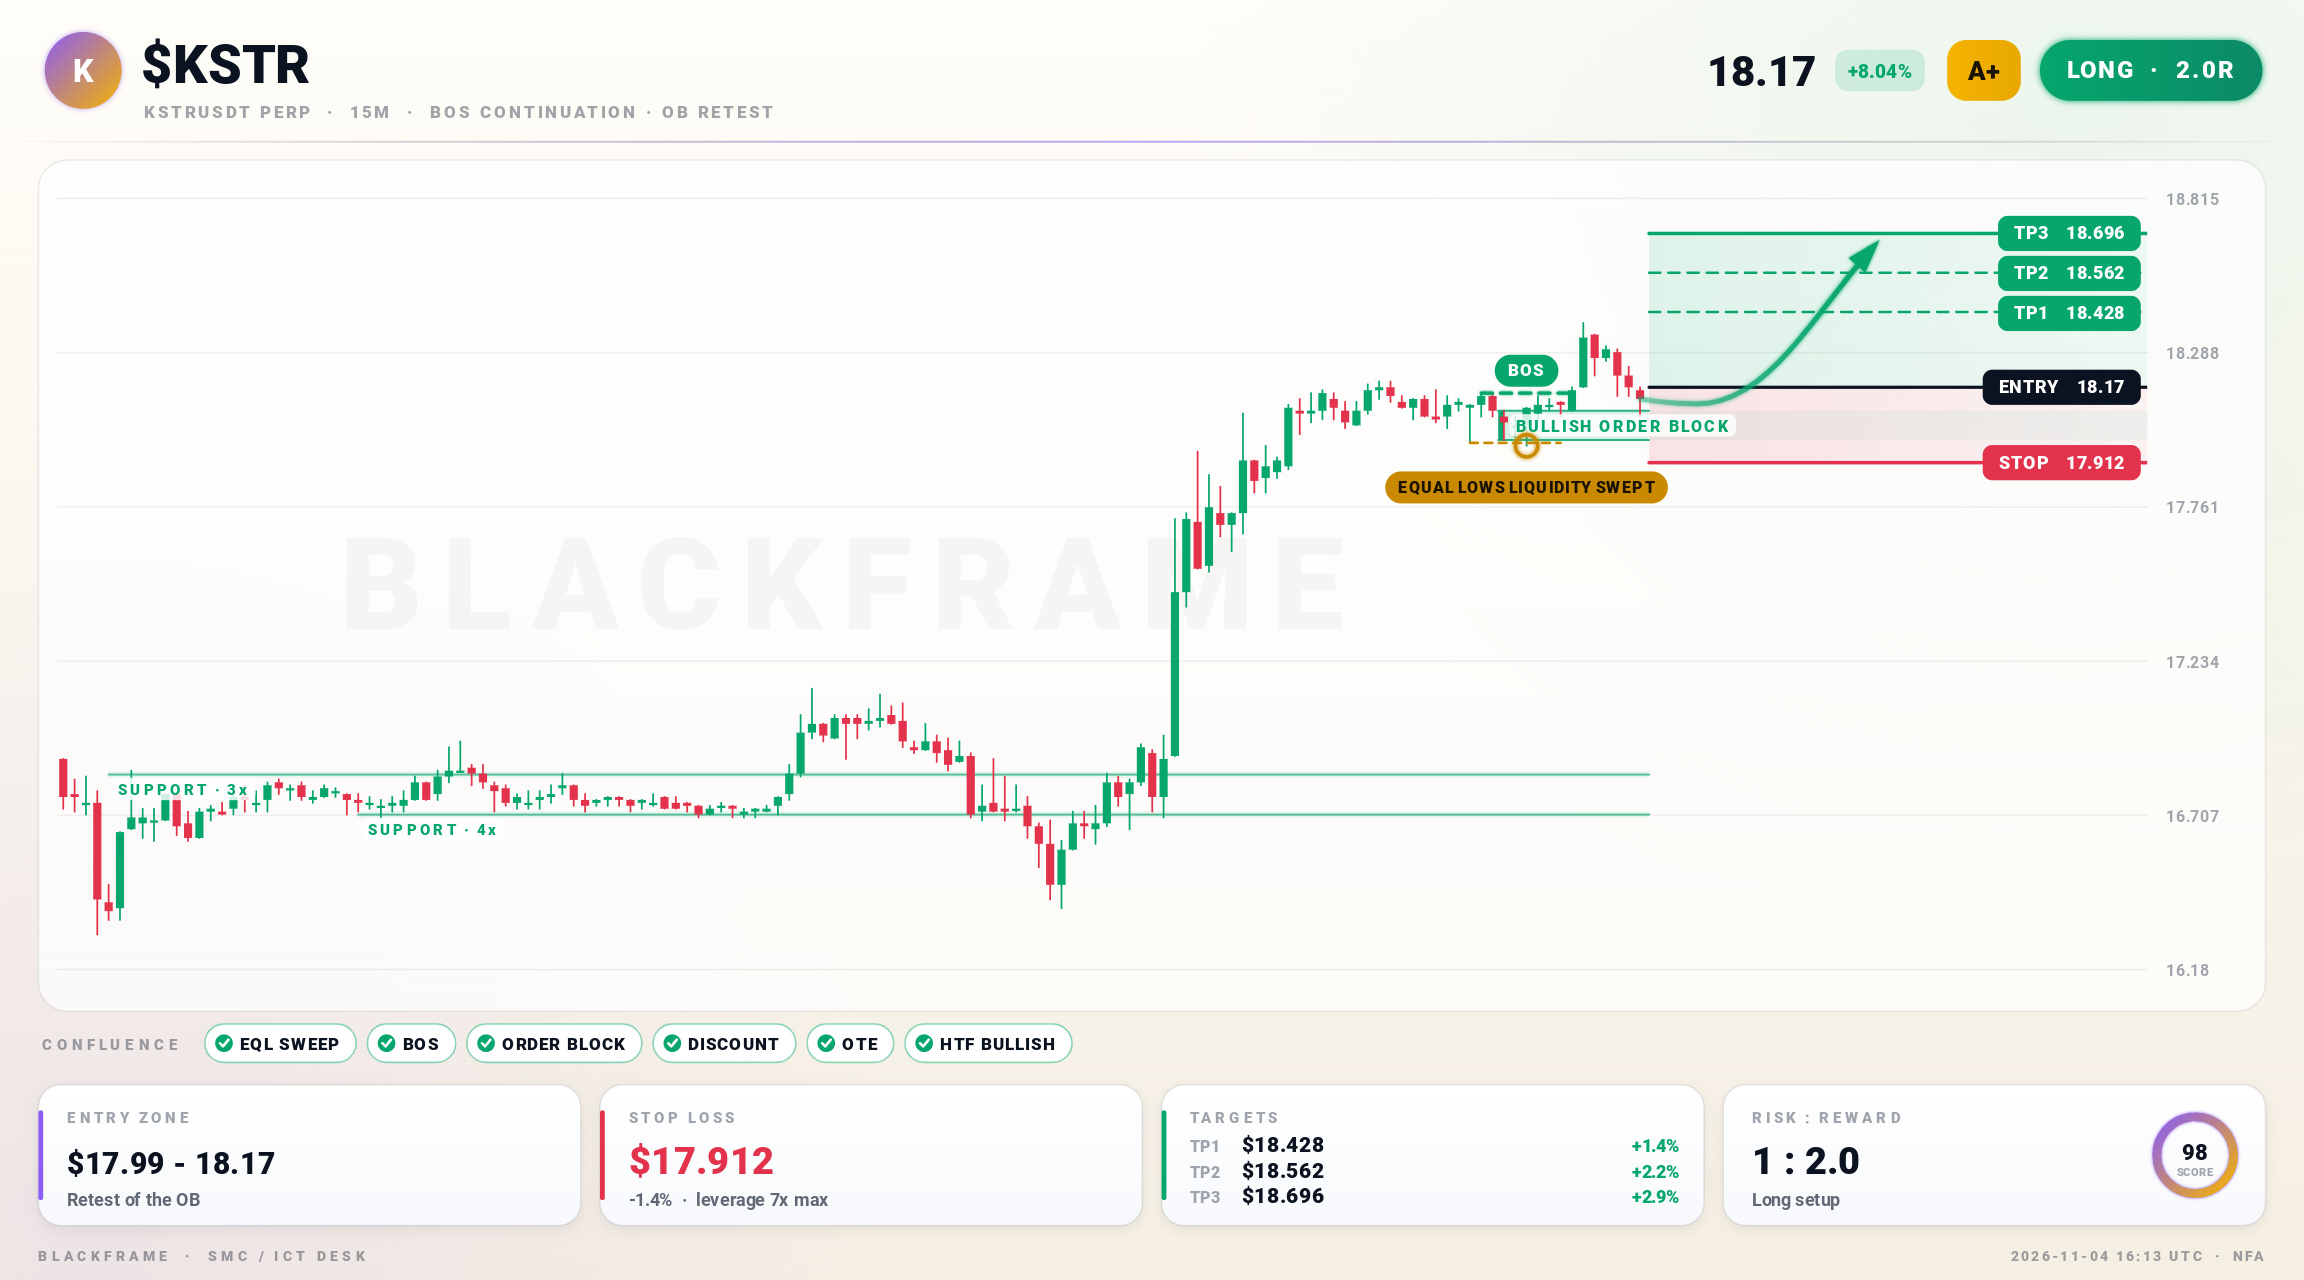
📈 $KSTR broke structure higher, continuation long
LONG · 15M
Entry: $18.09 - $18.17
TP1: $18.428
TP2: $18.562
TP3: $18.696
SL: $17.912
Sell-side liquidity below the equal lows was swept and price closed back inside. Structure continues higher with a fresh BOS on the 15M. Entry is the first retest of the fresh bullish order block in discount, targeting buy-side liquidity above.
#KSTR #PriceAction · NFA
📈 $KSTR broke structure higher, continuation long
LONG · 15M
Entry: $18.09 - $18.17
TP1: $18.428
TP2: $18.562
TP3: $18.696
SL: $17.912
Sell-side liquidity below the equal lows was swept and price closed back inside. Structure continues higher with a fresh BOS on the 15M. Entry is the first retest of the fresh bullish order block in discount, targeting buy-side liquidity above.
#KSTR #PriceAction · NFA
LONG · 15M
Entry: $18.09 - $18.17
TP1: $18.428
TP2: $18.562
TP3: $18.696
SL: $17.912
Sell-side liquidity below the equal lows was swept and price closed back inside. Structure continues higher with a fresh BOS on the 15M. Entry is the first retest of the fresh bullish order block in discount, targeting buy-side liquidity above.
#KSTR #PriceAction · NFA
336
·
--
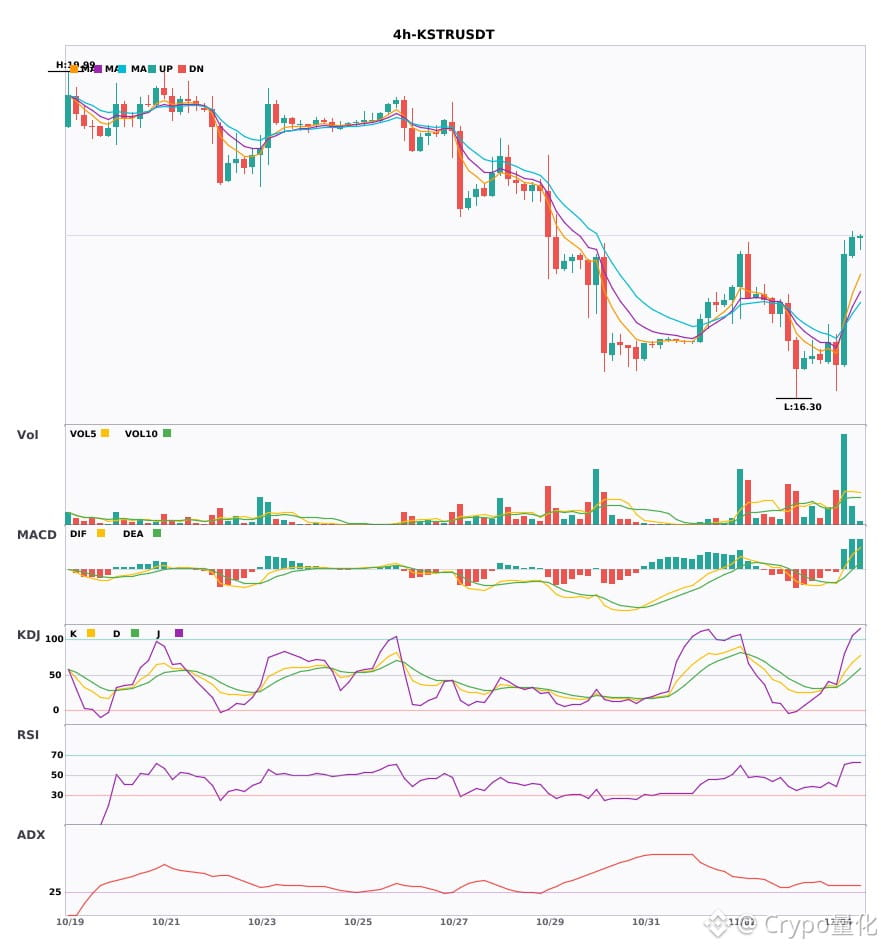
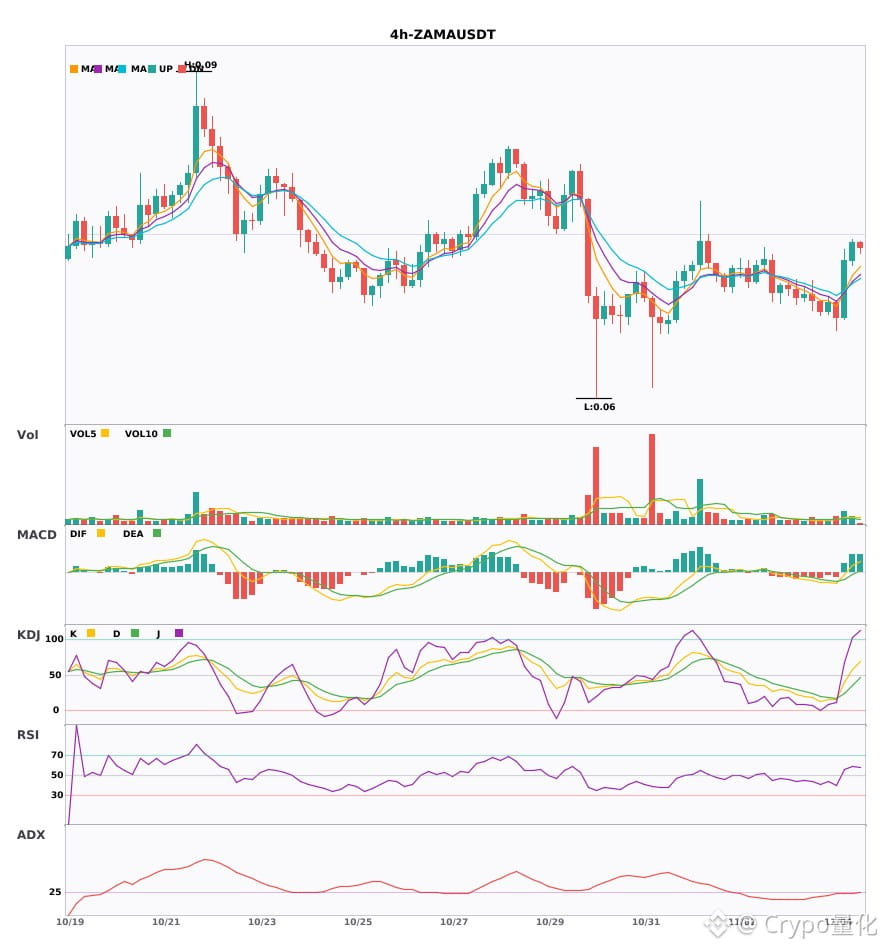
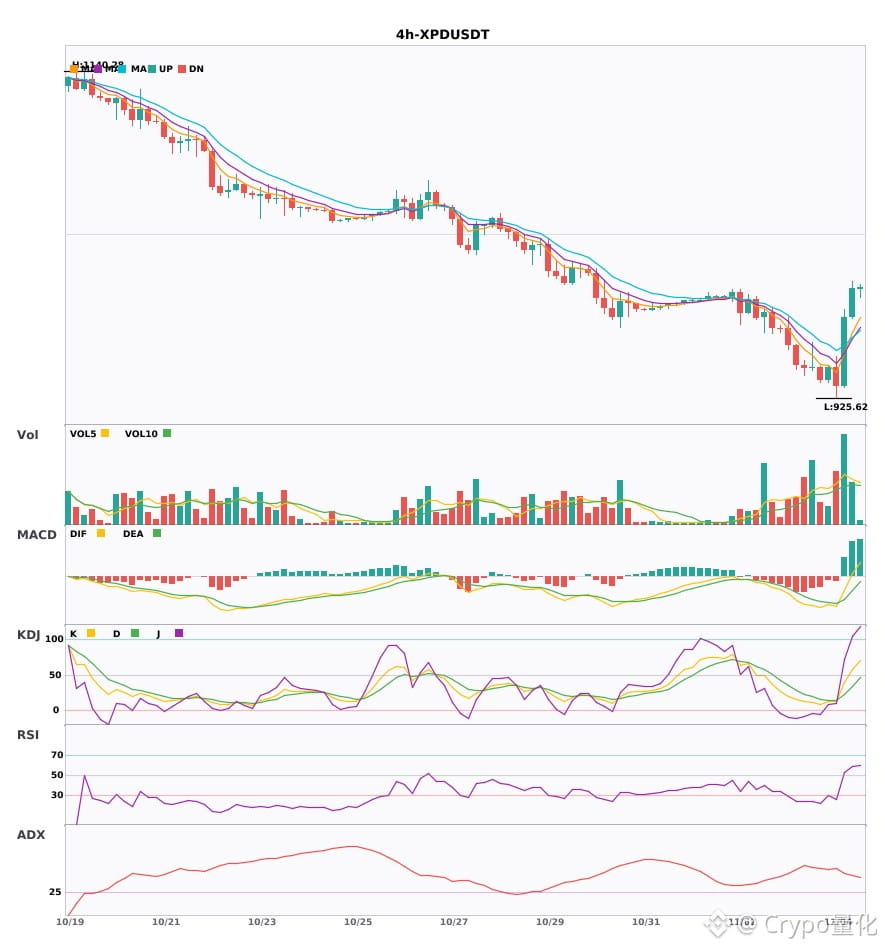
$KSTR / $ZAMA / $XPD 4-hour confluence turns bullish; bullish signals appear simultaneously🔥
════════════════════
🔴 $KSTR 4-hour bullish signal
⚠️Technical analysis: ADX(34) indicates a clear trending market | MACD golden cross above zero, bullish momentum released | EMA5 crosses above EMA8, short-term outlook turns bullish | Volume surge (3.5x)
════════════════════
🔴 $ZAMA 4-hour bullish signal
⚠️Technical analysis: ADX(28) trend is forming, potential entry | MACD DIF breaks above the zero line, trend turns bullish | EMA5 > EMA8 > EMA13, bullish alignment | Volume increases (2.1x)
════════════════════
🔴 $XPD 4-hour bullish signal
⚠️Technical analysis: ADX(45) indicates a clear trending market | MACD DIF breaks above the zero line, trend turns bullish | EMA5 crosses above EMA8, short-term outlook turns bullish | Volume increases (2.4x)
════════════════════
🔔 Follow for the latest market movements 🔔
#技术分析 #KSTR #ZAMA #XPD
📌 When trading, pay attention to whether the candlestick pattern confirms the signal
$KSTR / $ZAMA / $XPD 4-hour confluence turns bullish; bullish signals appear simultaneously🔥
════════════════════
🔴 $KSTR 4-hour bullish signal
⚠️Technical analysis: ADX(34) indicates a clear trending market | MACD golden cross above zero, bullish momentum released | EMA5 crosses above EMA8, short-term outlook turns bullish | Volume surge (3.5x)
════════════════════
🔴 $ZAMA 4-hour bullish signal
⚠️Technical analysis: ADX(28) trend is forming, potential entry | MACD DIF breaks above the zero line, trend turns bullish | EMA5 > EMA8 > EMA13, bullish alignment | Volume increases (2.1x)
════════════════════
🔴 $XPD 4-hour bullish signal
⚠️Technical analysis: ADX(45) indicates a clear trending market | MACD DIF breaks above the zero line, trend turns bullish | EMA5 crosses above EMA8, short-term outlook turns bullish | Volume increases (2.4x)
════════════════════
🔔 Follow for the latest market movements 🔔
#技术分析 #KSTR #ZAMA #XPD
📌 When trading, pay attention to whether the candlestick pattern confirms the signal
════════════════════
🔴 $KSTR 4-hour bullish signal
⚠️Technical analysis: ADX(34) indicates a clear trending market | MACD golden cross above zero, bullish momentum released | EMA5 crosses above EMA8, short-term outlook turns bullish | Volume surge (3.5x)
════════════════════
🔴 $ZAMA 4-hour bullish signal
⚠️Technical analysis: ADX(28) trend is forming, potential entry | MACD DIF breaks above the zero line, trend turns bullish | EMA5 > EMA8 > EMA13, bullish alignment | Volume increases (2.1x)
════════════════════
🔴 $XPD 4-hour bullish signal
⚠️Technical analysis: ADX(45) indicates a clear trending market | MACD DIF breaks above the zero line, trend turns bullish | EMA5 crosses above EMA8, short-term outlook turns bullish | Volume increases (2.4x)
════════════════════
🔔 Follow for the latest market movements 🔔
#技术分析 #KSTR #ZAMA #XPD
📌 When trading, pay attention to whether the candlestick pattern confirms the signal
22
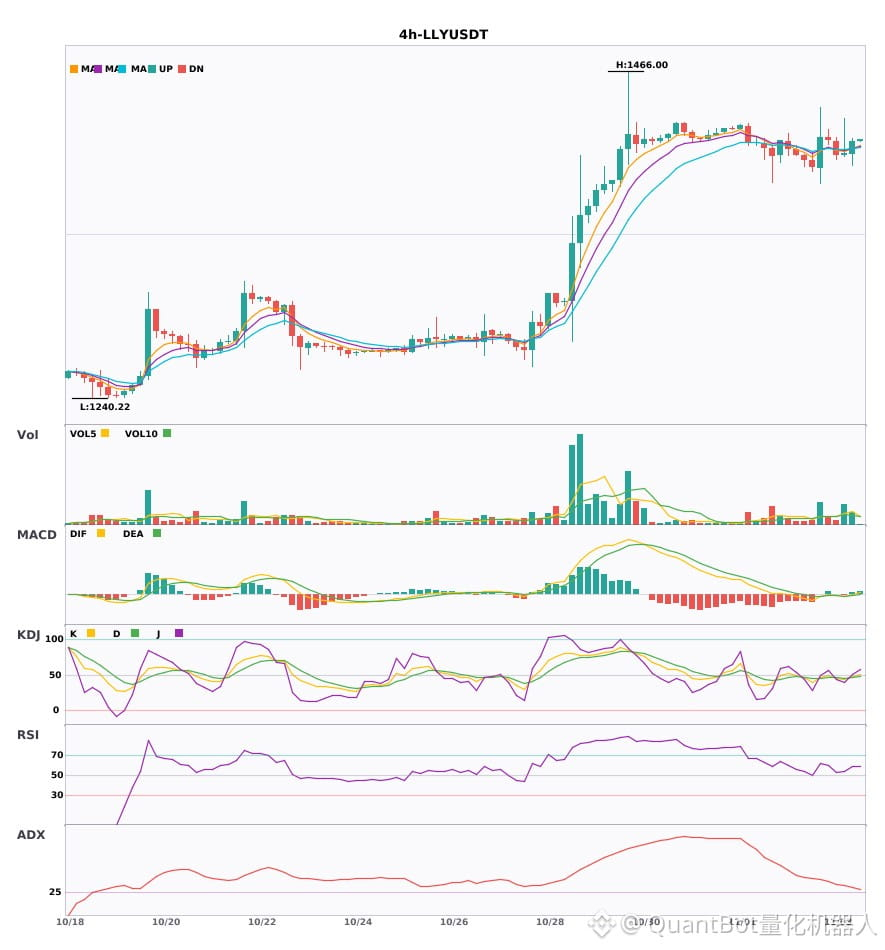
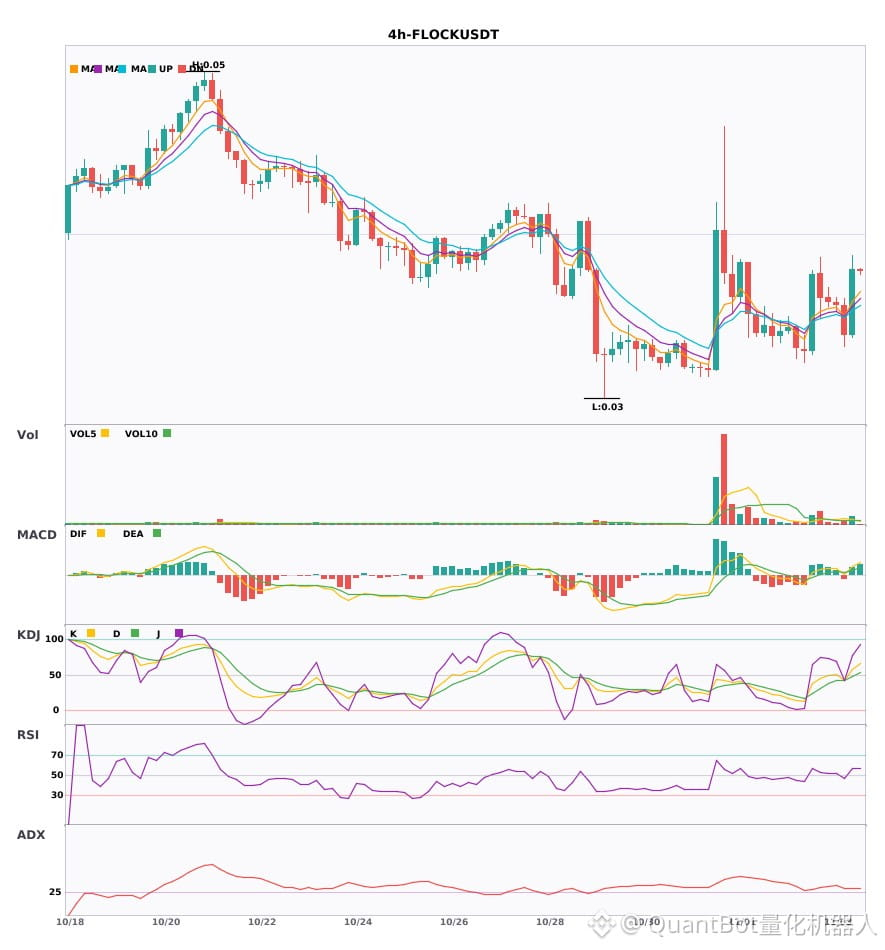
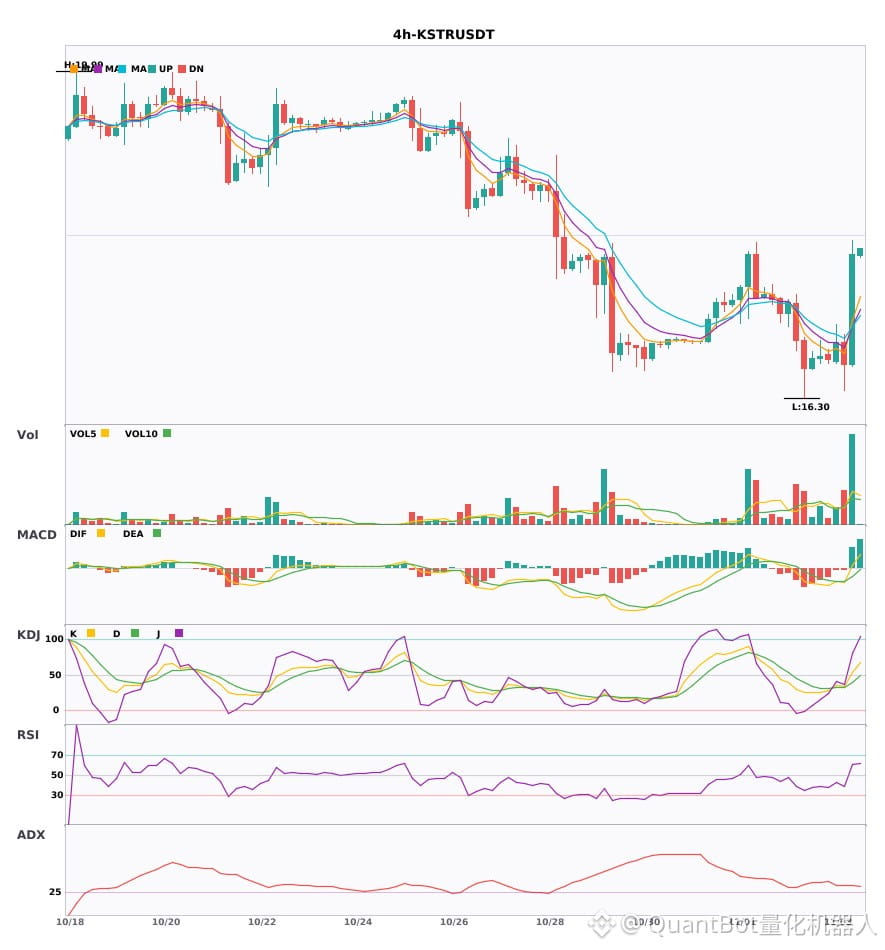
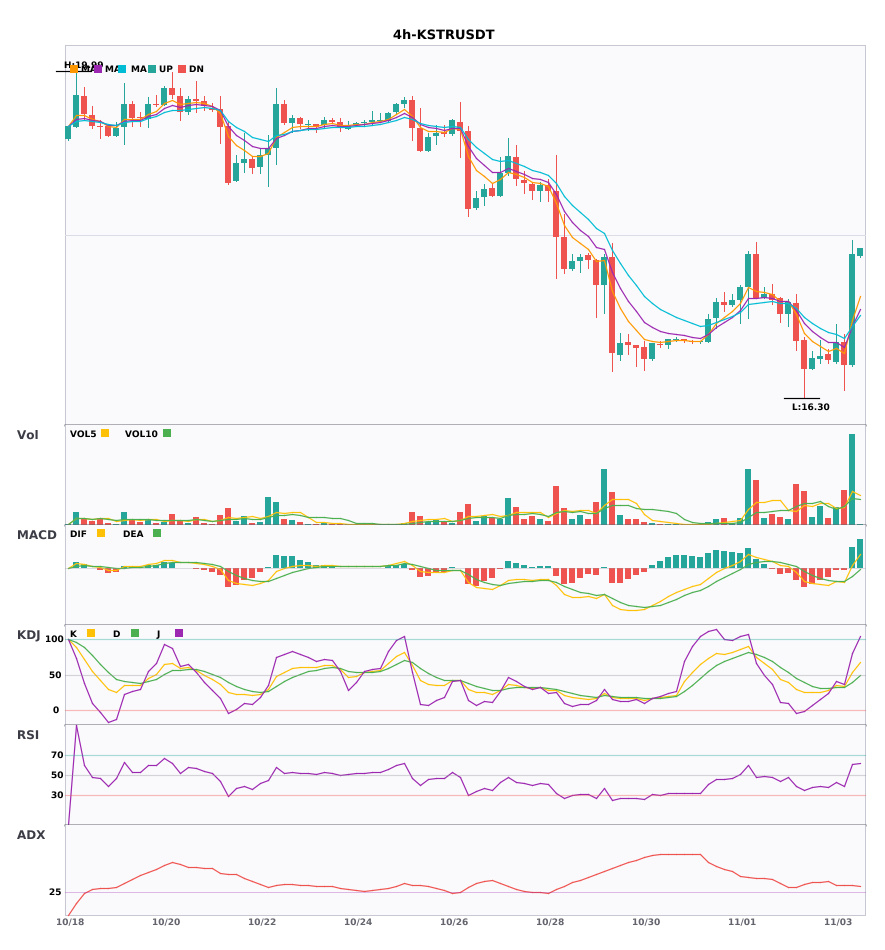
$LLY / $FLOCK / $KSTR 4-hour technicals are strengthening simultaneously—which has greater breakout potential?
📈 $LLY | 4-hour bullish signal
━━━━━━━━━━━━━━━━━━
Technical analysis: ADX(30) Trend is forming; potential entry | MACD bullish crossover above zero, bullish momentum emerging | EMA5 crosses above EMA8, short-term outlook turns bullish | KDJ bullish crossover, bullish short-term outlook (K is 47.3, D is 45.9) | Volume increases (2.0x)
Price change: 0.6000%
📈 $FLOCK | 4-hour bullish signal
━━━━━━━━━━━━━━━━━━
Technical analysis: ADX(28) Trend is forming; potential entry | MACD bullish crossover above zero, bullish momentum emerging | EMA5 crosses above EMA8, short-term outlook turns bullish | Volume increases (1.8x)
Price change: 7.7700%
📈 $KSTR | 4-hour bullish signal
━━━━━━━━━━━━━━━━━━
Technical analysis: ADX(34) Clear trending market | MACD bullish crossover above zero, bullish momentum emerging | EMA5 crosses above EMA8, short-term outlook turns bullish | Volume surges (3.5x)
Price change: 7.4300%
━━━━━━━━━━━━━━━━━━
#技术分析 #LLY #FLOCK #KSTR
📌 The above content is for reference only and does not constitute investment advice
$LLY / $FLOCK / $KSTR 4-hour technicals are strengthening simultaneously—which has greater breakout potential?
📈 $LLY | 4-hour bullish signal
━━━━━━━━━━━━━━━━━━
Technical analysis: ADX(30) Trend is forming; potential entry | MACD bullish crossover above zero, bullish momentum emerging | EMA5 crosses above EMA8, short-term outlook turns bullish | KDJ bullish crossover, bullish short-term outlook (K is 47.3, D is 45.9) | Volume increases (2.0x)
Price change: 0.6000%
📈 $FLOCK | 4-hour bullish signal
━━━━━━━━━━━━━━━━━━
Technical analysis: ADX(28) Trend is forming; potential entry | MACD bullish crossover above zero, bullish momentum emerging | EMA5 crosses above EMA8, short-term outlook turns bullish | Volume increases (1.8x)
Price change: 7.7700%
📈 $KSTR | 4-hour bullish signal
━━━━━━━━━━━━━━━━━━
Technical analysis: ADX(34) Clear trending market | MACD bullish crossover above zero, bullish momentum emerging | EMA5 crosses above EMA8, short-term outlook turns bullish | Volume surges (3.5x)
Price change: 7.4300%
━━━━━━━━━━━━━━━━━━
#技术分析 #LLY #FLOCK #KSTR
📌 The above content is for reference only and does not constitute investment advice
📈 $LLY | 4-hour bullish signal
━━━━━━━━━━━━━━━━━━
Technical analysis: ADX(30) Trend is forming; potential entry | MACD bullish crossover above zero, bullish momentum emerging | EMA5 crosses above EMA8, short-term outlook turns bullish | KDJ bullish crossover, bullish short-term outlook (K is 47.3, D is 45.9) | Volume increases (2.0x)
Price change: 0.6000%
📈 $FLOCK | 4-hour bullish signal
━━━━━━━━━━━━━━━━━━
Technical analysis: ADX(28) Trend is forming; potential entry | MACD bullish crossover above zero, bullish momentum emerging | EMA5 crosses above EMA8, short-term outlook turns bullish | Volume increases (1.8x)
Price change: 7.7700%
📈 $KSTR | 4-hour bullish signal
━━━━━━━━━━━━━━━━━━
Technical analysis: ADX(34) Clear trending market | MACD bullish crossover above zero, bullish momentum emerging | EMA5 crosses above EMA8, short-term outlook turns bullish | Volume surges (3.5x)
Price change: 7.4300%
━━━━━━━━━━━━━━━━━━
#技术分析 #LLY #FLOCK #KSTR
📌 The above content is for reference only and does not constitute investment advice
12
·
--
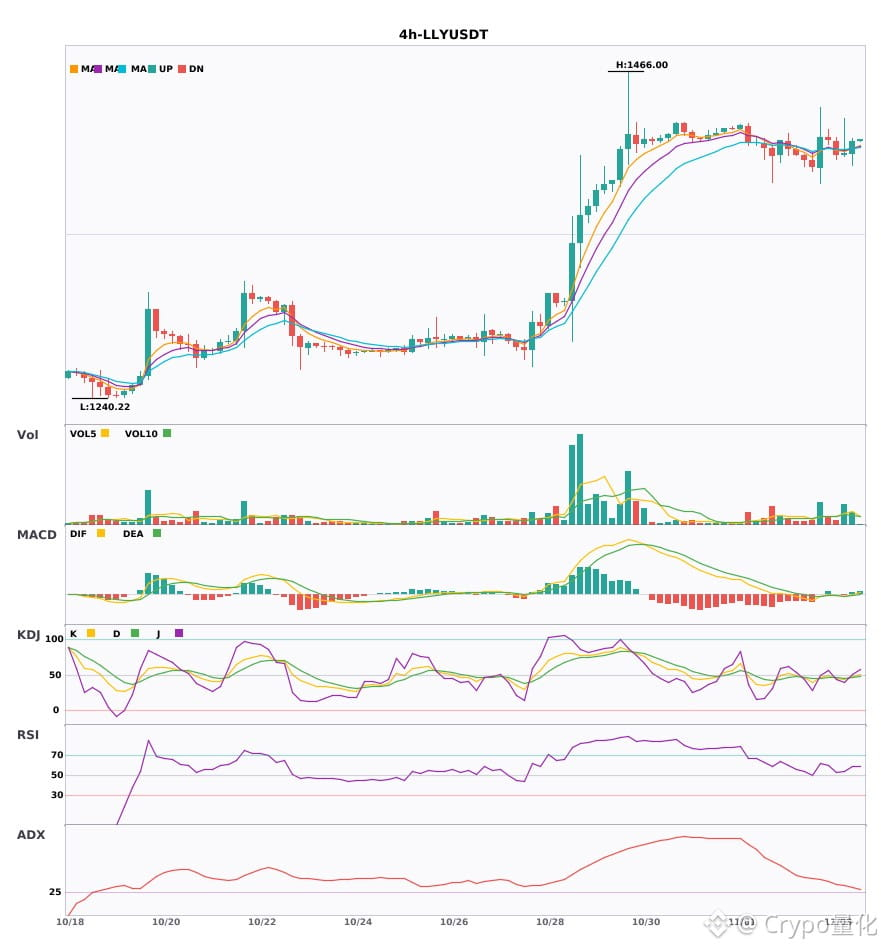
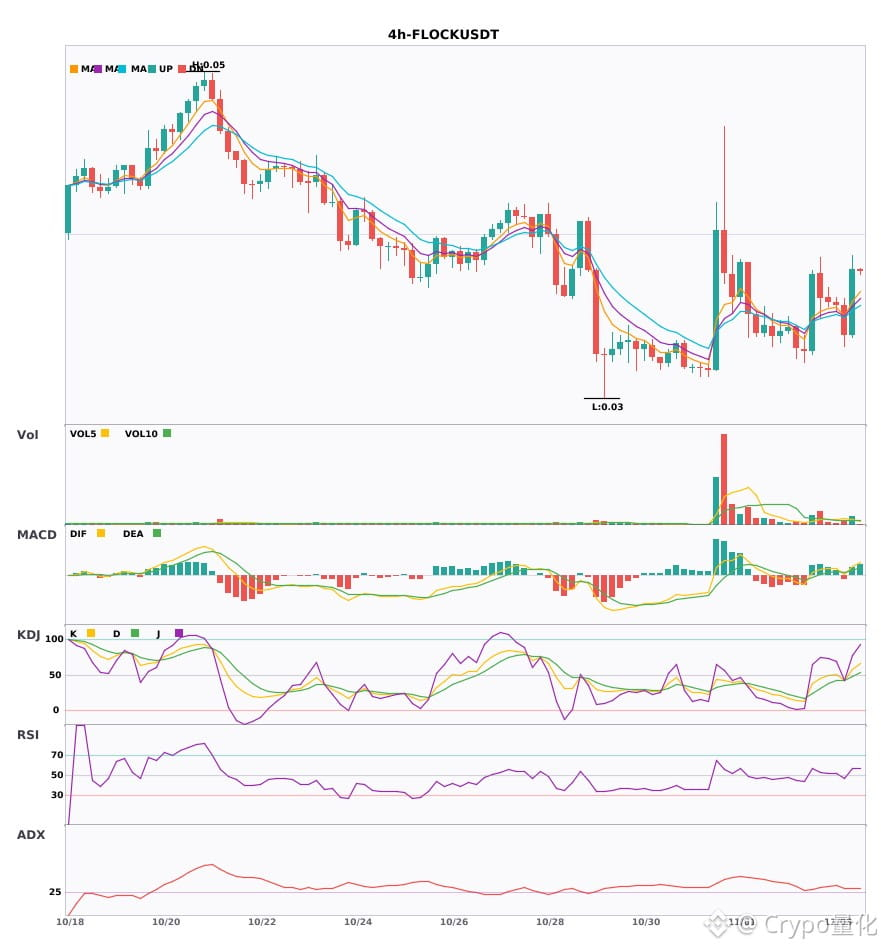
Three 4-hour bullish signals appearing simultaneously: $LLY / $FLOCK / $KSTR🔥
════════════════════
🔴 $LLY 4-hour bullish signal
⚠️Technical analysis: ADX(30): Trend is forming; entry possible | MACD bullish crossover above zero, bullish momentum is building | EMA5 crossed above EMA8, short-term trend turns bullish | KDJ bullish crossover, short-term outlook bullish (K is 47.3, D is 45.9) | Volume increased (2.0x)
════════════════════
🔴 $FLOCK 4-hour bullish signal
⚠️Technical analysis: ADX(28): Trend is forming; entry possible | MACD bullish crossover above zero, bullish momentum is building | EMA5 crossed above EMA8, short-term trend turns bullish | Volume increased (1.8x)
════════════════════
🔴 $KSTR 4-hour bullish signal
⚠️Technical analysis: ADX(34): Clear trending market | MACD bullish crossover above zero, bullish momentum is building | EMA5 crossed above EMA8, short-term trend turns bullish | Volume surged (3.5x)
════════════════════
🔔 Follow for first-hand market updates 🔔
#技术分析 #LLY #FLOCK #KSTR
📌 When trading, pay attention to whether the candlestick pattern confirms the signal
Three 4-hour bullish signals appearing simultaneously: $LLY / $FLOCK / $KSTR 🔥
════════════════════
🔴 $LLY 4-hour bullish signal
⚠️Technical analysis: ADX(30): Trend is forming; entry possible | MACD bullish crossover above zero, bullish momentum is building | EMA5 crossed above EMA8, short-term trend turns bullish | KDJ bullish crossover, short-term outlook bullish (K is 47.3, D is 45.9) | Volume increased (2.0x)
════════════════════
🔴 $FLOCK 4-hour bullish signal
⚠️Technical analysis: ADX(28): Trend is forming; entry possible | MACD bullish crossover above zero, bullish momentum is building | EMA5 crossed above EMA8, short-term trend turns bullish | Volume increased (1.8x)
════════════════════
🔴 $KSTR 4-hour bullish signal
⚠️Technical analysis: ADX(34): Clear trending market | MACD bullish crossover above zero, bullish momentum is building | EMA5 crossed above EMA8, short-term trend turns bullish | Volume surged (3.5x)
════════════════════
🔔 Follow for first-hand market updates 🔔
#技术分析 #LLY #FLOCK #KSTR
📌 When trading, pay attention to whether the candlestick pattern confirms the signal
════════════════════
🔴 $LLY 4-hour bullish signal
⚠️Technical analysis: ADX(30): Trend is forming; entry possible | MACD bullish crossover above zero, bullish momentum is building | EMA5 crossed above EMA8, short-term trend turns bullish | KDJ bullish crossover, short-term outlook bullish (K is 47.3, D is 45.9) | Volume increased (2.0x)
════════════════════
🔴 $FLOCK 4-hour bullish signal
⚠️Technical analysis: ADX(28): Trend is forming; entry possible | MACD bullish crossover above zero, bullish momentum is building | EMA5 crossed above EMA8, short-term trend turns bullish | Volume increased (1.8x)
════════════════════
🔴 $KSTR 4-hour bullish signal
⚠️Technical analysis: ADX(34): Clear trending market | MACD bullish crossover above zero, bullish momentum is building | EMA5 crossed above EMA8, short-term trend turns bullish | Volume surged (3.5x)
════════════════════
🔔 Follow for first-hand market updates 🔔
#技术分析 #LLY #FLOCK #KSTR
📌 When trading, pay attention to whether the candlestick pattern confirms the signal
11
·
--
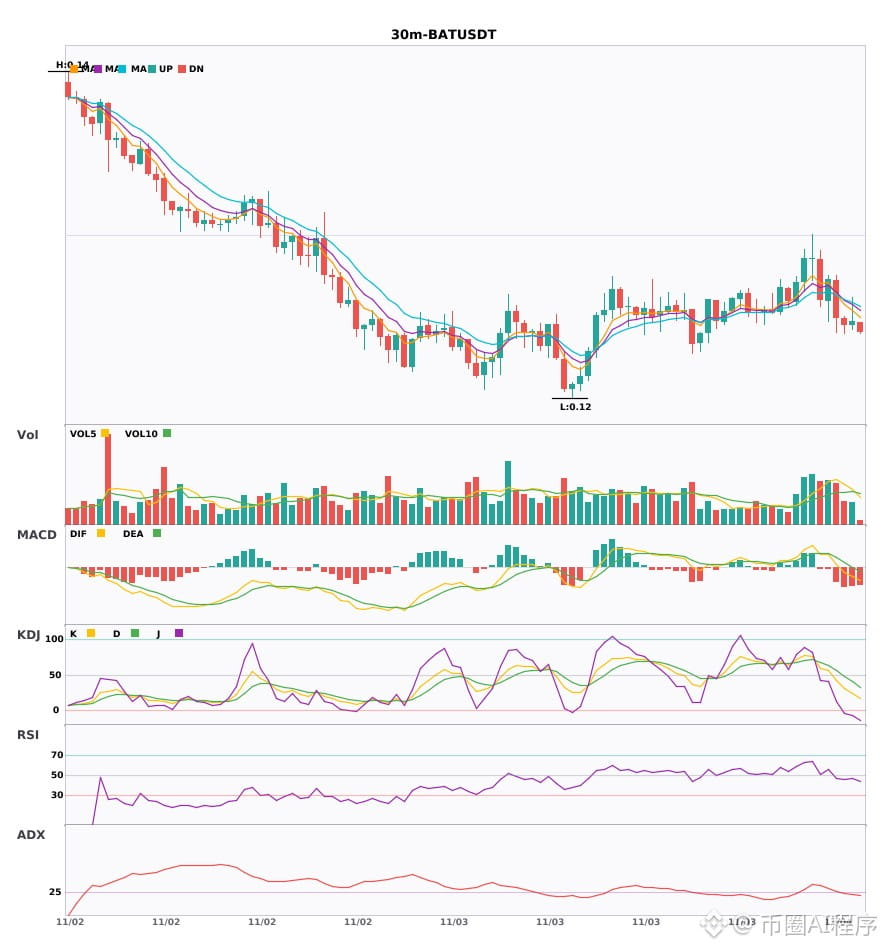
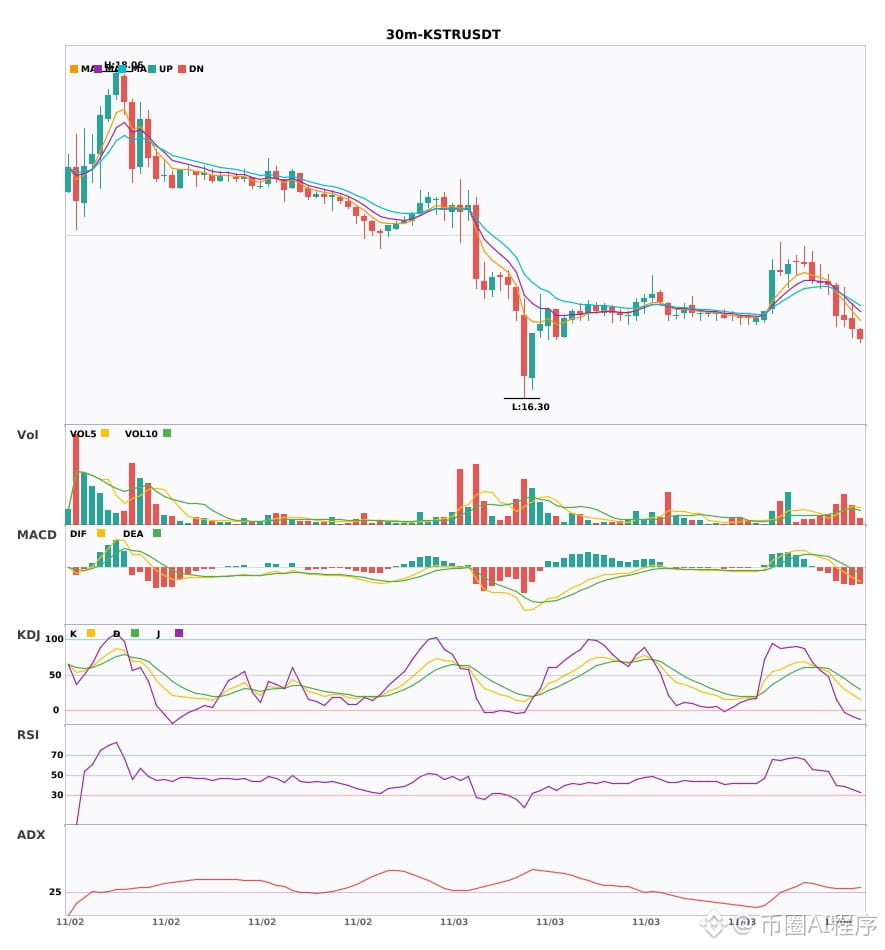
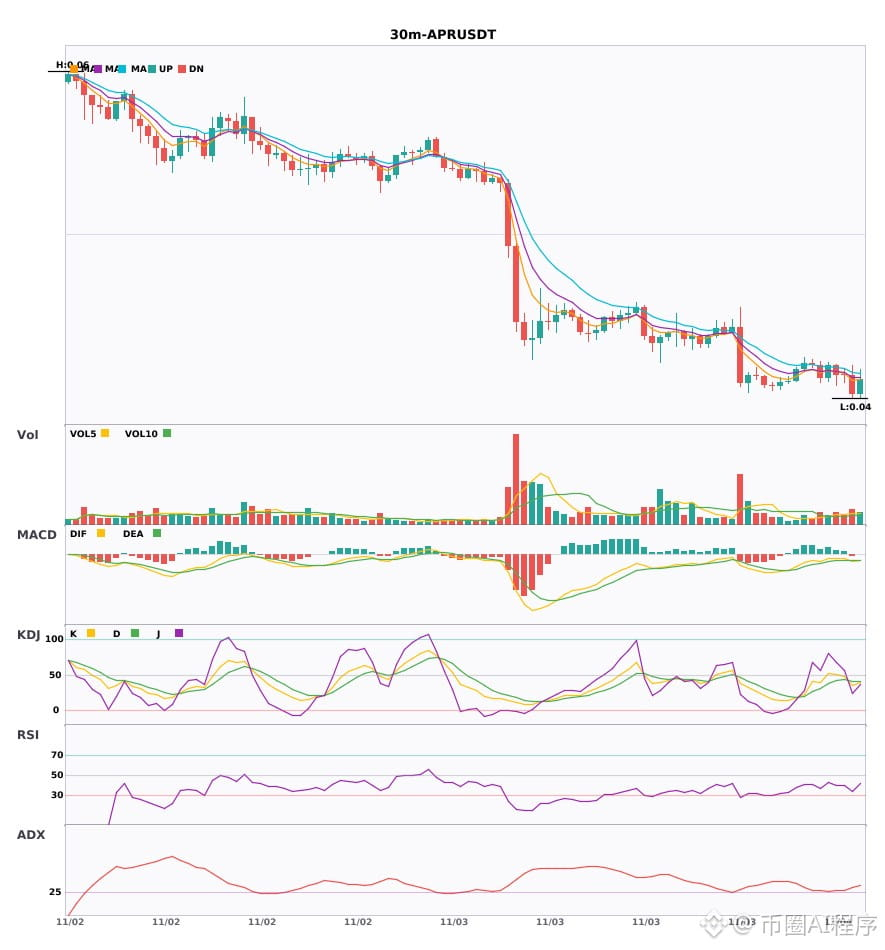
$BAT / $KSTR / $APR 30-minute bearish signal, 4-hour bearish trend confirmed🔥
════════════════════
🟢 $BAT 30-minute bearish signal
⚠️Technical analysis: 4-hour bearish convergence confirmed | 30-minute entry: MACD DIF falls below the zero line, trend turns bearish | EMA5 < EMA8 < EMA13, bearish alignment | KDJ is weak, bears have the upper hand (K: 31.0, D: 48.1) | Normal volume (1.3x)
════════════════════
🟢 $KSTR 30-minute bearish signal
⚠️Technical analysis: 4-hour bearish convergence confirmed | 30-minute entry: MACD DIF falls below the zero line, trend turns bearish | EMA5 < EMA8 < EMA13, bearish alignment | KDJ is weak, bears have the upper hand (K: 29.0, D: 44.6) | Increased trading volume (2.0x)
════════════════════
🟢 $APR 30-minute bearish signal
⚠️Technical analysis: 4-hour bearish convergence confirmed | 30-minute entry: MACD bearish crossover below zero, bearish momentum accelerating | EMA5 < EMA8 < EMA13, bearish alignment | KDJ bearish crossover, short-term outlook is bearish (K: 35.7, D: 41.5) | Increased trading volume (1.7x)
📢Market update: Binance Earn Yield Arena: Earn Up to 35% APR With This Week’s New Limited-Time Offers! (2026-10-28)
════════════════════
🔔 Follow for first-hand market alerts 🔔
#多周期共振 #BAT #KSTR #APR
📌 When trading, pay attention to whether the candlestick pattern matches
$BAT / $KSTR / $APR 30-minute bearish signal, 4-hour bearish trend confirmed🔥
════════════════════
🟢 $BAT 30-minute bearish signal
⚠️Technical analysis: 4-hour bearish convergence confirmed | 30-minute entry: MACD DIF falls below the zero line, trend turns bearish | EMA5 < EMA8 < EMA13, bearish alignment | KDJ is weak, bears have the upper hand (K: 31.0, D: 48.1) | Normal volume (1.3x)
════════════════════
🟢 $KSTR 30-minute bearish signal
⚠️Technical analysis: 4-hour bearish convergence confirmed | 30-minute entry: MACD DIF falls below the zero line, trend turns bearish | EMA5 < EMA8 < EMA13, bearish alignment | KDJ is weak, bears have the upper hand (K: 29.0, D: 44.6) | Increased trading volume (2.0x)
════════════════════
🟢 $APR 30-minute bearish signal
⚠️Technical analysis: 4-hour bearish convergence confirmed | 30-minute entry: MACD bearish crossover below zero, bearish momentum accelerating | EMA5 < EMA8 < EMA13, bearish alignment | KDJ bearish crossover, short-term outlook is bearish (K: 35.7, D: 41.5) | Increased trading volume (1.7x)
📢Market update: Binance Earn Yield Arena: Earn Up to 35% APR With This Week’s New Limited-Time Offers! (2026-10-28)
════════════════════
🔔 Follow for first-hand market alerts 🔔
#多周期共振 #BAT #KSTR #APR
📌 When trading, pay attention to whether the candlestick pattern matches
════════════════════
🟢 $BAT 30-minute bearish signal
⚠️Technical analysis: 4-hour bearish convergence confirmed | 30-minute entry: MACD DIF falls below the zero line, trend turns bearish | EMA5 < EMA8 < EMA13, bearish alignment | KDJ is weak, bears have the upper hand (K: 31.0, D: 48.1) | Normal volume (1.3x)
════════════════════
🟢 $KSTR 30-minute bearish signal
⚠️Technical analysis: 4-hour bearish convergence confirmed | 30-minute entry: MACD DIF falls below the zero line, trend turns bearish | EMA5 < EMA8 < EMA13, bearish alignment | KDJ is weak, bears have the upper hand (K: 29.0, D: 44.6) | Increased trading volume (2.0x)
════════════════════
🟢 $APR 30-minute bearish signal
⚠️Technical analysis: 4-hour bearish convergence confirmed | 30-minute entry: MACD bearish crossover below zero, bearish momentum accelerating | EMA5 < EMA8 < EMA13, bearish alignment | KDJ bearish crossover, short-term outlook is bearish (K: 35.7, D: 41.5) | Increased trading volume (1.7x)
📢Market update: Binance Earn Yield Arena: Earn Up to 35% APR With This Week’s New Limited-Time Offers! (2026-10-28)
════════════════════
🔔 Follow for first-hand market alerts 🔔
#多周期共振 #BAT #KSTR #APR
📌 When trading, pay attention to whether the candlestick pattern matches
10
·
--
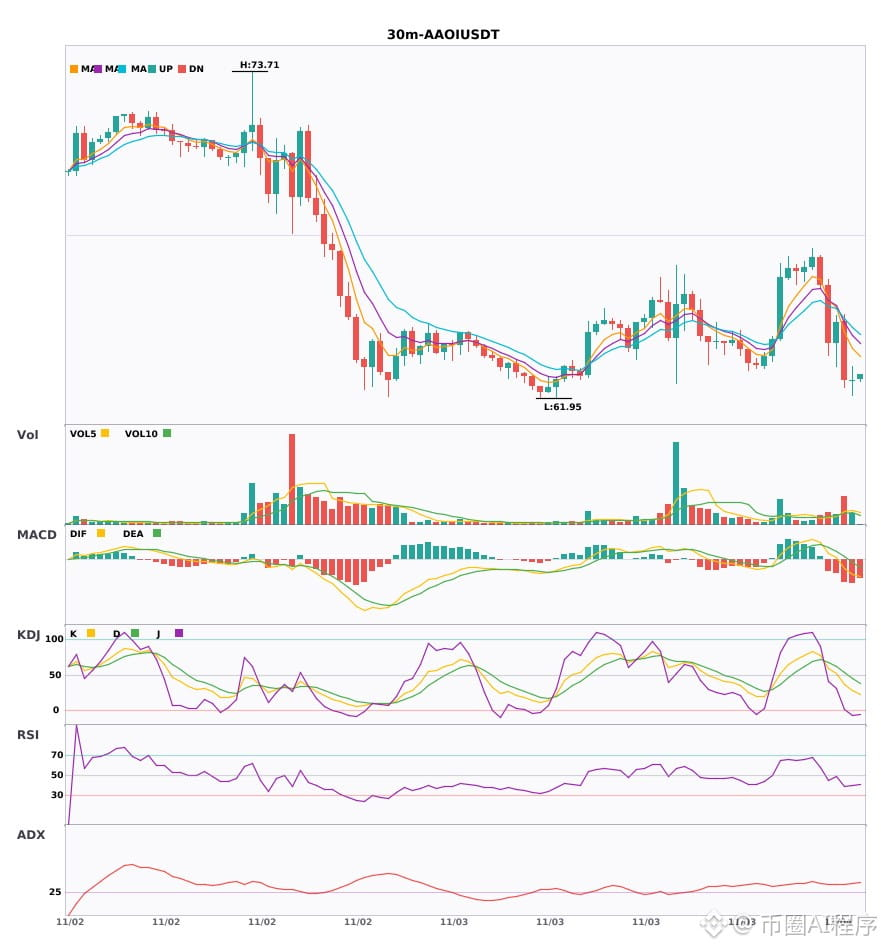
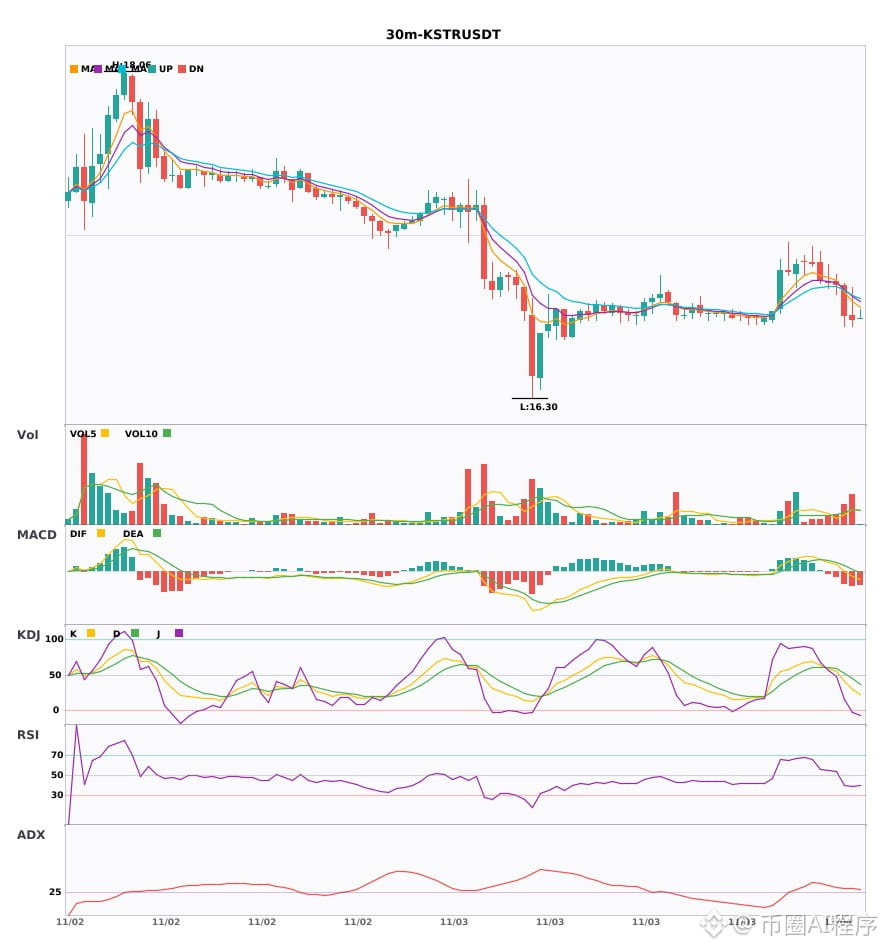
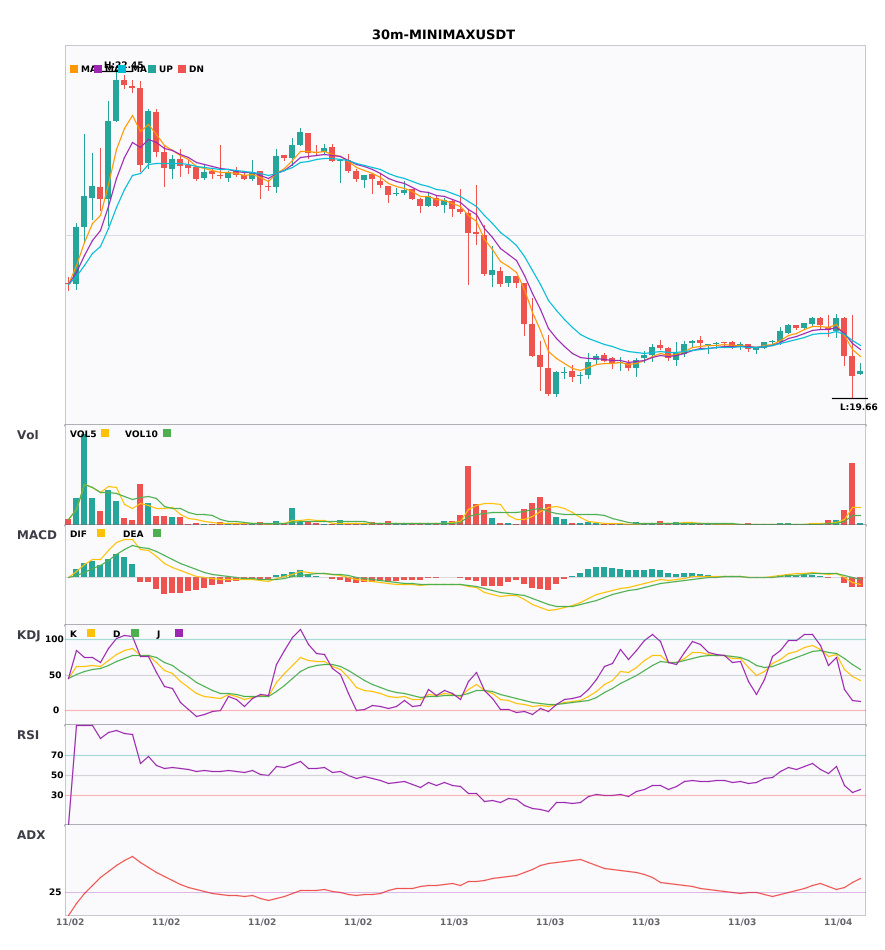
$AAOI / $KSTR / $MINIMAX 30-minute bearish + 4-hour bearish alignment, multi-timeframe confluence turns bearish 🔥
════════════════════
🟢 $AAOI 30-minute bearish signal
⚠️Technical analysis: 4-hour bearish confluence confirmed | 30-minute entry: MACD DIF falls below the zero line, trend turns bearish | EMA5 < EMA8 < EMA13, bearish alignment | Volume increase (2.4x)
════════════════════
🟢 $KSTR 30-minute bearish signal
⚠️Technical analysis: 4-hour bearish confluence confirmed | 30-minute entry: MACD DIF falls below the zero line, trend turns bearish | EMA5 < EMA8 < EMA13, bearish alignment | KDJ is trending weakly, with bears in control (K: 29.0, D: 44.6) | Volume increase (2.0x)
════════════════════
🟢 $MINIMAX 30-minute bearish signal
⚠️Technical analysis: 4-hour bearish confluence confirmed | 30-minute entry: MACD DIF falls below the zero line, trend turns bearish | EMA5 < EMA8 < EMA13, bearish alignment | Volume surge (6.6x)
════════════════════
🔔 Follow for real-time market alerts 🔔
#多周期共振 #AAOI #KSTR #MINIMAX
📌 When trading, pay attention to whether the candlestick pattern is favorable
$AAOI / $KSTR / $MINIMAX 30-minute bearish + 4-hour bearish alignment, multi-timeframe confluence turns bearish 🔥
════════════════════
🟢 $AAOI 30-minute bearish signal
⚠️Technical analysis: 4-hour bearish confluence confirmed | 30-minute entry: MACD DIF falls below the zero line, trend turns bearish | EMA5 < EMA8 < EMA13, bearish alignment | Volume increase (2.4x)
════════════════════
🟢 $KSTR 30-minute bearish signal
⚠️Technical analysis: 4-hour bearish confluence confirmed | 30-minute entry: MACD DIF falls below the zero line, trend turns bearish | EMA5 < EMA8 < EMA13, bearish alignment | KDJ is trending weakly, with bears in control (K: 29.0, D: 44.6) | Volume increase (2.0x)
════════════════════
🟢 $MINIMAX 30-minute bearish signal
⚠️Technical analysis: 4-hour bearish confluence confirmed | 30-minute entry: MACD DIF falls below the zero line, trend turns bearish | EMA5 < EMA8 < EMA13, bearish alignment | Volume surge (6.6x)
════════════════════
🔔 Follow for real-time market alerts 🔔
#多周期共振 #AAOI #KSTR #MINIMAX
📌 When trading, pay attention to whether the candlestick pattern is favorable
════════════════════
🟢 $AAOI 30-minute bearish signal
⚠️Technical analysis: 4-hour bearish confluence confirmed | 30-minute entry: MACD DIF falls below the zero line, trend turns bearish | EMA5 < EMA8 < EMA13, bearish alignment | Volume increase (2.4x)
════════════════════
🟢 $KSTR 30-minute bearish signal
⚠️Technical analysis: 4-hour bearish confluence confirmed | 30-minute entry: MACD DIF falls below the zero line, trend turns bearish | EMA5 < EMA8 < EMA13, bearish alignment | KDJ is trending weakly, with bears in control (K: 29.0, D: 44.6) | Volume increase (2.0x)
════════════════════
🟢 $MINIMAX 30-minute bearish signal
⚠️Technical analysis: 4-hour bearish confluence confirmed | 30-minute entry: MACD DIF falls below the zero line, trend turns bearish | EMA5 < EMA8 < EMA13, bearish alignment | Volume surge (6.6x)
════════════════════
🔔 Follow for real-time market alerts 🔔
#多周期共振 #AAOI #KSTR #MINIMAX
📌 When trading, pay attention to whether the candlestick pattern is favorable
9

·
--
$KSTR is falling in price, but longs are still paying.
It fell 3.3% in a day, with a funding rate of 0.21% paid by longs, while open interest rose 0.90%.
The longer the paying side holds on, the bigger the move that may follow. Share your take in the comments.
#KSTR #资金费率 #crypto
Just my personal observation, not investment advice.
$KSTR is falling in price, but longs are still paying.
It fell 3.3% in a day, with a funding rate of 0.21% paid by longs, while open interest rose 0.90%.
The longer the paying side holds on, the bigger the move that may follow. Share your take in the comments.
#KSTR #资金费率 #crypto
Just my personal observation, not investment advice.
It fell 3.3% in a day, with a funding rate of 0.21% paid by longs, while open interest rose 0.90%.
The longer the paying side holds on, the bigger the move that may follow. Share your take in the comments.
#KSTR #资金费率 #crypto
Just my personal observation, not investment advice.
446
·
--
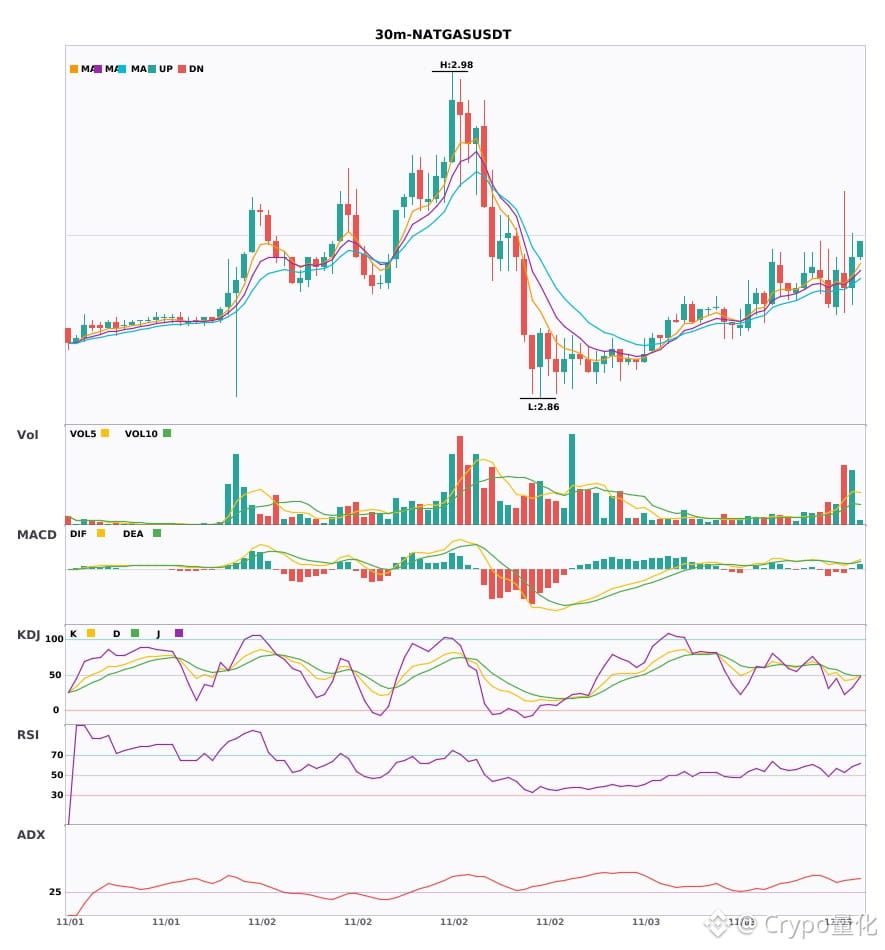
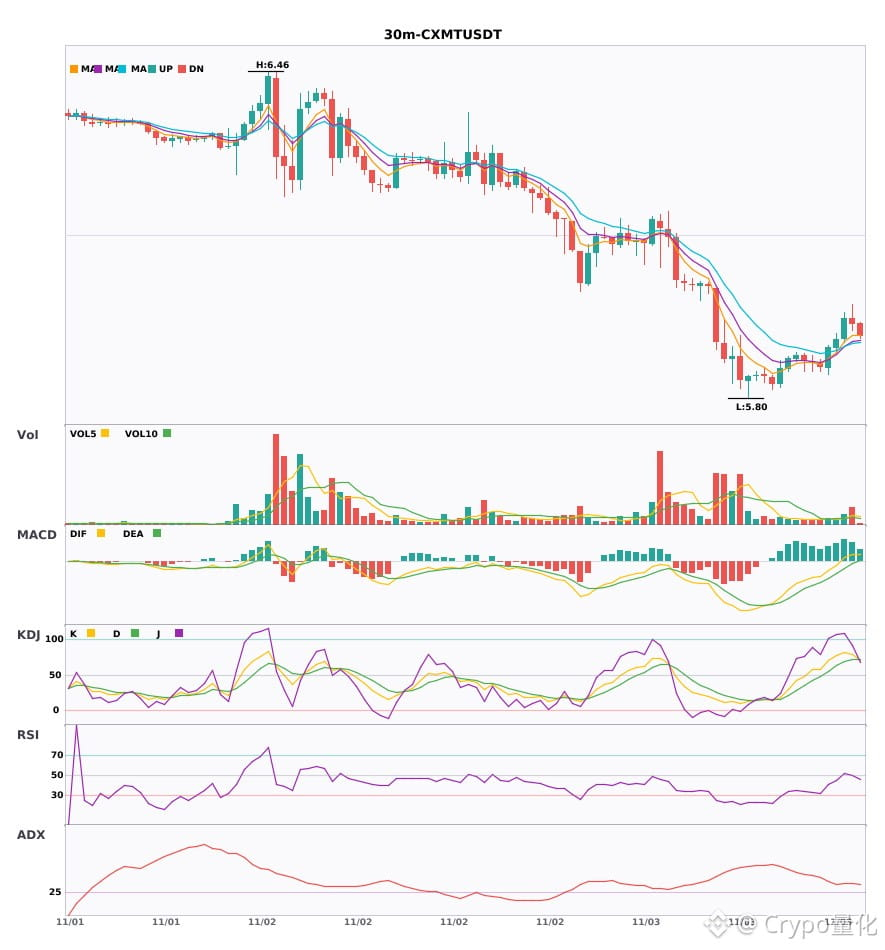
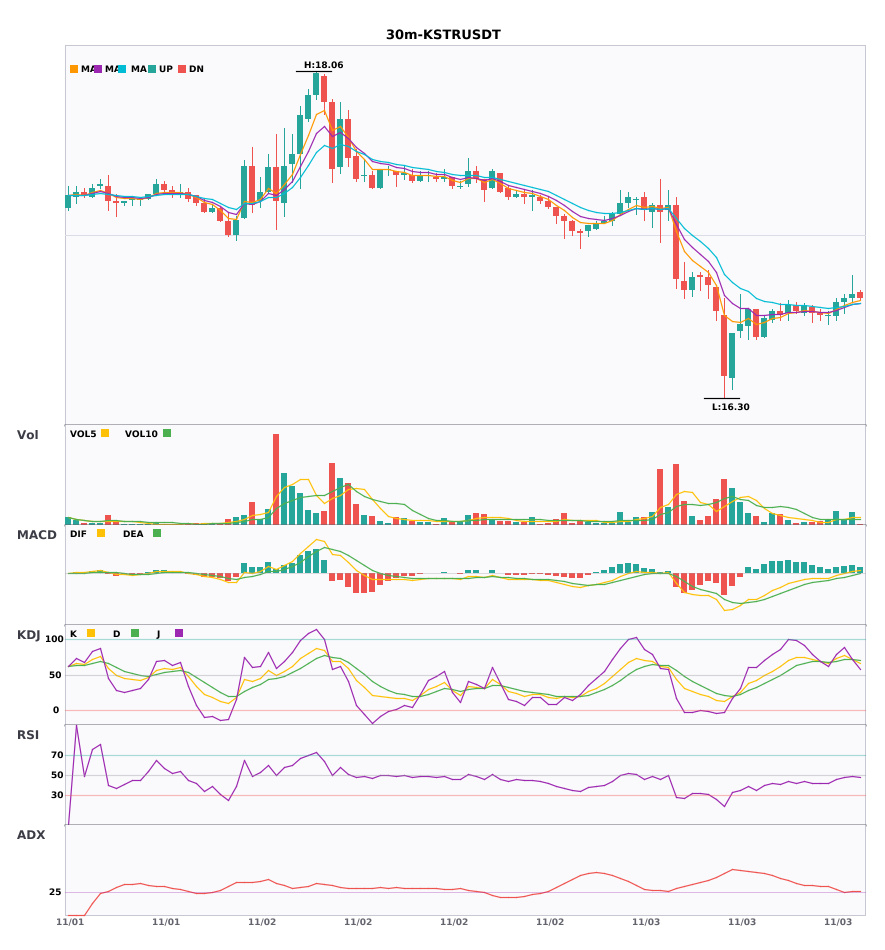
Three 30-minute bullish signals appeared simultaneously: $NATGAS / $CXMT / $KSTR🔥
════════════════════
🔴 $NATGAS 30-minute bullish signal
⚠️Technical analysis: ADX(40): clear trending market | MACD golden cross above zero, bullish momentum released | EMA5 > EMA8 > EMA13: bullish alignment | KDJ moving weakly, bears in control (K: 44.2, D: 49.9) | Volume surge (3.5x)
════════════════════
🔴 $CXMT 30-minute bullish signal
⚠️Technical analysis: ADX(36): clear trending market | MACD trending bullish, strong trend, momentum weakening | EMA5 > EMA8 > EMA13: bullish alignment | KDJ moving strongly, bulls in control (K: 78.4, D: 72.2) | Volume increase (2.4x)
════════════════════
🔴 $KSTR 30-minute bullish signal
⚠️Technical analysis: ADX(25): trend is forming; opportunity to participate | MACD DIF breaks above the zero line, trend turns bullish | Moving averages converging and building momentum, direction about to be chosen | KDJ moving strongly, bulls in control (K: 72.2, D: 72.0) | Volume increase (2.2x)
════════════════════
🔔 Follow for first-hand market updates 🔔
#技术分析 #NATGAS #CXMT #KSTR
📌 When trading, check whether the candlestick pattern confirms the setup
Three 30-minute bullish signals appeared simultaneously: $NATGAS / $CXMT / $KSTR 🔥
════════════════════
🔴 $NATGAS 30-minute bullish signal
⚠️Technical analysis: ADX(40): clear trending market | MACD golden cross above zero, bullish momentum released | EMA5 > EMA8 > EMA13: bullish alignment | KDJ moving weakly, bears in control (K: 44.2, D: 49.9) | Volume surge (3.5x)
════════════════════
🔴 $CXMT 30-minute bullish signal
⚠️Technical analysis: ADX(36): clear trending market | MACD trending bullish, strong trend, momentum weakening | EMA5 > EMA8 > EMA13: bullish alignment | KDJ moving strongly, bulls in control (K: 78.4, D: 72.2) | Volume increase (2.4x)
════════════════════
🔴 $KSTR 30-minute bullish signal
⚠️Technical analysis: ADX(25): trend is forming; opportunity to participate | MACD DIF breaks above the zero line, trend turns bullish | Moving averages converging and building momentum, direction about to be chosen | KDJ moving strongly, bulls in control (K: 72.2, D: 72.0) | Volume increase (2.2x)
════════════════════
🔔 Follow for first-hand market updates 🔔
#技术分析 #NATGAS #CXMT #KSTR
📌 When trading, check whether the candlestick pattern confirms the setup
════════════════════
🔴 $NATGAS 30-minute bullish signal
⚠️Technical analysis: ADX(40): clear trending market | MACD golden cross above zero, bullish momentum released | EMA5 > EMA8 > EMA13: bullish alignment | KDJ moving weakly, bears in control (K: 44.2, D: 49.9) | Volume surge (3.5x)
════════════════════
🔴 $CXMT 30-minute bullish signal
⚠️Technical analysis: ADX(36): clear trending market | MACD trending bullish, strong trend, momentum weakening | EMA5 > EMA8 > EMA13: bullish alignment | KDJ moving strongly, bulls in control (K: 78.4, D: 72.2) | Volume increase (2.4x)
════════════════════
🔴 $KSTR 30-minute bullish signal
⚠️Technical analysis: ADX(25): trend is forming; opportunity to participate | MACD DIF breaks above the zero line, trend turns bullish | Moving averages converging and building momentum, direction about to be chosen | KDJ moving strongly, bulls in control (K: 72.2, D: 72.0) | Volume increase (2.2x)
════════════════════
🔔 Follow for first-hand market updates 🔔
#技术分析 #NATGAS #CXMT #KSTR
📌 When trading, check whether the candlestick pattern confirms the setup
4
·
--
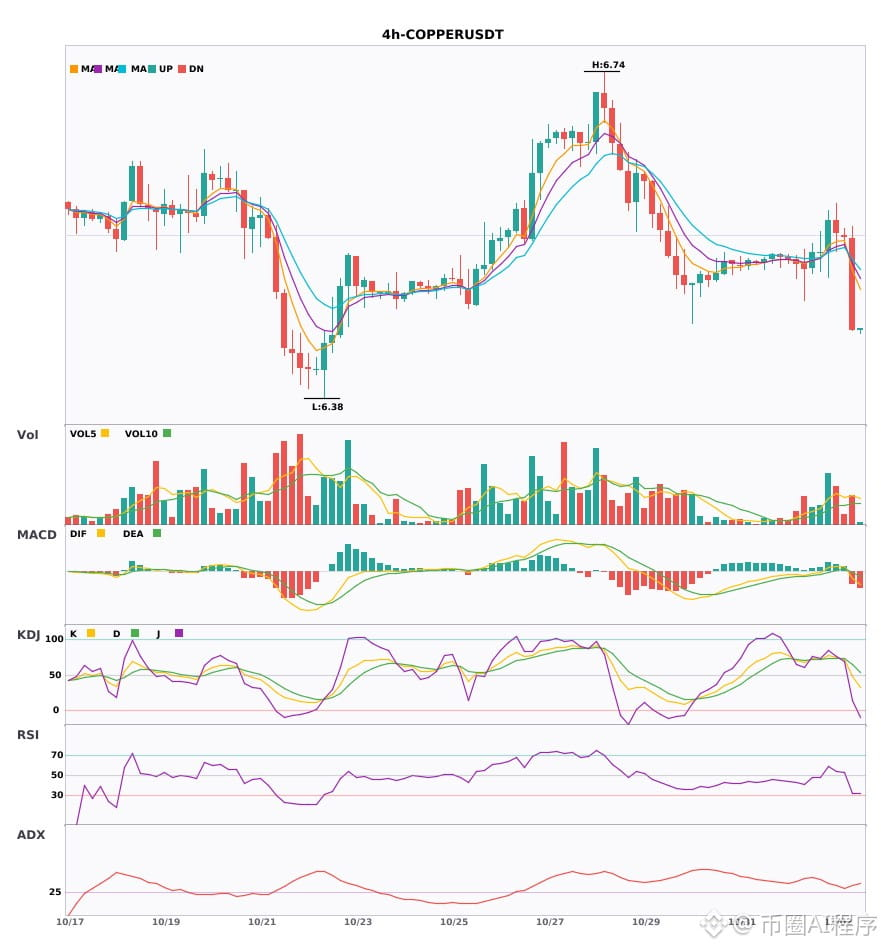
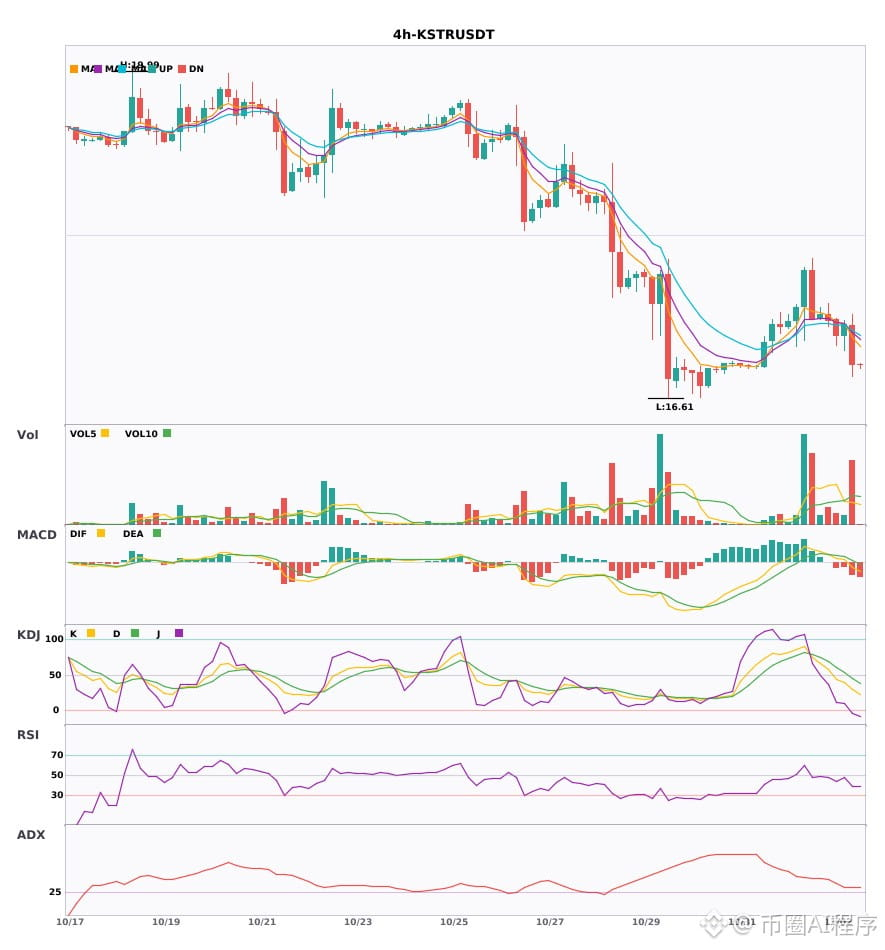
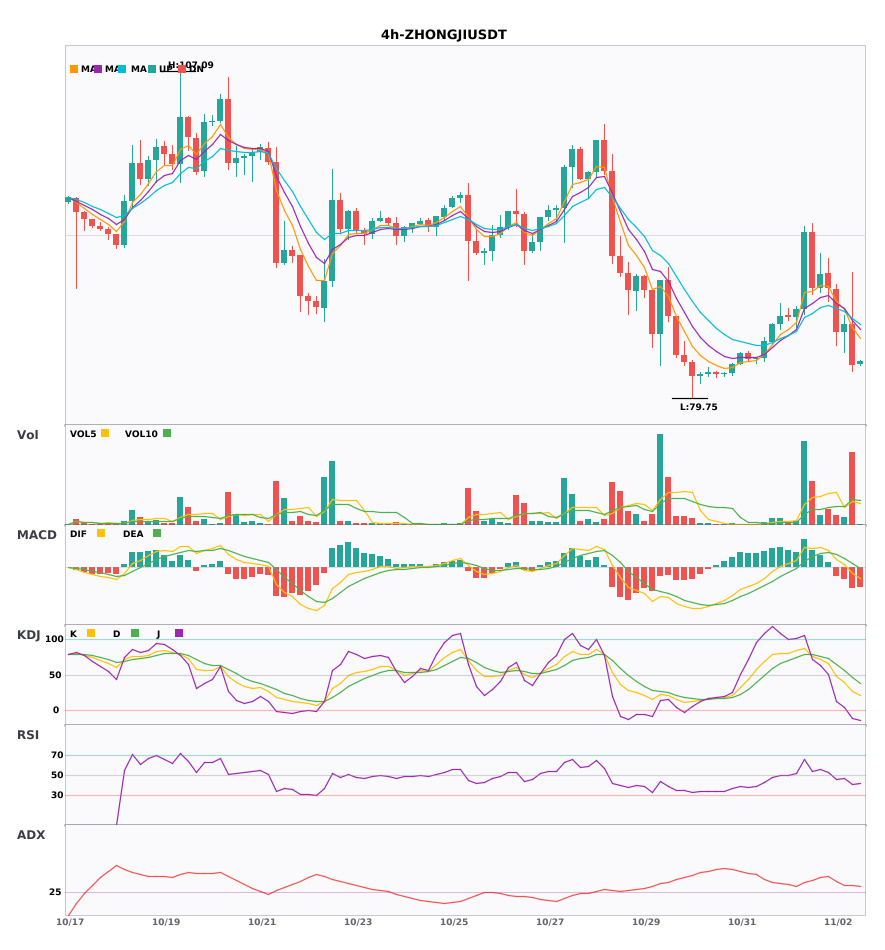
$COPPER / $KSTR / $ZHONGJI 4-hour bearish + daily bearish alignment, multi-timeframe convergence turns bearish 🔥
════════════════════
🟢 $COPPER 4-hour bearish signal
⚠️Technical analysis: Daily bearish convergence confirmed | 4-hour entry: MACD bearish cross below zero, bearish momentum accelerating | EMA5 crosses below EMA8, short-term outlook turns bearish | Volume normal (1.4x)
════════════════════
🟢 $KSTR 4-hour bearish signal
⚠️Technical analysis: Daily bearish convergence confirmed | 4-hour entry: MACD DIF falls below the zero line, trend turns bearish | EMA5 crosses below EMA8, short-term outlook turns bearish | KDJ is weak, bears have the upper hand (K: 29.0, D: 45.4) | Trading volume increases (2.2x)
════════════════════
🟢 $ZHONGJI 4-hour bearish signal
⚠️Technical analysis: Daily bearish convergence confirmed | 4-hour entry: MACD DIF falls below the zero line, trend turns bearish | EMA5 < EMA8 < EMA13, bearish alignment | KDJ is weak, bears have the upper hand (K: 27.4, D: 46.3) | Trading volume surges (2.9x)
════════════════════
🔔 Follow for first-hand market updates 🔔
#多周期共振 #COPPER #KSTR #ZHONGJI
📌 When trading, pay attention to whether the candlestick pattern confirms the signal
$COPPER / $KSTR / $ZHONGJI 4-hour bearish + daily bearish alignment, multi-timeframe convergence turns bearish 🔥
════════════════════
🟢 $COPPER 4-hour bearish signal
⚠️Technical analysis: Daily bearish convergence confirmed | 4-hour entry: MACD bearish cross below zero, bearish momentum accelerating | EMA5 crosses below EMA8, short-term outlook turns bearish | Volume normal (1.4x)
════════════════════
🟢 $KSTR 4-hour bearish signal
⚠️Technical analysis: Daily bearish convergence confirmed | 4-hour entry: MACD DIF falls below the zero line, trend turns bearish | EMA5 crosses below EMA8, short-term outlook turns bearish | KDJ is weak, bears have the upper hand (K: 29.0, D: 45.4) | Trading volume increases (2.2x)
════════════════════
🟢 $ZHONGJI 4-hour bearish signal
⚠️Technical analysis: Daily bearish convergence confirmed | 4-hour entry: MACD DIF falls below the zero line, trend turns bearish | EMA5 < EMA8 < EMA13, bearish alignment | KDJ is weak, bears have the upper hand (K: 27.4, D: 46.3) | Trading volume surges (2.9x)
════════════════════
🔔 Follow for first-hand market updates 🔔
#多周期共振 #COPPER #KSTR #ZHONGJI
📌 When trading, pay attention to whether the candlestick pattern confirms the signal
════════════════════
🟢 $COPPER 4-hour bearish signal
⚠️Technical analysis: Daily bearish convergence confirmed | 4-hour entry: MACD bearish cross below zero, bearish momentum accelerating | EMA5 crosses below EMA8, short-term outlook turns bearish | Volume normal (1.4x)
════════════════════
🟢 $KSTR 4-hour bearish signal
⚠️Technical analysis: Daily bearish convergence confirmed | 4-hour entry: MACD DIF falls below the zero line, trend turns bearish | EMA5 crosses below EMA8, short-term outlook turns bearish | KDJ is weak, bears have the upper hand (K: 29.0, D: 45.4) | Trading volume increases (2.2x)
════════════════════
🟢 $ZHONGJI 4-hour bearish signal
⚠️Technical analysis: Daily bearish convergence confirmed | 4-hour entry: MACD DIF falls below the zero line, trend turns bearish | EMA5 < EMA8 < EMA13, bearish alignment | KDJ is weak, bears have the upper hand (K: 27.4, D: 46.3) | Trading volume surges (2.9x)
════════════════════
🔔 Follow for first-hand market updates 🔔
#多周期共振 #COPPER #KSTR #ZHONGJI
📌 When trading, pay attention to whether the candlestick pattern confirms the signal
17
·
--
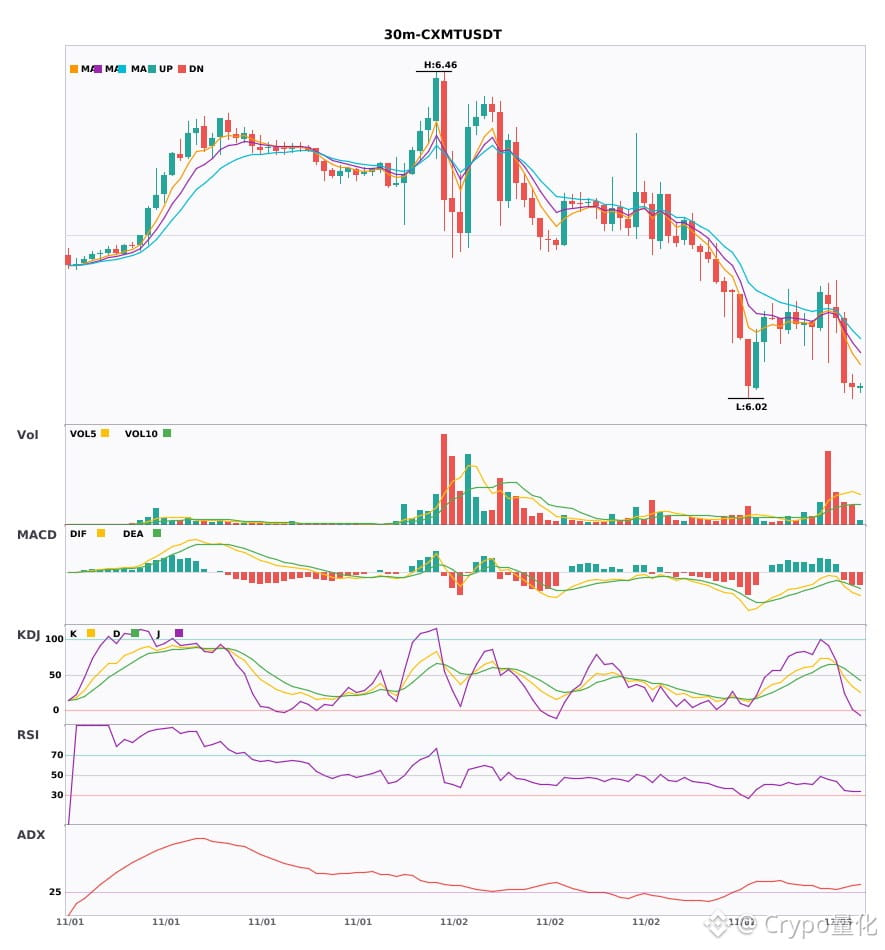
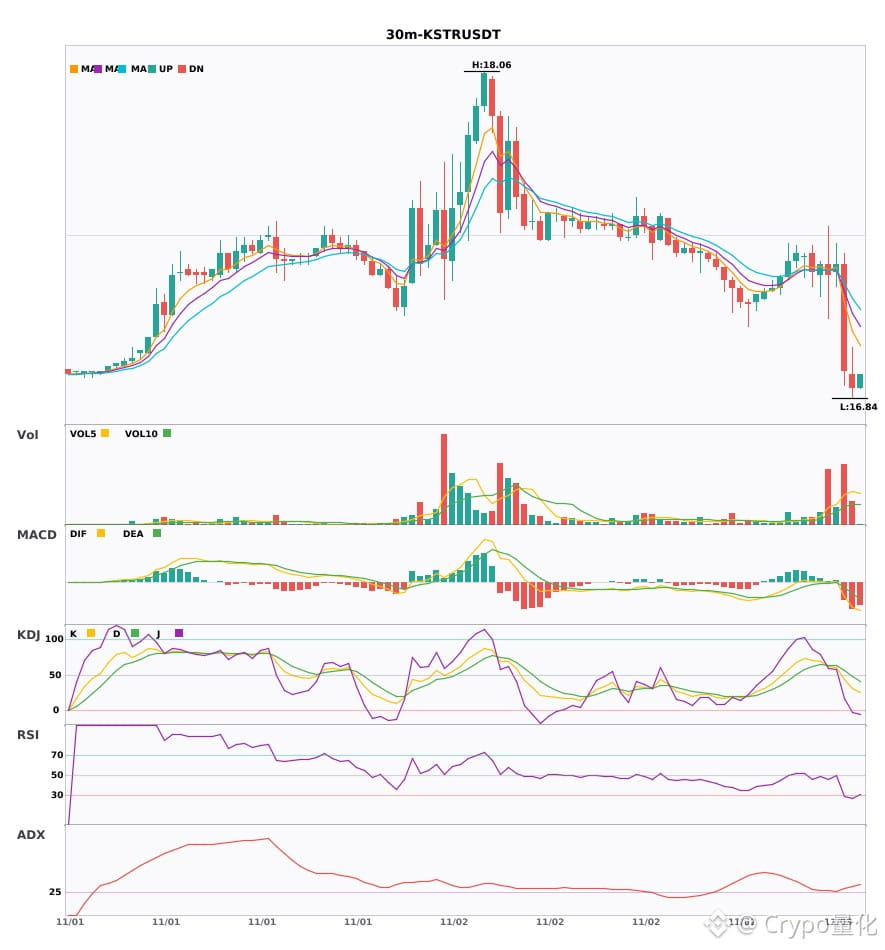
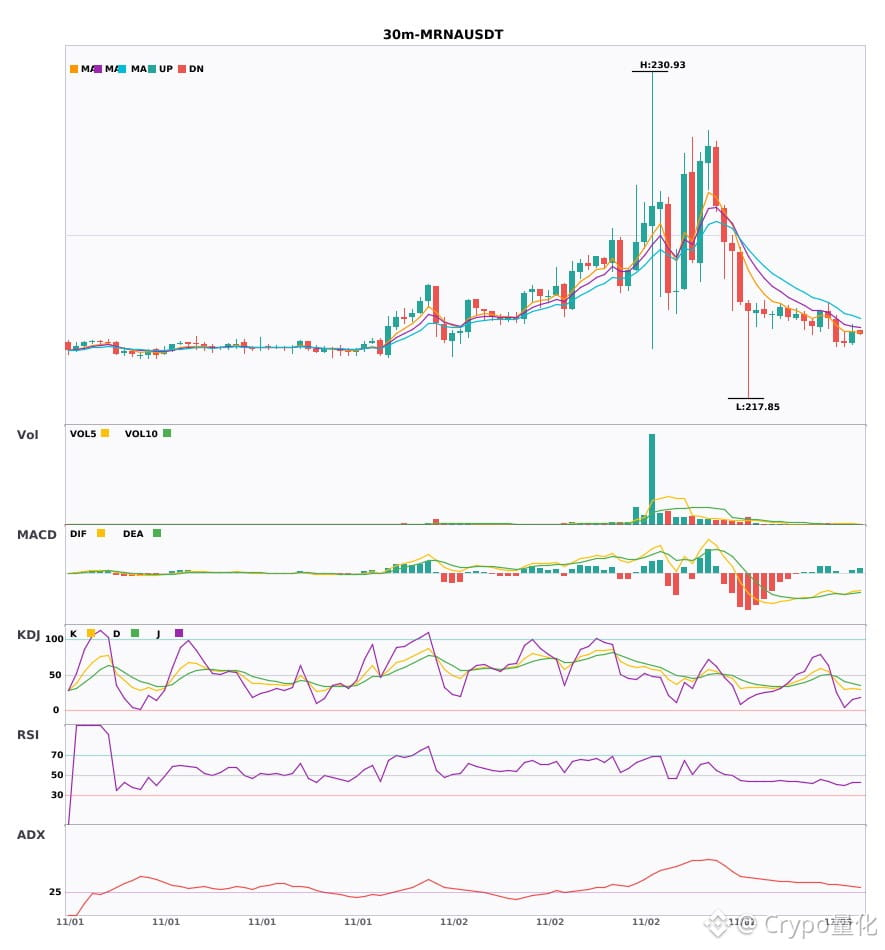
3 30-minute bearish alerts: $CXMT / $KSTR / $MRNA🔥
════════════════════
🟢 $CXMT 30-minute bearish signal
⚠️Technical analysis: ADX(30) Trend is forming; opportunity to participate | MACD bearish crossover below zero; bearish momentum accelerating | EMA5 crossed below EMA8; short-term outlook turns bearish | KDJ bearish crossover; short-term outlook is bearish (K: 47.2, D: 59.1) | Volume increased (1.9x)
════════════════════
🟢 $KSTR 30-minute bearish signal
⚠️Technical analysis: ADX(31) Clear trending market | MACD bearish crossover below zero; bearish momentum accelerating | EMA5 crossed below EMA8; short-term outlook turns bearish | Volume surged (3.3x)
════════════════════
🟢 $MRNA 30-minute bearish signal
⚠️Technical analysis: ADX(36) Clear trending market | MACD bearish crossover below zero; bearish momentum accelerating | EMA5 < EMA8 < EMA13; bearish alignment | KDJ moving in weak territory, with bears in control (K: 29.1, D: 41.4) | Volume increased (1.5x)
════════════════════
🔔 Follow to get firsthand market alerts 🔔
#技术分析 #CXMT #KSTR #MRNA
📌 When trading, pay attention to whether the candlestick pattern confirms the setup
3 30-minute bearish alerts: $CXMT / $KSTR / $MRNA 🔥
════════════════════
🟢 $CXMT 30-minute bearish signal
⚠️Technical analysis: ADX(30) Trend is forming; opportunity to participate | MACD bearish crossover below zero; bearish momentum accelerating | EMA5 crossed below EMA8; short-term outlook turns bearish | KDJ bearish crossover; short-term outlook is bearish (K: 47.2, D: 59.1) | Volume increased (1.9x)
════════════════════
🟢 $KSTR 30-minute bearish signal
⚠️Technical analysis: ADX(31) Clear trending market | MACD bearish crossover below zero; bearish momentum accelerating | EMA5 crossed below EMA8; short-term outlook turns bearish | Volume surged (3.3x)
════════════════════
🟢 $MRNA 30-minute bearish signal
⚠️Technical analysis: ADX(36) Clear trending market | MACD bearish crossover below zero; bearish momentum accelerating | EMA5 < EMA8 < EMA13; bearish alignment | KDJ moving in weak territory, with bears in control (K: 29.1, D: 41.4) | Volume increased (1.5x)
════════════════════
🔔 Follow to get firsthand market alerts 🔔
#技术分析 #CXMT #KSTR #MRNA
📌 When trading, pay attention to whether the candlestick pattern confirms the setup
════════════════════
🟢 $CXMT 30-minute bearish signal
⚠️Technical analysis: ADX(30) Trend is forming; opportunity to participate | MACD bearish crossover below zero; bearish momentum accelerating | EMA5 crossed below EMA8; short-term outlook turns bearish | KDJ bearish crossover; short-term outlook is bearish (K: 47.2, D: 59.1) | Volume increased (1.9x)
════════════════════
🟢 $KSTR 30-minute bearish signal
⚠️Technical analysis: ADX(31) Clear trending market | MACD bearish crossover below zero; bearish momentum accelerating | EMA5 crossed below EMA8; short-term outlook turns bearish | Volume surged (3.3x)
════════════════════
🟢 $MRNA 30-minute bearish signal
⚠️Technical analysis: ADX(36) Clear trending market | MACD bearish crossover below zero; bearish momentum accelerating | EMA5 < EMA8 < EMA13; bearish alignment | KDJ moving in weak territory, with bears in control (K: 29.1, D: 41.4) | Volume increased (1.5x)
════════════════════
🔔 Follow to get firsthand market alerts 🔔
#技术分析 #CXMT #KSTR #MRNA
📌 When trading, pay attention to whether the candlestick pattern confirms the setup
6
·
--
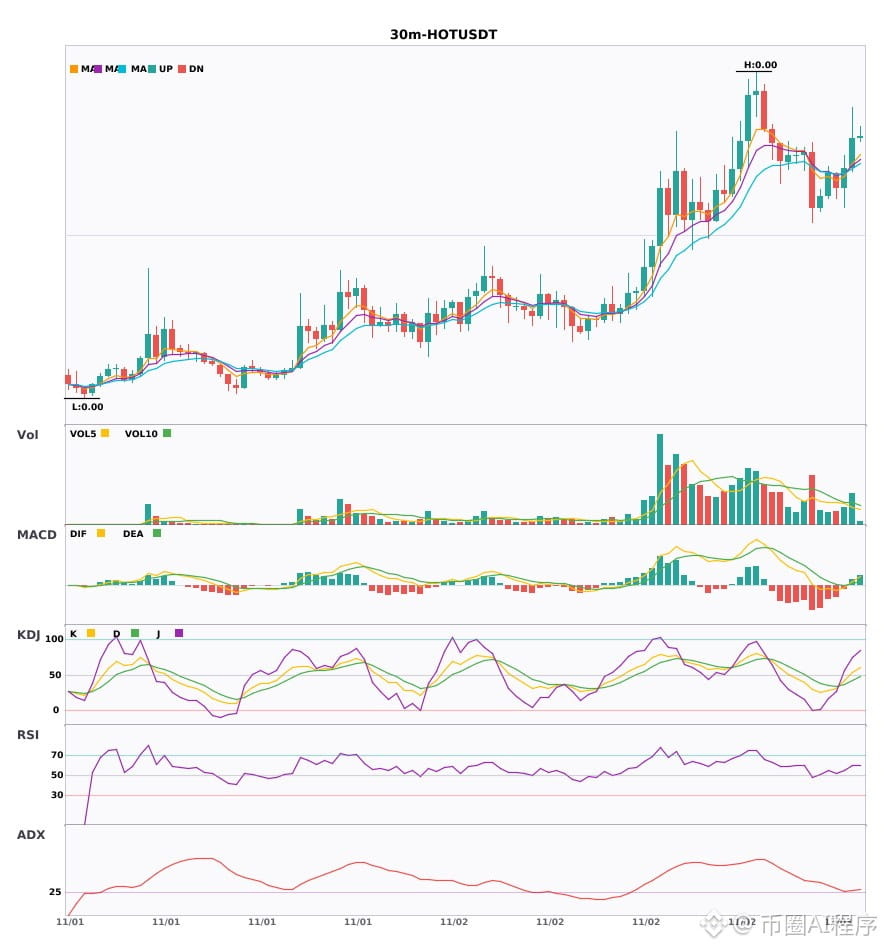
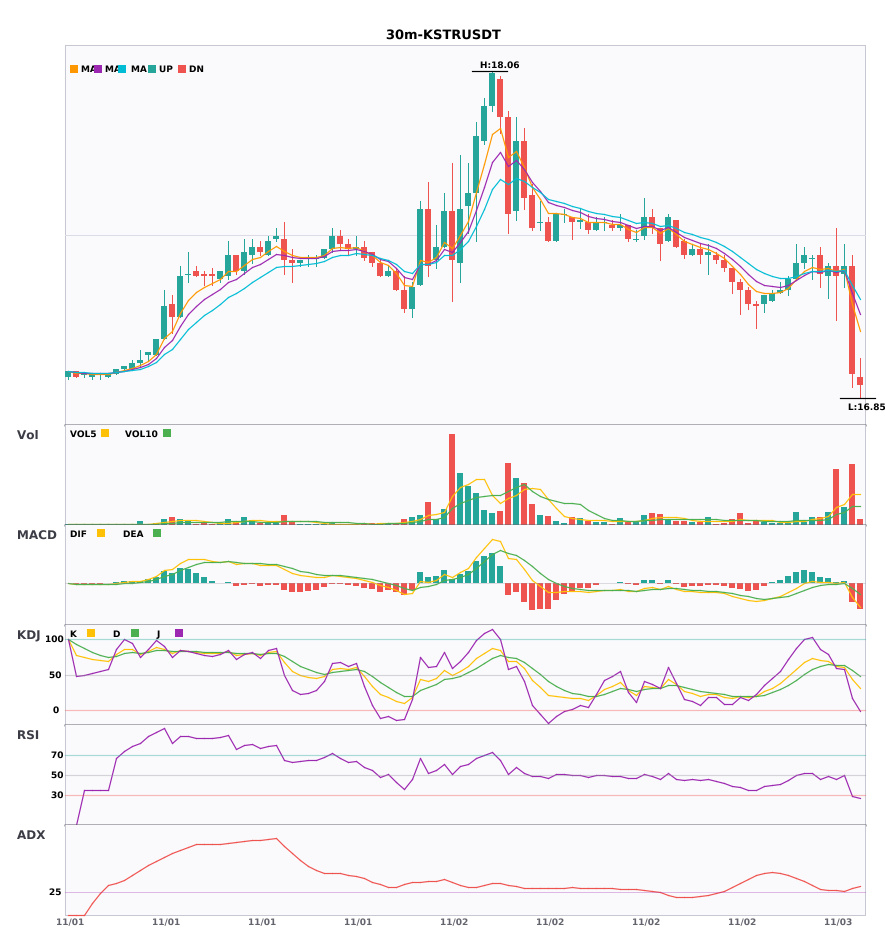
Multi-timeframe confluence: 2 coins bullish on the 30-minute chart + 4-hour bullish trend confirmation 🔥
════════════════════
🔴 $HOT 30-minute bullish signal
⚠️ Technicals: 4-hour bullish confluence confirmed | 30-minute entry: MACD bullish crossover above zero, bullish momentum emerging | EMA5 crosses above EMA8, short-term trend turns bullish | Volume normal (1.4x)
════════════════════
🔴 $KSTR 30-minute bullish signal
⚠️ Technicals: 4-hour bullish confluence confirmed | 30-minute entry: MACD trending bullish, trend strength improving, momentum increasing | EMA5 > EMA8 > EMA13, bullish alignment | KDJ trending strongly, bulls in control (K: 60.9, D: 62.8) | Volume surge (5.2x)
════════════════════
🔔 Follow for first-hand market alerts 🔔
#多周期共振 #HOT #KSTR
📌 When trading, check whether the candlestick pattern aligns
Multi-timeframe confluence: 2 coins bullish on the 30-minute chart + 4-hour bullish trend confirmation 🔥
════════════════════
🔴 $HOT 30-minute bullish signal
⚠️ Technicals: 4-hour bullish confluence confirmed | 30-minute entry: MACD bullish crossover above zero, bullish momentum emerging | EMA5 crosses above EMA8, short-term trend turns bullish | Volume normal (1.4x)
════════════════════
🔴 $KSTR 30-minute bullish signal
⚠️ Technicals: 4-hour bullish confluence confirmed | 30-minute entry: MACD trending bullish, trend strength improving, momentum increasing | EMA5 > EMA8 > EMA13, bullish alignment | KDJ trending strongly, bulls in control (K: 60.9, D: 62.8) | Volume surge (5.2x)
════════════════════
🔔 Follow for first-hand market alerts 🔔
#多周期共振 #HOT #KSTR
📌 When trading, check whether the candlestick pattern aligns
════════════════════
🔴 $HOT 30-minute bullish signal
⚠️ Technicals: 4-hour bullish confluence confirmed | 30-minute entry: MACD bullish crossover above zero, bullish momentum emerging | EMA5 crosses above EMA8, short-term trend turns bullish | Volume normal (1.4x)
════════════════════
🔴 $KSTR 30-minute bullish signal
⚠️ Technicals: 4-hour bullish confluence confirmed | 30-minute entry: MACD trending bullish, trend strength improving, momentum increasing | EMA5 > EMA8 > EMA13, bullish alignment | KDJ trending strongly, bulls in control (K: 60.9, D: 62.8) | Volume surge (5.2x)
════════════════════
🔔 Follow for first-hand market alerts 🔔
#多周期共振 #HOT #KSTR
📌 When trading, check whether the candlestick pattern aligns
6
Log in to explore more content
Join global crypto users on Binance Square
⚡️ Get latest and useful information about crypto.
💬 Trusted by the world’s largest crypto exchange.
👍 Discover real insights from verified creators.
Email / Phone number
Trending Topics
1
#USPPIMissMayEaseBTCPressure
330,788 views
2,369 Discussing
2
#USSpotXRPETFsSeeLargestWeeklyOutflowIn8Months
38,889 views
413 Discussing
3
#TONStrategyReports$23.97MQ3NetLoss
11,344 views
55 Discussing
4
#WhoWillSucceedJensenHuangatNvidia?
202,651 views
1,804 Discussing
5
#WhatWillDriveCryptoandStocks’NextRebound?
624,554 views
3,636 Discussing
6
#TradFiForBeginners
750,913 views
4,602 Discussing
7
#BitcoinActiveSupplyInProfitDropsBelow45%
92,186 views
826 Discussing
8
#KavaSaysAbnormalActivityLimitedToKavaLend
57,152 views
461 Discussing
9
#WORPTLetsTouristsConvertCryptoToThaiBaht
11,862 views
116 Discussing
10
#PolkadotCommunityApprovesNewStrategyWith97%Vote
31,983 views
305 Discussing