
#w
w
7.3M views
8,854 Discussing
Hot
Latest


·
--
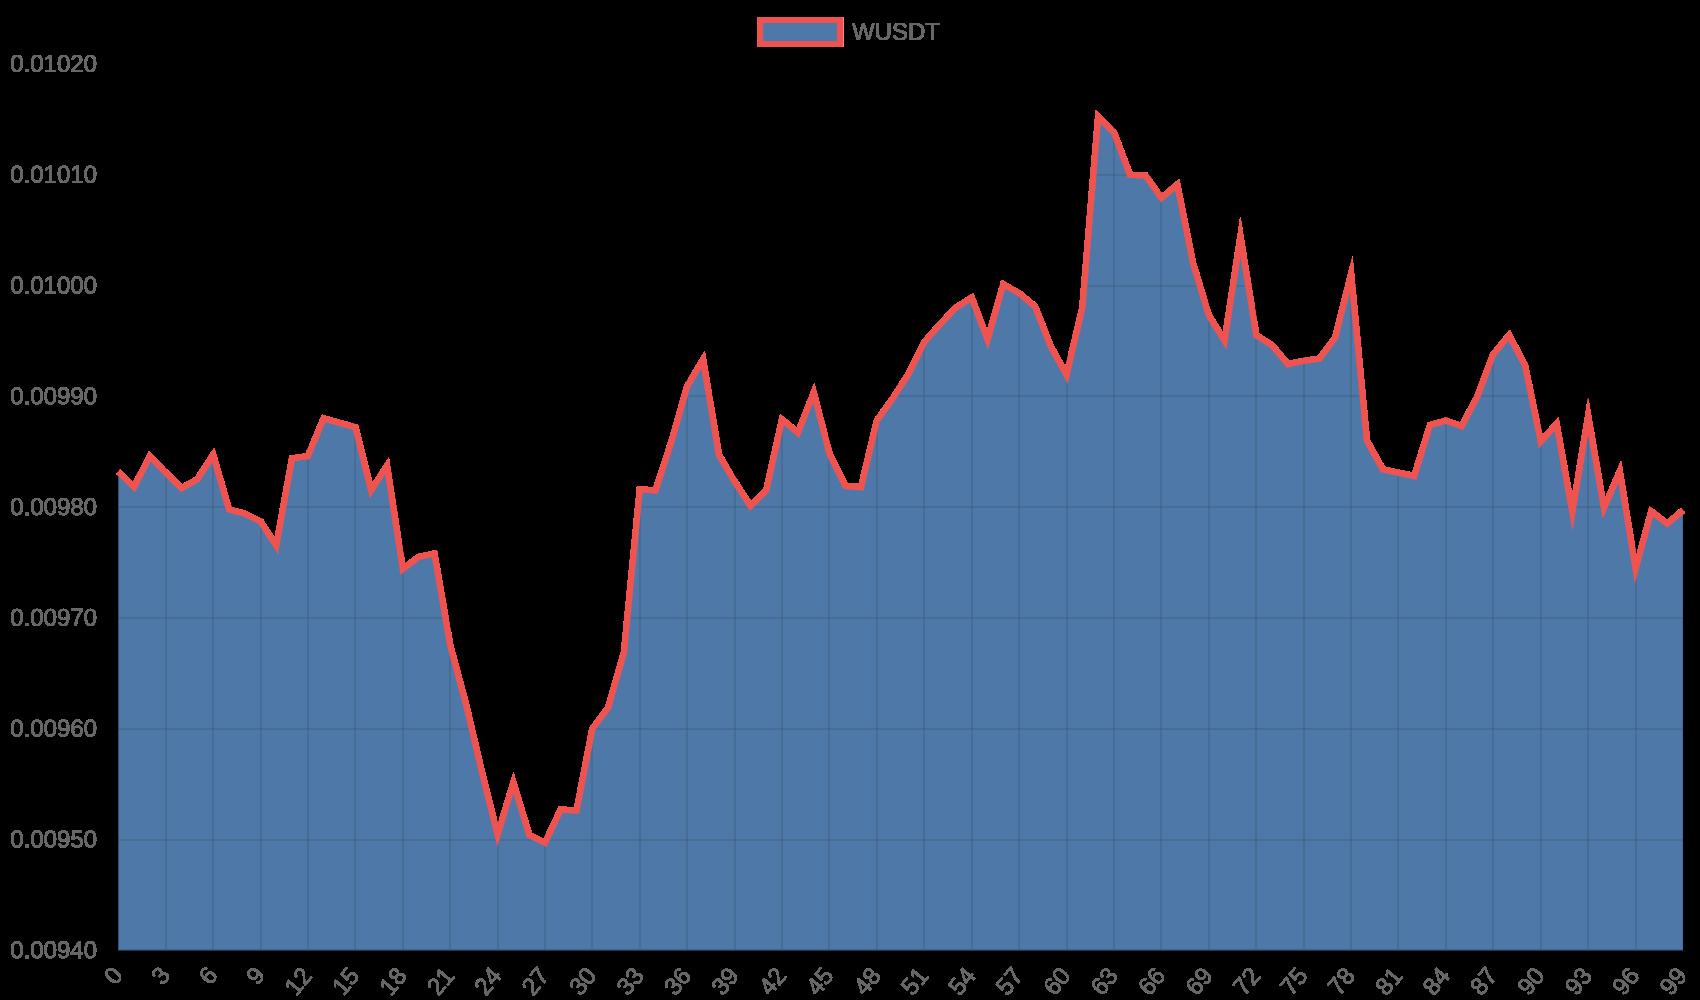
Your stop on $W is sitting at a round number and that is why you keep getting wicked out
Most people pick a random percentage loss instead of looking at the chart
Look at $W right now trading at 0.009910 with an hourly ATR of 1.6 percent
That means normal market noise swings this thing about 0.00016 every single hour
If you put your stop closer than that 24h swing low of 0.009410 you are just paying the spread to algorithms
A real stop belongs below the level that actually invalidates your entire trade idea
Put it where you are undeniably wrong and let the normal chop breathe around it
Where do you normally set your stops before checking the ATR
#W #TradingTips
Your stop on $W is sitting at a round number and that is why you keep getting wicked out
Most people pick a random percentage loss instead of looking at the chart
Look at $W right now trading at 0.009910 with an hourly ATR of 1.6 percent
That means normal market noise swings this thing about 0.00016 every single hour
If you put your stop closer than that 24h swing low of 0.009410 you are just paying the spread to algorithms
A real stop belongs below the level that actually invalidates your entire trade idea
Put it where you are undeniably wrong and let the normal chop breathe around it
Where do you normally set your stops before checking the ATR
#W #TradingTips
Most people pick a random percentage loss instead of looking at the chart
Look at $W right now trading at 0.009910 with an hourly ATR of 1.6 percent
That means normal market noise swings this thing about 0.00016 every single hour
If you put your stop closer than that 24h swing low of 0.009410 you are just paying the spread to algorithms
A real stop belongs below the level that actually invalidates your entire trade idea
Put it where you are undeniably wrong and let the normal chop breathe around it
Where do you normally set your stops before checking the ATR
#W #TradingTips
9
·
--
$W keeps stalling just below $0.01014
An hourly close over that level clears the path for some real momentum
A rejection sends it drifting right back toward support at $0.009410 📉
Open $W and set an alert at that level
Break or reject 👀
#W #PriceAction
$W keeps stalling just below $0.01014
An hourly close over that level clears the path for some real momentum
A rejection sends it drifting right back toward support at $0.009410 📉
Open $W and set an alert at that level
Break or reject 👀
#W #PriceAction
An hourly close over that level clears the path for some real momentum
A rejection sends it drifting right back toward support at $0.009410 📉
Open $W and set an alert at that level
Break or reject 👀
#W #PriceAction
21
·
--
$W volume is running 2.3 times the weekly average right here
panic sellers are flushing bags into bids near the lows
holding at 16 percent of the range with an RSI of 30
capitulation volume usually marks the trap before a bounce
Fade or follow?
#W #MarketUpdate
$W volume is running 2.3 times the weekly average right here
panic sellers are flushing bags into bids near the lows
holding at 16 percent of the range with an RSI of 30
capitulation volume usually marks the trap before a bounce
Fade or follow?
#W #MarketUpdate
panic sellers are flushing bags into bids near the lows
holding at 16 percent of the range with an RSI of 30
capitulation volume usually marks the trap before a bounce
Fade or follow?
#W #MarketUpdate
12

·
--
$W or $ETH for the next leg? Only one.
I’m picking $W, but this chart is ugly right now. Down 6.21% today to $0.009970, with the last 4h window down 6.7%. Bears are leaning hard. 🐻
RSI(14) is 33, volume is 1.3x the 20d average, and price is still below the 20d and 50d MAs. Funding at -0.013% says shorts are paying to stay crowded. That can fuel a snapback, but it does not erase the trend. ⚠️
At $0.0100, I want to see a clean reclaim and hold. Otherwise, this is just another failed bounce. Volume is $2.85M and W is still 42% below its 30d high. 👀
Would you back $W over $ETH here, and how does W react at $0.0100?
#W #Trading #Altcoin
$W or $ETH for the next leg? Only one.
I’m picking $W , but this chart is ugly right now. Down 6.21% today to $0.009970, with the last 4h window down 6.7%. Bears are leaning hard. 🐻
RSI(14) is 33, volume is 1.3x the 20d average, and price is still below the 20d and 50d MAs. Funding at -0.013% says shorts are paying to stay crowded. That can fuel a snapback, but it does not erase the trend. ⚠️
At $0.0100, I want to see a clean reclaim and hold. Otherwise, this is just another failed bounce. Volume is $2.85M and W is still 42% below its 30d high. 👀
Would you back $W over $ETH here, and how does W react at $0.0100?
#W #Trading #Altcoin
I’m picking $W , but this chart is ugly right now. Down 6.21% today to $0.009970, with the last 4h window down 6.7%. Bears are leaning hard. 🐻
RSI(14) is 33, volume is 1.3x the 20d average, and price is still below the 20d and 50d MAs. Funding at -0.013% says shorts are paying to stay crowded. That can fuel a snapback, but it does not erase the trend. ⚠️
At $0.0100, I want to see a clean reclaim and hold. Otherwise, this is just another failed bounce. Volume is $2.85M and W is still 42% below its 30d high. 👀
Would you back $W over $ETH here, and how does W react at $0.0100?
#W #Trading #Altcoin
48

$W 4H timeframe bearish signal triggered alert
📉 $W | 4-hour bearish signal
━━━━━━━━━━━━━━━━━━
Technical analysis: ADX (46) indicates extremely strong trend momentum; beware of the risk of an overbought pullback. MACD formed a death cross below the zero line, with bearish momentum strengthening. EMA5/8/13 are in bearish alignment. KDJ formed a death cross; K is 31.7 and D is 38.5, indicating a short-term bearish bias. Trading volume rose 1.8 times.
Price change: -1.4000%
━━━━━━━━━━━━━━━━━━
#技术分析 #W
📌 The above is for reference only and does not constitute investment advice
$W 4H timeframe bearish signal triggered alert
📉 $W | 4-hour bearish signal
━━━━━━━━━━━━━━━━━━
Technical analysis: ADX (46) indicates extremely strong trend momentum; beware of the risk of an overbought pullback. MACD formed a death cross below the zero line, with bearish momentum strengthening. EMA5/8/13 are in bearish alignment. KDJ formed a death cross; K is 31.7 and D is 38.5, indicating a short-term bearish bias. Trading volume rose 1.8 times.
Price change: -1.4000%
━━━━━━━━━━━━━━━━━━
#技术分析 #W
📌 The above is for reference only and does not constitute investment advice
📉 $W | 4-hour bearish signal
━━━━━━━━━━━━━━━━━━
Technical analysis: ADX (46) indicates extremely strong trend momentum; beware of the risk of an overbought pullback. MACD formed a death cross below the zero line, with bearish momentum strengthening. EMA5/8/13 are in bearish alignment. KDJ formed a death cross; K is 31.7 and D is 38.5, indicating a short-term bearish bias. Trading volume rose 1.8 times.
Price change: -1.4000%
━━━━━━━━━━━━━━━━━━
#技术分析 #W
📌 The above is for reference only and does not constitute investment advice
5

·
--
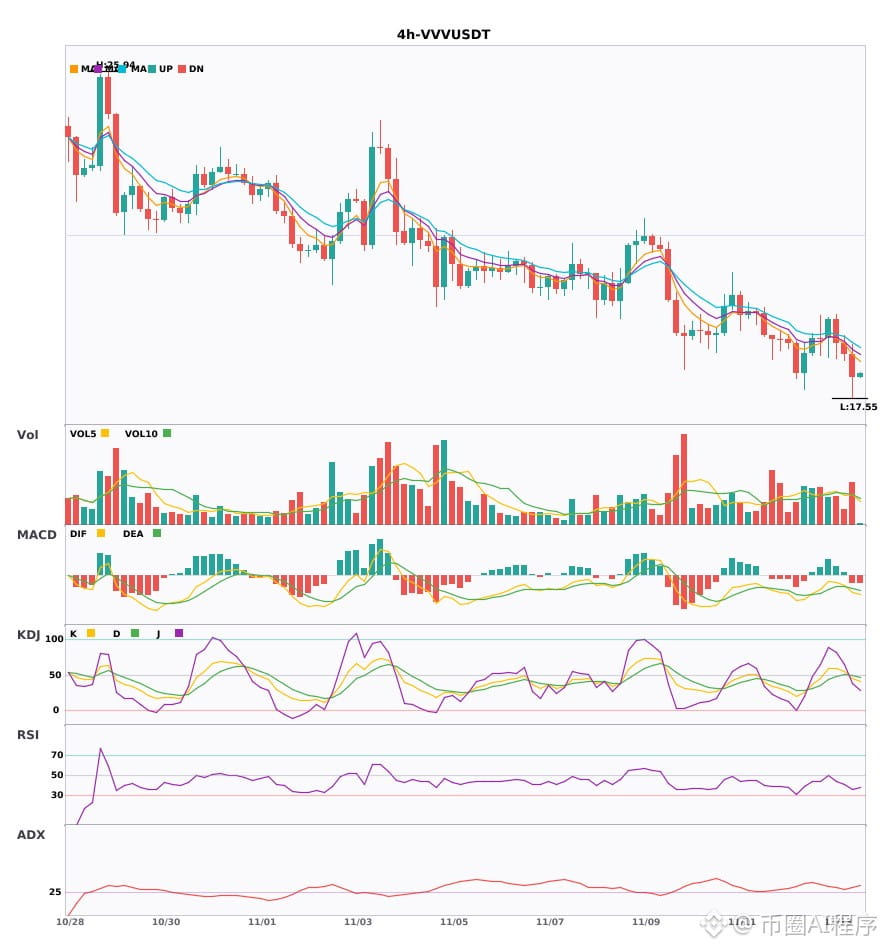
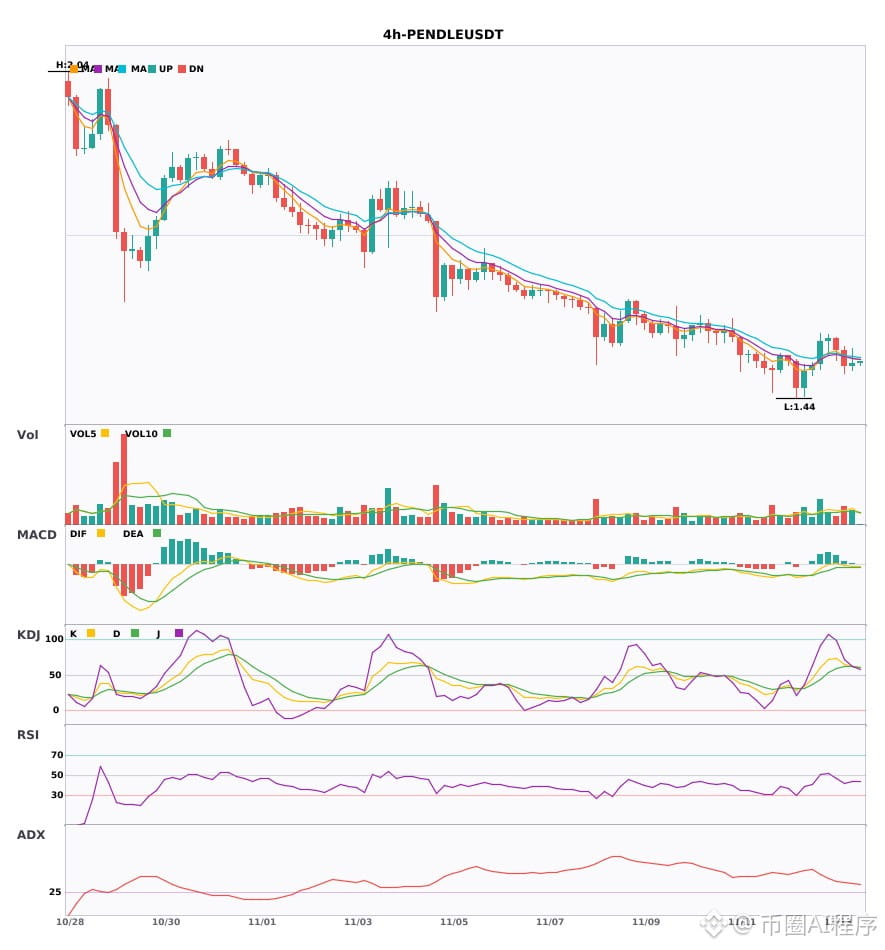
$W $VVV $PENDLE 4-hour and daily charts turn bearish together, confirming a resonant downturn 🔥
════════════════════
🟢 $W 4-hour bearish signal
⚠️ Technical analysis: Multi-timeframe bearish confluence: 4-hour MACD bearish crossover with rising volume; green bars continue to expand; moving averages are bearishly aligned and diverging downward; KDJ K crosses below D without being oversold; daily-chart bearish confluence confirmed
════════════════════
🟢 $VVV 4-hour bearish signal
⚠️ Technical analysis: 4-hour MACD bearish crossover below zero, with expanding green bars; moving averages are bearishly aligned and diverging downward; K line crosses below D line; daily-chart bearish confluence confirmed
════════════════════
🟢 $PENDLE 4-hour bearish signal
⚠️ Technical analysis: Daily-chart bearish trend confirmed; 4-hour EMA5 crosses below EMA8, turning bearish; multi-timeframe confluence is bearish. KDJ has not weakened yet (K61.5 D61.4); volume is normal.
════════════════════
🔔 Follow for first-hand market updates 🔔
#多周期共振 #W #VVV #PENDLE
📌 When trading, pay attention to whether the candlestick patterns align
$W $VVV $PENDLE 4-hour and daily charts turn bearish together, confirming a resonant downturn 🔥
════════════════════
🟢 $W 4-hour bearish signal
⚠️ Technical analysis: Multi-timeframe bearish confluence: 4-hour MACD bearish crossover with rising volume; green bars continue to expand; moving averages are bearishly aligned and diverging downward; KDJ K crosses below D without being oversold; daily-chart bearish confluence confirmed
════════════════════
🟢 $VVV 4-hour bearish signal
⚠️ Technical analysis: 4-hour MACD bearish crossover below zero, with expanding green bars; moving averages are bearishly aligned and diverging downward; K line crosses below D line; daily-chart bearish confluence confirmed
════════════════════
🟢 $PENDLE 4-hour bearish signal
⚠️ Technical analysis: Daily-chart bearish trend confirmed; 4-hour EMA5 crosses below EMA8, turning bearish; multi-timeframe confluence is bearish. KDJ has not weakened yet (K61.5 D61.4); volume is normal.
════════════════════
🔔 Follow for first-hand market updates 🔔
#多周期共振 #W #VVV #PENDLE
📌 When trading, pay attention to whether the candlestick patterns align
════════════════════
🟢 $W 4-hour bearish signal
⚠️ Technical analysis: Multi-timeframe bearish confluence: 4-hour MACD bearish crossover with rising volume; green bars continue to expand; moving averages are bearishly aligned and diverging downward; KDJ K crosses below D without being oversold; daily-chart bearish confluence confirmed
════════════════════
🟢 $VVV 4-hour bearish signal
⚠️ Technical analysis: 4-hour MACD bearish crossover below zero, with expanding green bars; moving averages are bearishly aligned and diverging downward; K line crosses below D line; daily-chart bearish confluence confirmed
════════════════════
🟢 $PENDLE 4-hour bearish signal
⚠️ Technical analysis: Daily-chart bearish trend confirmed; 4-hour EMA5 crosses below EMA8, turning bearish; multi-timeframe confluence is bearish. KDJ has not weakened yet (K61.5 D61.4); volume is normal.
════════════════════
🔔 Follow for first-hand market updates 🔔
#多周期共振 #W #VVV #PENDLE
📌 When trading, pay attention to whether the candlestick patterns align
16

·
--
$W 4-hour moving averages are weakening; watch for pullback risk 🔥
════════════════════
🟢 $W 4-hour bearish signal
⚠️ Technical analysis: The trend is strong, but beware of a pullback. The MACD bearish crossover below zero is accelerating bearish momentum. The moving averages are bearishly aligned and trending downward. The KDJ has a bearish crossover, with K at 31.7 and D at 38.5. Trading volume increased 1.8x.
════════════════════
🔔 Follow for first-hand market updates and unusual movements 🔔
#技术分析 #W
📌 When trading, pay attention to whether the candlestick pattern confirms the signal
$W 4-hour moving averages are weakening; watch for pullback risk 🔥
════════════════════
🟢 $W 4-hour bearish signal
⚠️ Technical analysis: The trend is strong, but beware of a pullback. The MACD bearish crossover below zero is accelerating bearish momentum. The moving averages are bearishly aligned and trending downward. The KDJ has a bearish crossover, with K at 31.7 and D at 38.5. Trading volume increased 1.8x.
════════════════════
🔔 Follow for first-hand market updates and unusual movements 🔔
#技术分析 #W
📌 When trading, pay attention to whether the candlestick pattern confirms the signal
════════════════════
🟢 $W 4-hour bearish signal
⚠️ Technical analysis: The trend is strong, but beware of a pullback. The MACD bearish crossover below zero is accelerating bearish momentum. The moving averages are bearishly aligned and trending downward. The KDJ has a bearish crossover, with K at 31.7 and D at 38.5. Trading volume increased 1.8x.
════════════════════
🔔 Follow for first-hand market updates and unusual movements 🔔
#技术分析 #W
📌 When trading, pay attention to whether the candlestick pattern confirms the signal
8
·
--
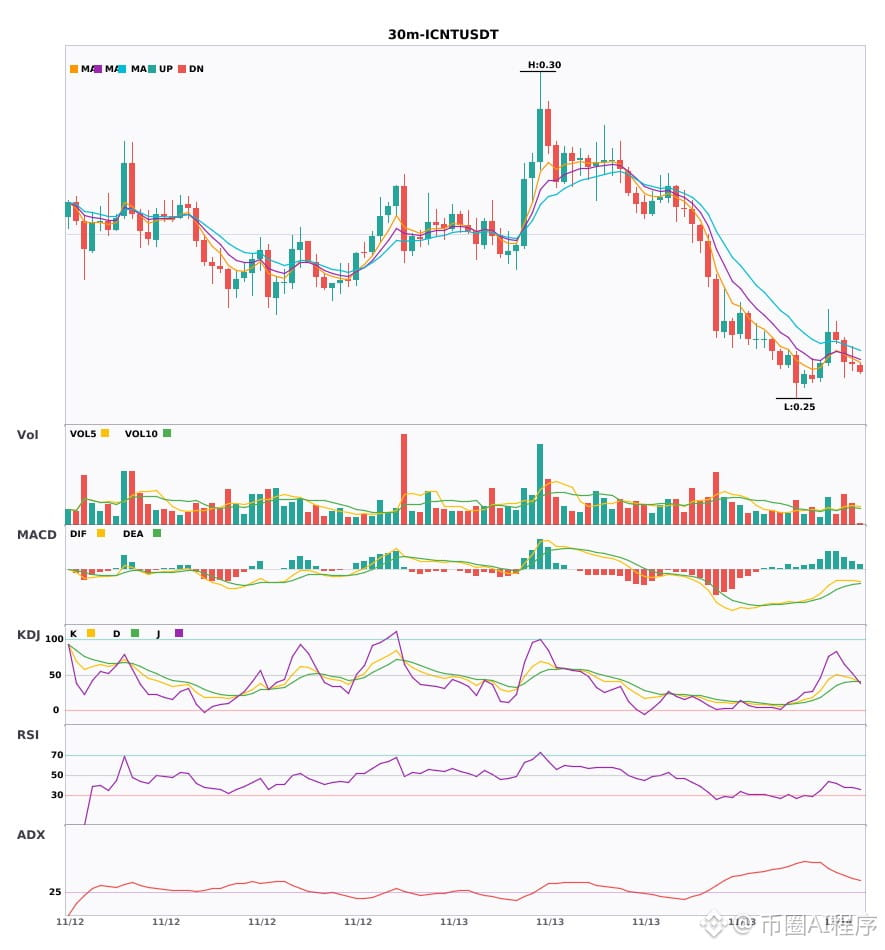
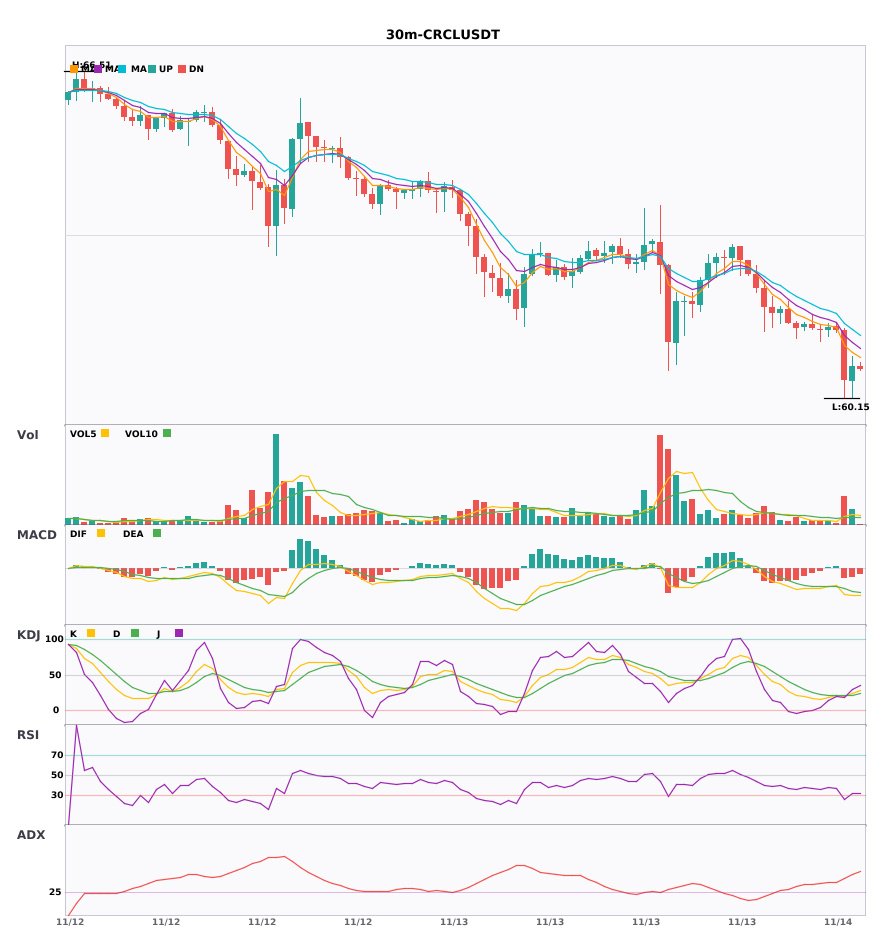
$W/$ICNT/$CRCL 30-minute weakness; 4-hour bears pushing prices lower 🔥
════════════════════
🟢 $W 30-minute bearish signal
⚠️Technical analysis: Multiple timeframes align bearishly: 4-hour bearish trend + 30-minute entry. MACD bearish crossover with rising volume; moving averages diverging downward in a bearish alignment; KDJ bearish crossover, not yet oversold; volume surges 5x.
════════════════════
🟢 $ICNT 30-minute bearish signal
⚠️Technical analysis: Multiple timeframes align bearishly: 4-hour bearish trend confirmed + 30-minute EMA5 crossing below EMA8, forming a bearish alignment; K crosses below D in KDJ, which is trending weakly; volume increases 1.8x. A confluence short signal.
════════════════════
🟢 $CRCL 30-minute bearish signal
⚠️Technical analysis: Multiple timeframes align for a short: 4-hour bearish trend + 30-minute confirmation. MACD bearish crossover below zero with rising volume; moving averages in a bearish alignment, diverging downward; KDJ is weak but not oversold; volume surges 3.9x, accelerating the bearish move.
════════════════════
🔔 Follow for first-hand updates on unusual market moves 🔔
#多周期共振 #W #ICNT #CRCL
📌 When trading, pay attention to whether the candlestick pattern confirms the setup
$W /$ICNT /$CRCL 30-minute weakness; 4-hour bears pushing prices lower 🔥
════════════════════
🟢 $W 30-minute bearish signal
⚠️Technical analysis: Multiple timeframes align bearishly: 4-hour bearish trend + 30-minute entry. MACD bearish crossover with rising volume; moving averages diverging downward in a bearish alignment; KDJ bearish crossover, not yet oversold; volume surges 5x.
════════════════════
🟢 $ICNT 30-minute bearish signal
⚠️Technical analysis: Multiple timeframes align bearishly: 4-hour bearish trend confirmed + 30-minute EMA5 crossing below EMA8, forming a bearish alignment; K crosses below D in KDJ, which is trending weakly; volume increases 1.8x. A confluence short signal.
════════════════════
🟢 $CRCL 30-minute bearish signal
⚠️Technical analysis: Multiple timeframes align for a short: 4-hour bearish trend + 30-minute confirmation. MACD bearish crossover below zero with rising volume; moving averages in a bearish alignment, diverging downward; KDJ is weak but not oversold; volume surges 3.9x, accelerating the bearish move.
════════════════════
🔔 Follow for first-hand updates on unusual market moves 🔔
#多周期共振 #W #ICNT #CRCL
📌 When trading, pay attention to whether the candlestick pattern confirms the setup
════════════════════
🟢 $W 30-minute bearish signal
⚠️Technical analysis: Multiple timeframes align bearishly: 4-hour bearish trend + 30-minute entry. MACD bearish crossover with rising volume; moving averages diverging downward in a bearish alignment; KDJ bearish crossover, not yet oversold; volume surges 5x.
════════════════════
🟢 $ICNT 30-minute bearish signal
⚠️Technical analysis: Multiple timeframes align bearishly: 4-hour bearish trend confirmed + 30-minute EMA5 crossing below EMA8, forming a bearish alignment; K crosses below D in KDJ, which is trending weakly; volume increases 1.8x. A confluence short signal.
════════════════════
🟢 $CRCL 30-minute bearish signal
⚠️Technical analysis: Multiple timeframes align for a short: 4-hour bearish trend + 30-minute confirmation. MACD bearish crossover below zero with rising volume; moving averages in a bearish alignment, diverging downward; KDJ is weak but not oversold; volume surges 3.9x, accelerating the bearish move.
════════════════════
🔔 Follow for first-hand updates on unusual market moves 🔔
#多周期共振 #W #ICNT #CRCL
📌 When trading, pay attention to whether the candlestick pattern confirms the setup
28
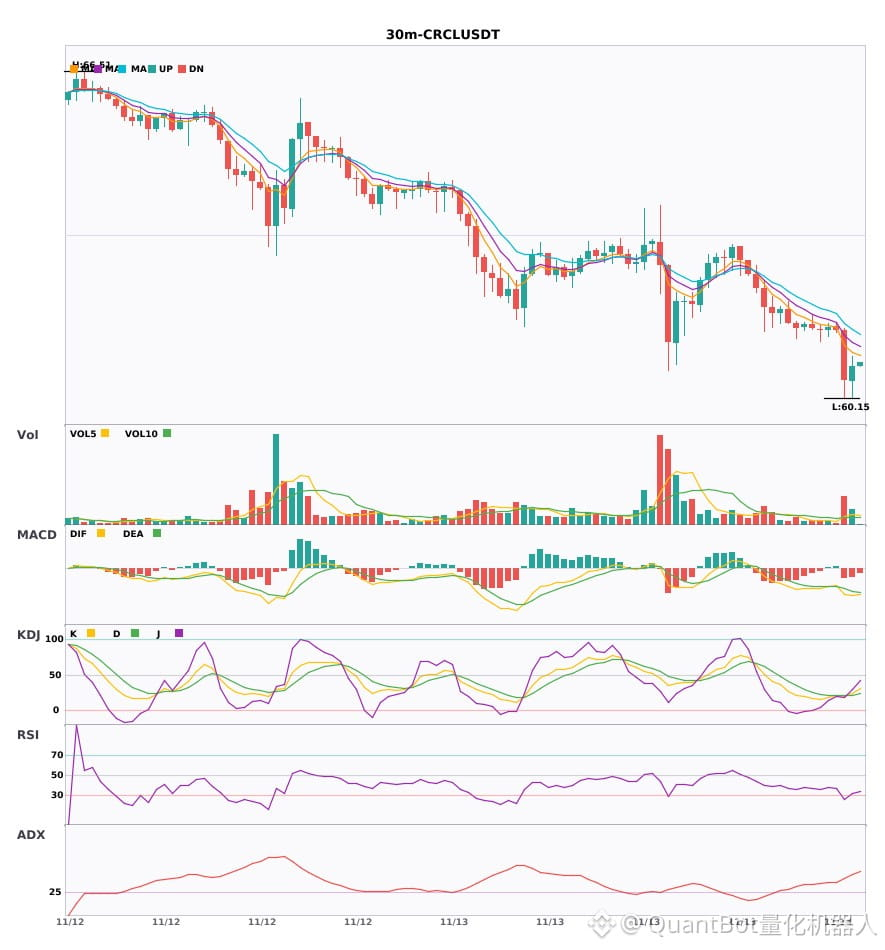
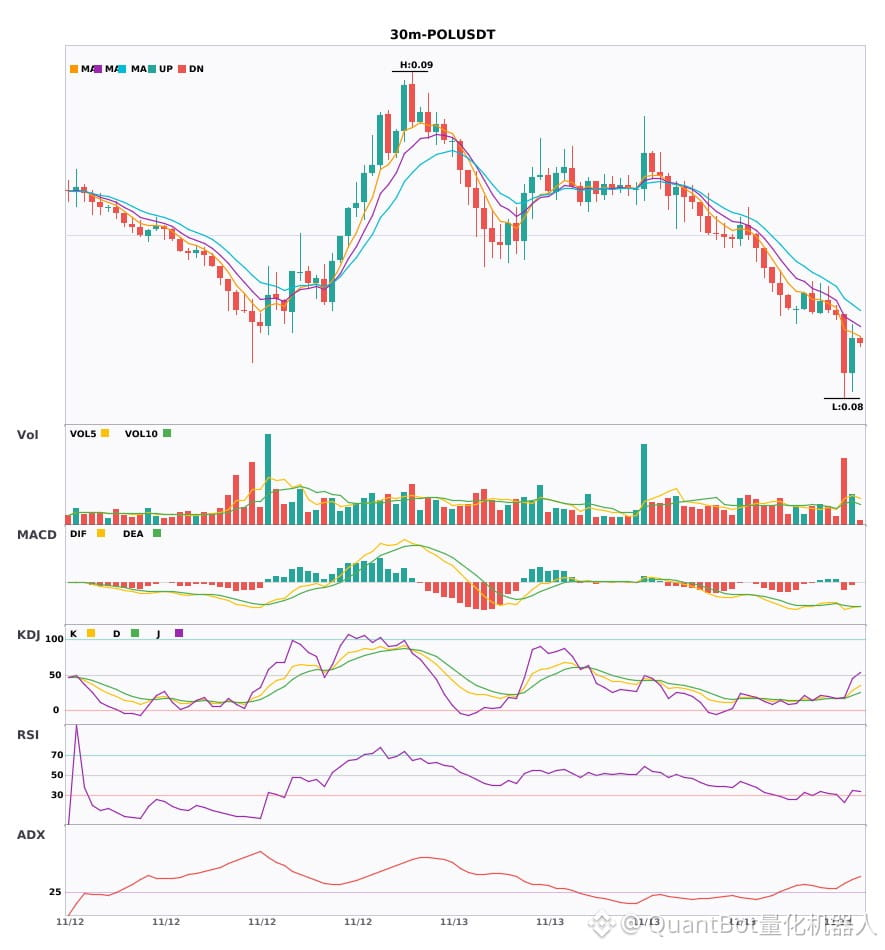
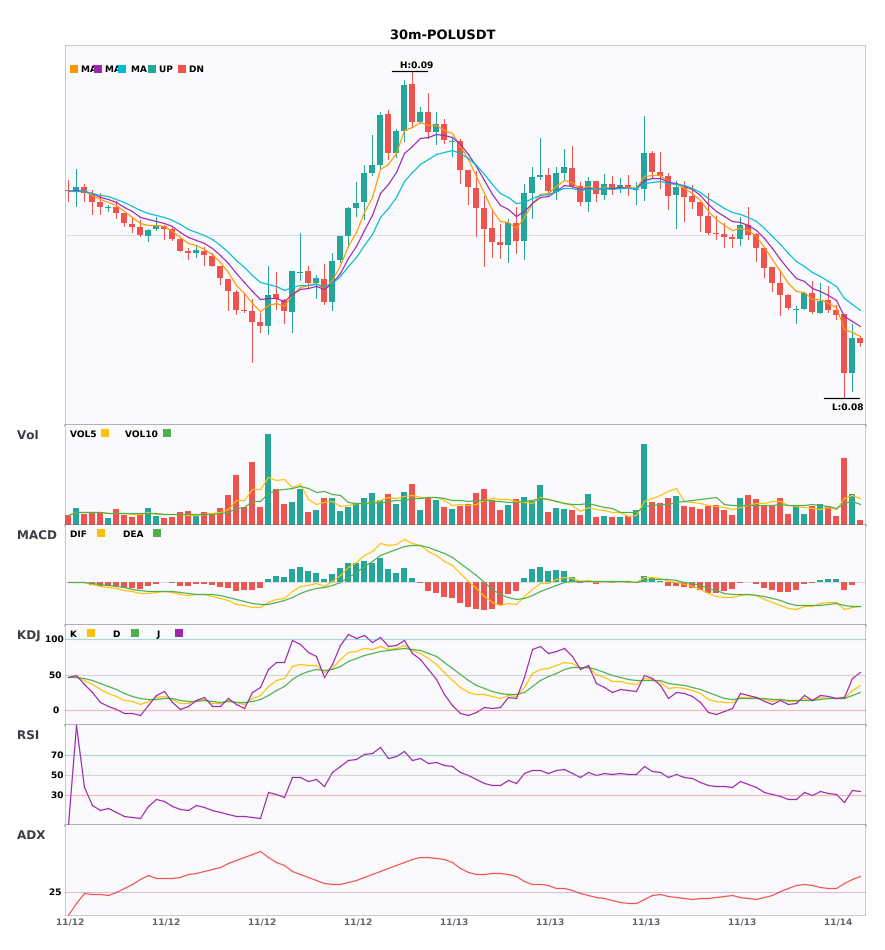
$W $CRCL $POL 30-minute bearish signals, short-term downward pressure
📉 $W | 30-minute bearish signal
━━━━━━━━━━━━━━━━━━
Technical analysis: ADX (36) indicates a strong trend; MACD bearish cross below zero accelerates downward momentum; EMA 5/8/13 are bearishly aligned; KDJ bearish (K27.6/D30.0); volume up 5.4x.
Price change: -2.0900%
📉 $CRCL | 30-minute bearish signal
━━━━━━━━━━━━━━━━━━
Technical analysis: ADX (44) indicates a significant trend; MACD bearish cross below zero favors bears; EMA5<EMA8<EMA13 are bearishly aligned; KDJ is weak (K19.9/D20.7); volume up 3.9x.
Price change: -1.5800%
📉 $POL | 30-minute bearish signal
━━━━━━━━━━━━━━━━━━
Technical analysis: ADX (37) indicates a clear trend; MACD bearish cross below zero; EMAs are bearishly aligned; KDJ is oversold (K17.6, D16.9); volume up 3.1x—watch for a rebound.
Price change: -1.5400%
━━━━━━━━━━━━━━━━━━
#技术分析 #W #CRCL #POL
📌 The above content is for reference only and does not constitute investment advice
$W $CRCL $POL 30-minute bearish signals, short-term downward pressure
📉 $W | 30-minute bearish signal
━━━━━━━━━━━━━━━━━━
Technical analysis: ADX (36) indicates a strong trend; MACD bearish cross below zero accelerates downward momentum; EMA 5/8/13 are bearishly aligned; KDJ bearish (K27.6/D30.0); volume up 5.4x.
Price change: -2.0900%
📉 $CRCL | 30-minute bearish signal
━━━━━━━━━━━━━━━━━━
Technical analysis: ADX (44) indicates a significant trend; MACD bearish cross below zero favors bears; EMA5<EMA8<EMA13 are bearishly aligned; KDJ is weak (K19.9/D20.7); volume up 3.9x.
Price change: -1.5800%
📉 $POL | 30-minute bearish signal
━━━━━━━━━━━━━━━━━━
Technical analysis: ADX (37) indicates a clear trend; MACD bearish cross below zero; EMAs are bearishly aligned; KDJ is oversold (K17.6, D16.9); volume up 3.1x—watch for a rebound.
Price change: -1.5400%
━━━━━━━━━━━━━━━━━━
#技术分析 #W #CRCL #POL
📌 The above content is for reference only and does not constitute investment advice
📉 $W | 30-minute bearish signal
━━━━━━━━━━━━━━━━━━
Technical analysis: ADX (36) indicates a strong trend; MACD bearish cross below zero accelerates downward momentum; EMA 5/8/13 are bearishly aligned; KDJ bearish (K27.6/D30.0); volume up 5.4x.
Price change: -2.0900%
📉 $CRCL | 30-minute bearish signal
━━━━━━━━━━━━━━━━━━
Technical analysis: ADX (44) indicates a significant trend; MACD bearish cross below zero favors bears; EMA5<EMA8<EMA13 are bearishly aligned; KDJ is weak (K19.9/D20.7); volume up 3.9x.
Price change: -1.5800%
📉 $POL | 30-minute bearish signal
━━━━━━━━━━━━━━━━━━
Technical analysis: ADX (37) indicates a clear trend; MACD bearish cross below zero; EMAs are bearishly aligned; KDJ is oversold (K17.6, D16.9); volume up 3.1x—watch for a rebound.
Price change: -1.5400%
━━━━━━━━━━━━━━━━━━
#技术分析 #W #CRCL #POL
📌 The above content is for reference only and does not constitute investment advice
3
·
--
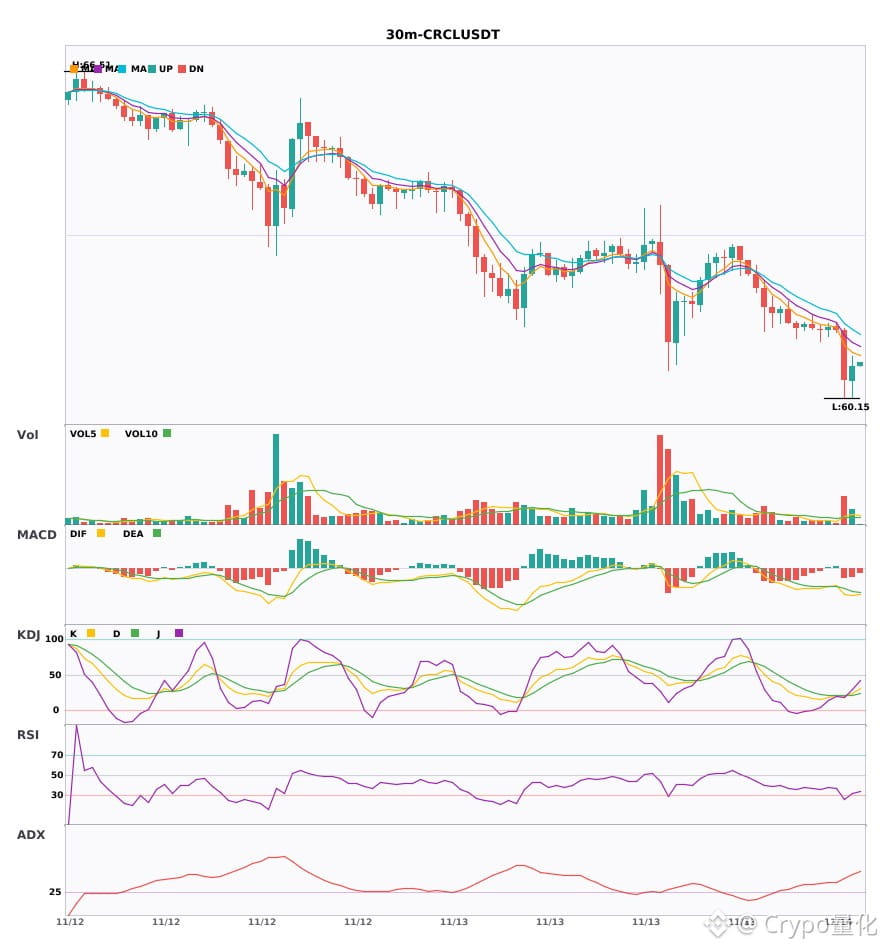
$W/$CRCL/$POL 30-minute short signal, beware of a pullback🔥
════════════════════
🟢 $W 30-minute short signal
⚠️Technical analysis: ADX indicates a clear trend. The MACD bearish crossover is followed by expanding green bars, accelerating the downtrend. Moving averages are bearishly aligned and diverging downward. KDJ bearish crossover; K is at 27.6, not yet oversold. Trading volume has surged more than 5-fold.
════════════════════
🟢 $CRCL 30-minute short signal
⚠️Technical analysis: ADX at 44 indicates a clear trend. The MACD bearish crossover below zero is accelerating the downtrend. Moving averages are bearishly aligned. KDJ is weak, with K below D (19.9/20.7). Volume is up 3.9-fold; bears are in control.
════════════════════
🟢 $POL 30-minute short signal
⚠️Technical analysis: Clear trend. The MACD bearish crossover is driving a high-volume decline. Moving averages have just formed a bearish alignment. KDJ has entered the oversold zone, and K crossing above D hints at a possible rebound. Volume has surged more than 3-fold.
════════════════════
🔔 Follow for first-hand market updates and unusual moves 🔔
#技术分析 #W #CRCL #POL
📌 When trading, pay attention to whether the candlestick pattern confirms the signal.
$W /$CRCL /$POL 30-minute short signal, beware of a pullback🔥
════════════════════
🟢 $W 30-minute short signal
⚠️Technical analysis: ADX indicates a clear trend. The MACD bearish crossover is followed by expanding green bars, accelerating the downtrend. Moving averages are bearishly aligned and diverging downward. KDJ bearish crossover; K is at 27.6, not yet oversold. Trading volume has surged more than 5-fold.
════════════════════
🟢 $CRCL 30-minute short signal
⚠️Technical analysis: ADX at 44 indicates a clear trend. The MACD bearish crossover below zero is accelerating the downtrend. Moving averages are bearishly aligned. KDJ is weak, with K below D (19.9/20.7). Volume is up 3.9-fold; bears are in control.
════════════════════
🟢 $POL 30-minute short signal
⚠️Technical analysis: Clear trend. The MACD bearish crossover is driving a high-volume decline. Moving averages have just formed a bearish alignment. KDJ has entered the oversold zone, and K crossing above D hints at a possible rebound. Volume has surged more than 3-fold.
════════════════════
🔔 Follow for first-hand market updates and unusual moves 🔔
#技术分析 #W #CRCL #POL
📌 When trading, pay attention to whether the candlestick pattern confirms the signal.
════════════════════
🟢 $W 30-minute short signal
⚠️Technical analysis: ADX indicates a clear trend. The MACD bearish crossover is followed by expanding green bars, accelerating the downtrend. Moving averages are bearishly aligned and diverging downward. KDJ bearish crossover; K is at 27.6, not yet oversold. Trading volume has surged more than 5-fold.
════════════════════
🟢 $CRCL 30-minute short signal
⚠️Technical analysis: ADX at 44 indicates a clear trend. The MACD bearish crossover below zero is accelerating the downtrend. Moving averages are bearishly aligned. KDJ is weak, with K below D (19.9/20.7). Volume is up 3.9-fold; bears are in control.
════════════════════
🟢 $POL 30-minute short signal
⚠️Technical analysis: Clear trend. The MACD bearish crossover is driving a high-volume decline. Moving averages have just formed a bearish alignment. KDJ has entered the oversold zone, and K crossing above D hints at a possible rebound. Volume has surged more than 3-fold.
════════════════════
🔔 Follow for first-hand market updates and unusual moves 🔔
#技术分析 #W #CRCL #POL
📌 When trading, pay attention to whether the candlestick pattern confirms the signal.
25
$W daily technical indicators weaken, expanding downside risk exposure
📉 $W | Daily bearish signal
━━━━━━━━━━━━━━━━━━
Technical analysis: ADX(27) trend established, participation advisable; MACD death cross below zero, bearish momentum accelerating; EMA5<8<13 bearish alignment; KDJ weak (K18.0/D25.2); volume is 1.2x normal.
Price change: -4.6500%
━━━━━━━━━━━━━━━━━━
#技术分析 #W
📌 The above is for reference only and does not constitute investment advice
$W daily technical indicators weaken, expanding downside risk exposure
📉 $W | Daily bearish signal
━━━━━━━━━━━━━━━━━━
Technical analysis: ADX(27) trend established, participation advisable; MACD death cross below zero, bearish momentum accelerating; EMA5<8<13 bearish alignment; KDJ weak (K18.0/D25.2); volume is 1.2x normal.
Price change: -4.6500%
━━━━━━━━━━━━━━━━━━
#技术分析 #W
📌 The above is for reference only and does not constitute investment advice
📉 $W | Daily bearish signal
━━━━━━━━━━━━━━━━━━
Technical analysis: ADX(27) trend established, participation advisable; MACD death cross below zero, bearish momentum accelerating; EMA5<8<13 bearish alignment; KDJ weak (K18.0/D25.2); volume is 1.2x normal.
Price change: -4.6500%
━━━━━━━━━━━━━━━━━━
#技术分析 #W
📌 The above is for reference only and does not constitute investment advice
7

·
--
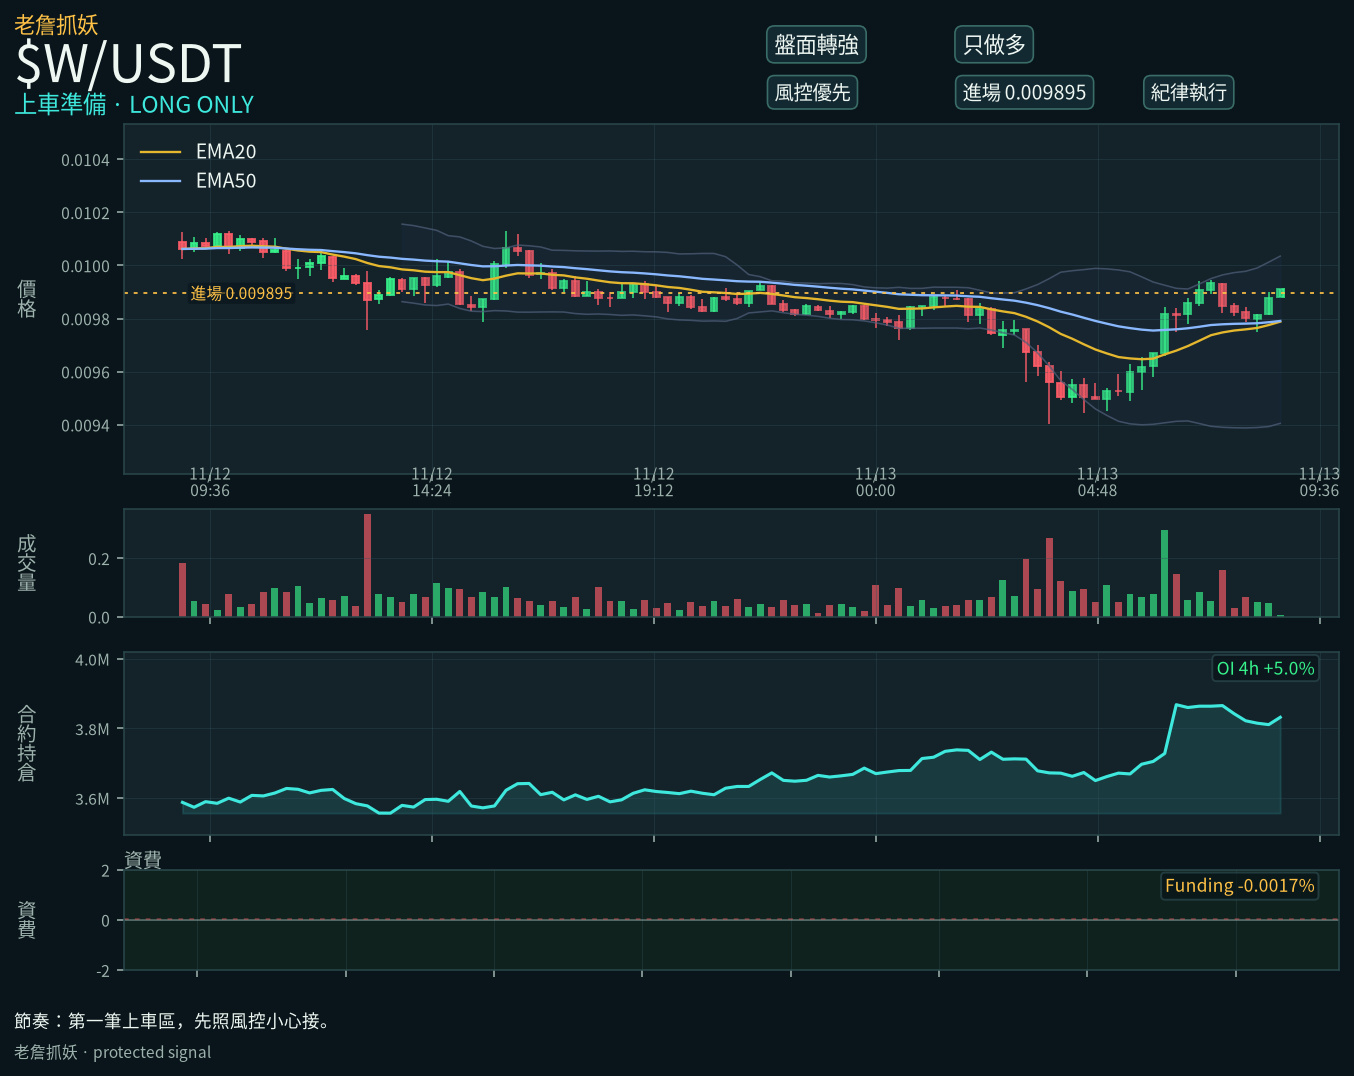
$W Buyers are starting to step in at the bottom.
Buyers have been in control for the past 4 hours, and the price is still hovering near its 2-day low.
The problem is that the broader market is still weighing it down, and futures haven't followed yet.
Keep it light—half a position is enough.
Stop-loss at 0.008411; first target is 0.01088. Reduce the position by 30% when it gets there.
#W #futures
$W Buyers are starting to step in at the bottom.
Buyers have been in control for the past 4 hours, and the price is still hovering near its 2-day low.
The problem is that the broader market is still weighing it down, and futures haven't followed yet.
Keep it light—half a position is enough.
Stop-loss at 0.008411; first target is 0.01088. Reduce the position by 30% when it gets there.
#W #futures
Buyers have been in control for the past 4 hours, and the price is still hovering near its 2-day low.
The problem is that the broader market is still weighing it down, and futures haven't followed yet.
Keep it light—half a position is enough.
Stop-loss at 0.008411; first target is 0.01088. Reduce the position by 30% when it gets there.
#W #futures
22
·
--
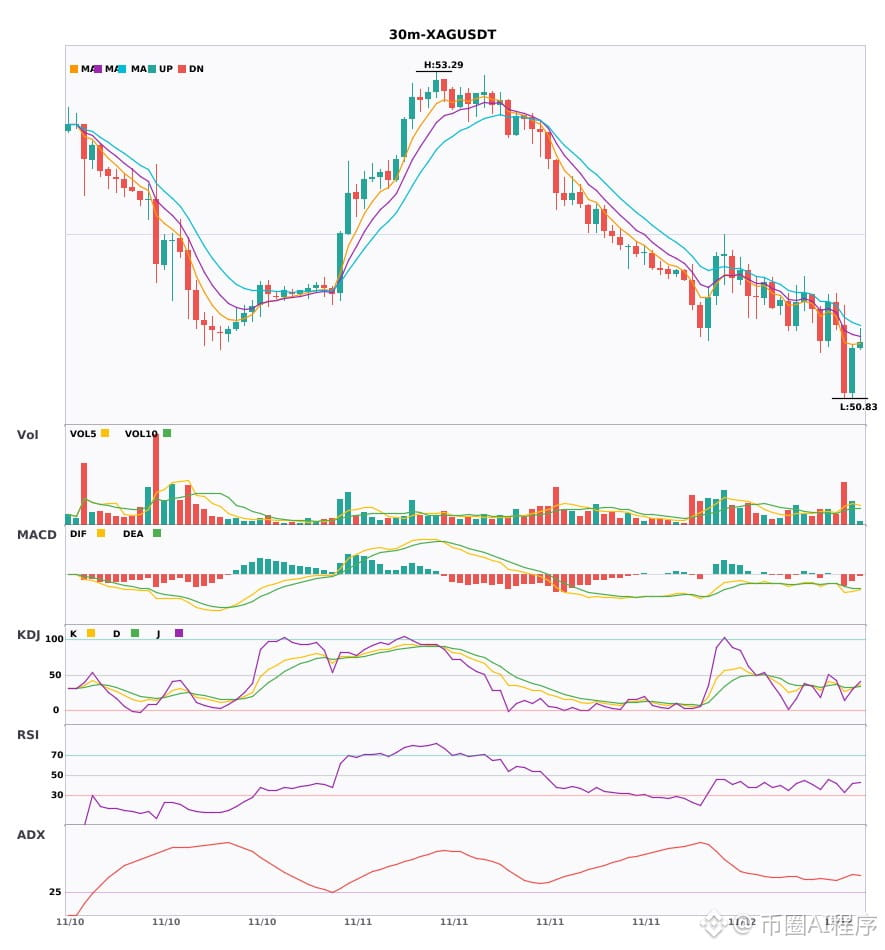
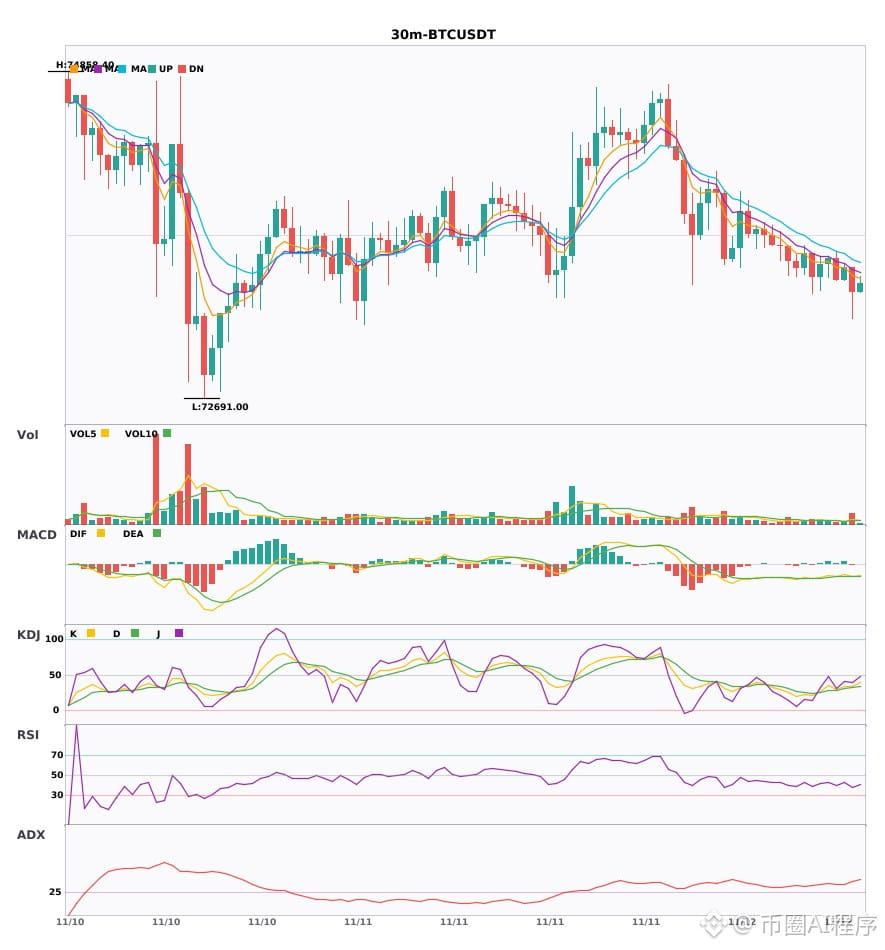
Multi-timeframe alignment: $XAG / $W / $BTC weakening on the 30-minute timeframe; 4-hour bearish trend confirmed 🔥
════════════════════
🟢 $XAG 30-minute bearish signal
⚠️ Technicals: 4-hour bearish alignment confirmed | 30-minute entry: MACD death cross below zero, bearish momentum accelerating | EMA5 < EMA8 < EMA13, bearish alignment | KDJ death cross, short-term outlook bearish (K: 26.8, D: 33.2) | Volume surge (2.8x)
════════════════════
🟢 $W 30-minute bearish signal
⚠️ Technicals: 4-hour bearish alignment confirmed | 30-minute entry: MACD death cross below zero, bearish momentum accelerating | EMA5 < EMA8 < EMA13, bearish alignment | KDJ trading weakly, bears in control (K: 28.8, D: 37.4) | Volume surge (4.3x)
════════════════════
🟢 $BTC 30-minute bearish signal
⚠️ Technicals: 4-hour bearish alignment confirmed | 30-minute entry: MACD death cross below zero, bearish momentum accelerating | EMA5 < EMA8 < EMA13, bearish alignment | KDJ trading weakly, bears in control (K: 34.4, D: 31.8) | Volume increase (2.3x)
📢 Market update: Buying Bitcoin without betting on a rally may not pay - Buying Bitcoin while hedging against a price drop can earn a return without a rally. But November 10 pricing offered about $119 per BTC before costs, ...
════════════════════
🔔 Follow for the latest market movements 🔔
#多周期共振 #XAG #W #BTC
📌 When trading, pay attention to whether the candlestick pattern matches
Multi-timeframe alignment: $XAG / $W / $BTC weakening on the 30-minute timeframe; 4-hour bearish trend confirmed 🔥
════════════════════
🟢 $XAG 30-minute bearish signal
⚠️ Technicals: 4-hour bearish alignment confirmed | 30-minute entry: MACD death cross below zero, bearish momentum accelerating | EMA5 < EMA8 < EMA13, bearish alignment | KDJ death cross, short-term outlook bearish (K: 26.8, D: 33.2) | Volume surge (2.8x)
════════════════════
🟢 $W 30-minute bearish signal
⚠️ Technicals: 4-hour bearish alignment confirmed | 30-minute entry: MACD death cross below zero, bearish momentum accelerating | EMA5 < EMA8 < EMA13, bearish alignment | KDJ trading weakly, bears in control (K: 28.8, D: 37.4) | Volume surge (4.3x)
════════════════════
🟢 $BTC 30-minute bearish signal
⚠️ Technicals: 4-hour bearish alignment confirmed | 30-minute entry: MACD death cross below zero, bearish momentum accelerating | EMA5 < EMA8 < EMA13, bearish alignment | KDJ trading weakly, bears in control (K: 34.4, D: 31.8) | Volume increase (2.3x)
📢 Market update: Buying Bitcoin without betting on a rally may not pay - Buying Bitcoin while hedging against a price drop can earn a return without a rally. But November 10 pricing offered about $119 per BTC before costs, ...
════════════════════
🔔 Follow for the latest market movements 🔔
#多周期共振 #XAG #W #BTC
📌 When trading, pay attention to whether the candlestick pattern matches
════════════════════
🟢 $XAG 30-minute bearish signal
⚠️ Technicals: 4-hour bearish alignment confirmed | 30-minute entry: MACD death cross below zero, bearish momentum accelerating | EMA5 < EMA8 < EMA13, bearish alignment | KDJ death cross, short-term outlook bearish (K: 26.8, D: 33.2) | Volume surge (2.8x)
════════════════════
🟢 $W 30-minute bearish signal
⚠️ Technicals: 4-hour bearish alignment confirmed | 30-minute entry: MACD death cross below zero, bearish momentum accelerating | EMA5 < EMA8 < EMA13, bearish alignment | KDJ trading weakly, bears in control (K: 28.8, D: 37.4) | Volume surge (4.3x)
════════════════════
🟢 $BTC 30-minute bearish signal
⚠️ Technicals: 4-hour bearish alignment confirmed | 30-minute entry: MACD death cross below zero, bearish momentum accelerating | EMA5 < EMA8 < EMA13, bearish alignment | KDJ trading weakly, bears in control (K: 34.4, D: 31.8) | Volume increase (2.3x)
📢 Market update: Buying Bitcoin without betting on a rally may not pay - Buying Bitcoin while hedging against a price drop can earn a return without a rally. But November 10 pricing offered about $119 per BTC before costs, ...
════════════════════
🔔 Follow for the latest market movements 🔔
#多周期共振 #XAG #W #BTC
📌 When trading, pay attention to whether the candlestick pattern matches
4

·
--
Bearish
$W DON'T SELL YOUR FUTURE FOR A SMALL PROFIT 📈
One thing I have noticed in the crypto market is that many investors have no clear profit target.
They buy a cryptocurrency with big expectations.
They imagine making 10x or even 100x.
But when the price increases by 10% or 20%, they immediately sell.
There is nothing wrong with taking profits.
Everyone has different financial goals.
But the real question is whether you have a strategy before entering the market.
If you bought a project because you believed in its long-term potential, why are you changing your decision every few days?
Did something change in the project?
Did its development stop?
Did its fundamentals become weaker?
Or are you simply afraid that the market might drop?
These are important questions.
I believe every investor should decide in advance how much profit they want to take.
Some may prefer 2x.
Others may wait for 5x or 10x.
Some may keep a small portion for a longer period.
But nobody should assume that every coin will eventually reach their dream target.
The market doesn't follow our expectations.
Take profits when your plan says so, and never risk everything for an unrealistic target.
My strategy is to focus on research rather than daily excitement.
What's your profit target?
Do you prefer taking small profits regularly or holding a portion for bigger long-term opportunities? #ARB #BTC #w
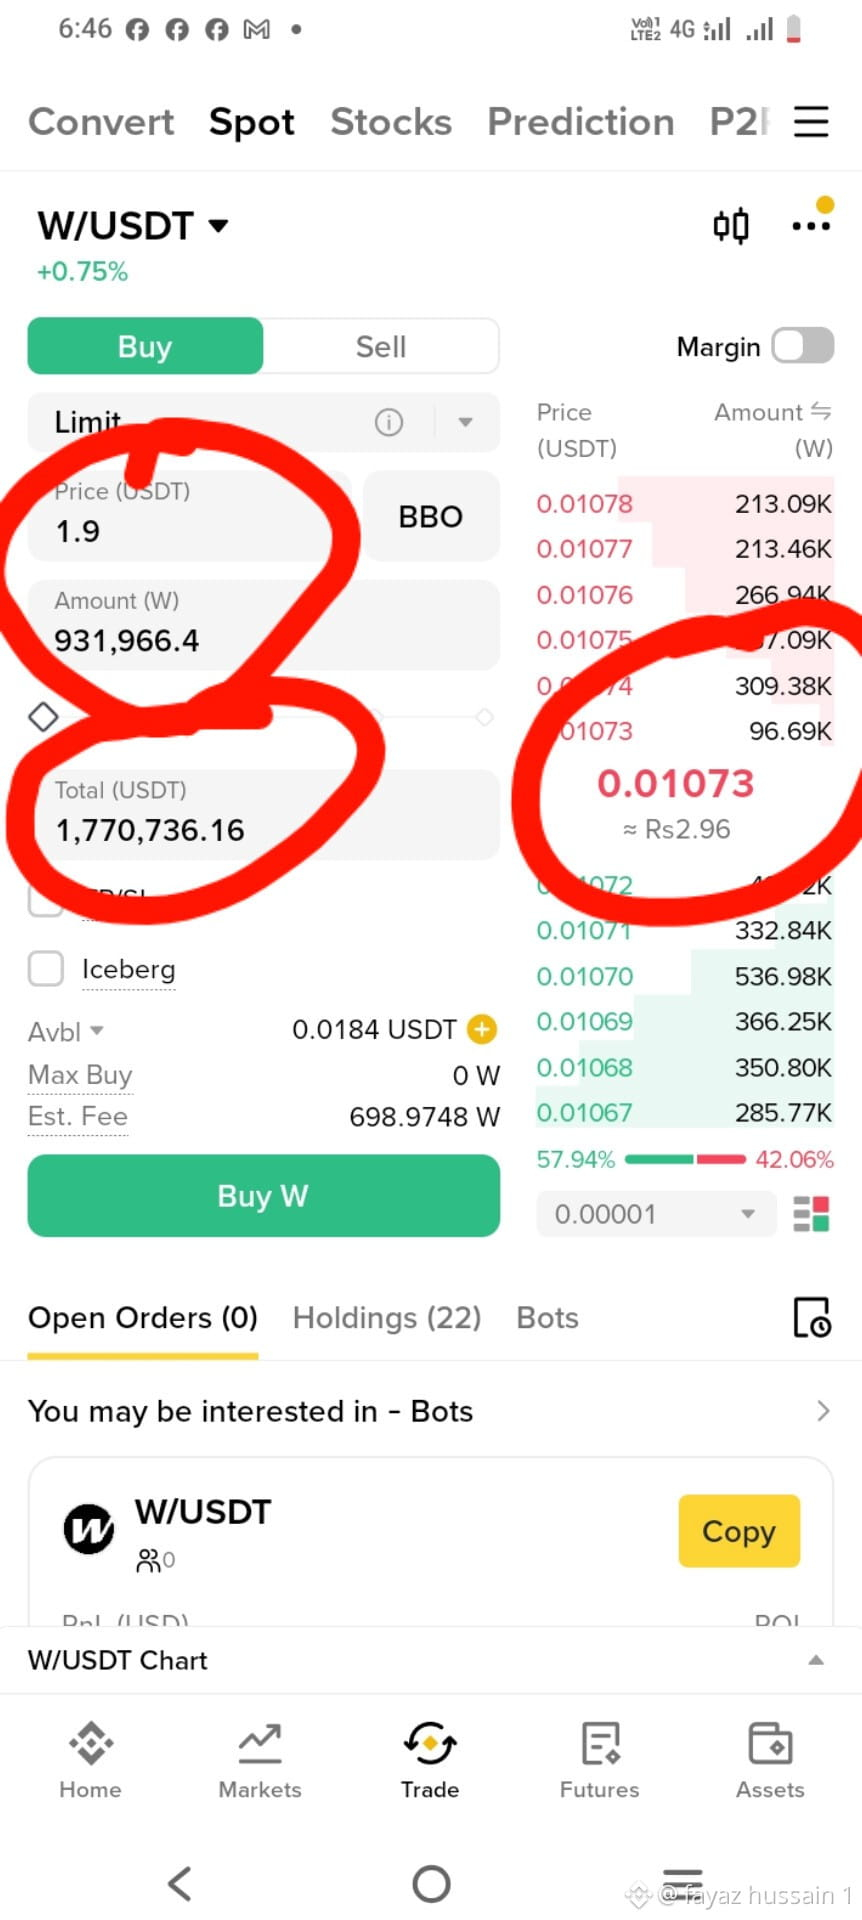
{spot}(WUSDT)
$BTC
{spot}(BTCUSDT)
$ARB
{spot}(ARBUSDT)
$W DON'T SELL YOUR FUTURE FOR A SMALL PROFIT 📈
One thing I have noticed in the crypto market is that many investors have no clear profit target.
They buy a cryptocurrency with big expectations.
They imagine making 10x or even 100x.
But when the price increases by 10% or 20%, they immediately sell.
There is nothing wrong with taking profits.
Everyone has different financial goals.
But the real question is whether you have a strategy before entering the market.
If you bought a project because you believed in its long-term potential, why are you changing your decision every few days?
Did something change in the project?
Did its development stop?
Did its fundamentals become weaker?
Or are you simply afraid that the market might drop?
These are important questions.
I believe every investor should decide in advance how much profit they want to take.
Some may prefer 2x.
Others may wait for 5x or 10x.
Some may keep a small portion for a longer period.
But nobody should assume that every coin will eventually reach their dream target.
The market doesn't follow our expectations.
Take profits when your plan says so, and never risk everything for an unrealistic target.
My strategy is to focus on research rather than daily excitement.
What's your profit target?
Do you prefer taking small profits regularly or holding a portion for bigger long-term opportunities? #ARB #BTC #w
$BTC
$ARB
One thing I have noticed in the crypto market is that many investors have no clear profit target.
They buy a cryptocurrency with big expectations.
They imagine making 10x or even 100x.
But when the price increases by 10% or 20%, they immediately sell.
There is nothing wrong with taking profits.
Everyone has different financial goals.
But the real question is whether you have a strategy before entering the market.
If you bought a project because you believed in its long-term potential, why are you changing your decision every few days?
Did something change in the project?
Did its development stop?
Did its fundamentals become weaker?
Or are you simply afraid that the market might drop?
These are important questions.
I believe every investor should decide in advance how much profit they want to take.
Some may prefer 2x.
Others may wait for 5x or 10x.
Some may keep a small portion for a longer period.
But nobody should assume that every coin will eventually reach their dream target.
The market doesn't follow our expectations.
Take profits when your plan says so, and never risk everything for an unrealistic target.
My strategy is to focus on research rather than daily excitement.
What's your profit target?
Do you prefer taking small profits regularly or holding a portion for bigger long-term opportunities? #ARB #BTC #w
$BTC
$ARB
138

·
--
$W has one level that matters right now at $0.01196
That ceiling sits 6.4 percent above current spot near $0.01124
A clean hourly close through that pocket opens up some real room
Otherwise failure sends it drifting back toward $0.01064 support
Open $W and set an alert at that level
Break or reject? 👀
#W #PriceAction
$W has one level that matters right now at $0.01196
That ceiling sits 6.4 percent above current spot near $0.01124
A clean hourly close through that pocket opens up some real room
Otherwise failure sends it drifting back toward $0.01064 support
Open $W and set an alert at that level
Break or reject? 👀
#W #PriceAction
That ceiling sits 6.4 percent above current spot near $0.01124
A clean hourly close through that pocket opens up some real room
Otherwise failure sends it drifting back toward $0.01064 support
Open $W and set an alert at that level
Break or reject? 👀
#W #PriceAction
16

·
--
⚔️ $ZRO vs $W: which one wins?
🔹 $ZRO: LayerZero is omnichain messaging with configurable security. Total supply is 1B.
🔹 $W: Wormhole is cross-chain messaging secured by a guardian network. Total supply is 10B.
📊 ZRO lets apps choose their security setup. W relies on a guardian set.
⚠️ Cross-chain protocols are hack targets and face token unlocks.
$ZRO or $W? 👇
Not financial advice. DYOR.
#ZRO #W #Binance
⚔️ $ZRO vs $W : which one wins?
🔹 $ZRO : LayerZero is omnichain messaging with configurable security. Total supply is 1B.
🔹 $W : Wormhole is cross-chain messaging secured by a guardian network. Total supply is 10B.
📊 ZRO lets apps choose their security setup. W relies on a guardian set.
⚠️ Cross-chain protocols are hack targets and face token unlocks.
$ZRO or $W ? 👇
Not financial advice. DYOR.
#ZRO #W #Binance
🔹 $ZRO : LayerZero is omnichain messaging with configurable security. Total supply is 1B.
🔹 $W : Wormhole is cross-chain messaging secured by a guardian network. Total supply is 10B.
📊 ZRO lets apps choose their security setup. W relies on a guardian set.
⚠️ Cross-chain protocols are hack targets and face token unlocks.
$ZRO or $W ? 👇
Not financial advice. DYOR.
#ZRO #W #Binance

1
553

·
--
$wusdt SHORT
WUSDT is trading near $0.01127 with 4H momentum remaining neutral to bearish and price below key moving averages. A rejection near $0.01140 could push toward $0.01080 before entry confirm selling volume and bearish candle closure.
Entry $0.01125–$0.01140
TP 1 $0.01100
TP2 $0.01070
TP3 $0.01030
SL. $0.01165
#w
$wusdt SHORT
WUSDT is trading near $0.01127 with 4H momentum remaining neutral to bearish and price below key moving averages. A rejection near $0.01140 could push toward $0.01080 before entry confirm selling volume and bearish candle closure.
Entry $0.01125–$0.01140
TP 1 $0.01100
TP2 $0.01070
TP3 $0.01030
SL. $0.01165
#w
WUSDT is trading near $0.01127 with 4H momentum remaining neutral to bearish and price below key moving averages. A rejection near $0.01140 could push toward $0.01080 before entry confirm selling volume and bearish candle closure.
Entry $0.01125–$0.01140
TP 1 $0.01100
TP2 $0.01070
TP3 $0.01030
SL. $0.01165
#w
2
363
·
--
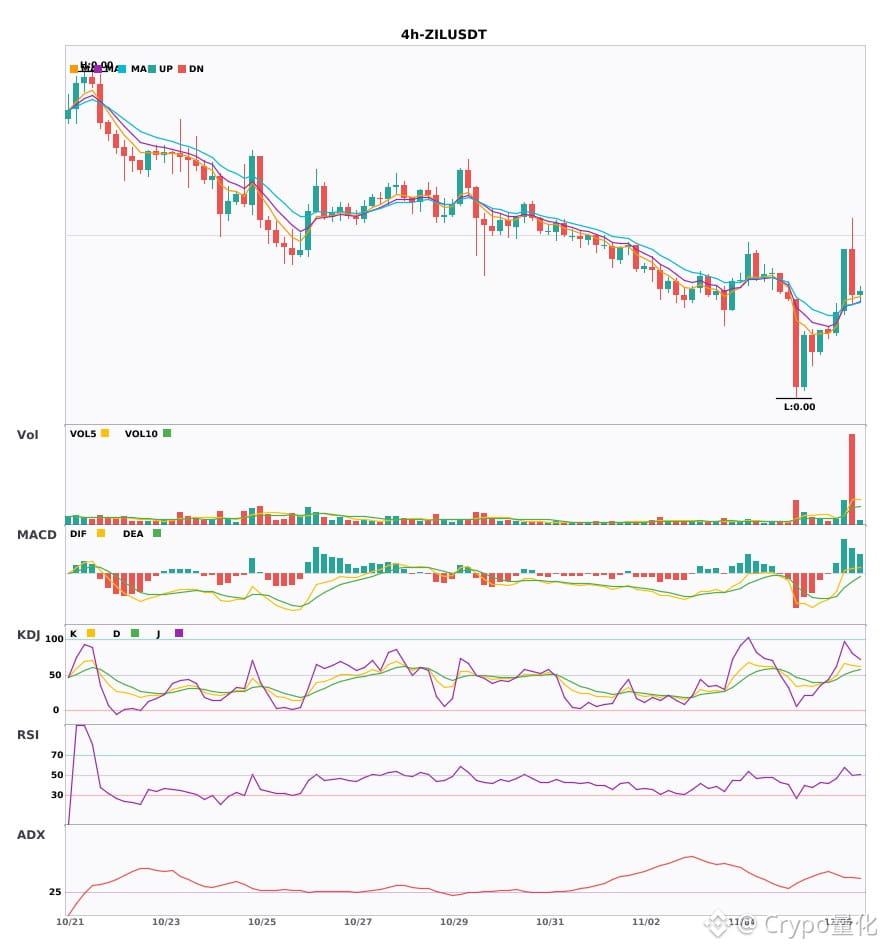
Two 4-hour bullish signals appeared simultaneously: $W / $ZIL🔥
════════════════════
🔴 $W 4-hour bullish signal
⚠️Technical analysis: ADX(33) indicates a clear trend | MACD is bullish, with a strong trend and increasing momentum | EMA5 > EMA8 > EMA13, bullish alignment | KDJ is strong, with bulls in control (K: 71.5, D: 58.1) | Volume surge (2.6x)
════════════════════
🔴 $ZIL 4-hour bullish signal
⚠️Technical analysis: ADX(43) indicates a clear trend | MACD DIF breaks above the zero line, signaling a bullish trend reversal | EMA5 crosses above EMA8, turning bullish in the short term | KDJ is strong, with bulls in control (K: 66.5, D: 51.0) | Volume surge (2.7x)
════════════════════
🔔 Follow for firsthand market movement alerts 🔔
#技术分析 #W #ZIL
📌 When trading, watch for confirming candlestick patterns
Two 4-hour bullish signals appeared simultaneously: $W / $ZIL 🔥
════════════════════
🔴 $W 4-hour bullish signal
⚠️Technical analysis: ADX(33) indicates a clear trend | MACD is bullish, with a strong trend and increasing momentum | EMA5 > EMA8 > EMA13, bullish alignment | KDJ is strong, with bulls in control (K: 71.5, D: 58.1) | Volume surge (2.6x)
════════════════════
🔴 $ZIL 4-hour bullish signal
⚠️Technical analysis: ADX(43) indicates a clear trend | MACD DIF breaks above the zero line, signaling a bullish trend reversal | EMA5 crosses above EMA8, turning bullish in the short term | KDJ is strong, with bulls in control (K: 66.5, D: 51.0) | Volume surge (2.7x)
════════════════════
🔔 Follow for firsthand market movement alerts 🔔
#技术分析 #W #ZIL
📌 When trading, watch for confirming candlestick patterns
════════════════════
🔴 $W 4-hour bullish signal
⚠️Technical analysis: ADX(33) indicates a clear trend | MACD is bullish, with a strong trend and increasing momentum | EMA5 > EMA8 > EMA13, bullish alignment | KDJ is strong, with bulls in control (K: 71.5, D: 58.1) | Volume surge (2.6x)
════════════════════
🔴 $ZIL 4-hour bullish signal
⚠️Technical analysis: ADX(43) indicates a clear trend | MACD DIF breaks above the zero line, signaling a bullish trend reversal | EMA5 crosses above EMA8, turning bullish in the short term | KDJ is strong, with bulls in control (K: 66.5, D: 51.0) | Volume surge (2.7x)
════════════════════
🔔 Follow for firsthand market movement alerts 🔔
#技术分析 #W #ZIL
📌 When trading, watch for confirming candlestick patterns
15
Log in to explore more content
Join global crypto users on Binance Square
⚡️ Get latest and useful information about crypto.
💬 Trusted by the world’s largest crypto exchange.
👍 Discover real insights from verified creators.
Email / Phone number
Trending Topics
1
#WhoWillSucceedJensenHuangatNvidia?
58,964 views
787 Discussing
2
#WhatWillDriveCryptoandStocks’NextRebound?
390,350 views
2,737 Discussing
3
#BitcoinActiveSupplyInProfitDropsBelow45%
4,311 views
125 Discussing
4
#KavaSaysAbnormalActivityLimitedToKavaLend
118 views
17 Discussing
5
#USSpotXRPETFsSeeLargestWeeklyOutflowIn8Months
749 views
40 Discussing
6
#USPPIMissMayEaseBTCPressure
182,534 views
1,917 Discussing
7
#WORPTLetsTouristsConvertCryptoToThaiBaht
816 views
26 Discussing
8
#TONStrategyReports$23.97MQ3NetLoss
2,520 views
37 Discussing
9
#PolkadotCommunityApprovesNewStrategyWith97%Vote
14,701 views
210 Discussing
10
#dYdXPlansV9.9UpgradeToShiftUSDCToInjective
8,162 views
162 Discussing