
#strc
strc
71,366 views
804 Discussing
Hot
Latest

$STRC 30-minute bearish signal; short-term selling pressure intensifies
📉 $STRC | 30-minute bearish signal
━━━━━━━━━━━━━━━━━━
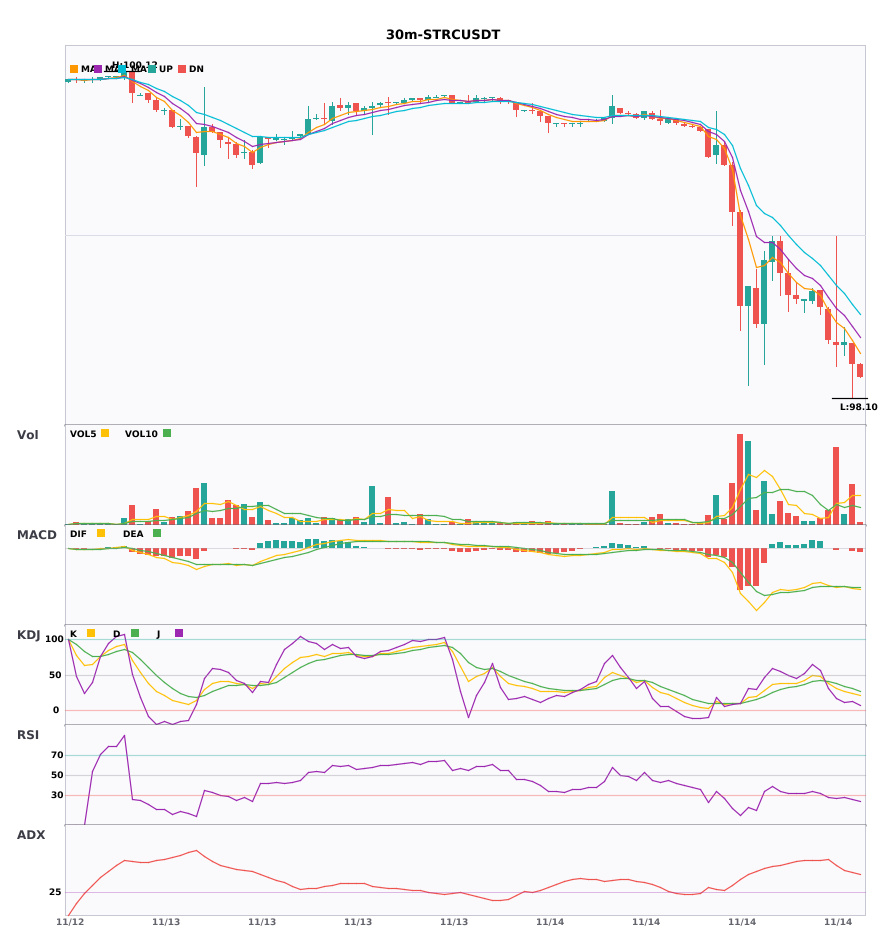
Technical analysis: ADX44 indicates a clear trend; MACD bearish cross below zero; EMA5/8/13 in bearish alignment; KDJ weak (K24.8, D31); volume doubled, bearish momentum accelerating.
Price change: -0.1400%
━━━━━━━━━━━━━━━━━━
#技术分析 #STRC
📌 The above is for reference only and does not constitute investment advice
$STRC 30-minute bearish signal; short-term selling pressure intensifies
📉 $STRC | 30-minute bearish signal
━━━━━━━━━━━━━━━━━━
Technical analysis: ADX44 indicates a clear trend; MACD bearish cross below zero; EMA5/8/13 in bearish alignment; KDJ weak (K24.8, D31); volume doubled, bearish momentum accelerating.
Price change: -0.1400%
━━━━━━━━━━━━━━━━━━
#技术分析 #STRC
📌 The above is for reference only and does not constitute investment advice
📉 $STRC | 30-minute bearish signal
━━━━━━━━━━━━━━━━━━
Technical analysis: ADX44 indicates a clear trend; MACD bearish cross below zero; EMA5/8/13 in bearish alignment; KDJ weak (K24.8, D31); volume doubled, bearish momentum accelerating.
Price change: -0.1400%
━━━━━━━━━━━━━━━━━━
#技术分析 #STRC
📌 The above is for reference only and does not constitute investment advice
15

·
--
$TRX / $STRC 30-minute weakness; the 4-hour bearish alignment has just formed, with resonance across the larger and smaller timeframes 🔥
════════════════════
🟢 $TRX 30-minute bearish signal
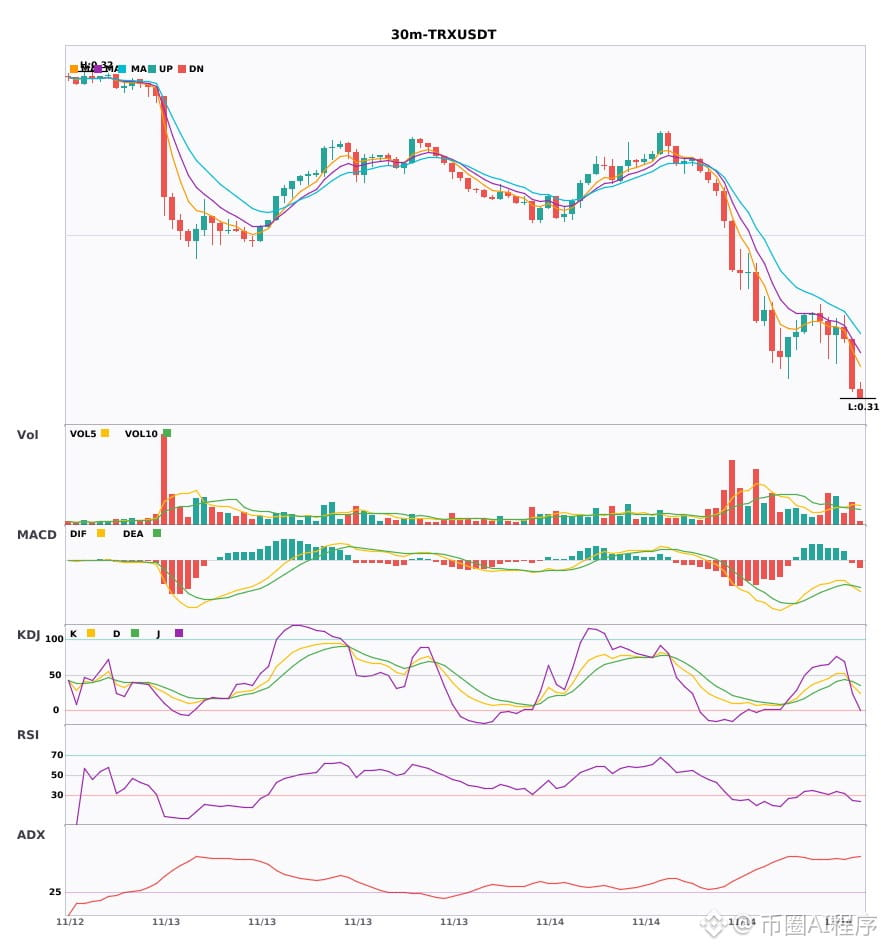
⚠️ Technical analysis: The 4-hour bearish alignment confirms a 30-minute entry: MACD forms a dead cross below zero with increased volume; moving averages are bearishly aligned and diverging downward; KDJ has formed a dead cross but is not yet oversold (K35.8 D41.5). Volume is up 1.4x. Bearish outlook.
════════════════════
🟢 $STRC 30-minute bearish signal
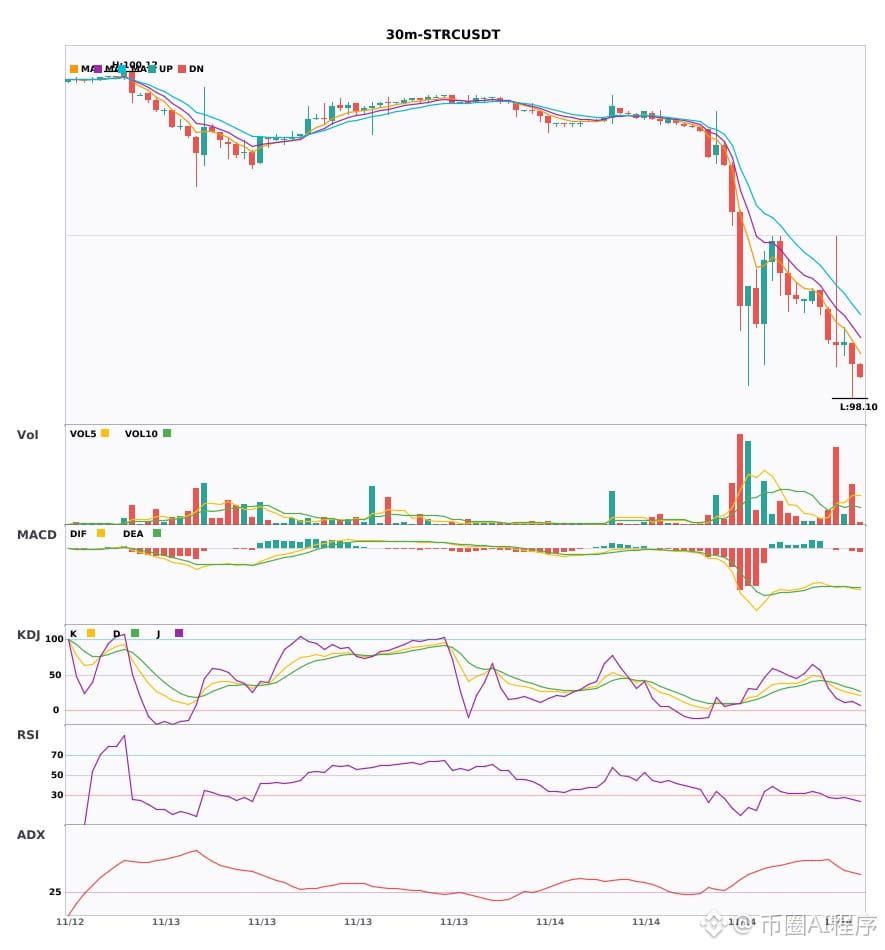
⚠️ Technical analysis: 4-hour bearishness + 30-minute bearishness confirmed in alignment! On the 30-minute chart, MACD forms a dead cross below zero with increased volume, and the green bars are growing, signaling accelerating bearish momentum; moving averages are bearishly aligned and diverging downward; KDJ is weak, with K crossing below D but not yet oversold. Bears have the upper hand, and volume is up 2x.
════════════════════
🔔 Follow for first-hand market updates 🔔
#多周期共振 #TRX #STRC
📌 When trading, pay attention to whether the candlestick pattern matches
$TRX / $STRC 30-minute weakness; the 4-hour bearish alignment has just formed, with resonance across the larger and smaller timeframes 🔥
════════════════════
🟢 $TRX 30-minute bearish signal
⚠️ Technical analysis: The 4-hour bearish alignment confirms a 30-minute entry: MACD forms a dead cross below zero with increased volume; moving averages are bearishly aligned and diverging downward; KDJ has formed a dead cross but is not yet oversold (K35.8 D41.5). Volume is up 1.4x. Bearish outlook.
════════════════════
🟢 $STRC 30-minute bearish signal
⚠️ Technical analysis: 4-hour bearishness + 30-minute bearishness confirmed in alignment! On the 30-minute chart, MACD forms a dead cross below zero with increased volume, and the green bars are growing, signaling accelerating bearish momentum; moving averages are bearishly aligned and diverging downward; KDJ is weak, with K crossing below D but not yet oversold. Bears have the upper hand, and volume is up 2x.
════════════════════
🔔 Follow for first-hand market updates 🔔
#多周期共振 #TRX #STRC
📌 When trading, pay attention to whether the candlestick pattern matches
════════════════════
🟢 $TRX 30-minute bearish signal
⚠️ Technical analysis: The 4-hour bearish alignment confirms a 30-minute entry: MACD forms a dead cross below zero with increased volume; moving averages are bearishly aligned and diverging downward; KDJ has formed a dead cross but is not yet oversold (K35.8 D41.5). Volume is up 1.4x. Bearish outlook.
════════════════════
🟢 $STRC 30-minute bearish signal
⚠️ Technical analysis: 4-hour bearishness + 30-minute bearishness confirmed in alignment! On the 30-minute chart, MACD forms a dead cross below zero with increased volume, and the green bars are growing, signaling accelerating bearish momentum; moving averages are bearishly aligned and diverging downward; KDJ is weak, with K crossing below D but not yet oversold. Bears have the upper hand, and volume is up 2x.
════════════════════
🔔 Follow for first-hand market updates 🔔
#多周期共振 #TRX #STRC
📌 When trading, pay attention to whether the candlestick pattern matches
15

·
--
$STRC 30-minute short alert🔥
════════════════════
🟢 $STRC 30-minute short signal
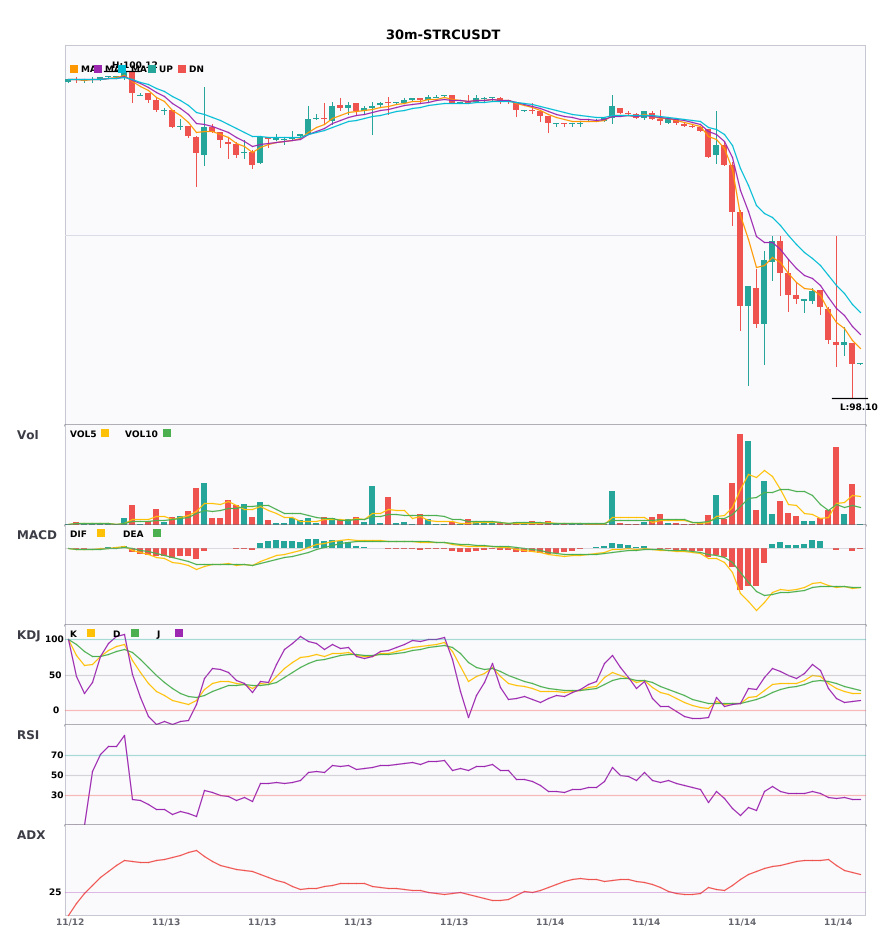
⚠️ Technical analysis: ADX has climbed to 44, indicating a very strong trend; MACD is below zero with a bearish crossover, accelerating the downtrend; moving averages are bearishly aligned and diverging; KDJ is weak, with K crossing below D; trading volume has doubled.
════════════════════
🔔 Follow for first-hand market updates 🔔
#技术分析 #STRC
📌 When trading, pay attention to whether the candlestick pattern confirms the setup
$STRC 30-minute short alert🔥
════════════════════
🟢 $STRC 30-minute short signal
⚠️ Technical analysis: ADX has climbed to 44, indicating a very strong trend; MACD is below zero with a bearish crossover, accelerating the downtrend; moving averages are bearishly aligned and diverging; KDJ is weak, with K crossing below D; trading volume has doubled.
════════════════════
🔔 Follow for first-hand market updates 🔔
#技术分析 #STRC
📌 When trading, pay attention to whether the candlestick pattern confirms the setup
════════════════════
🟢 $STRC 30-minute short signal
⚠️ Technical analysis: ADX has climbed to 44, indicating a very strong trend; MACD is below zero with a bearish crossover, accelerating the downtrend; moving averages are bearishly aligned and diverging; KDJ is weak, with K crossing below D; trading volume has doubled.
════════════════════
🔔 Follow for first-hand market updates 🔔
#技术分析 #STRC
📌 When trading, pay attention to whether the candlestick pattern confirms the setup
6
·
--
$BAT / $STRC 30-minute short signal is here, and the 4-hour trend is also heading downward 🔥
════════════════════
🟢 $BAT 30-minute short signal
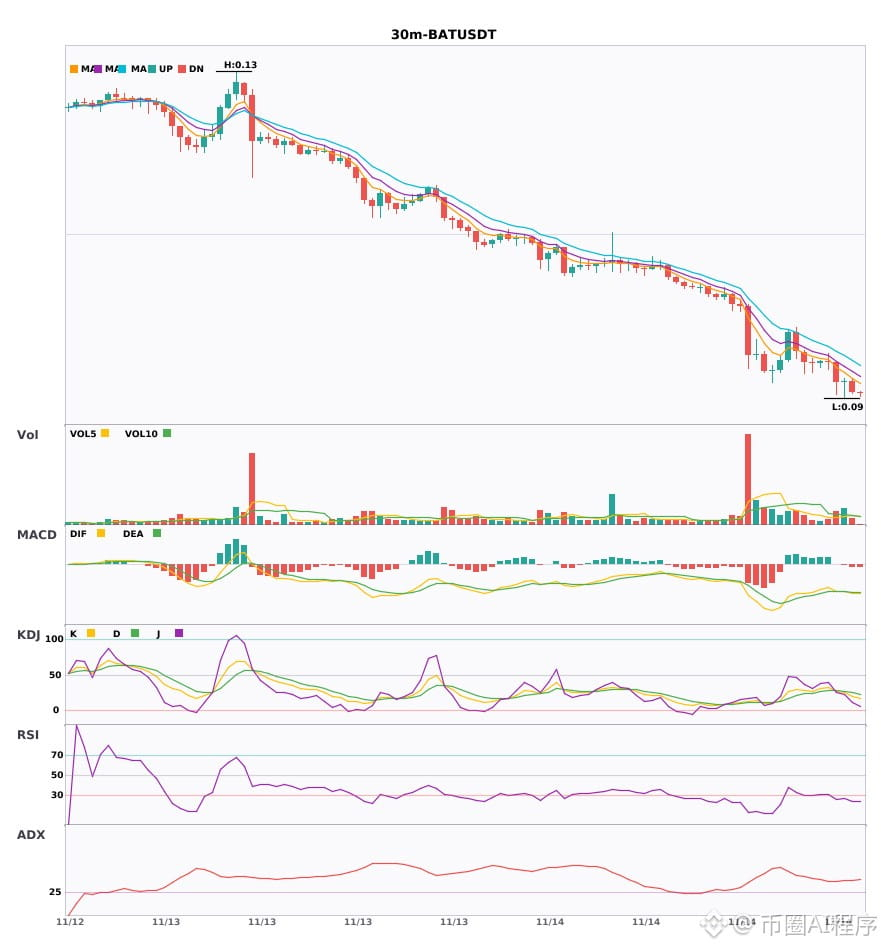
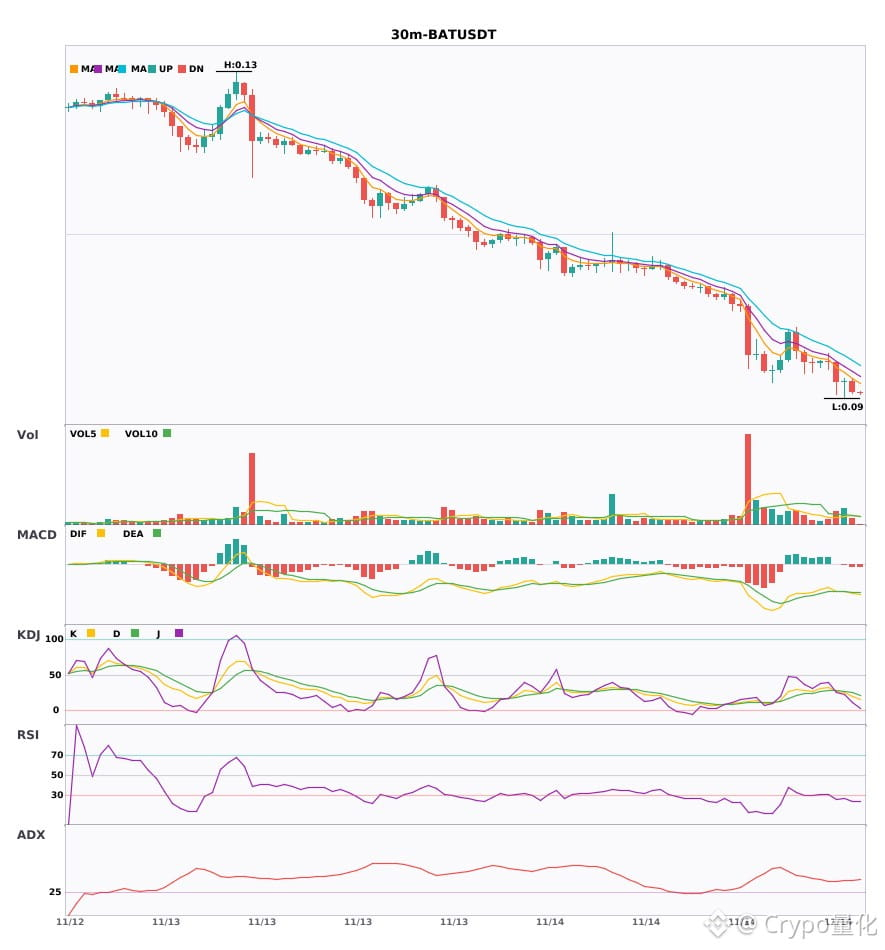
⚠️ Technical analysis: 4-hour bearish trend + 30-minute entry signal; multi-timeframe confluence: MACD death cross below zero, accelerating bearish momentum with rising volume, moving averages aligned bearishly and trending down, KDJ showing weakness, volume up 1.6x
════════════════════
🟢 $STRC 30-minute short signal
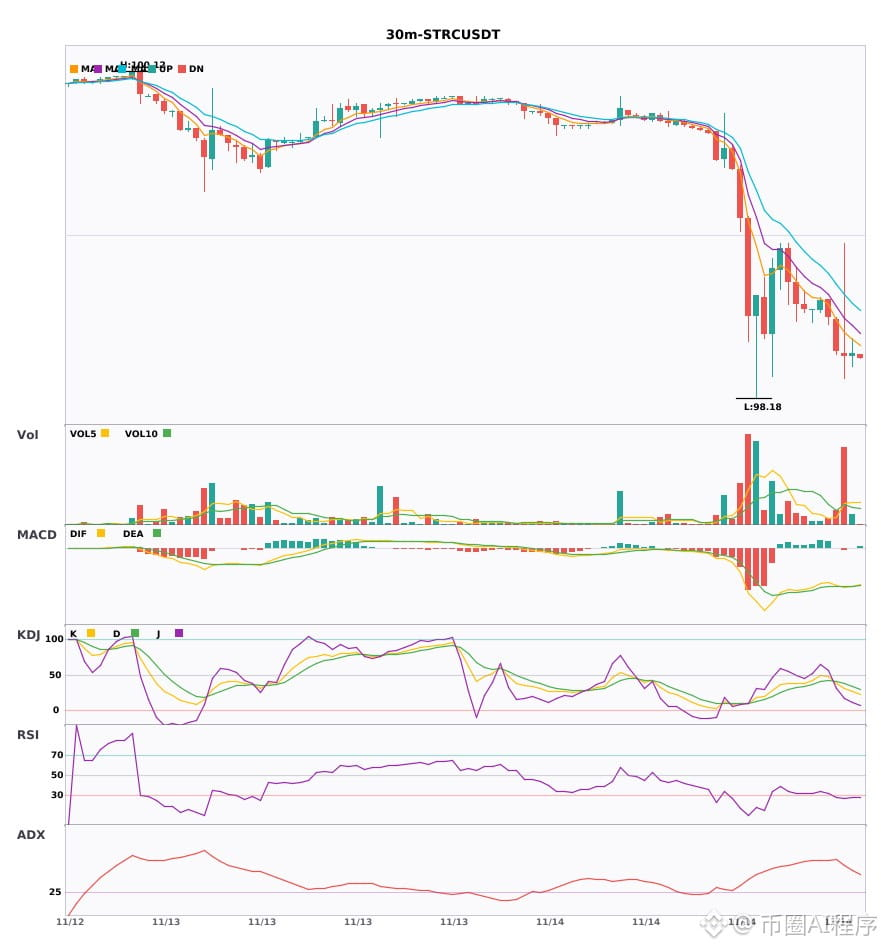
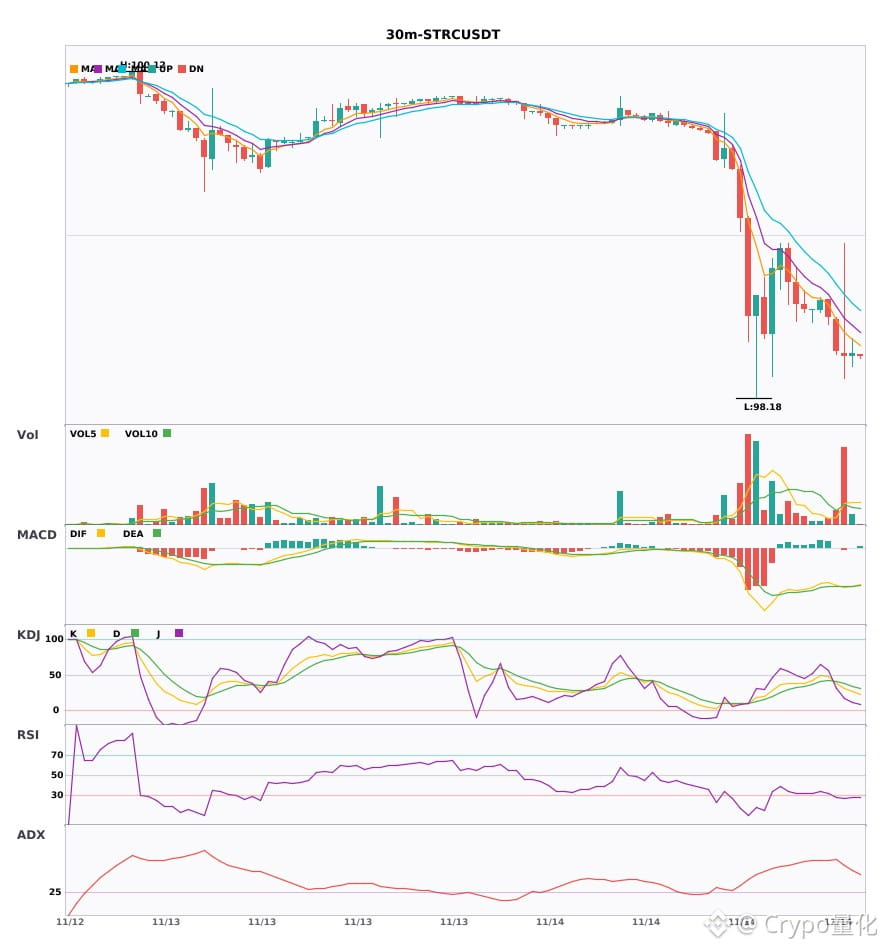
⚠️ Technical analysis: 4-hour bearish trend + 30-minute entry; multi-timeframe confluence confirms a short. MACD death cross with rising volume and an accelerating decline; moving averages aligned bearishly and diverging downward; KDJ is weak, with K crossing below D but not yet oversold; volume up 3.8x.
════════════════════
🔔 Follow for the latest market moves 🔔
#多周期共振 #BAT #STRC
📌 When trading, pay attention to whether the candlestick pattern is consistent
$BAT / $STRC 30-minute short signal is here, and the 4-hour trend is also heading downward 🔥
════════════════════
🟢 $BAT 30-minute short signal
⚠️ Technical analysis: 4-hour bearish trend + 30-minute entry signal; multi-timeframe confluence: MACD death cross below zero, accelerating bearish momentum with rising volume, moving averages aligned bearishly and trending down, KDJ showing weakness, volume up 1.6x
════════════════════
🟢 $STRC 30-minute short signal
⚠️ Technical analysis: 4-hour bearish trend + 30-minute entry; multi-timeframe confluence confirms a short. MACD death cross with rising volume and an accelerating decline; moving averages aligned bearishly and diverging downward; KDJ is weak, with K crossing below D but not yet oversold; volume up 3.8x.
════════════════════
🔔 Follow for the latest market moves 🔔
#多周期共振 #BAT #STRC
📌 When trading, pay attention to whether the candlestick pattern is consistent
════════════════════
🟢 $BAT 30-minute short signal
⚠️ Technical analysis: 4-hour bearish trend + 30-minute entry signal; multi-timeframe confluence: MACD death cross below zero, accelerating bearish momentum with rising volume, moving averages aligned bearishly and trending down, KDJ showing weakness, volume up 1.6x
════════════════════
🟢 $STRC 30-minute short signal
⚠️ Technical analysis: 4-hour bearish trend + 30-minute entry; multi-timeframe confluence confirms a short. MACD death cross with rising volume and an accelerating decline; moving averages aligned bearishly and diverging downward; KDJ is weak, with K crossing below D but not yet oversold; volume up 3.8x.
════════════════════
🔔 Follow for the latest market moves 🔔
#多周期共振 #BAT #STRC
📌 When trading, pay attention to whether the candlestick pattern is consistent
8
·
--
$BAT / $STRC 30-minute bearish outlook, significant short-term pressure 🔥
════════════════════
🟢 $BAT 30-minute bearish signal
⚠️ Technical analysis: ADX is at 37, indicating a fairly strong trend. The MACD histogram is expanding after a bearish crossover. Moving averages are bearishly aligned and diverging downward. The KDJ K-line has crossed below the D-line, showing weakness. Volume is up about 1.6x.
════════════════════
🟢 $STRC 30-minute bearish signal
⚠️ Technical analysis: ADX (55) indicates an extremely strong trend; beware of overheating. MACD has made a bearish crossover below zero, accelerating the downtrend. Moving averages are bearishly aligned. KDJ favors the bears. Volume has surged to 3.8x.
════════════════════
🔔 Follow for first-hand updates on unusual market moves 🔔
#技术分析 #BAT #STRC
📌 When trading, pay attention to whether the candlestick patterns confirm the signal
$BAT / $STRC 30-minute bearish outlook, significant short-term pressure 🔥
════════════════════
🟢 $BAT 30-minute bearish signal
⚠️ Technical analysis: ADX is at 37, indicating a fairly strong trend. The MACD histogram is expanding after a bearish crossover. Moving averages are bearishly aligned and diverging downward. The KDJ K-line has crossed below the D-line, showing weakness. Volume is up about 1.6x.
════════════════════
🟢 $STRC 30-minute bearish signal
⚠️ Technical analysis: ADX (55) indicates an extremely strong trend; beware of overheating. MACD has made a bearish crossover below zero, accelerating the downtrend. Moving averages are bearishly aligned. KDJ favors the bears. Volume has surged to 3.8x.
════════════════════
🔔 Follow for first-hand updates on unusual market moves 🔔
#技术分析 #BAT #STRC
📌 When trading, pay attention to whether the candlestick patterns confirm the signal
════════════════════
🟢 $BAT 30-minute bearish signal
⚠️ Technical analysis: ADX is at 37, indicating a fairly strong trend. The MACD histogram is expanding after a bearish crossover. Moving averages are bearishly aligned and diverging downward. The KDJ K-line has crossed below the D-line, showing weakness. Volume is up about 1.6x.
════════════════════
🟢 $STRC 30-minute bearish signal
⚠️ Technical analysis: ADX (55) indicates an extremely strong trend; beware of overheating. MACD has made a bearish crossover below zero, accelerating the downtrend. Moving averages are bearishly aligned. KDJ favors the bears. Volume has surged to 3.8x.
════════════════════
🔔 Follow for first-hand updates on unusual market moves 🔔
#技术分析 #BAT #STRC
📌 When trading, pay attention to whether the candlestick patterns confirm the signal
7
·
--
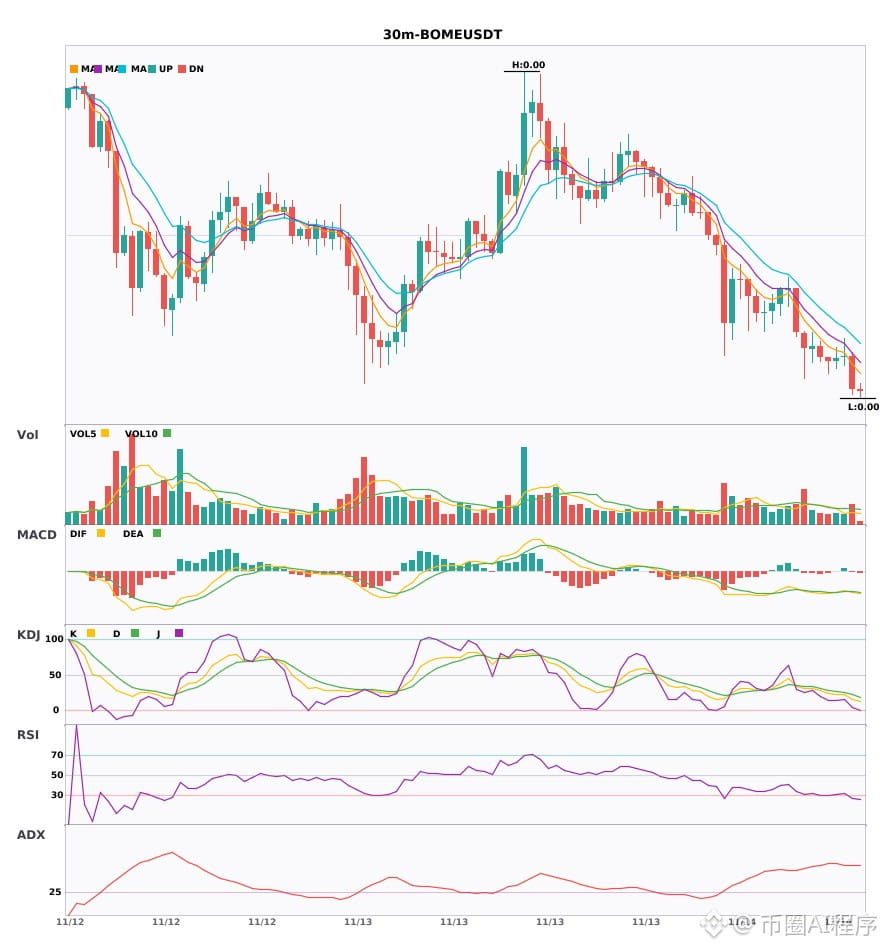
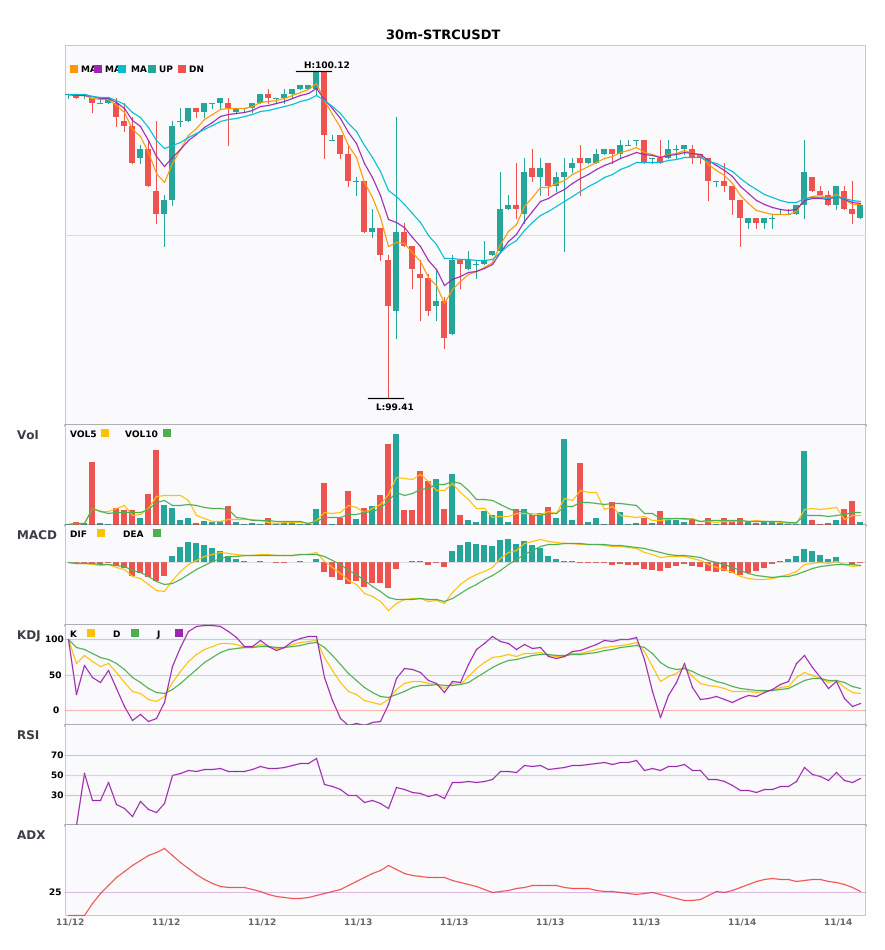
30-minute weakness, 4-hour bearish confirmation, $BOME $STRC multi-timeframe bearish confluence 🔥
════════════════════
🟢 $BOME 30-minute bearish signal
⚠️Technical analysis: 4-hour bearish trend confirmed, with a confluence of 30-minute entry signals! MACD turns down with expanding volume after a bullish crossover; the green bars continue to grow. Moving averages are bearishly aligned and diverging downward. KDJ is at a low level but not oversold. Bears have the upper hand, and volume is 1.2 times normal. The 4-hour and 30-minute bearish confluence is confirmed.
════════════════════
🟢 $STRC 30-minute bearish signal
⚠️Technical analysis: 4-hour bearish trend plus 30-minute bearish confluence confirmed! The 30-minute MACD falls below the zero line and turns bearish; the moving averages have just formed a bearish alignment, and KDJ is weak, with K crossing below D. Follow the trend with short positions.
════════════════════
🔔 Follow to get the latest market movements 🔔
#多周期共振 #BOME #STRC
📌 When trading, pay attention to whether the candlestick pattern matches
30-minute weakness, 4-hour bearish confirmation, $BOME $STRC multi-timeframe bearish confluence 🔥
════════════════════
🟢 $BOME 30-minute bearish signal
⚠️Technical analysis: 4-hour bearish trend confirmed, with a confluence of 30-minute entry signals! MACD turns down with expanding volume after a bullish crossover; the green bars continue to grow. Moving averages are bearishly aligned and diverging downward. KDJ is at a low level but not oversold. Bears have the upper hand, and volume is 1.2 times normal. The 4-hour and 30-minute bearish confluence is confirmed.
════════════════════
🟢 $STRC 30-minute bearish signal
⚠️Technical analysis: 4-hour bearish trend plus 30-minute bearish confluence confirmed! The 30-minute MACD falls below the zero line and turns bearish; the moving averages have just formed a bearish alignment, and KDJ is weak, with K crossing below D. Follow the trend with short positions.
════════════════════
🔔 Follow to get the latest market movements 🔔
#多周期共振 #BOME #STRC
📌 When trading, pay attention to whether the candlestick pattern matches
════════════════════
🟢 $BOME 30-minute bearish signal
⚠️Technical analysis: 4-hour bearish trend confirmed, with a confluence of 30-minute entry signals! MACD turns down with expanding volume after a bullish crossover; the green bars continue to grow. Moving averages are bearishly aligned and diverging downward. KDJ is at a low level but not oversold. Bears have the upper hand, and volume is 1.2 times normal. The 4-hour and 30-minute bearish confluence is confirmed.
════════════════════
🟢 $STRC 30-minute bearish signal
⚠️Technical analysis: 4-hour bearish trend plus 30-minute bearish confluence confirmed! The 30-minute MACD falls below the zero line and turns bearish; the moving averages have just formed a bearish alignment, and KDJ is weak, with K crossing below D. Follow the trend with short positions.
════════════════════
🔔 Follow to get the latest market movements 🔔
#多周期共振 #BOME #STRC
📌 When trading, pay attention to whether the candlestick pattern matches
9
·
--
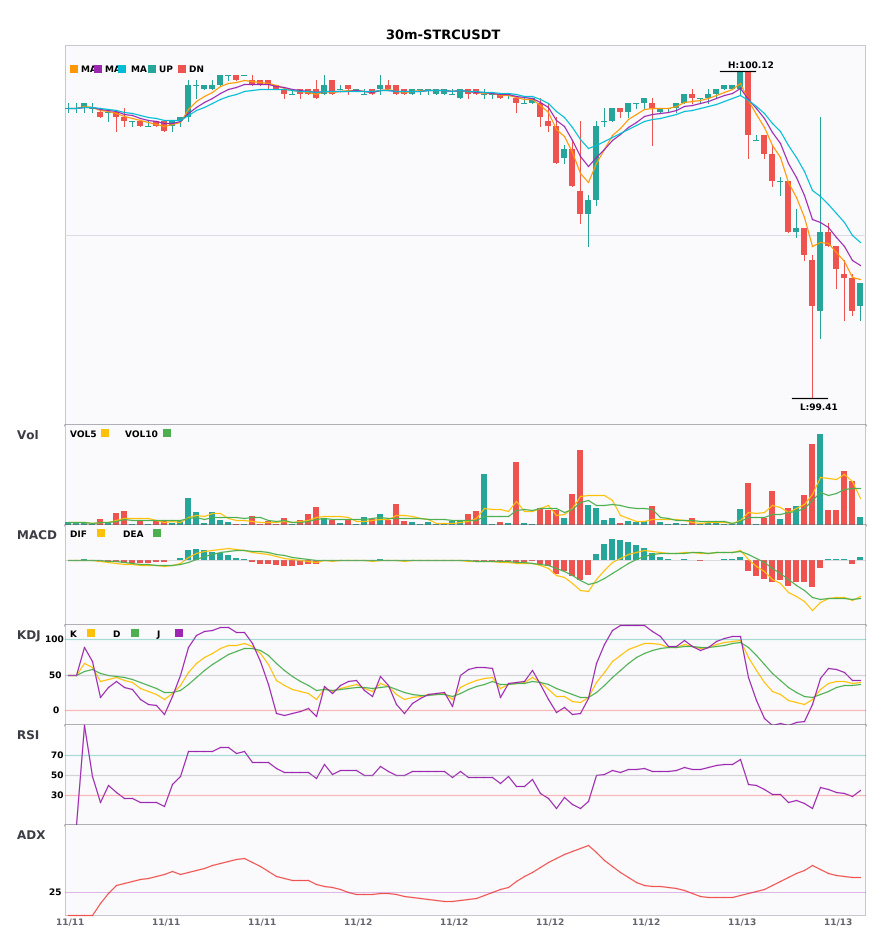
$STRC 30-minute convergence, the 4-hour downtrend is confirmed 🔥
════════════════════
🟢 $STRC 30-minute bearish signal
⚠️Technical analysis: 4-hour + 30-minute bearish convergence confirmed! The 30-minute MACD has formed a bearish crossover below zero, with expanding green bars. The moving averages are bearishly aligned and diverging downward; KDJ is trending lower in weak territory, and trading volume has increased 1.5 times. Bears have the upper hand.
════════════════════
🔔 Follow us for first-hand market updates 🔔
#多周期共振 #STRC
📌 When trading, pay attention to whether the candlestick pattern confirms the setup
$STRC 30-minute convergence, the 4-hour downtrend is confirmed 🔥
════════════════════
🟢 $STRC 30-minute bearish signal
⚠️Technical analysis: 4-hour + 30-minute bearish convergence confirmed! The 30-minute MACD has formed a bearish crossover below zero, with expanding green bars. The moving averages are bearishly aligned and diverging downward; KDJ is trending lower in weak territory, and trading volume has increased 1.5 times. Bears have the upper hand.
════════════════════
🔔 Follow us for first-hand market updates 🔔
#多周期共振 #STRC
📌 When trading, pay attention to whether the candlestick pattern confirms the setup
════════════════════
🟢 $STRC 30-minute bearish signal
⚠️Technical analysis: 4-hour + 30-minute bearish convergence confirmed! The 30-minute MACD has formed a bearish crossover below zero, with expanding green bars. The moving averages are bearishly aligned and diverging downward; KDJ is trending lower in weak territory, and trading volume has increased 1.5 times. Bears have the upper hand.
════════════════════
🔔 Follow us for first-hand market updates 🔔
#多周期共振 #STRC
📌 When trading, pay attention to whether the candlestick pattern confirms the setup
1
·
--
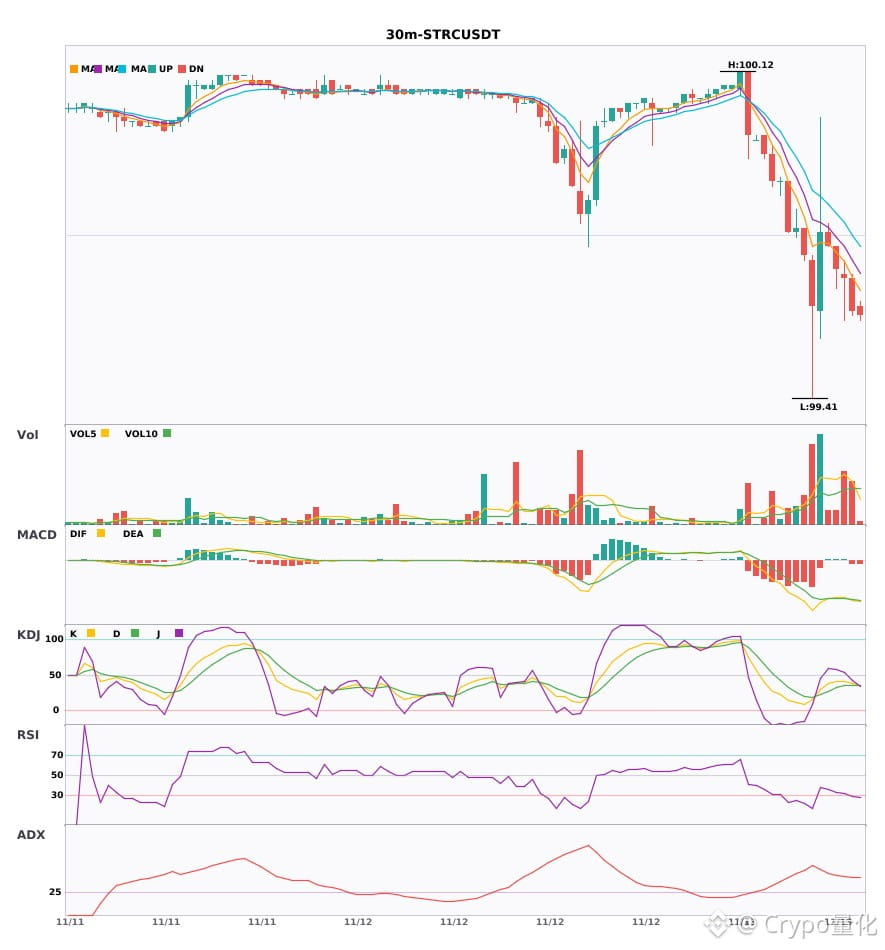
$STRC / $MAGMA 30-min KDJ death cross moving downward, MACD green bars expanding—risk is here 🔥
════════════════════
🟢 $STRC 30-min bearish signal
⚠️Technical analysis: The trend is quite strong (ADX 43); MACD death cross is accelerating the decline; moving averages are bearishly aligned and spreading downward; weak KDJ, with K below D; volume is up 1.5x
════════════════════
🟢 $MAGMA 30-min bearish signal
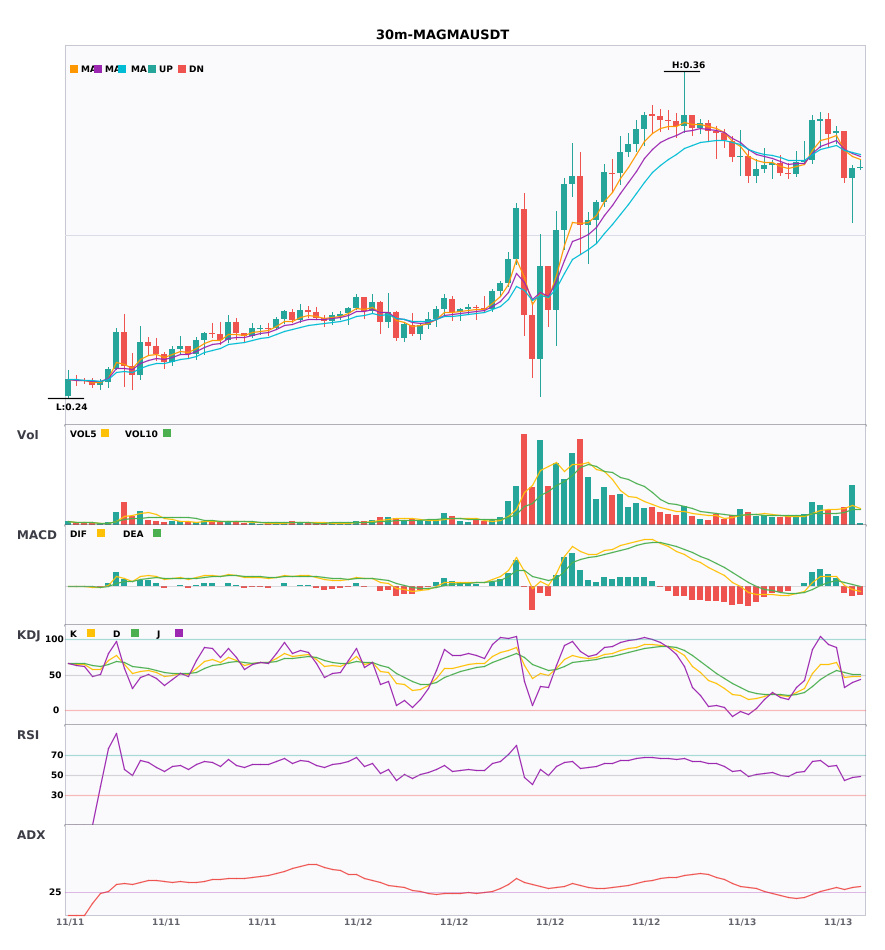
⚠️Technical analysis: ADX has reached 35, indicating a very strong trend | MACD death cross has fallen below the zero line, turning bearish | Moving averages have just formed a bearish alignment and are pointing down | Trading volume is up 2.5x
════════════════════
🔔 Follow for first-hand market movement updates 🔔
#技术分析 #STRC #MAGMA
📌 When trading, pay attention to whether the candlestick patterns match
$STRC / $MAGMA 30-min KDJ death cross moving downward, MACD green bars expanding—risk is here 🔥
════════════════════
🟢 $STRC 30-min bearish signal
⚠️Technical analysis: The trend is quite strong (ADX 43); MACD death cross is accelerating the decline; moving averages are bearishly aligned and spreading downward; weak KDJ, with K below D; volume is up 1.5x
════════════════════
🟢 $MAGMA 30-min bearish signal
⚠️Technical analysis: ADX has reached 35, indicating a very strong trend | MACD death cross has fallen below the zero line, turning bearish | Moving averages have just formed a bearish alignment and are pointing down | Trading volume is up 2.5x
════════════════════
🔔 Follow for first-hand market movement updates 🔔
#技术分析 #STRC #MAGMA
📌 When trading, pay attention to whether the candlestick patterns match
════════════════════
🟢 $STRC 30-min bearish signal
⚠️Technical analysis: The trend is quite strong (ADX 43); MACD death cross is accelerating the decline; moving averages are bearishly aligned and spreading downward; weak KDJ, with K below D; volume is up 1.5x
════════════════════
🟢 $MAGMA 30-min bearish signal
⚠️Technical analysis: ADX has reached 35, indicating a very strong trend | MACD death cross has fallen below the zero line, turning bearish | Moving averages have just formed a bearish alignment and are pointing down | Trading volume is up 2.5x
════════════════════
🔔 Follow for first-hand market movement updates 🔔
#技术分析 #STRC #MAGMA
📌 When trading, pay attention to whether the candlestick patterns match
2
·
--
$LTC $STRC $LAB 4 hours all signal bearish; short signals are converging 🔥
════════════════════
🟢 $LTC 4-hour bearish signal
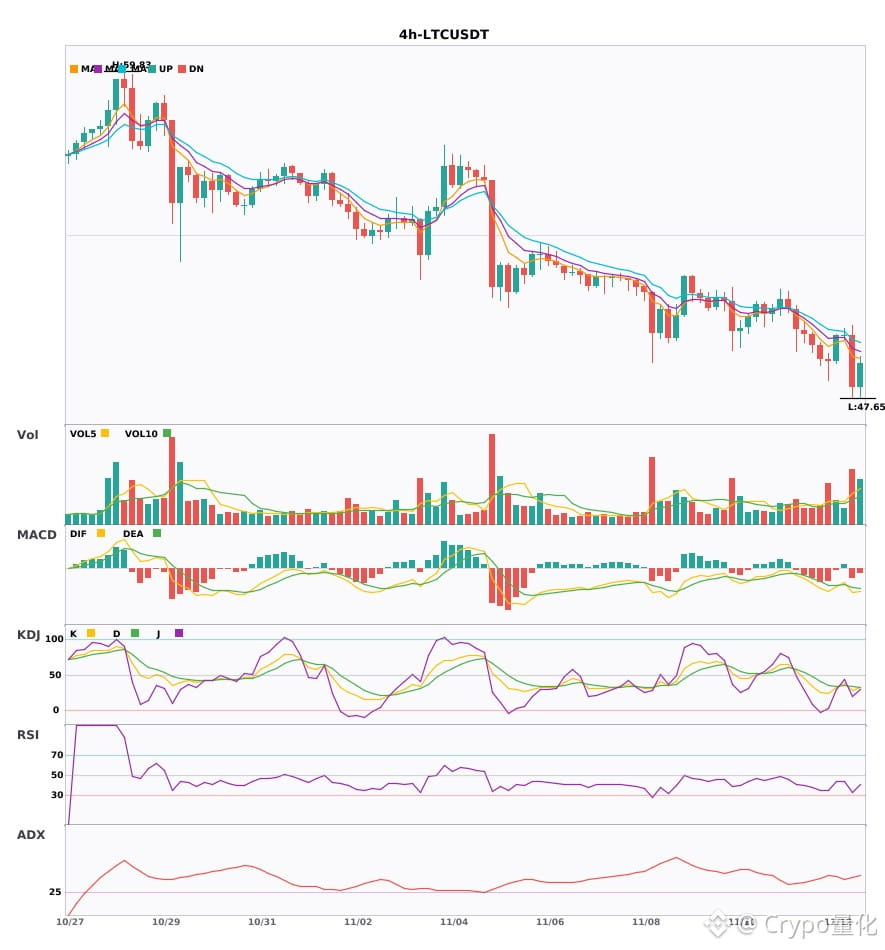
⚠️Technical analysis: ADX has surged to 41, indicating a very strong trend; the MACD bearish crossover is driving a sharp drop, and all moving averages are trending downward; the KDJ bearish crossover remains in the weak zone (K28.8 is below D), with volume up 2.2x.
════════════════════
🟢 $STRC 4-hour bearish signal
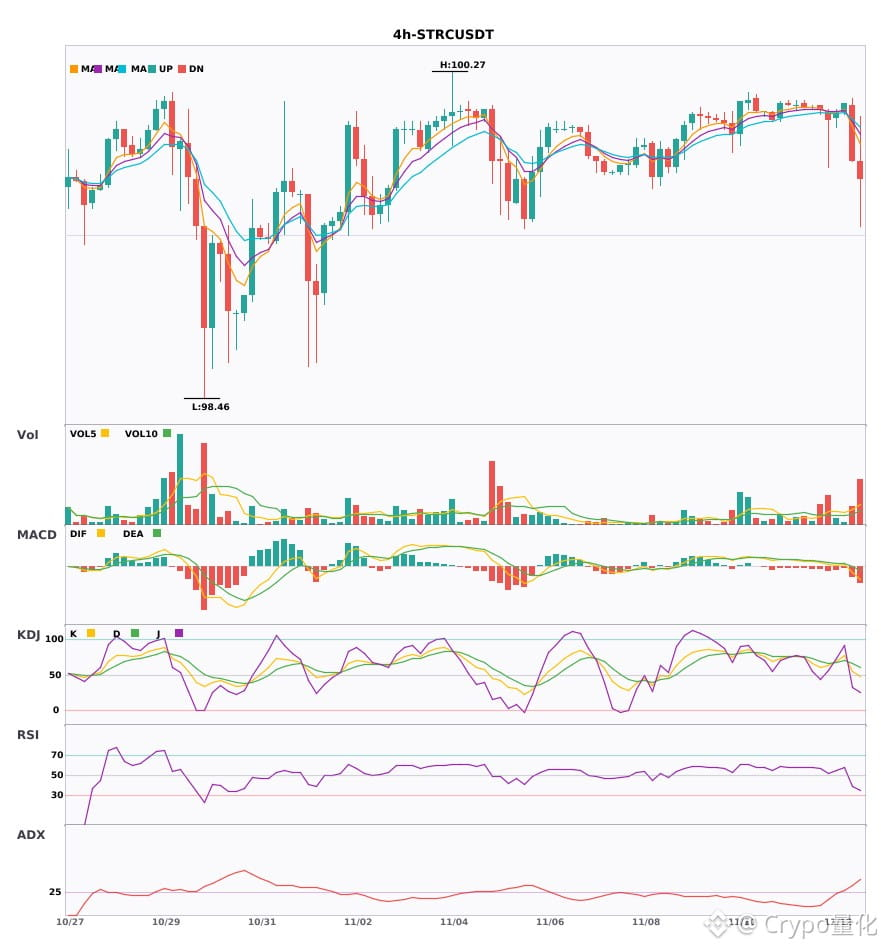
⚠️Technical analysis: ADX indicates a fairly strong trend; MACD has fallen below the zero line and turned bearish; EMA5 has crossed below EMA8, signaling short-term weakness; KDJ has crossed bearishly, with K below D; trading volume is up 1.6x, pointing to a short-term bearish bias.
════════════════════
🟢 $LAB 4-hour bearish signal
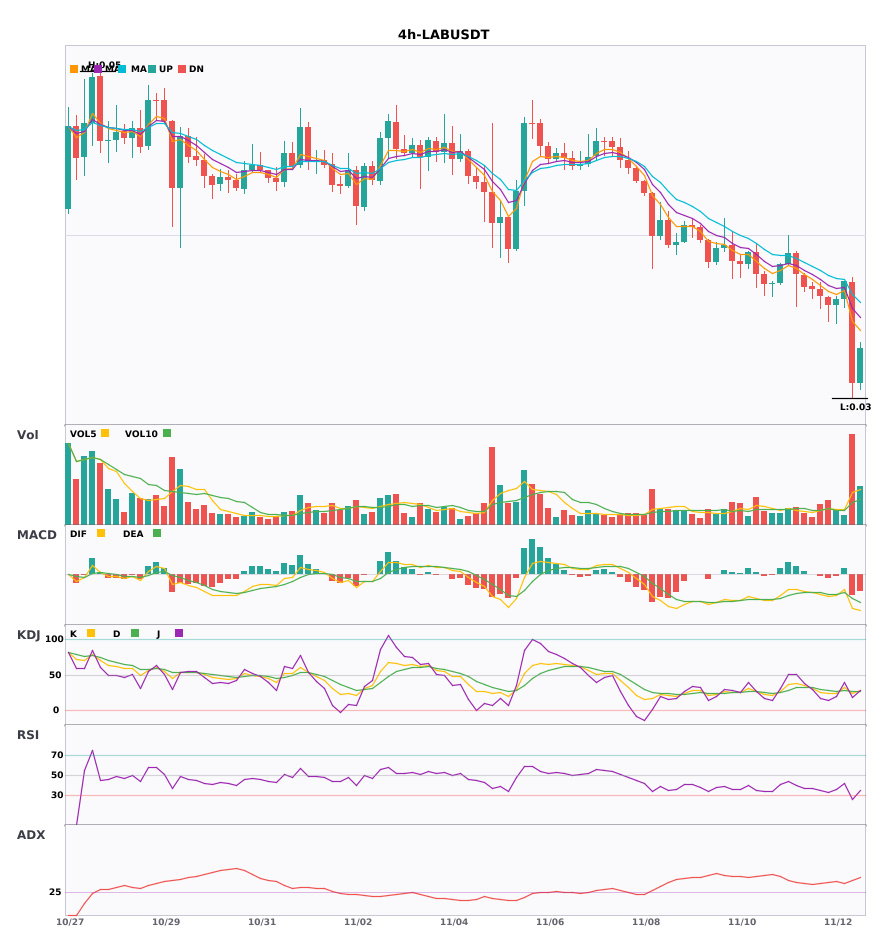
⚠️Technical analysis: ADX39 indicates a very strong trend; volume increased after the MACD bearish crossover; the moving averages are bearishly aligned and diverging downward; KDJ has crossed bearishly but is not oversold; volume has surged 4x, with a bearish short-term outlook.
════════════════════
🔔 Follow for first-hand market updates 🔔
#技术分析 #LTC #STRC #LAB
📌 When trading, pay attention to whether the candlestick patterns confirm the signal
$LTC $STRC $LAB 4 hours all signal bearish; short signals are converging 🔥
════════════════════
🟢 $LTC 4-hour bearish signal
⚠️Technical analysis: ADX has surged to 41, indicating a very strong trend; the MACD bearish crossover is driving a sharp drop, and all moving averages are trending downward; the KDJ bearish crossover remains in the weak zone (K28.8 is below D), with volume up 2.2x.
════════════════════
🟢 $STRC 4-hour bearish signal
⚠️Technical analysis: ADX indicates a fairly strong trend; MACD has fallen below the zero line and turned bearish; EMA5 has crossed below EMA8, signaling short-term weakness; KDJ has crossed bearishly, with K below D; trading volume is up 1.6x, pointing to a short-term bearish bias.
════════════════════
🟢 $LAB 4-hour bearish signal
⚠️Technical analysis: ADX39 indicates a very strong trend; volume increased after the MACD bearish crossover; the moving averages are bearishly aligned and diverging downward; KDJ has crossed bearishly but is not oversold; volume has surged 4x, with a bearish short-term outlook.
════════════════════
🔔 Follow for first-hand market updates 🔔
#技术分析 #LTC #STRC #LAB
📌 When trading, pay attention to whether the candlestick patterns confirm the signal
════════════════════
🟢 $LTC 4-hour bearish signal
⚠️Technical analysis: ADX has surged to 41, indicating a very strong trend; the MACD bearish crossover is driving a sharp drop, and all moving averages are trending downward; the KDJ bearish crossover remains in the weak zone (K28.8 is below D), with volume up 2.2x.
════════════════════
🟢 $STRC 4-hour bearish signal
⚠️Technical analysis: ADX indicates a fairly strong trend; MACD has fallen below the zero line and turned bearish; EMA5 has crossed below EMA8, signaling short-term weakness; KDJ has crossed bearishly, with K below D; trading volume is up 1.6x, pointing to a short-term bearish bias.
════════════════════
🟢 $LAB 4-hour bearish signal
⚠️Technical analysis: ADX39 indicates a very strong trend; volume increased after the MACD bearish crossover; the moving averages are bearishly aligned and diverging downward; KDJ has crossed bearishly but is not oversold; volume has surged 4x, with a bearish short-term outlook.
════════════════════
🔔 Follow for first-hand market updates 🔔
#技术分析 #LTC #STRC #LAB
📌 When trading, pay attention to whether the candlestick patterns confirm the signal
13
·
--
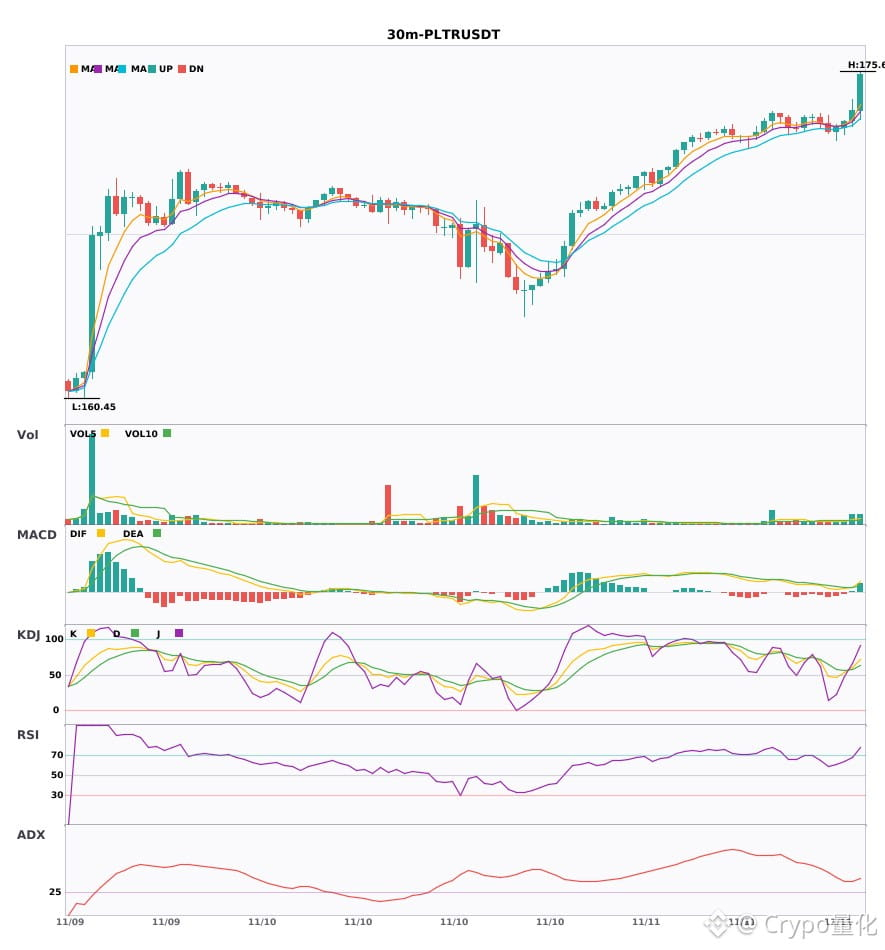
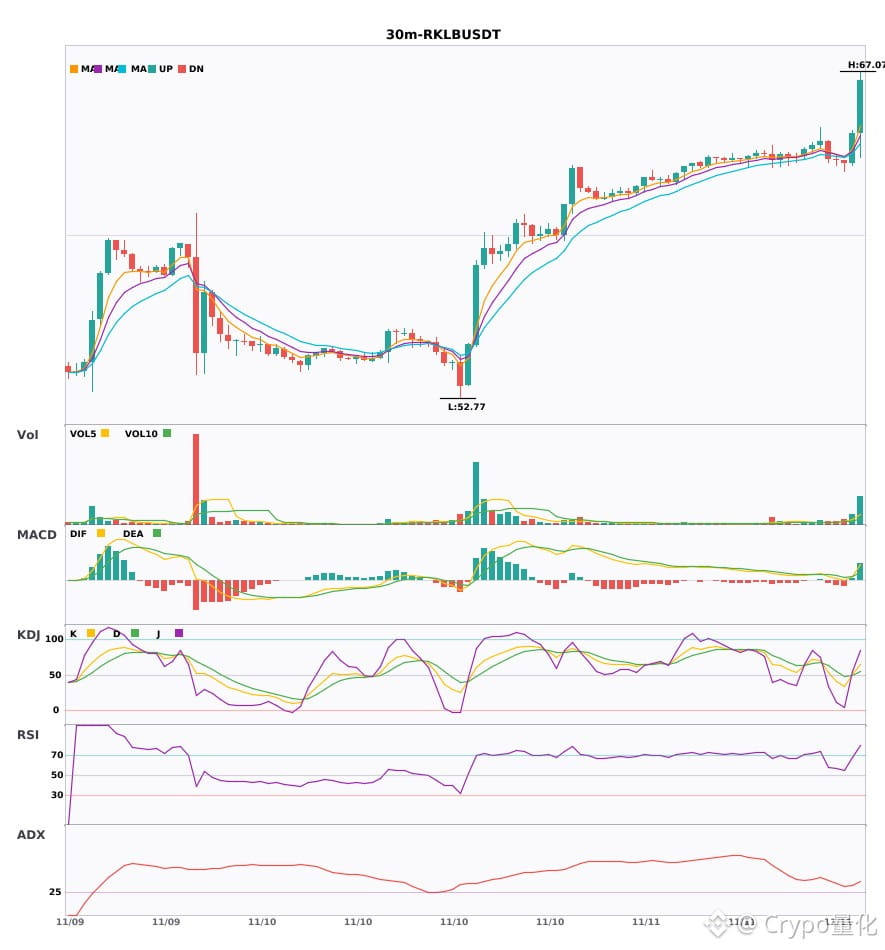
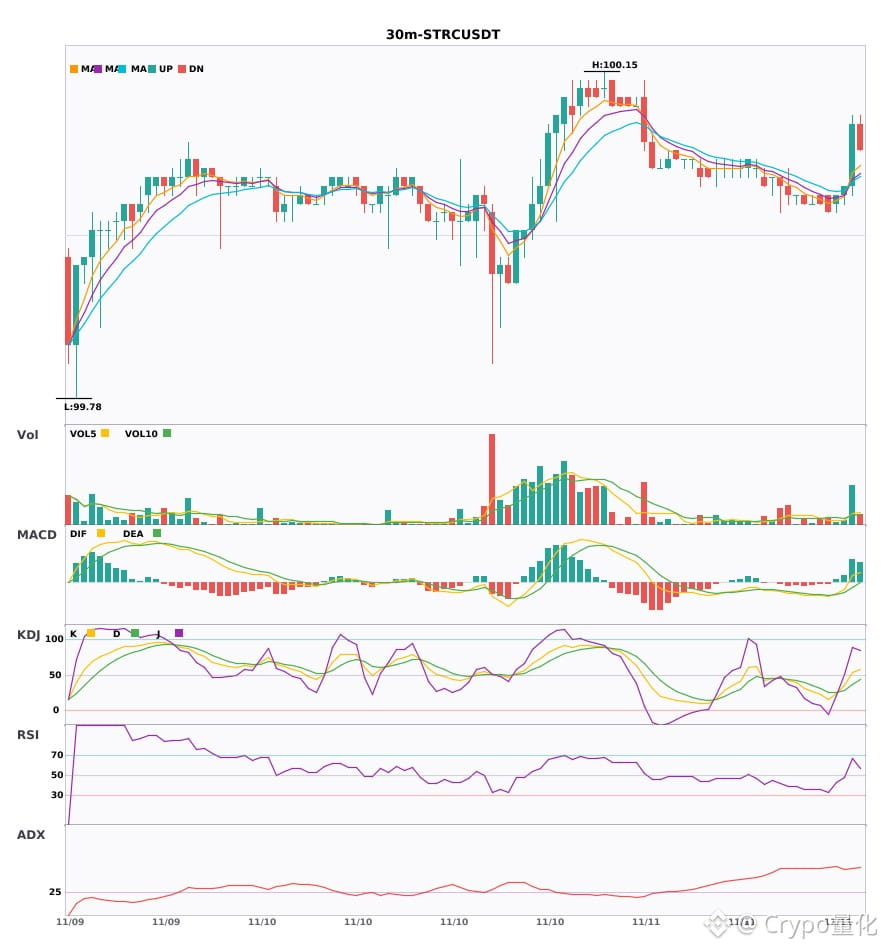
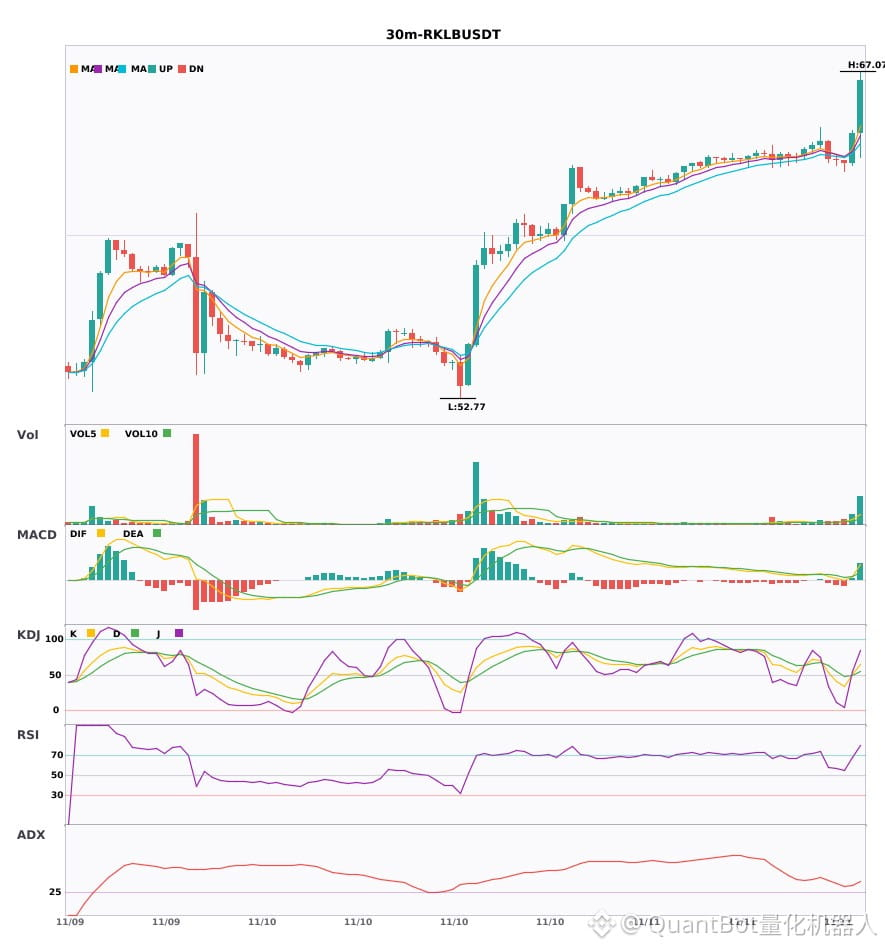
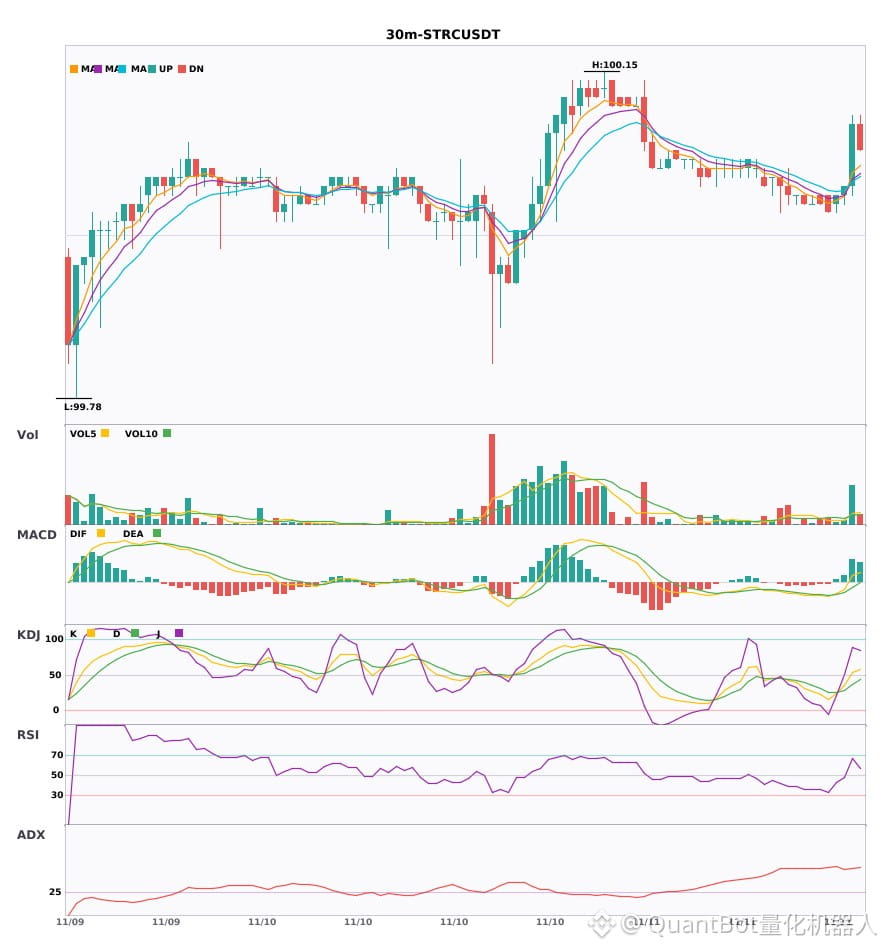
Three bullish signals on the 30-minute timeframe appeared simultaneously: $PLTR / $RKLB / $STRC🔥
════════════════════
🔴 $PLTR 30-minute bullish signal
⚠️Technical analysis: ADX(35): clear trending market | MACD golden cross above zero, bullish momentum emerging | EMA5 > EMA8 > EMA13, bullish alignment | KDJ golden cross, bullish in the short term (K: 60.7, D: 58.1) | Volume increase (2.4x)
════════════════════
🔴 $RKLB 30-minute bullish signal
⚠️Technical analysis: ADX(29): trend is forming; opportunity to participate | MACD golden cross above zero, bullish momentum emerging | EMA5 crossed above EMA8, short-term outlook turns bullish | KDJ golden cross, bullish in the short term (K: 51.1, D: 49.2) | Volume surge (2.8x)
════════════════════
🔴 $STRC 30-minute bullish signal
⚠️Technical analysis: ADX(54): very strong trend (watch out for an overheated pullback) | MACD DIF crossed above the zero line, trend turns bullish | EMA5 crossed above EMA8, short-term outlook turns bullish | Volume surge (3.8x)
════════════════════
🔔 Follow us for first-hand market updates 🔔
#技术分析 #PLTR #RKLB #STRC
📌 When trading, pay attention to whether the candlestick patterns confirm the signal
Three bullish signals on the 30-minute timeframe appeared simultaneously: $PLTR / $RKLB / $STRC 🔥
════════════════════
🔴 $PLTR 30-minute bullish signal
⚠️Technical analysis: ADX(35): clear trending market | MACD golden cross above zero, bullish momentum emerging | EMA5 > EMA8 > EMA13, bullish alignment | KDJ golden cross, bullish in the short term (K: 60.7, D: 58.1) | Volume increase (2.4x)
════════════════════
🔴 $RKLB 30-minute bullish signal
⚠️Technical analysis: ADX(29): trend is forming; opportunity to participate | MACD golden cross above zero, bullish momentum emerging | EMA5 crossed above EMA8, short-term outlook turns bullish | KDJ golden cross, bullish in the short term (K: 51.1, D: 49.2) | Volume surge (2.8x)
════════════════════
🔴 $STRC 30-minute bullish signal
⚠️Technical analysis: ADX(54): very strong trend (watch out for an overheated pullback) | MACD DIF crossed above the zero line, trend turns bullish | EMA5 crossed above EMA8, short-term outlook turns bullish | Volume surge (3.8x)
════════════════════
🔔 Follow us for first-hand market updates 🔔
#技术分析 #PLTR #RKLB #STRC
📌 When trading, pay attention to whether the candlestick patterns confirm the signal
════════════════════
🔴 $PLTR 30-minute bullish signal
⚠️Technical analysis: ADX(35): clear trending market | MACD golden cross above zero, bullish momentum emerging | EMA5 > EMA8 > EMA13, bullish alignment | KDJ golden cross, bullish in the short term (K: 60.7, D: 58.1) | Volume increase (2.4x)
════════════════════
🔴 $RKLB 30-minute bullish signal
⚠️Technical analysis: ADX(29): trend is forming; opportunity to participate | MACD golden cross above zero, bullish momentum emerging | EMA5 crossed above EMA8, short-term outlook turns bullish | KDJ golden cross, bullish in the short term (K: 51.1, D: 49.2) | Volume surge (2.8x)
════════════════════
🔴 $STRC 30-minute bullish signal
⚠️Technical analysis: ADX(54): very strong trend (watch out for an overheated pullback) | MACD DIF crossed above the zero line, trend turns bullish | EMA5 crossed above EMA8, short-term outlook turns bullish | Volume surge (3.8x)
════════════════════
🔔 Follow us for first-hand market updates 🔔
#技术分析 #PLTR #RKLB #STRC
📌 When trading, pay attention to whether the candlestick patterns confirm the signal
3
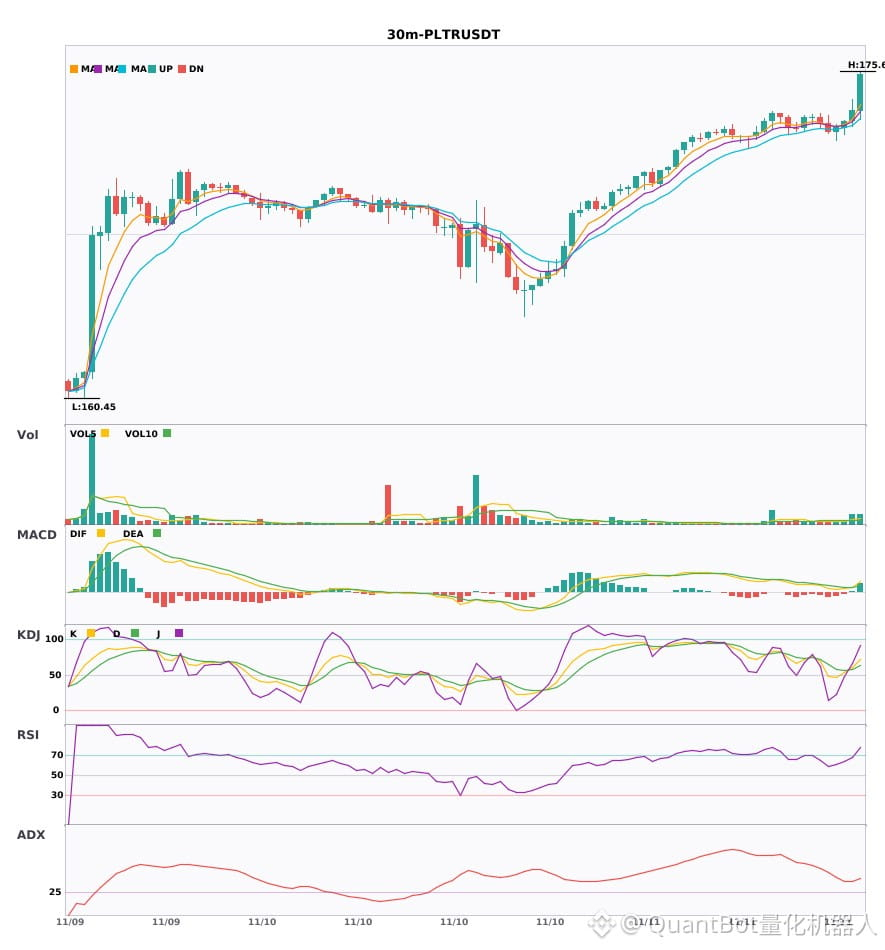
$PLTR / $RKLB / $STRC Bullish bias on the 30-minute timeframe, with short-term confluence opportunities
📈 $PLTR | 30-minute bullish signal
━━━━━━━━━━━━━━━━━━
Technical analysis: ADX(35): clear trending market | MACD golden cross above zero, bullish momentum released | EMA5 > EMA8 > EMA13: bullish alignment | KDJ golden cross, bullish short-term outlook (K: 60.7, D: 58.1) | Volume increased (2.4x)
Price change: 0.3000%
📈 $RKLB | 30-minute bullish signal
━━━━━━━━━━━━━━━━━━
Technical analysis: ADX(29): trend forming, potential entry | MACD golden cross above zero, bullish momentum released | EMA5 crossed above EMA8, short-term outlook turns bullish | KDJ golden cross, bullish short-term outlook (K: 51.1, D: 49.2) | Volume surged (2.8x)
Price change: 2.0500%
📈 $STRC | 30-minute bullish signal
━━━━━━━━━━━━━━━━━━
Technical analysis: ADX(54): very strong trend (beware of a potential overbought pullback) | MACD DIF broke above zero, trend turns bullish | EMA5 crossed above EMA8, short-term outlook turns bullish | Volume surged (3.8x)
Price change: 0.0700%
━━━━━━━━━━━━━━━━━━
#技术分析 #PLTR #RKLB #STRC
📌 The above content is for reference only and does not constitute investment advice
$PLTR / $RKLB / $STRC Bullish bias on the 30-minute timeframe, with short-term confluence opportunities
📈 $PLTR | 30-minute bullish signal
━━━━━━━━━━━━━━━━━━
Technical analysis: ADX(35): clear trending market | MACD golden cross above zero, bullish momentum released | EMA5 > EMA8 > EMA13: bullish alignment | KDJ golden cross, bullish short-term outlook (K: 60.7, D: 58.1) | Volume increased (2.4x)
Price change: 0.3000%
📈 $RKLB | 30-minute bullish signal
━━━━━━━━━━━━━━━━━━
Technical analysis: ADX(29): trend forming, potential entry | MACD golden cross above zero, bullish momentum released | EMA5 crossed above EMA8, short-term outlook turns bullish | KDJ golden cross, bullish short-term outlook (K: 51.1, D: 49.2) | Volume surged (2.8x)
Price change: 2.0500%
📈 $STRC | 30-minute bullish signal
━━━━━━━━━━━━━━━━━━
Technical analysis: ADX(54): very strong trend (beware of a potential overbought pullback) | MACD DIF broke above zero, trend turns bullish | EMA5 crossed above EMA8, short-term outlook turns bullish | Volume surged (3.8x)
Price change: 0.0700%
━━━━━━━━━━━━━━━━━━
#技术分析 #PLTR #RKLB #STRC
📌 The above content is for reference only and does not constitute investment advice
📈 $PLTR | 30-minute bullish signal
━━━━━━━━━━━━━━━━━━
Technical analysis: ADX(35): clear trending market | MACD golden cross above zero, bullish momentum released | EMA5 > EMA8 > EMA13: bullish alignment | KDJ golden cross, bullish short-term outlook (K: 60.7, D: 58.1) | Volume increased (2.4x)
Price change: 0.3000%
📈 $RKLB | 30-minute bullish signal
━━━━━━━━━━━━━━━━━━
Technical analysis: ADX(29): trend forming, potential entry | MACD golden cross above zero, bullish momentum released | EMA5 crossed above EMA8, short-term outlook turns bullish | KDJ golden cross, bullish short-term outlook (K: 51.1, D: 49.2) | Volume surged (2.8x)
Price change: 2.0500%
📈 $STRC | 30-minute bullish signal
━━━━━━━━━━━━━━━━━━
Technical analysis: ADX(54): very strong trend (beware of a potential overbought pullback) | MACD DIF broke above zero, trend turns bullish | EMA5 crossed above EMA8, short-term outlook turns bullish | Volume surged (3.8x)
Price change: 0.0700%
━━━━━━━━━━━━━━━━━━
#技术分析 #PLTR #RKLB #STRC
📌 The above content is for reference only and does not constitute investment advice
6
·
--
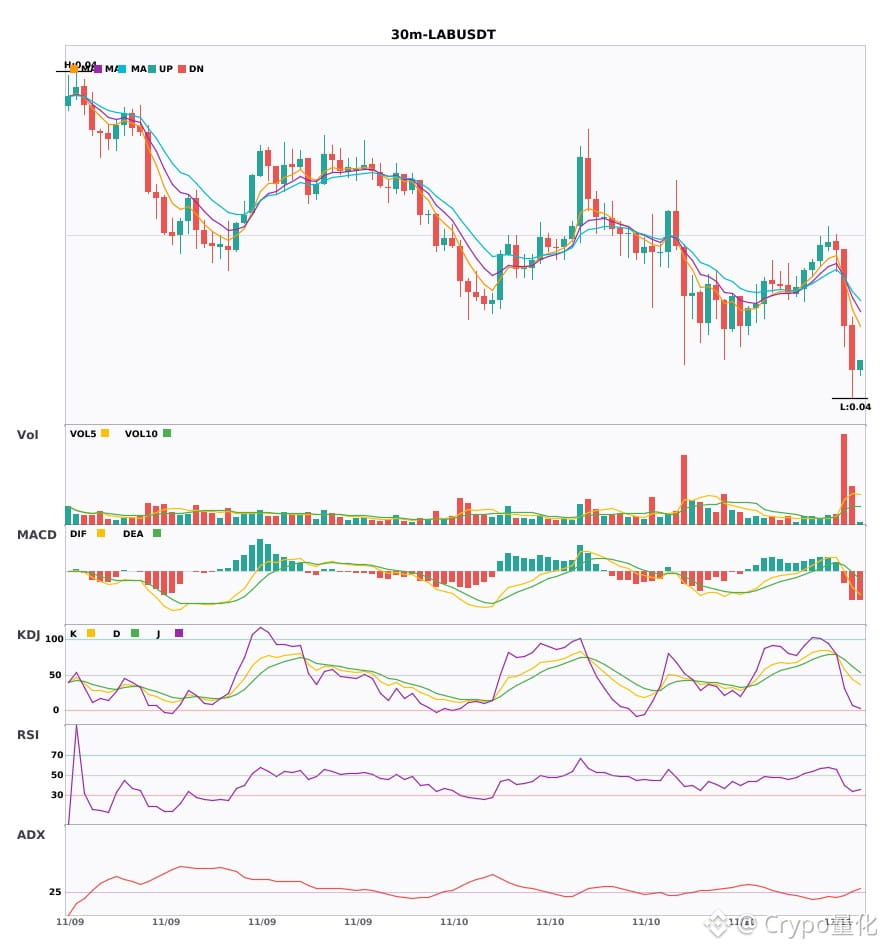
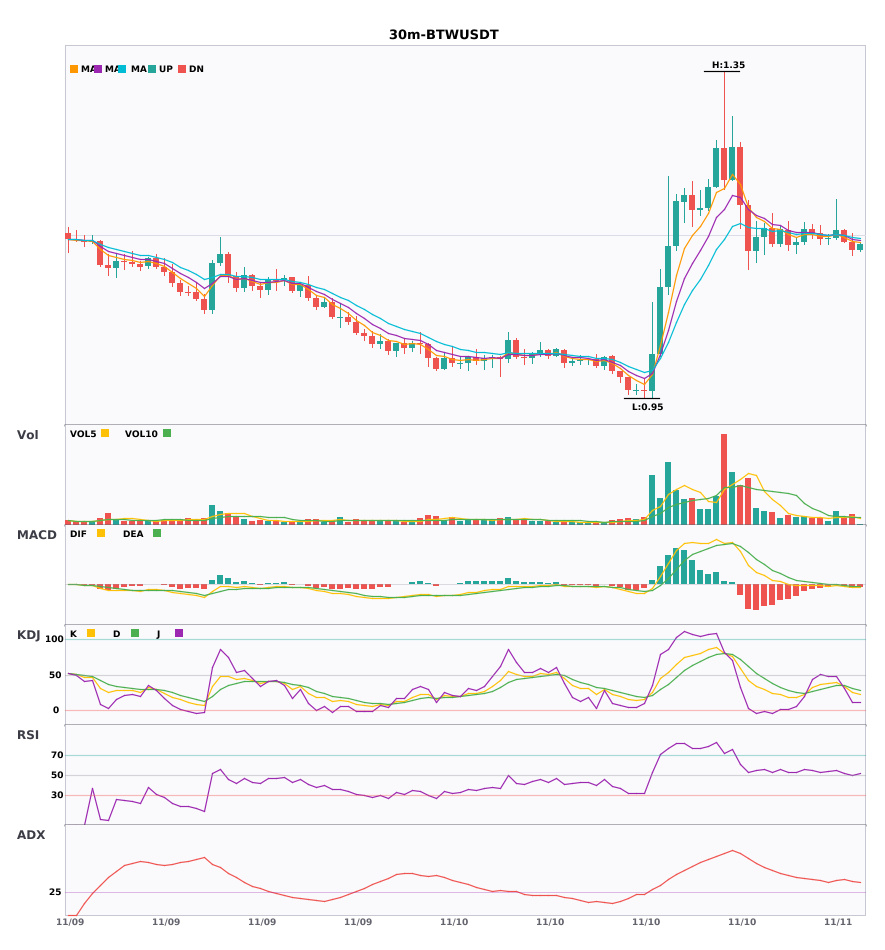
$LAB / $STRC / $BTW 30-minute timeframe bearish, under short-term pressure 🔥
════════════════════
🟢 $LAB 30-minute bearish signal
⚠️Technical analysis: ADX(28) Trend is forming; opportunity to participate | MACD DIF has fallen below the zero line, trend turning bearish | EMA5 < EMA8 < EMA13, bearish alignment | Volume surge (5.8x)
════════════════════
🟢 $STRC 30-minute bearish signal
⚠️Technical analysis: ADX(27) Trend is forming; opportunity to participate | MACD DIF has fallen below the zero line, trend turning bearish | Moving averages are converging and building momentum, direction likely to be chosen soon | Volume increase (1.6x)
📢Market update: Strategy spent more than twice as much on preferred buybacks as Bitcoin last week - The November 9 filing shows common-stock proceeds funding Bitcoin purchases and a larger STRC buyback during November 2-8. Read the full story on Cryp...
════════════════════
🟢 $BTW 30-minute bearish signal
⚠️Technical analysis: ADX(37) Clear trending market | MACD is bearish, trend is weak, momentum is strengthening | EMA5 < EMA8 < EMA13, bearish alignment | KDJ bearish crossover, short-term outlook bearish (K is 33.5, D is 34.6) | Volume increase (1.5x)
════════════════════
🔔 Follow for first-hand market alerts 🔔
#技术分析 #LAB #STRC #BTW
📌 When trading, pay attention to whether the candlestick pattern confirms the setup
$LAB / $STRC / $BTW 30-minute timeframe bearish, under short-term pressure 🔥
════════════════════
🟢 $LAB 30-minute bearish signal
⚠️Technical analysis: ADX(28) Trend is forming; opportunity to participate | MACD DIF has fallen below the zero line, trend turning bearish | EMA5 < EMA8 < EMA13, bearish alignment | Volume surge (5.8x)
════════════════════
🟢 $STRC 30-minute bearish signal
⚠️Technical analysis: ADX(27) Trend is forming; opportunity to participate | MACD DIF has fallen below the zero line, trend turning bearish | Moving averages are converging and building momentum, direction likely to be chosen soon | Volume increase (1.6x)
📢Market update: Strategy spent more than twice as much on preferred buybacks as Bitcoin last week - The November 9 filing shows common-stock proceeds funding Bitcoin purchases and a larger STRC buyback during November 2-8. Read the full story on Cryp...
════════════════════
🟢 $BTW 30-minute bearish signal
⚠️Technical analysis: ADX(37) Clear trending market | MACD is bearish, trend is weak, momentum is strengthening | EMA5 < EMA8 < EMA13, bearish alignment | KDJ bearish crossover, short-term outlook bearish (K is 33.5, D is 34.6) | Volume increase (1.5x)
════════════════════
🔔 Follow for first-hand market alerts 🔔
#技术分析 #LAB #STRC #BTW
📌 When trading, pay attention to whether the candlestick pattern confirms the setup
════════════════════
🟢 $LAB 30-minute bearish signal
⚠️Technical analysis: ADX(28) Trend is forming; opportunity to participate | MACD DIF has fallen below the zero line, trend turning bearish | EMA5 < EMA8 < EMA13, bearish alignment | Volume surge (5.8x)
════════════════════
🟢 $STRC 30-minute bearish signal
⚠️Technical analysis: ADX(27) Trend is forming; opportunity to participate | MACD DIF has fallen below the zero line, trend turning bearish | Moving averages are converging and building momentum, direction likely to be chosen soon | Volume increase (1.6x)
📢Market update: Strategy spent more than twice as much on preferred buybacks as Bitcoin last week - The November 9 filing shows common-stock proceeds funding Bitcoin purchases and a larger STRC buyback during November 2-8. Read the full story on Cryp...
════════════════════
🟢 $BTW 30-minute bearish signal
⚠️Technical analysis: ADX(37) Clear trending market | MACD is bearish, trend is weak, momentum is strengthening | EMA5 < EMA8 < EMA13, bearish alignment | KDJ bearish crossover, short-term outlook bearish (K is 33.5, D is 34.6) | Volume increase (1.5x)
════════════════════
🔔 Follow for first-hand market alerts 🔔
#技术分析 #LAB #STRC #BTW
📌 When trading, pay attention to whether the candlestick pattern confirms the setup
15
·
--
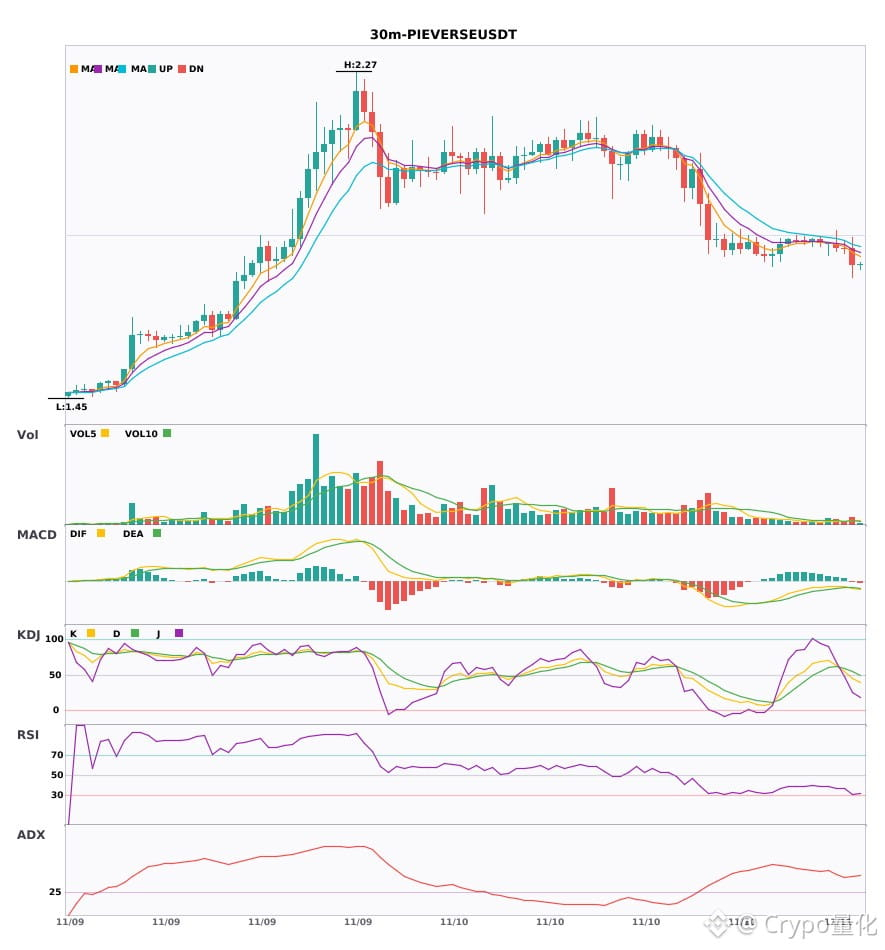
$PIEVERSE / $STRC / $BTW 30-minute technical indicators are weakening in sync; beware of risk 🔥
════════════════════
🟢 $PIEVERSE 30-minute bearish signal
⚠️Technical: ADX(41) Clear trending market | MACD bearish cross below zero, bearish momentum accelerating | EMA5 < EMA8 < EMA13, bearish alignment | Volume increased (1.9x)
════════════════════
🟢 $STRC 30-minute bearish signal
⚠️Technical: ADX(27) Trend is forming; opportunity to participate | MACD DIF fell below zero, trend turned bearish | Moving averages are converging, building momentum; direction to be chosen soon | Volume increased (1.6x)
📢Market update: Strategy spent more than twice as much on preferred buybacks as Bitcoin last week - The November 9 filing shows common-stock proceeds funding Bitcoin purchases and a larger STRC buyback during November 2-8. Read the full story on Cryp...
════════════════════
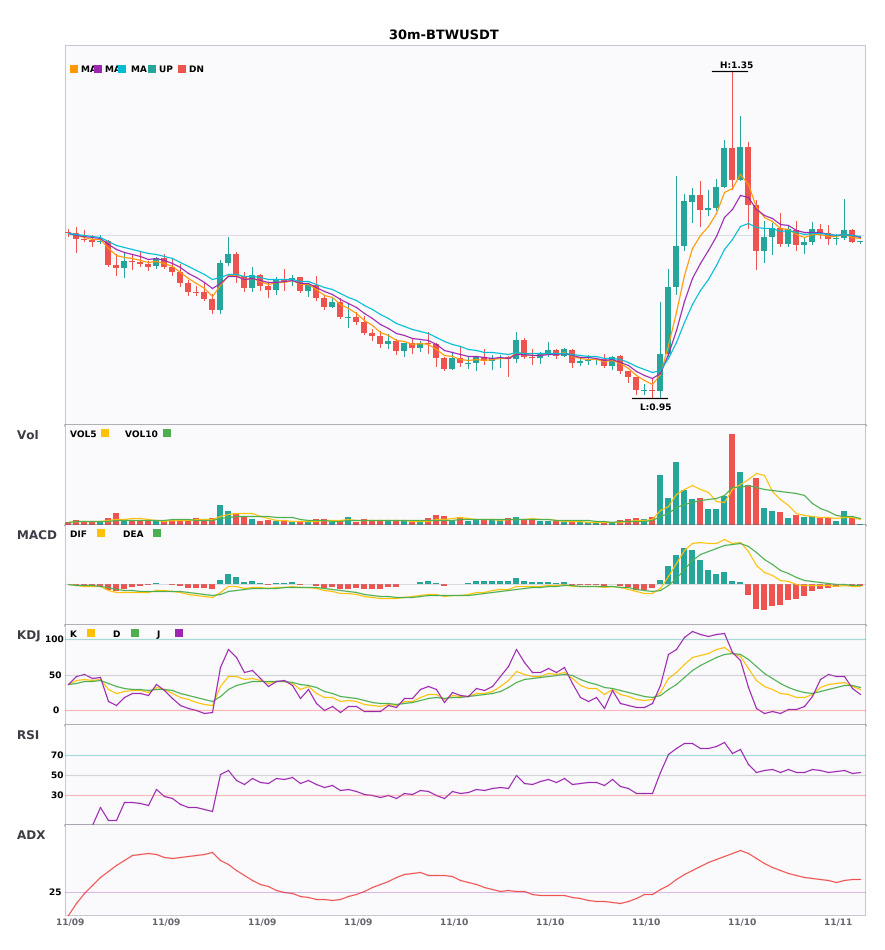
🟢 $BTW 30-minute bearish signal
⚠️Technical: ADX(37) Clear trending market | MACD is bearish; trend is weak, momentum strengthening | EMA5 < EMA8 < EMA13, bearish alignment | KDJ bearish cross, short-term outlook bearish (K: 33.5, D: 34.6) | Volume increased (1.5x)
════════════════════
🔔 Follow for first-hand market alerts 🔔
#技术分析 #PIEVERSE #STRC #BTW
📌 When trading, pay attention to whether the candlestick pattern meets the criteria
$PIEVERSE / $STRC / $BTW 30-minute technical indicators are weakening in sync; beware of risk 🔥
════════════════════
🟢 $PIEVERSE 30-minute bearish signal
⚠️Technical: ADX(41) Clear trending market | MACD bearish cross below zero, bearish momentum accelerating | EMA5 < EMA8 < EMA13, bearish alignment | Volume increased (1.9x)
════════════════════
🟢 $STRC 30-minute bearish signal
⚠️Technical: ADX(27) Trend is forming; opportunity to participate | MACD DIF fell below zero, trend turned bearish | Moving averages are converging, building momentum; direction to be chosen soon | Volume increased (1.6x)
📢Market update: Strategy spent more than twice as much on preferred buybacks as Bitcoin last week - The November 9 filing shows common-stock proceeds funding Bitcoin purchases and a larger STRC buyback during November 2-8. Read the full story on Cryp...
════════════════════
🟢 $BTW 30-minute bearish signal
⚠️Technical: ADX(37) Clear trending market | MACD is bearish; trend is weak, momentum strengthening | EMA5 < EMA8 < EMA13, bearish alignment | KDJ bearish cross, short-term outlook bearish (K: 33.5, D: 34.6) | Volume increased (1.5x)
════════════════════
🔔 Follow for first-hand market alerts 🔔
#技术分析 #PIEVERSE #STRC #BTW
📌 When trading, pay attention to whether the candlestick pattern meets the criteria
════════════════════
🟢 $PIEVERSE 30-minute bearish signal
⚠️Technical: ADX(41) Clear trending market | MACD bearish cross below zero, bearish momentum accelerating | EMA5 < EMA8 < EMA13, bearish alignment | Volume increased (1.9x)
════════════════════
🟢 $STRC 30-minute bearish signal
⚠️Technical: ADX(27) Trend is forming; opportunity to participate | MACD DIF fell below zero, trend turned bearish | Moving averages are converging, building momentum; direction to be chosen soon | Volume increased (1.6x)
📢Market update: Strategy spent more than twice as much on preferred buybacks as Bitcoin last week - The November 9 filing shows common-stock proceeds funding Bitcoin purchases and a larger STRC buyback during November 2-8. Read the full story on Cryp...
════════════════════
🟢 $BTW 30-minute bearish signal
⚠️Technical: ADX(37) Clear trending market | MACD is bearish; trend is weak, momentum strengthening | EMA5 < EMA8 < EMA13, bearish alignment | KDJ bearish cross, short-term outlook bearish (K: 33.5, D: 34.6) | Volume increased (1.5x)
════════════════════
🔔 Follow for first-hand market alerts 🔔
#技术分析 #PIEVERSE #STRC #BTW
📌 When trading, pay attention to whether the candlestick pattern meets the criteria
15

·
--
Strategy sold $283.8 million of $MSTR stock, repurchased $188.3 million of $STRC preferred stock, and spent $81.9 million to buy 1,036 $BTC. Since October, it has repurchased about $1.06 billion of STRC preferred stock, increasing its BTC holdings to 850,400. Peter Schiff: STRC is dead, kept alive on artificial life support. MSCI will announce the list of companies facing index removal in two days. #Strategy #BTC #STRC
Strategy sold $283.8 million of $MSTR stock, repurchased $188.3 million of $STRC preferred stock, and spent $81.9 million to buy 1,036 $BTC . Since October, it has repurchased about $1.06 billion of STRC preferred stock, increasing its BTC holdings to 850,400. Peter Schiff: STRC is dead, kept alive on artificial life support. MSCI will announce the list of companies facing index removal in two days. #Strategy #BTC #STRC
14

·
--
Bullish
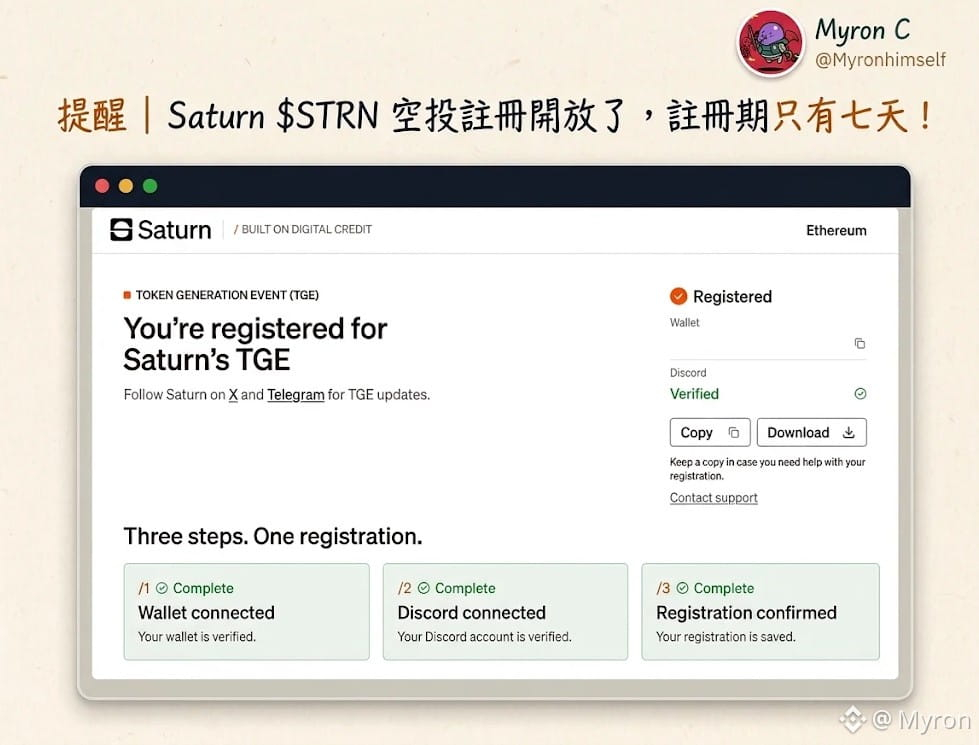
Reminder | Saturn $STRN airdrop registration is now open, and the registration period is only seven days!
Whether you earned points in Season 1 or Season 2, you must complete registration within these seven days to remain eligible to claim the airdrop.
Saturn uses Discord linking to filter out sybil accounts. Each wallet address can be linked to one Discord account.
After registering, you can click “Copy” to save your registration information, or click “Download” to save it as a text file for future reference.
Important: After registering, we recommend disconnecting and reconnecting to check that your registration is complete and make sure it went through!
-
Generally, deposit-based projects don’t see much multi-accounting, but some people may still use self-referrals (linking different wallets they own) to earn referral points.
Alternatively, you may have originally interacted with Saturn using your main wallet, then added a Binance Wallet to earn airdrop points after Saturn incentives launched on Binance Wallet.
If this applies to you, make sure to register a new Discord account in the next two days, since a Discord account must be at least five days old to register for the airdrop.
-
At last, there’s another airdrop to claim! Congratulations to everyone who’s stuck around since $STRC !!
-
● The above content does not constitute investment advice. Readers should conduct their own independent research and make decisions based on their investment objectives and risk tolerance. Please participate in the investment market with caution.
● Image source: Saturn
● Saturn 5% bonus: "SAT-B0F7AF00"
#Airdrop #Saturn #STRC #STRN
{stock_us}(STRC.US)
{future}(STRCUSDT)
Reminder | Saturn $STRN airdrop registration is now open, and the registration period is only seven days!
Whether you earned points in Season 1 or Season 2, you must complete registration within these seven days to remain eligible to claim the airdrop.
Saturn uses Discord linking to filter out sybil accounts. Each wallet address can be linked to one Discord account.
After registering, you can click “Copy” to save your registration information, or click “Download” to save it as a text file for future reference.
Important: After registering, we recommend disconnecting and reconnecting to check that your registration is complete and make sure it went through!
-
Generally, deposit-based projects don’t see much multi-accounting, but some people may still use self-referrals (linking different wallets they own) to earn referral points.
Alternatively, you may have originally interacted with Saturn using your main wallet, then added a Binance Wallet to earn airdrop points after Saturn incentives launched on Binance Wallet.
If this applies to you, make sure to register a new Discord account in the next two days, since a Discord account must be at least five days old to register for the airdrop.
-
At last, there’s another airdrop to claim! Congratulations to everyone who’s stuck around since $STRC !!
-
● The above content does not constitute investment advice. Readers should conduct their own independent research and make decisions based on their investment objectives and risk tolerance. Please participate in the investment market with caution.
● Image source: Saturn
● Saturn 5% bonus: "SAT-B0F7AF00"
#Airdrop #Saturn #STRC #STRN
Whether you earned points in Season 1 or Season 2, you must complete registration within these seven days to remain eligible to claim the airdrop.
Saturn uses Discord linking to filter out sybil accounts. Each wallet address can be linked to one Discord account.
After registering, you can click “Copy” to save your registration information, or click “Download” to save it as a text file for future reference.
Important: After registering, we recommend disconnecting and reconnecting to check that your registration is complete and make sure it went through!
-
Generally, deposit-based projects don’t see much multi-accounting, but some people may still use self-referrals (linking different wallets they own) to earn referral points.
Alternatively, you may have originally interacted with Saturn using your main wallet, then added a Binance Wallet to earn airdrop points after Saturn incentives launched on Binance Wallet.
If this applies to you, make sure to register a new Discord account in the next two days, since a Discord account must be at least five days old to register for the airdrop.
-
At last, there’s another airdrop to claim! Congratulations to everyone who’s stuck around since $STRC !!
-
● The above content does not constitute investment advice. Readers should conduct their own independent research and make decisions based on their investment objectives and risk tolerance. Please participate in the investment market with caution.
● Image source: Saturn
● Saturn 5% bonus: "SAT-B0F7AF00"
#Airdrop #Saturn #STRC #STRN
合约交易员-褚忠娟:
66
1
2
357

#🚨 Strategy's $4.79 Billion Reserve: What's Happening Behind the Scenes?
I've been looking at Strategy's latest financial moves, and there are some interesting developments worth discussing.
As of November 1, the company reported a $4.79 billion dollar reserve along with $132.7 million in cash.
Between October 26 and November 1, Strategy used $43.4 million from its reserve to cover preferred stock dividends. It also repurchased $208.2 million worth of STRC during the same period.
What's particularly interesting is that Strategy has continued expanding its share repurchase authorization, increasing the limit from $2 billion to $3 billion.
Another important detail: STRC dividends now accrue daily, including weekends and holidays, starting November 1.
My biggest takeaway: These financial moves deserve close attention, especially when it comes to how Strategy manages its reserves, Bitcoin holdings, and dividend obligations.
One thing investors should remember is that STRC is not directly secured by Strategy's Bitcoin holdings. Its payments depend on the company's available resources.
What's your take? Is Strategy managing it financial obligations effectively? 👇
#Strategy #Bitcoin #BTC #STRC #CryptoNews #Binance
#🚨 Strategy's $4.79 Billion Reserve: What's Happening Behind the Scenes?
I've been looking at Strategy's latest financial moves, and there are some interesting developments worth discussing.
As of November 1, the company reported a $4.79 billion dollar reserve along with $132.7 million in cash.
Between October 26 and November 1, Strategy used $43.4 million from its reserve to cover preferred stock dividends. It also repurchased $208.2 million worth of STRC during the same period.
What's particularly interesting is that Strategy has continued expanding its share repurchase authorization, increasing the limit from $2 billion to $3 billion.
Another important detail: STRC dividends now accrue daily, including weekends and holidays, starting November 1.
My biggest takeaway: These financial moves deserve close attention, especially when it comes to how Strategy manages its reserves, Bitcoin holdings, and dividend obligations.
One thing investors should remember is that STRC is not directly secured by Strategy's Bitcoin holdings. Its payments depend on the company's available resources.
What's your take? Is Strategy managing it financial obligations effectively? 👇
#Strategy #Bitcoin #BTC #STRC #CryptoNews #Binance
I've been looking at Strategy's latest financial moves, and there are some interesting developments worth discussing.
As of November 1, the company reported a $4.79 billion dollar reserve along with $132.7 million in cash.
Between October 26 and November 1, Strategy used $43.4 million from its reserve to cover preferred stock dividends. It also repurchased $208.2 million worth of STRC during the same period.
What's particularly interesting is that Strategy has continued expanding its share repurchase authorization, increasing the limit from $2 billion to $3 billion.
Another important detail: STRC dividends now accrue daily, including weekends and holidays, starting November 1.
My biggest takeaway: These financial moves deserve close attention, especially when it comes to how Strategy manages its reserves, Bitcoin holdings, and dividend obligations.
One thing investors should remember is that STRC is not directly secured by Strategy's Bitcoin holdings. Its payments depend on the company's available resources.
What's your take? Is Strategy managing it financial obligations effectively? 👇
#Strategy #Bitcoin #BTC #STRC #CryptoNews #Binance

2
30

·
--
【Market Update】Saylor hints at buying more crypto; STRC returns to $100
Saylor hinted in a post that Strategy may have bought Bitcoin again; STRC has returned to its $100 face value. Last week, from October 26 to November 1, it bought 811 BTC at an average price of $80,846, bringing its holdings to 849,327 BTC. During the same period, it repurchased 2.09 million STRC shares at an average price of $99.52. How much will it officially announce this time?
$BTC $MSTR $STRC
#比特币 #微策略 #STRC
(Source: CoinGape)
⚠️ Risk warning: The above is shared for informational purposes only and does not constitute investment advice. Investing involves risks; proceed with caution.
【Market Update】Saylor hints at buying more crypto; STRC returns to $100
Saylor hinted in a post that Strategy may have bought Bitcoin again; STRC has returned to its $100 face value. Last week, from October 26 to November 1, it bought 811 BTC at an average price of $80,846, bringing its holdings to 849,327 BTC. During the same period, it repurchased 2.09 million STRC shares at an average price of $99.52. How much will it officially announce this time?
$BTC $MSTR $STRC
#比特币 #微策略 #STRC
(Source: CoinGape)
⚠️ Risk warning: The above is shared for informational purposes only and does not constitute investment advice. Investing involves risks; proceed with caution.
Saylor hinted in a post that Strategy may have bought Bitcoin again; STRC has returned to its $100 face value. Last week, from October 26 to November 1, it bought 811 BTC at an average price of $80,846, bringing its holdings to 849,327 BTC. During the same period, it repurchased 2.09 million STRC shares at an average price of $99.52. How much will it officially announce this time?
$BTC $MSTR $STRC
#比特币 #微策略 #STRC
(Source: CoinGape)
⚠️ Risk warning: The above is shared for informational purposes only and does not constitute investment advice. Investing involves risks; proceed with caution.

28

#StrategySTRCResumesIssuanceAfterOver170Days
Strategy's STRC Issuance Is Back After 170+ Days — Could Bitcoin Buying Accelerate?
After more than 170 days, Strategy's STRC preferred stock issuance has reportedly resumed, bringing an important Bitcoin funding channel back into focus. On November 5, reports indicated that the renewed issuance raised an estimated amount sufficient to purchase more than 120 BTC. The development follows STRC's return to its $100 stated value on November 4, its first time reaching that level since May. Strategy had maintained a policy of avoiding new STRC issuance below $100. The company also introduced daily dividend arrangements, while STRC currently carries a 12% annual dividend rate. Strategy held 849,327 BTC as of November 1, making this financing development particularly relevant to institutional Bitcoin demand.
What Could This Mean for Bitcoin Traders?
The resumption of STRC issuance could strengthen Strategy's ability to raise capital and potentially expand its Bitcoin treasury. However, traders should distinguish estimated issuance proceeds from officially confirmed BTC purchases. Watch STRC's ability to hold the $100 level, actual issuance volumes, Strategy's next SEC filing, BTC trading volume, and key support and resistance levels. A sustained STRC recovery alongside confirmed capital inflows could support the bullish institutional-demand narrative. If STRC falls below $100 again, the funding outlook could weaken.
What's your view? Could Strategy's renewed STRC issuance become another major driver of Bitcoin accumulation?
#STRC #Strategy
$STRC
{future}(STRCUSDT)
$STRC.US
{stock_us}(STRC.US)
$BTC
{future}(BTCUSDT)
#StrategySTRCResumesIssuanceAfterOver170Days
Strategy's STRC Issuance Is Back After 170+ Days — Could Bitcoin Buying Accelerate?
After more than 170 days, Strategy's STRC preferred stock issuance has reportedly resumed, bringing an important Bitcoin funding channel back into focus. On November 5, reports indicated that the renewed issuance raised an estimated amount sufficient to purchase more than 120 BTC. The development follows STRC's return to its $100 stated value on November 4, its first time reaching that level since May. Strategy had maintained a policy of avoiding new STRC issuance below $100. The company also introduced daily dividend arrangements, while STRC currently carries a 12% annual dividend rate. Strategy held 849,327 BTC as of November 1, making this financing development particularly relevant to institutional Bitcoin demand.
What Could This Mean for Bitcoin Traders?
The resumption of STRC issuance could strengthen Strategy's ability to raise capital and potentially expand its Bitcoin treasury. However, traders should distinguish estimated issuance proceeds from officially confirmed BTC purchases. Watch STRC's ability to hold the $100 level, actual issuance volumes, Strategy's next SEC filing, BTC trading volume, and key support and resistance levels. A sustained STRC recovery alongside confirmed capital inflows could support the bullish institutional-demand narrative. If STRC falls below $100 again, the funding outlook could weaken.
What's your view? Could Strategy's renewed STRC issuance become another major driver of Bitcoin accumulation?
#STRC #Strategy
$STRC
$STRC.US
$BTC
Strategy's STRC Issuance Is Back After 170+ Days — Could Bitcoin Buying Accelerate?
After more than 170 days, Strategy's STRC preferred stock issuance has reportedly resumed, bringing an important Bitcoin funding channel back into focus. On November 5, reports indicated that the renewed issuance raised an estimated amount sufficient to purchase more than 120 BTC. The development follows STRC's return to its $100 stated value on November 4, its first time reaching that level since May. Strategy had maintained a policy of avoiding new STRC issuance below $100. The company also introduced daily dividend arrangements, while STRC currently carries a 12% annual dividend rate. Strategy held 849,327 BTC as of November 1, making this financing development particularly relevant to institutional Bitcoin demand.
What Could This Mean for Bitcoin Traders?
The resumption of STRC issuance could strengthen Strategy's ability to raise capital and potentially expand its Bitcoin treasury. However, traders should distinguish estimated issuance proceeds from officially confirmed BTC purchases. Watch STRC's ability to hold the $100 level, actual issuance volumes, Strategy's next SEC filing, BTC trading volume, and key support and resistance levels. A sustained STRC recovery alongside confirmed capital inflows could support the bullish institutional-demand narrative. If STRC falls below $100 again, the funding outlook could weaken.
What's your view? Could Strategy's renewed STRC issuance become another major driver of Bitcoin accumulation?
#STRC #Strategy
$STRC
$STRC.US
$BTC

BTC-3.56%
STRCUS-0.07%
43

·
--
#strategystrcresumesissuanceafterover170days
STRC Is Back at $100. Is Strategy Issuing Again? Not Confirmed Yet 🔍
STRC, Strategy's variable-rate perpetual preferred, printed $100 on Nov 4 for the first time since May 14, closing at $99.98.
Why it matters: Strategy's stated policy is not to issue STRC below $100. Par is the key that reopens that funding route.
Confirmed vs. estimated:
✅ No STRC ATM sales since mid-May; $17.51B capacity still unused (Nov 2 8-K)
✅ Last week: 811 BTC bought, funded by MSTR sales, not STRC
✅ ~$2.25B spent on STRC buybacks since July to pull it back to par
✅ Daily dividends started Nov 1 (12% annual rate)
⚠️ The "120+ BTC" headline is a tracker estimate (~$9.6M of possible sales), not a filing
Takeaway: trading at par permits issuance but doesn't commit Strategy to it. One print isn't "sustained, healthy trading" either. The next weekly 8-K (usually Monday) will show whether any shares were sold.
Will STRC hold par without buyback support? 👇
$STRC
{future}(STRCUSDT)
$MSTR
{future}(MSTRUSDT)
$BTC
{future}(BTCUSDT)
#Strategy #STRC #Bitcoin
#strategystrcresumesissuanceafterover170days
STRC Is Back at $100. Is Strategy Issuing Again? Not Confirmed Yet 🔍
STRC, Strategy's variable-rate perpetual preferred, printed $100 on Nov 4 for the first time since May 14, closing at $99.98.
Why it matters: Strategy's stated policy is not to issue STRC below $100. Par is the key that reopens that funding route.
Confirmed vs. estimated:
✅ No STRC ATM sales since mid-May; $17.51B capacity still unused (Nov 2 8-K)
✅ Last week: 811 BTC bought, funded by MSTR sales, not STRC
✅ ~$2.25B spent on STRC buybacks since July to pull it back to par
✅ Daily dividends started Nov 1 (12% annual rate)
⚠️ The "120+ BTC" headline is a tracker estimate (~$9.6M of possible sales), not a filing
Takeaway: trading at par permits issuance but doesn't commit Strategy to it. One print isn't "sustained, healthy trading" either. The next weekly 8-K (usually Monday) will show whether any shares were sold.
Will STRC hold par without buyback support? 👇
$STRC
$MSTR
$BTC
#Strategy #STRC #Bitcoin
STRC Is Back at $100. Is Strategy Issuing Again? Not Confirmed Yet 🔍
STRC, Strategy's variable-rate perpetual preferred, printed $100 on Nov 4 for the first time since May 14, closing at $99.98.
Why it matters: Strategy's stated policy is not to issue STRC below $100. Par is the key that reopens that funding route.
Confirmed vs. estimated:
✅ No STRC ATM sales since mid-May; $17.51B capacity still unused (Nov 2 8-K)
✅ Last week: 811 BTC bought, funded by MSTR sales, not STRC
✅ ~$2.25B spent on STRC buybacks since July to pull it back to par
✅ Daily dividends started Nov 1 (12% annual rate)
⚠️ The "120+ BTC" headline is a tracker estimate (~$9.6M of possible sales), not a filing
Takeaway: trading at par permits issuance but doesn't commit Strategy to it. One print isn't "sustained, healthy trading" either. The next weekly 8-K (usually Monday) will show whether any shares were sold.
Will STRC hold par without buyback support? 👇
$STRC
$MSTR
$BTC
#Strategy #STRC #Bitcoin

365

·
--
#StrategySTRCResumesIssuanceAfterOver170Days
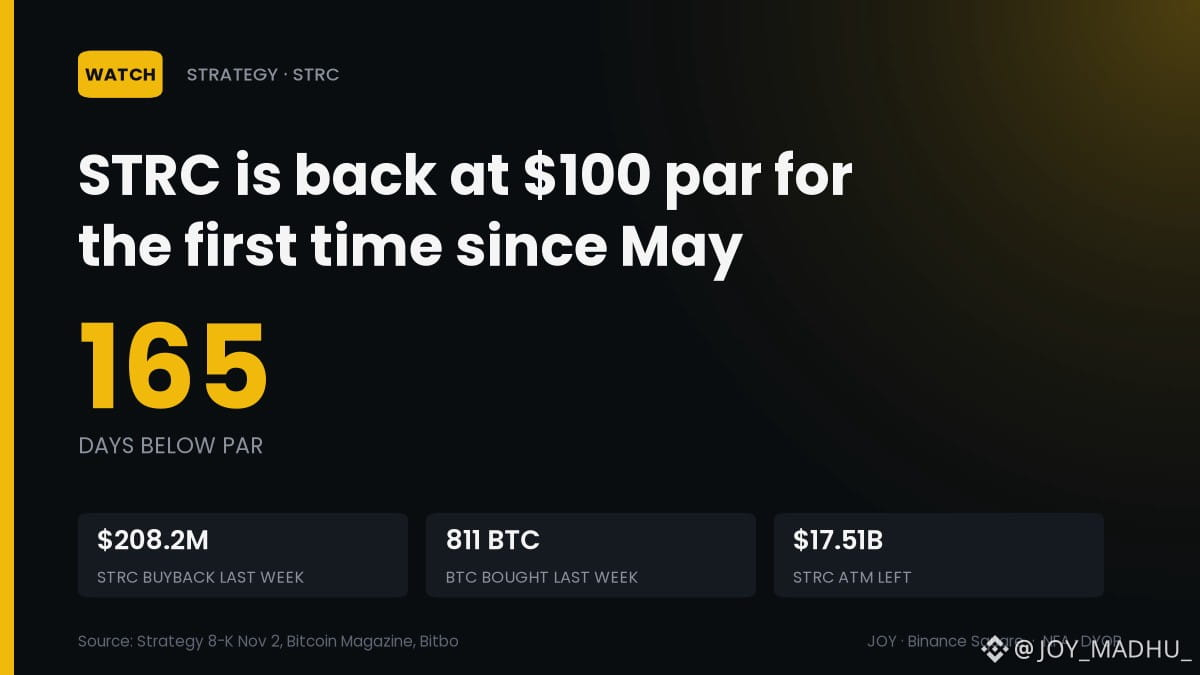
🔄 STRC Is Back at Par, and Strategy May Be Selling Again
STRC touched $100 on Nov 4 for the first time since May, and Bitcoin Treasuries estimates the day's raise could fund 120+ BTC.
📅 165 days below par; June low was $71.25
🏦 $208.2M of STRC bought back last week vs $65.5M for 811 BTC
📊 Nov 2 filing: no STRC sold, $17.51B still available
⚠️ The 120+ BTC figure is an estimate, not yet in a filing
Zoom out: par reopens the funding route; the next weekly 8-K shows if it ran.
Next filing: STRC sales above $50M or below? 👇
$BTC $MSTR
#Strategy #STRC #StrategySTRCResumesIssuanceAfterOver170Days
#StrategySTRCResumesIssuanceAfterOver170Days
🔄 STRC Is Back at Par, and Strategy May Be Selling Again
STRC touched $100 on Nov 4 for the first time since May, and Bitcoin Treasuries estimates the day's raise could fund 120+ BTC.
📅 165 days below par; June low was $71.25
🏦 $208.2M of STRC bought back last week vs $65.5M for 811 BTC
📊 Nov 2 filing: no STRC sold, $17.51B still available
⚠️ The 120+ BTC figure is an estimate, not yet in a filing
Zoom out: par reopens the funding route; the next weekly 8-K shows if it ran.
Next filing: STRC sales above $50M or below? 👇
$BTC $MSTR
#Strategy #STRC #StrategySTRCResumesIssuanceAfterOver170Days
🔄 STRC Is Back at Par, and Strategy May Be Selling Again
STRC touched $100 on Nov 4 for the first time since May, and Bitcoin Treasuries estimates the day's raise could fund 120+ BTC.
📅 165 days below par; June low was $71.25
🏦 $208.2M of STRC bought back last week vs $65.5M for 811 BTC
📊 Nov 2 filing: no STRC sold, $17.51B still available
⚠️ The 120+ BTC figure is an estimate, not yet in a filing
Zoom out: par reopens the funding route; the next weekly 8-K shows if it ran.
Next filing: STRC sales above $50M or below? 👇
$BTC $MSTR
#Strategy #STRC #StrategySTRCResumesIssuanceAfterOver170Days
41
Log in to explore more content
Join global crypto users on Binance Square
⚡️ Get latest and useful information about crypto.
💬 Trusted by the world’s largest crypto exchange.
👍 Discover real insights from verified creators.
Email / Phone number
Trending Topics
1
#WhoWillSucceedJensenHuangatNvidia?
192,714 views
1,759 Discussing
2
#WhatWillDriveCryptoandStocks’NextRebound?
607,124 views
3,590 Discussing
3
#TradFiForBeginners
745,437 views
4,565 Discussing
4
#BitcoinActiveSupplyInProfitDropsBelow45%
86,864 views
787 Discussing
5
#KavaSaysAbnormalActivityLimitedToKavaLend
51,504 views
444 Discussing
6
#USSpotXRPETFsSeeLargestWeeklyOutflowIn8Months
36,684 views
385 Discussing
7
#USPPIMissMayEaseBTCPressure
321,748 views
2,311 Discussing
8
#WORPTLetsTouristsConvertCryptoToThaiBaht
11,451 views
109 Discussing
9
#TONStrategyReports$23.97MQ3NetLoss
11,128 views
49 Discussing
10
#PolkadotCommunityApprovesNewStrategyWith97%Vote
31,211 views
301 Discussing