
#relativestrength
relativestrength
19,991 views
275 Discussing
Hot
Latest

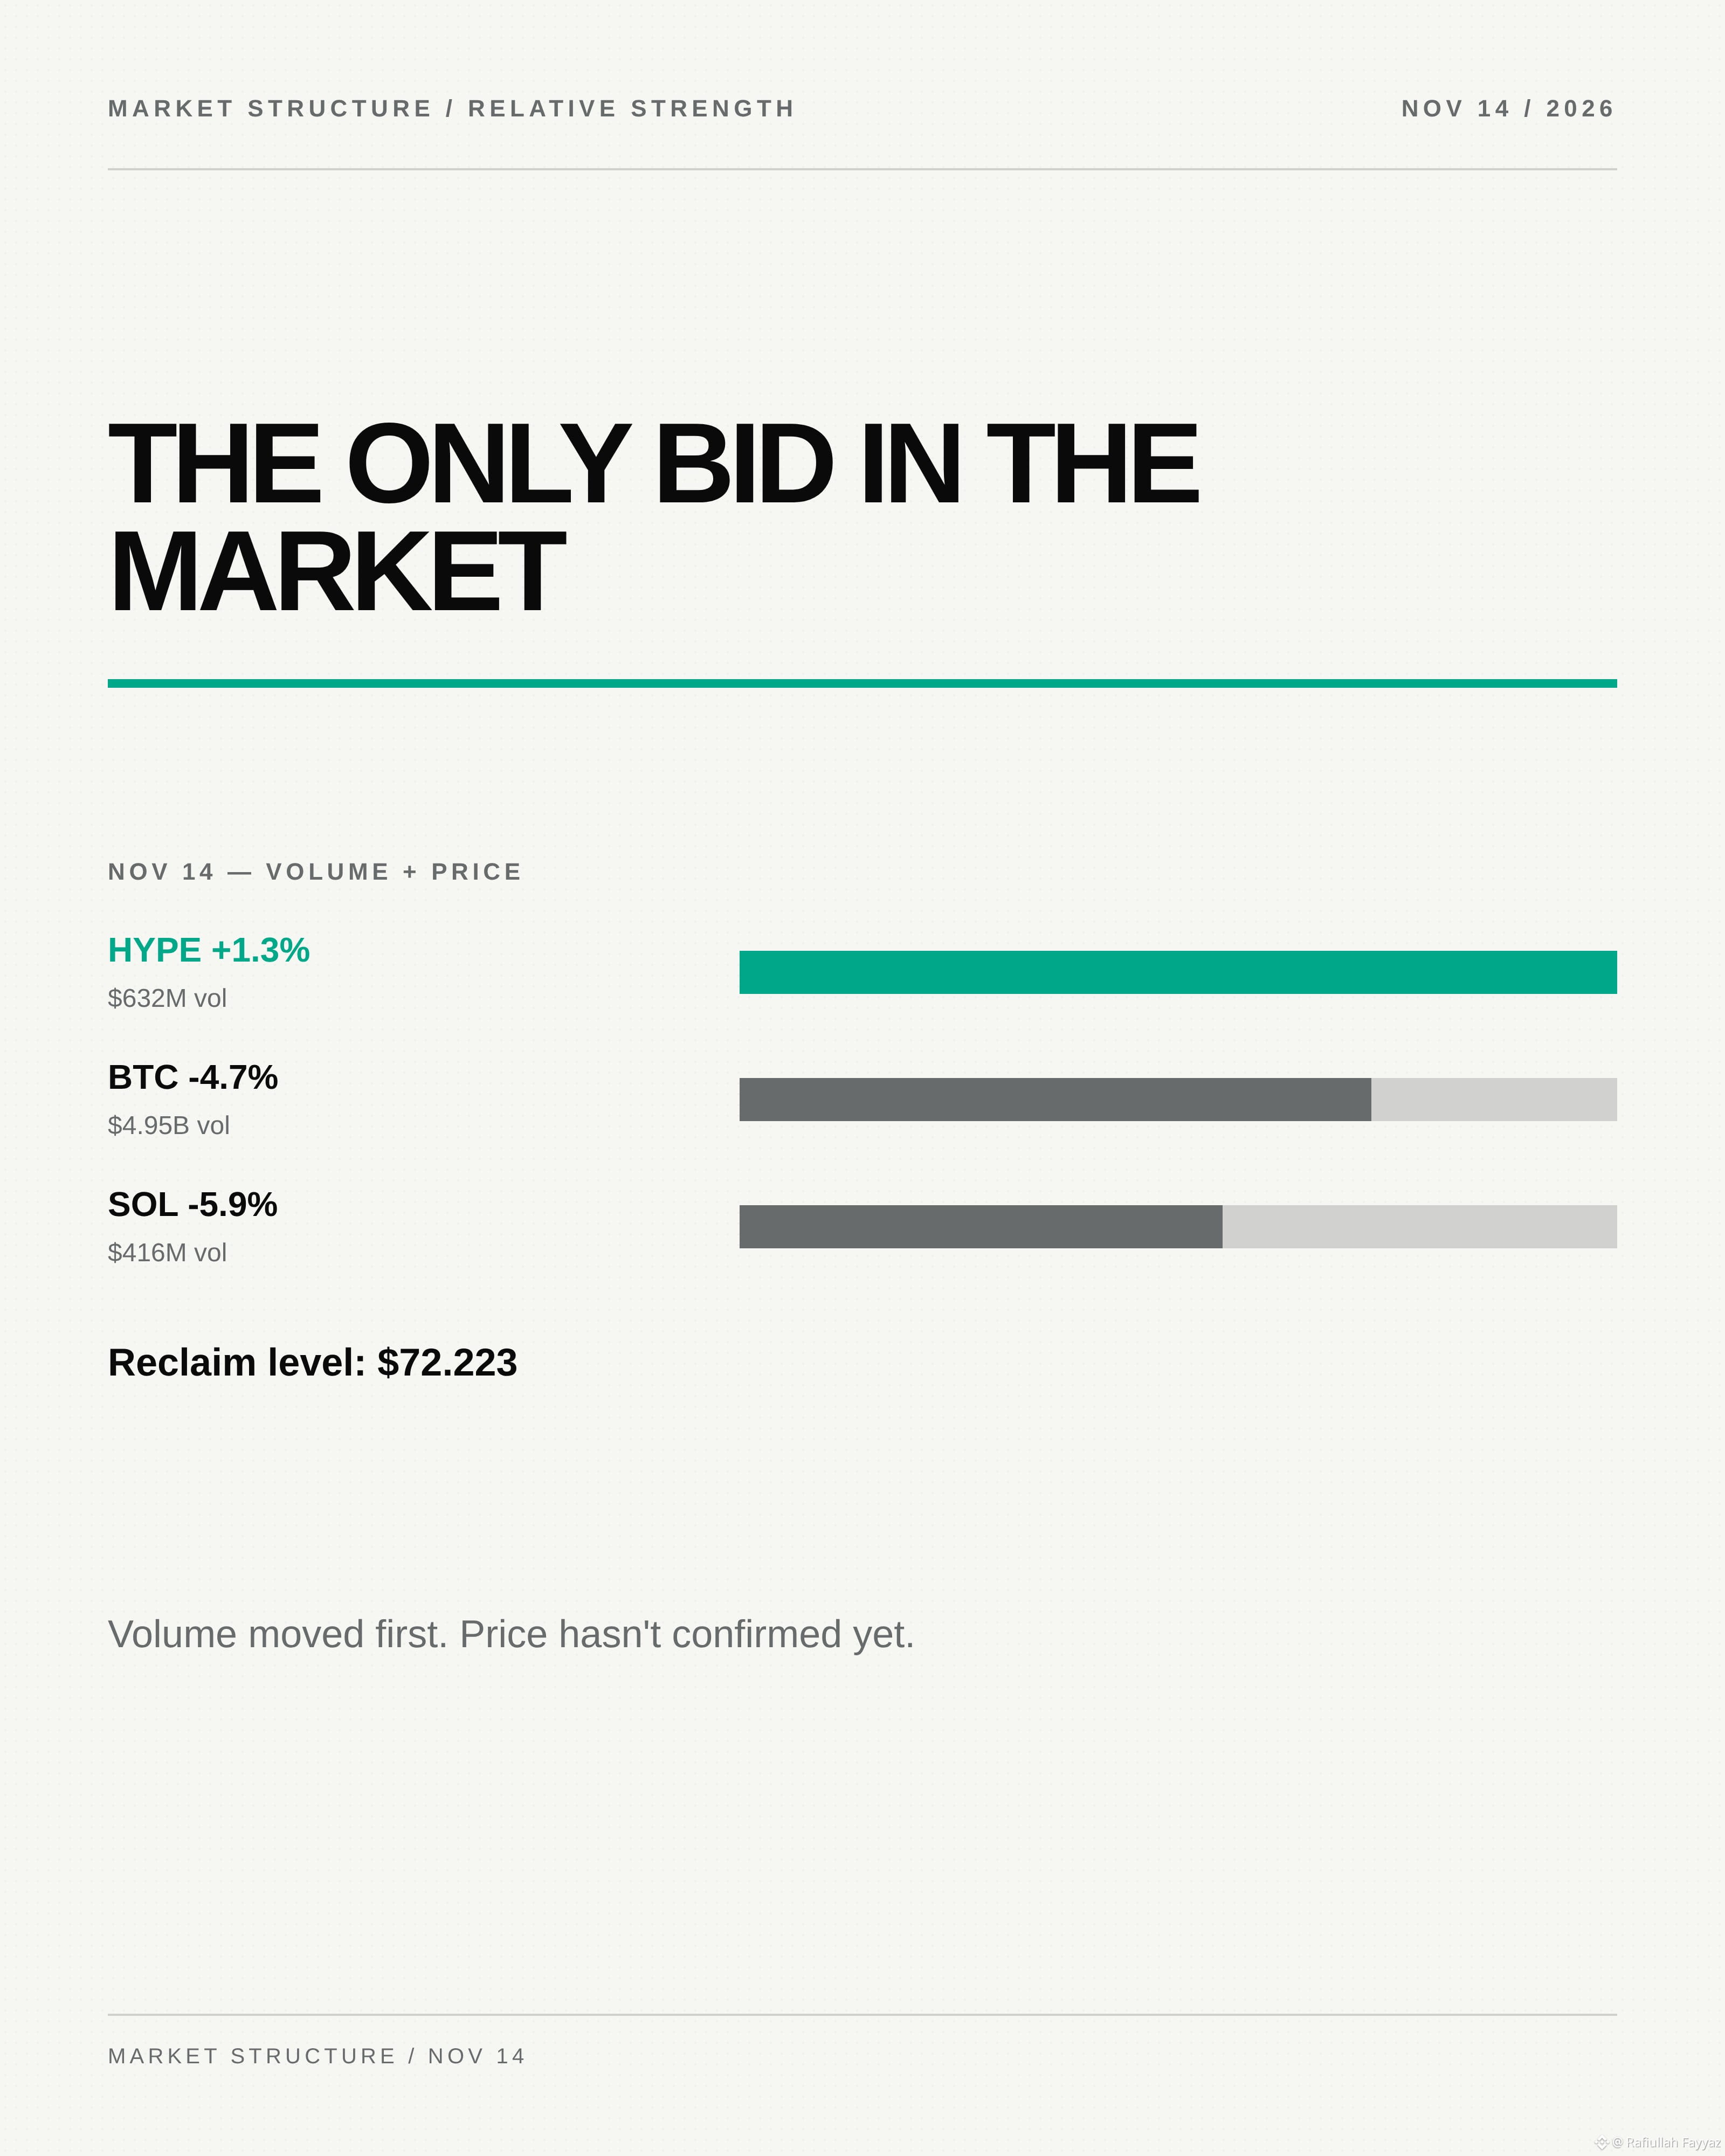
HYPE is the only asset absorbing this dump.
Up 1.3% to $70.47. Volume: $632 million—third-highest in the set, above SOL's $416 million. The rest of the market is down 5–7%. HYPE is green on rising volume.
That's not relative strength. That's accumulation behavior. The only bid in the market is here.
The risk: $72.223 is the reclaim level. If HYPE holds above it, the divergence confirms. If it fades below $70, the bid was temporary.
Volume is moving before price. That's the part worth investigating.
$HYPE
#RelativeStrength #VolumeDivergence #Accumulation #Hyperliquid #AltcoinResearch
{spot}(HYPEUSDT)
{spot}(SOLUSDT)
HYPE is the only asset absorbing this dump.
Up 1.3% to $70.47. Volume: $632 million—third-highest in the set, above SOL's $416 million. The rest of the market is down 5–7%. HYPE is green on rising volume.
That's not relative strength. That's accumulation behavior. The only bid in the market is here.
The risk: $72.223 is the reclaim level. If HYPE holds above it, the divergence confirms. If it fades below $70, the bid was temporary.
Volume is moving before price. That's the part worth investigating.
$HYPE
#RelativeStrength #VolumeDivergence #Accumulation #Hyperliquid #AltcoinResearch
Up 1.3% to $70.47. Volume: $632 million—third-highest in the set, above SOL's $416 million. The rest of the market is down 5–7%. HYPE is green on rising volume.
That's not relative strength. That's accumulation behavior. The only bid in the market is here.
The risk: $72.223 is the reclaim level. If HYPE holds above it, the divergence confirms. If it fades below $70, the bid was temporary.
Volume is moving before price. That's the part worth investigating.
$HYPE
#RelativeStrength #VolumeDivergence #Accumulation #Hyperliquid #AltcoinResearch
200

PAIR COMPARISON | $BNB
OBSERVATION — $BNB is -7.0% over 24h; $BTC is -4.4%.
CONTEXT — That leaves a -2.6 percentage-point gap over the same window.
NEXT CHECK — Relative strength describes this window; it does not predict the next one.
#BNB #LargeCaps #RelativeStrength
PAIR COMPARISON | $BNB
OBSERVATION — $BNB is -7.0% over 24h; $BTC is -4.4%.
CONTEXT — That leaves a -2.6 percentage-point gap over the same window.
NEXT CHECK — Relative strength describes this window; it does not predict the next one.
#BNB #LargeCaps #RelativeStrength
OBSERVATION — $BNB is -7.0% over 24h; $BTC is -4.4%.
CONTEXT — That leaves a -2.6 percentage-point gap over the same window.
NEXT CHECK — Relative strength describes this window; it does not predict the next one.
#BNB #LargeCaps #RelativeStrength
43

·
--
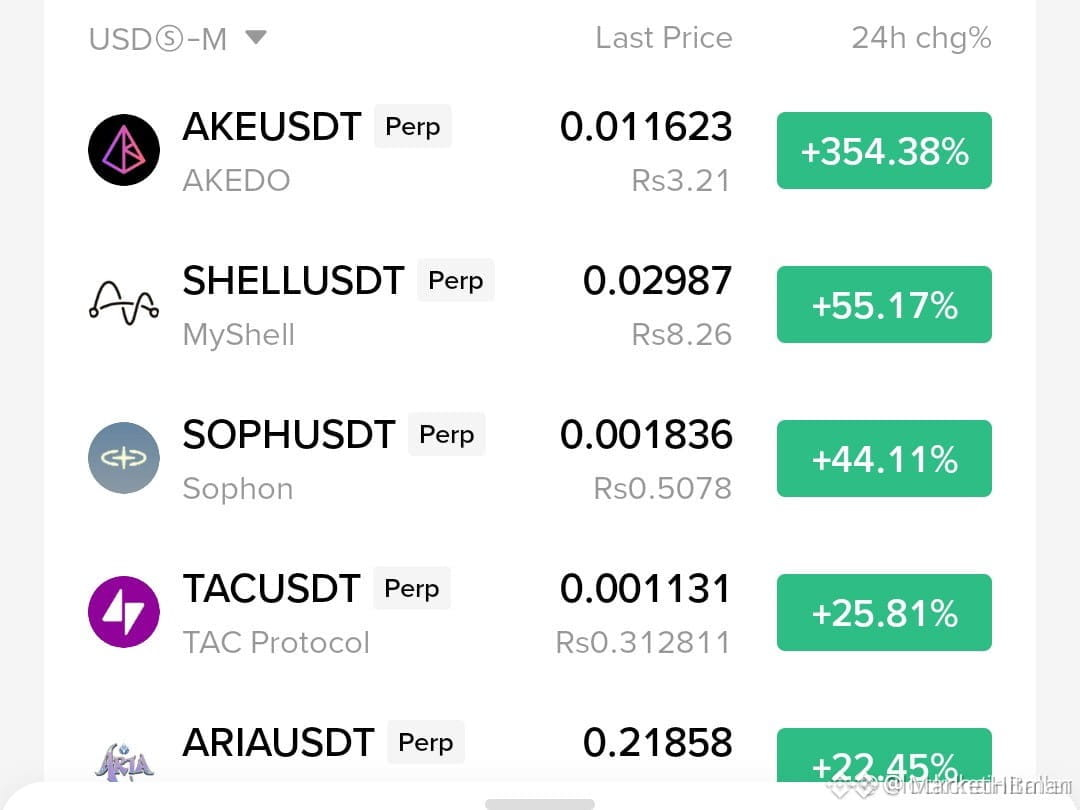
⚡ $AKE LEADING A MULTI-ASSET MOMENTUM SURGE ACROSS QUALITY ALTS! 📈
Order flow is shifting decisively as relative strength clusters in select pockets of the market. $AKE alongside $SHELL and $SOPH is demonstrating exceptional bid absorption while passive sellers get drained of inventory. ⚡
This kind of coordinated resilience signals institutional accumulation rather than fleeting retail noise. When multiple correlated assets lock in a simultaneous structural reclaim, smart money is quietly building position size ahead of the next expansion phase. 📊
Are you rotating capital into these relative strength leaders or waiting for a deeper pullback to enter? 👇
⚠️ Not financial advice. Always manage your risk. 🛡️
🏷️ #AKE #RelativeStrength #Momentum #Crypto
🔥 💎
⚡ $AKE LEADING A MULTI-ASSET MOMENTUM SURGE ACROSS QUALITY ALTS! 📈
Order flow is shifting decisively as relative strength clusters in select pockets of the market. $AKE alongside $SHELL and $SOPH is demonstrating exceptional bid absorption while passive sellers get drained of inventory. ⚡
This kind of coordinated resilience signals institutional accumulation rather than fleeting retail noise. When multiple correlated assets lock in a simultaneous structural reclaim, smart money is quietly building position size ahead of the next expansion phase. 📊
Are you rotating capital into these relative strength leaders or waiting for a deeper pullback to enter? 👇
⚠️ Not financial advice. Always manage your risk. 🛡️
🏷️ #AKE #RelativeStrength #Momentum #Crypto
🔥 💎
Order flow is shifting decisively as relative strength clusters in select pockets of the market. $AKE alongside $SHELL and $SOPH is demonstrating exceptional bid absorption while passive sellers get drained of inventory. ⚡
This kind of coordinated resilience signals institutional accumulation rather than fleeting retail noise. When multiple correlated assets lock in a simultaneous structural reclaim, smart money is quietly building position size ahead of the next expansion phase. 📊
Are you rotating capital into these relative strength leaders or waiting for a deeper pullback to enter? 👇
⚠️ Not financial advice. Always manage your risk. 🛡️
🏷️ #AKE #RelativeStrength #Momentum #Crypto
🔥 💎
16
$SOXLB is -15.6% over 24h; $BTC is -4.0%.
Context: That leaves a -11.5 percentage-point gap over the same window.
Has this relative gap held for more than one session?
#SOXLB #AltcoinFlow #RelativeStrength
$SOXLB is -15.6% over 24h; $BTC is -4.0%.
Context: That leaves a -11.5 percentage-point gap over the same window.
Has this relative gap held for more than one session?
#SOXLB #AltcoinFlow #RelativeStrength
Context: That leaves a -11.5 percentage-point gap over the same window.
Has this relative gap held for more than one session?
#SOXLB #AltcoinFlow #RelativeStrength
142

·
--
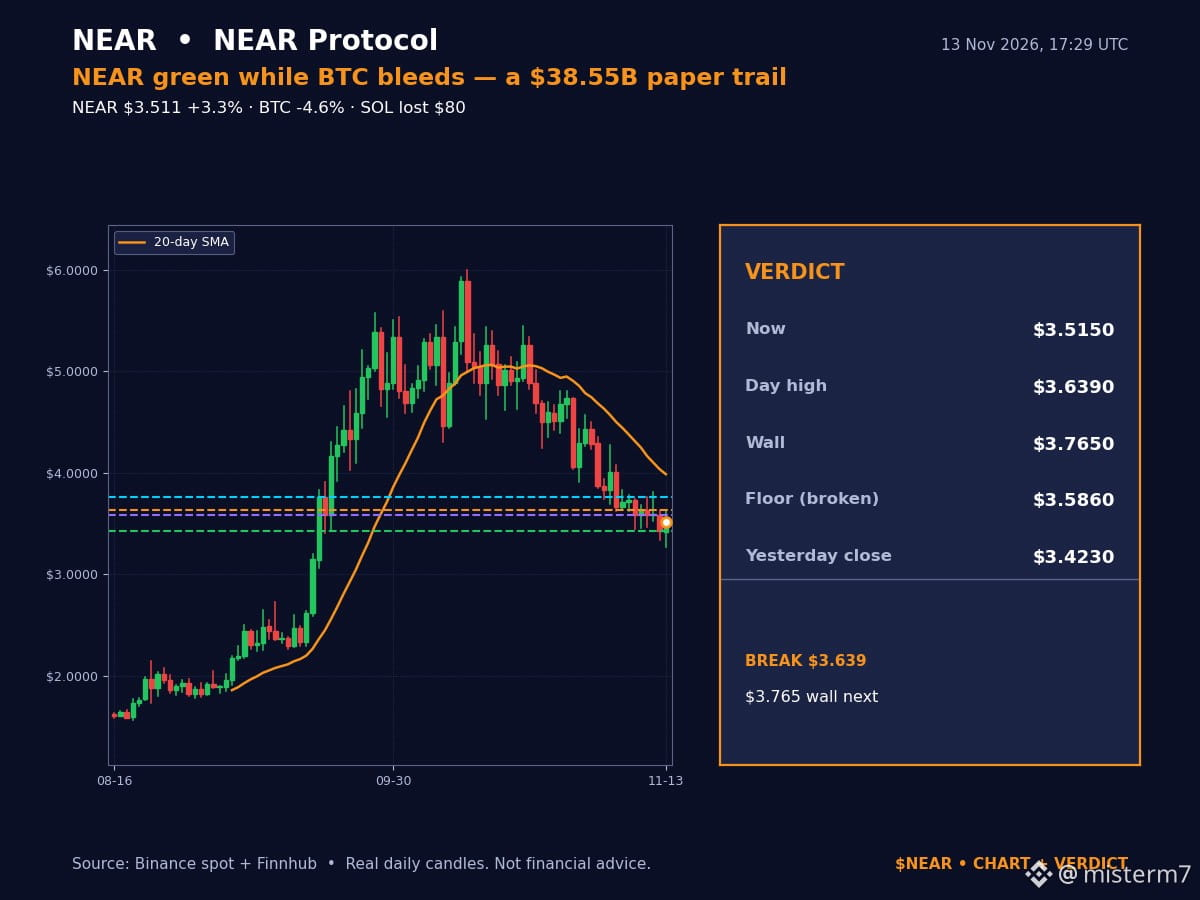
My $3.586 NEAR floor call from 11 Nov is wrong — it broke to $3.265 at 05:00 UTC, and $NEAR is clawing back at $3.511.
But watch the tape: while $BTC bled -4.6% to $68,707 and $SOL lost $80, NEAR is +3.3%, an 11.5% swing from the $3.265 low to the $3.639 high. The green candle has a paper trail: NEAR Intents went live inside Talos' order system on 9 Nov, and Intents has settled $38.55B in swaps, over $4B in the last 30 days.
I'm leaning cautiously bullish — NEAR still sits under its 20-day average near $3.99, so this is a reclaim attempt, not a trend flip.
If $NEAR breaks $3.639, the $3.765 wall that rejected it twice is next. A daily close back under $3.586 says the bounce was a trap — $3.423 next.
Data: Binance spot + Finnhub, 17:29 UTC; Intents volume: NEAR / NearStats.
Not financial advice. DYOR.
#NEAR #Utility #RelativeStrength
My $3.586 NEAR floor call from 11 Nov is wrong — it broke to $3.265 at 05:00 UTC, and $NEAR is clawing back at $3.511.
But watch the tape: while $BTC bled -4.6% to $68,707 and $SOL lost $80, NEAR is +3.3%, an 11.5% swing from the $3.265 low to the $3.639 high. The green candle has a paper trail: NEAR Intents went live inside Talos' order system on 9 Nov, and Intents has settled $38.55B in swaps, over $4B in the last 30 days.
I'm leaning cautiously bullish — NEAR still sits under its 20-day average near $3.99, so this is a reclaim attempt, not a trend flip.
If $NEAR breaks $3.639, the $3.765 wall that rejected it twice is next. A daily close back under $3.586 says the bounce was a trap — $3.423 next.
Data: Binance spot + Finnhub, 17:29 UTC; Intents volume: NEAR / NearStats.
Not financial advice. DYOR.
#NEAR #Utility #RelativeStrength
But watch the tape: while $BTC bled -4.6% to $68,707 and $SOL lost $80, NEAR is +3.3%, an 11.5% swing from the $3.265 low to the $3.639 high. The green candle has a paper trail: NEAR Intents went live inside Talos' order system on 9 Nov, and Intents has settled $38.55B in swaps, over $4B in the last 30 days.
I'm leaning cautiously bullish — NEAR still sits under its 20-day average near $3.99, so this is a reclaim attempt, not a trend flip.
If $NEAR breaks $3.639, the $3.765 wall that rejected it twice is next. A daily close back under $3.586 says the bounce was a trap — $3.423 next.
Data: Binance spot + Finnhub, 17:29 UTC; Intents volume: NEAR / NearStats.
Not financial advice. DYOR.
#NEAR #Utility #RelativeStrength
1

·
--
• $HYPE is +5.4% over 24h; $BTC is -3.9%.
• That leaves a +9.3 percentage-point gap over the same window.
Would you compare this against BTC again after the next daily close?
#HYPE #AltcoinFlow #RelativeStrength
• $HYPE is +5.4% over 24h; $BTC is -3.9%.
• That leaves a +9.3 percentage-point gap over the same window.
Would you compare this against BTC again after the next daily close?
#HYPE #AltcoinFlow #RelativeStrength
• That leaves a +9.3 percentage-point gap over the same window.
Would you compare this against BTC again after the next daily close?
#HYPE #AltcoinFlow #RelativeStrength
181

Leadership is most credible when price action attracts real participation.
Stocks — Top Performance & Trend:
$AMD | $AVGO | $TSLA | GOOGL | XOM | CVX | MU | ARM | AMZN | MSFT
WPO Read:
AMD leads the liquid universe at +5.86% in the latest monitored session and +32.3% across the five-session sample. 5 of the top 5 names are positive, so breadth is broad. Leadership is shared across the top group; volume is 1.3x its recent pace.
Sustained strength matters more than one isolated move.
#wpo_report #Equities #RelativeStrength
Leadership is most credible when price action attracts real participation.
Stocks — Top Performance & Trend:
$AMD | $AVGO | $TSLA | GOOGL | XOM | CVX | MU | ARM | AMZN | MSFT
WPO Read:
AMD leads the liquid universe at +5.86% in the latest monitored session and +32.3% across the five-session sample. 5 of the top 5 names are positive, so breadth is broad. Leadership is shared across the top group; volume is 1.3x its recent pace.
Sustained strength matters more than one isolated move.
#wpo_report #Equities #RelativeStrength
Stocks — Top Performance & Trend:
$AMD | $AVGO | $TSLA | GOOGL | XOM | CVX | MU | ARM | AMZN | MSFT
WPO Read:
AMD leads the liquid universe at +5.86% in the latest monitored session and +32.3% across the five-session sample. 5 of the top 5 names are positive, so breadth is broad. Leadership is shared across the top group; volume is 1.3x its recent pace.
Sustained strength matters more than one isolated move.
#wpo_report #Equities #RelativeStrength
302

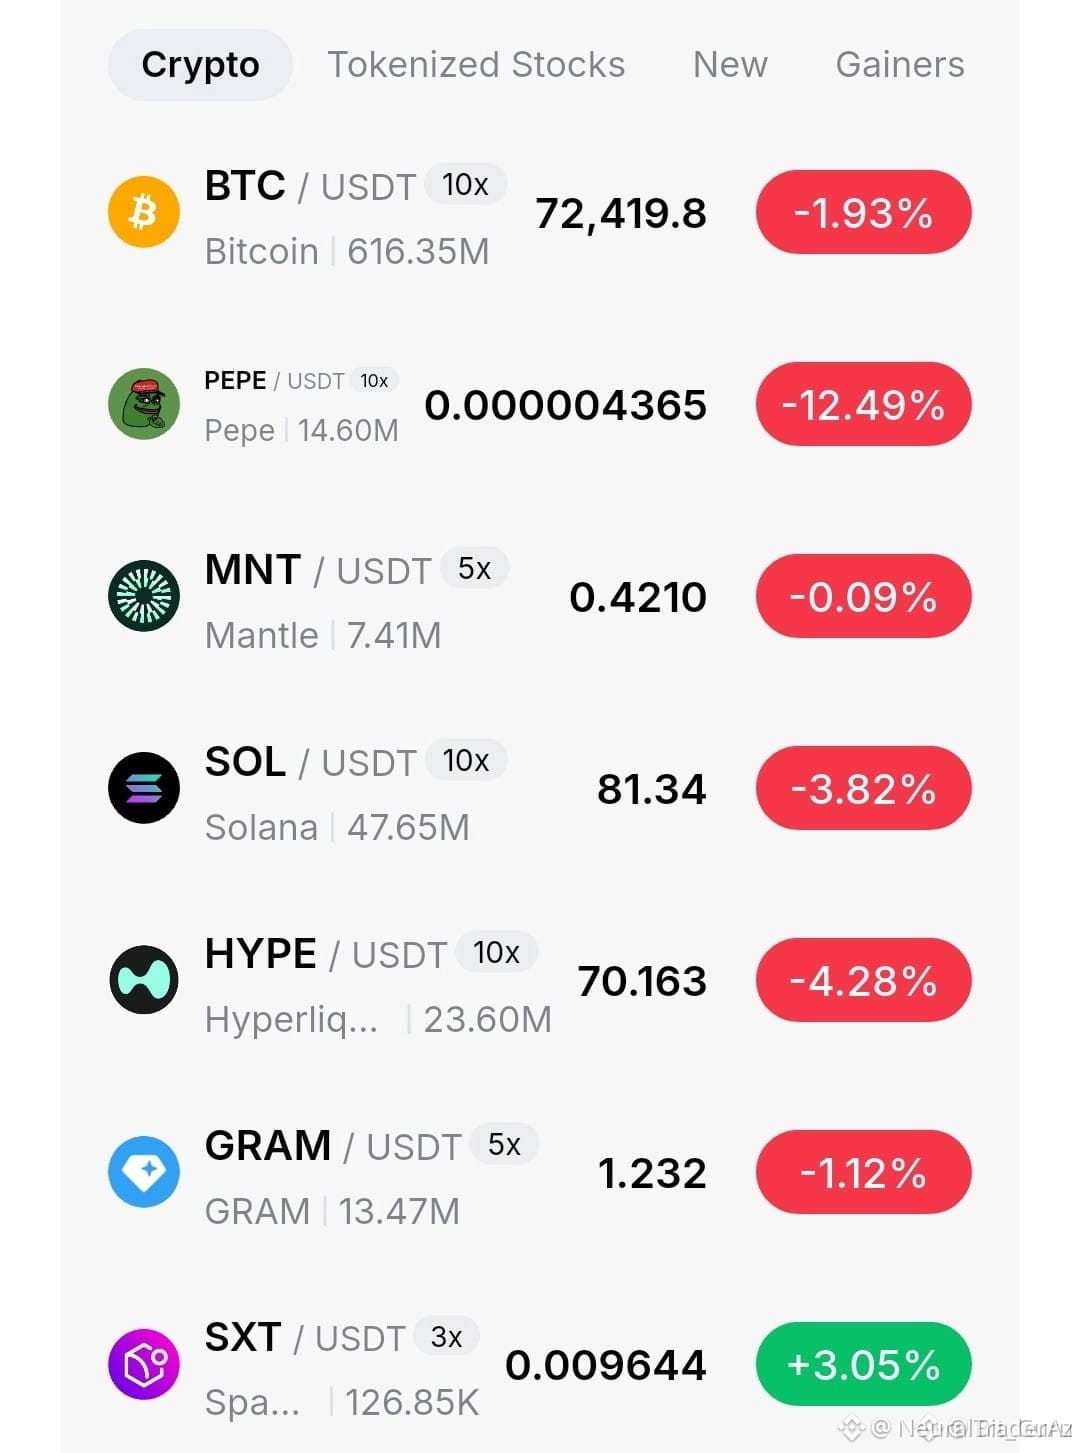
🚨 $SXT DEFYING BROADER MARKET BLEED WITH UNUSUAL RELATIVE STRENGTH! ⚡
While broader capitalization indexes face aggressive liquidation and top-tier assets bleed, smart money is rotating selectively into localized outliers. $SXT is exhibiting textbook relative strength, absorbing distribution while major assets like $BTC pull back into key macro support. 📊
Institutional footprint analysis reveals that capital preservation precedes aggressive markup phases. Waiting for volume confirmation before deployment ensures we ride institutional order flow rather than chasing fleeting volatility traps. 💡
💬 Are you scaling into these relative strength plays now, or waiting for deeper macro confirmation across the board? 👇
⚠️ Not financial advice. Always manage your risk. 🛡️
🏷️ #SXT #RelativeStrength #Altcoins #MarketStructure
🔥 💎
🚨 $SXT DEFYING BROADER MARKET BLEED WITH UNUSUAL RELATIVE STRENGTH! ⚡
While broader capitalization indexes face aggressive liquidation and top-tier assets bleed, smart money is rotating selectively into localized outliers. $SXT is exhibiting textbook relative strength, absorbing distribution while major assets like $BTC pull back into key macro support. 📊
Institutional footprint analysis reveals that capital preservation precedes aggressive markup phases. Waiting for volume confirmation before deployment ensures we ride institutional order flow rather than chasing fleeting volatility traps. 💡
💬 Are you scaling into these relative strength plays now, or waiting for deeper macro confirmation across the board? 👇
⚠️ Not financial advice. Always manage your risk. 🛡️
🏷️ #SXT #RelativeStrength #Altcoins #MarketStructure
🔥 💎
While broader capitalization indexes face aggressive liquidation and top-tier assets bleed, smart money is rotating selectively into localized outliers. $SXT is exhibiting textbook relative strength, absorbing distribution while major assets like $BTC pull back into key macro support. 📊
Institutional footprint analysis reveals that capital preservation precedes aggressive markup phases. Waiting for volume confirmation before deployment ensures we ride institutional order flow rather than chasing fleeting volatility traps. 💡
💬 Are you scaling into these relative strength plays now, or waiting for deeper macro confirmation across the board? 👇
⚠️ Not financial advice. Always manage your risk. 🛡️
🏷️ #SXT #RelativeStrength #Altcoins #MarketStructure
🔥 💎
23
·
--
Before calling it a trend: That leaves a -0.3 percentage-point gap over the same window.
$ETH is -1.7% over 24h; $BTC is -1.4%.
Has this relative gap held for more than one session?
#ETH #LargeCaps #RelativeStrength
Before calling it a trend: That leaves a -0.3 percentage-point gap over the same window.
$ETH is -1.7% over 24h; $BTC is -1.4%.
Has this relative gap held for more than one session?
#ETH #LargeCaps #RelativeStrength
$ETH is -1.7% over 24h; $BTC is -1.4%.
Has this relative gap held for more than one session?
#ETH #LargeCaps #RelativeStrength
68

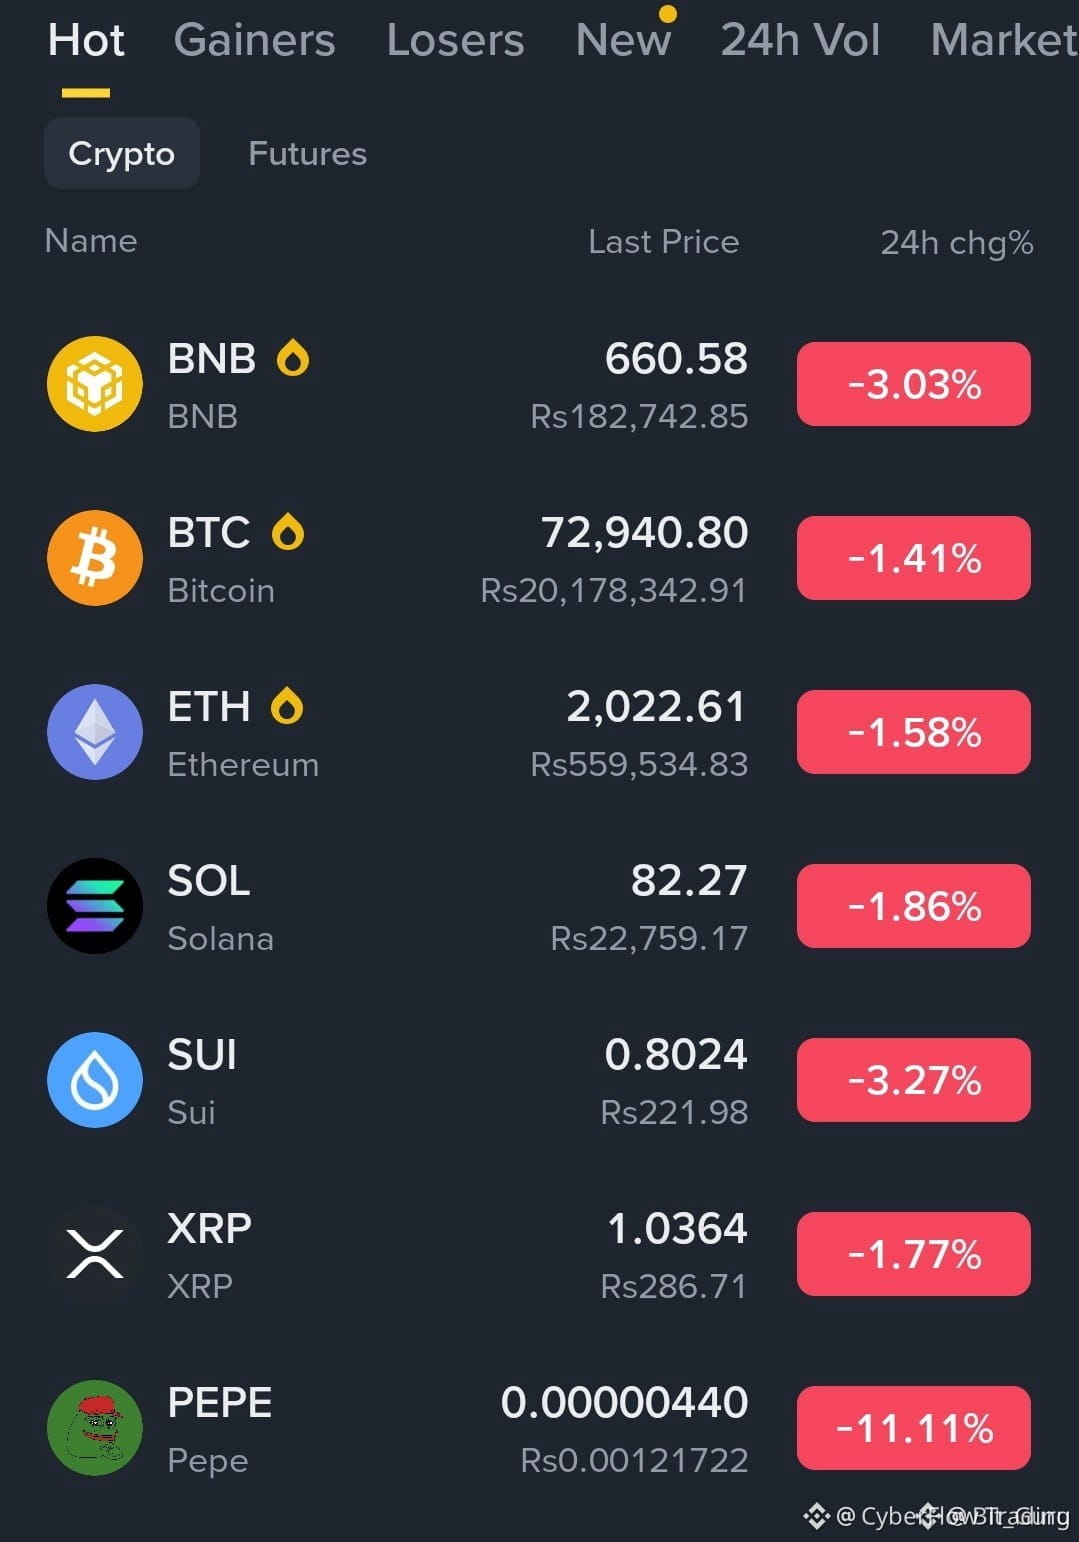
🚨 $BTC DEFENDING KEY SUPPORT WHILE THE REST OF THE MARKET BLEEDS 📉
Entry: 72,940 ⚡
When the broader board turns red, capital doesn't just vanish—it rotates into apex assets showing true relative strength. 📊 Bitcoin is absorbing selling pressure remarkably well at these elevated levels while altcoins face sharp liquidations across the board. ⚡
Emotional panic always creates mispriced entries for disciplined operators waiting for confirmation. 💡 Are you accumulating strength here or sitting on cash until the trend fully stabilizes? 👇
⚠️ Not financial advice. Always manage your risk. 🛡️
🏷️ #BTC #RelativeStrength #Crypto #MarketUpdate
🔥 💎
🚨 $BTC DEFENDING KEY SUPPORT WHILE THE REST OF THE MARKET BLEEDS 📉
Entry: 72,940 ⚡
When the broader board turns red, capital doesn't just vanish—it rotates into apex assets showing true relative strength. 📊 Bitcoin is absorbing selling pressure remarkably well at these elevated levels while altcoins face sharp liquidations across the board. ⚡
Emotional panic always creates mispriced entries for disciplined operators waiting for confirmation. 💡 Are you accumulating strength here or sitting on cash until the trend fully stabilizes? 👇
⚠️ Not financial advice. Always manage your risk. 🛡️
🏷️ #BTC #RelativeStrength #Crypto #MarketUpdate
🔥 💎
Entry: 72,940 ⚡
When the broader board turns red, capital doesn't just vanish—it rotates into apex assets showing true relative strength. 📊 Bitcoin is absorbing selling pressure remarkably well at these elevated levels while altcoins face sharp liquidations across the board. ⚡
Emotional panic always creates mispriced entries for disciplined operators waiting for confirmation. 💡 Are you accumulating strength here or sitting on cash until the trend fully stabilizes? 👇
⚠️ Not financial advice. Always manage your risk. 🛡️
🏷️ #BTC #RelativeStrength #Crypto #MarketUpdate
🔥 💎
34
·
--
The chart says $GRAM is +14.7% over 24h; $BTC is -0.3%.
The data footnote is That leaves a +15.0 percentage-point gap over the same window.
Has this relative gap held for more than one session?
#GRAM #AltcoinFlow #RelativeStrength
The chart says $GRAM is +14.7% over 24h; $BTC is -0.3%.
The data footnote is That leaves a +15.0 percentage-point gap over the same window.
Has this relative gap held for more than one session?
#GRAM #AltcoinFlow #RelativeStrength
The data footnote is That leaves a +15.0 percentage-point gap over the same window.
Has this relative gap held for more than one session?
#GRAM #AltcoinFlow #RelativeStrength
124
PAIR COMPARISON | $BTC
OBSERVATION — $BTC is -2.4% over 24h; $ETH is -4.9%.
CONTEXT — That leaves a +2.5 percentage-point gap over the same window.
NEXT CHECK — Relative strength describes this window; it does not predict the next one.
#BTC #LargeCaps #RelativeStrength
PAIR COMPARISON | $BTC
OBSERVATION — $BTC is -2.4% over 24h; $ETH is -4.9%.
CONTEXT — That leaves a +2.5 percentage-point gap over the same window.
NEXT CHECK — Relative strength describes this window; it does not predict the next one.
#BTC #LargeCaps #RelativeStrength
OBSERVATION — $BTC is -2.4% over 24h; $ETH is -4.9%.
CONTEXT — That leaves a +2.5 percentage-point gap over the same window.
NEXT CHECK — Relative strength describes this window; it does not predict the next one.
#BTC #LargeCaps #RelativeStrength
85
·
--
$ETH is -2.2% over 24h; $BTC is -1.0%.
Context check: That leaves a -1.3 percentage-point gap over the same window.
Is this coin leading, or simply moving with the broader tape?
#ETH #LargeCaps #RelativeStrength
$ETH is -2.2% over 24h; $BTC is -1.0%.
Context check: That leaves a -1.3 percentage-point gap over the same window.
Is this coin leading, or simply moving with the broader tape?
#ETH #LargeCaps #RelativeStrength
Context check: That leaves a -1.3 percentage-point gap over the same window.
Is this coin leading, or simply moving with the broader tape?
#ETH #LargeCaps #RelativeStrength
63
·
--
• $ETH is -5.3% over 24h; $BTC is -1.7%.
• That leaves a -3.6 percentage-point gap over the same window.
Would you compare this against BTC again after the next daily close?
#ETH #LargeCaps #RelativeStrength
• $ETH is -5.3% over 24h; $BTC is -1.7%.
• That leaves a -3.6 percentage-point gap over the same window.
Would you compare this against BTC again after the next daily close?
#ETH #LargeCaps #RelativeStrength
• That leaves a -3.6 percentage-point gap over the same window.
Would you compare this against BTC again after the next daily close?
#ETH #LargeCaps #RelativeStrength
87
Numbers in focus:
That leaves a -3.9 percentage-point gap over the same window.
$ENA is -4.2% over 24h; $BTC is -0.3%.
Has this relative gap held for more than one session?
#ENA #AltcoinFlow #RelativeStrength
Numbers in focus:
That leaves a -3.9 percentage-point gap over the same window.
$ENA is -4.2% over 24h; $BTC is -0.3%.
Has this relative gap held for more than one session?
#ENA #AltcoinFlow #RelativeStrength
That leaves a -3.9 percentage-point gap over the same window.
$ENA is -4.2% over 24h; $BTC is -0.3%.
Has this relative gap held for more than one session?
#ENA #AltcoinFlow #RelativeStrength
473
·
--
The chart says $XRP is -3.6% over 24h; $BTC is -0.1%.
The data footnote is That leaves a -3.5 percentage-point gap over the same window.
Does the spread matter more to you than the absolute daily move?
#XRP #LargeCaps #RelativeStrength
The chart says $XRP is -3.6% over 24h; $BTC is -0.1%.
The data footnote is That leaves a -3.5 percentage-point gap over the same window.
Does the spread matter more to you than the absolute daily move?
#XRP #LargeCaps #RelativeStrength
The data footnote is That leaves a -3.5 percentage-point gap over the same window.
Does the spread matter more to you than the absolute daily move?
#XRP #LargeCaps #RelativeStrength
134
RELATIVE STRENGTH | $SNXXB
OBSERVATION — $SNXXB is -41.7% over 24h; $BTC is -5.8%.
CONTEXT — That leaves a -35.9 percentage-point gap over the same window.
NEXT CHECK — Relative strength describes this window; it does not predict the next one.
#SNXXB #AltcoinFlow #RelativeStrength
RELATIVE STRENGTH | $SNXXB
OBSERVATION — $SNXXB is -41.7% over 24h; $BTC is -5.8%.
CONTEXT — That leaves a -35.9 percentage-point gap over the same window.
NEXT CHECK — Relative strength describes this window; it does not predict the next one.
#SNXXB #AltcoinFlow #RelativeStrength
OBSERVATION — $SNXXB is -41.7% over 24h; $BTC is -5.8%.
CONTEXT — That leaves a -35.9 percentage-point gap over the same window.
NEXT CHECK — Relative strength describes this window; it does not predict the next one.
#SNXXB #AltcoinFlow #RelativeStrength
396
·
--
$ETH is -7.5% over 24h; $BTC is -5.6%.
Context check: That leaves a -1.9 percentage-point gap over the same window.
Is this coin leading, or simply moving with the broader tape?
#ETH #LargeCaps #RelativeStrength
$ETH is -7.5% over 24h; $BTC is -5.6%.
Context check: That leaves a -1.9 percentage-point gap over the same window.
Is this coin leading, or simply moving with the broader tape?
#ETH #LargeCaps #RelativeStrength
Context check: That leaves a -1.9 percentage-point gap over the same window.
Is this coin leading, or simply moving with the broader tape?
#ETH #LargeCaps #RelativeStrength
69

·
--
Yesterday’s sell-off showed the coins’ relative strength: $ETH lost about 5% and fell below $2,300, $SOL dropped around 4%, while $XRP held near $1.27. For XRP, key levels are $1.22–1.23 (support) and $1.30 (resistance); for SOL, support is $91–92; for ETH, $2,222. If the market recovers, stronger coins usually lead. Not financial advice.
Which of the three will be first to resume rising? 👇
#RelativeStrength
Yesterday’s sell-off showed the coins’ relative strength: $ETH lost about 5% and fell below $2,300, $SOL dropped around 4%, while $XRP held near $1.27. For XRP, key levels are $1.22–1.23 (support) and $1.30 (resistance); for SOL, support is $91–92; for ETH, $2,222. If the market recovers, stronger coins usually lead. Not financial advice.
Which of the three will be first to resume rising? 👇
#RelativeStrength
Which of the three will be first to resume rising? 👇
#RelativeStrength
1
135
$HOT is -15.8% over 24h; $BTC is +3.7%.
Context: That leaves a -19.4 percentage-point gap over the same window.
Would you compare this against BTC again after the next daily close?
#HOT #AltcoinFlow #RelativeStrength
$HOT is -15.8% over 24h; $BTC is +3.7%.
Context: That leaves a -19.4 percentage-point gap over the same window.
Would you compare this against BTC again after the next daily close?
#HOT #AltcoinFlow #RelativeStrength
Context: That leaves a -19.4 percentage-point gap over the same window.
Would you compare this against BTC again after the next daily close?
#HOT #AltcoinFlow #RelativeStrength
533
Log in to explore more content
Join global crypto users on Binance Square
⚡️ Get latest and useful information about crypto.
💬 Trusted by the world’s largest crypto exchange.
👍 Discover real insights from verified creators.
Email / Phone number
Trending Topics
1
#WhoWillSucceedJensenHuangatNvidia?
184,993 views
1,694 Discussing
2
#WhatWillDriveCryptoandStocks’NextRebound?
597,533 views
3,543 Discussing
3
#TradFiForBeginners
741,576 views
4,513 Discussing
4
#BitcoinActiveSupplyInProfitDropsBelow45%
82,831 views
752 Discussing
5
#KavaSaysAbnormalActivityLimitedToKavaLend
47,443 views
420 Discussing
6
#USSpotXRPETFsSeeLargestWeeklyOutflowIn8Months
35,261 views
361 Discussing
7
#USPPIMissMayEaseBTCPressure
315,072 views
2,293 Discussing
8
#WORPTLetsTouristsConvertCryptoToThaiBaht
11,126 views
104 Discussing
9
#TONStrategyReports$23.97MQ3NetLoss
10,972 views
44 Discussing
10
#PolkadotCommunityApprovesNewStrategyWith97%Vote
30,613 views
297 Discussing