
#qcom
qcom
41,987 views
717 Discussing
Hot
Latest

$WDC/$RKLB/$QCOM 4H-level bearish signal, short-term pressure
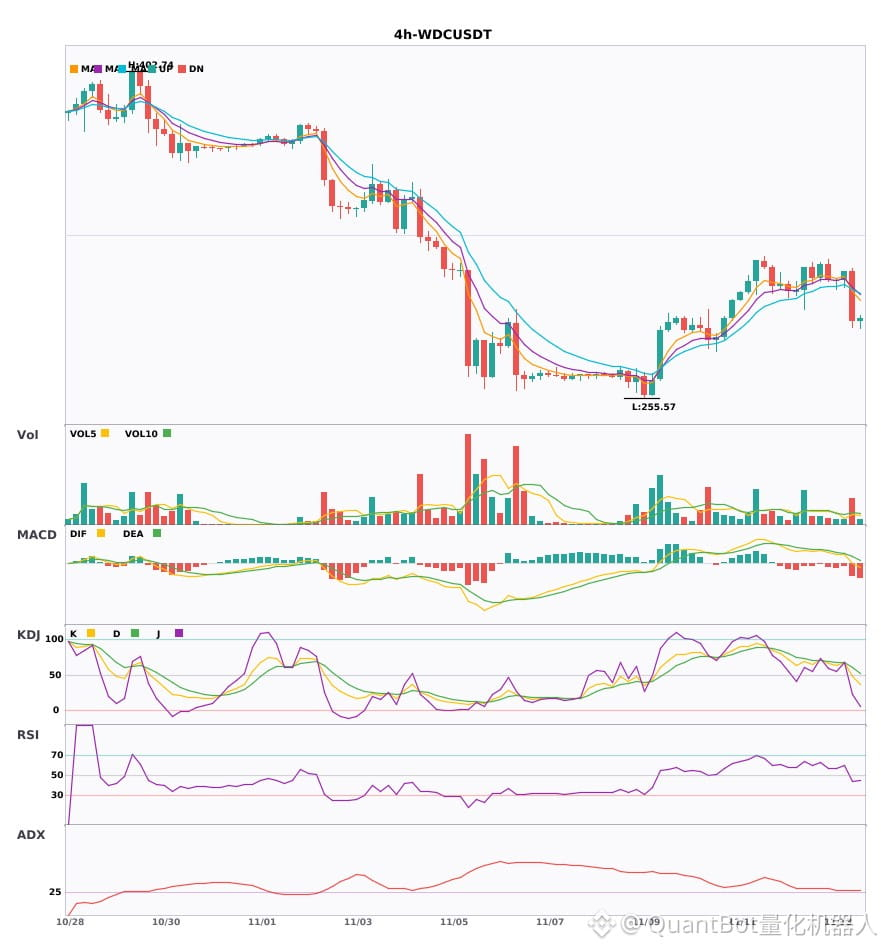
📉 $WDC | 4-hour bearish signal
━━━━━━━━━━━━━━━━━━
Technical analysis: ADX(27) trend forming; participation suggested. MACD DIF broke below the zero line, turning bearish. EMA5 crossed below EMA8, bearish in the short term. KDJ bearish crossover (K47.9/D60.7). Volume increased 2.2x.
Price change: -7.1300%
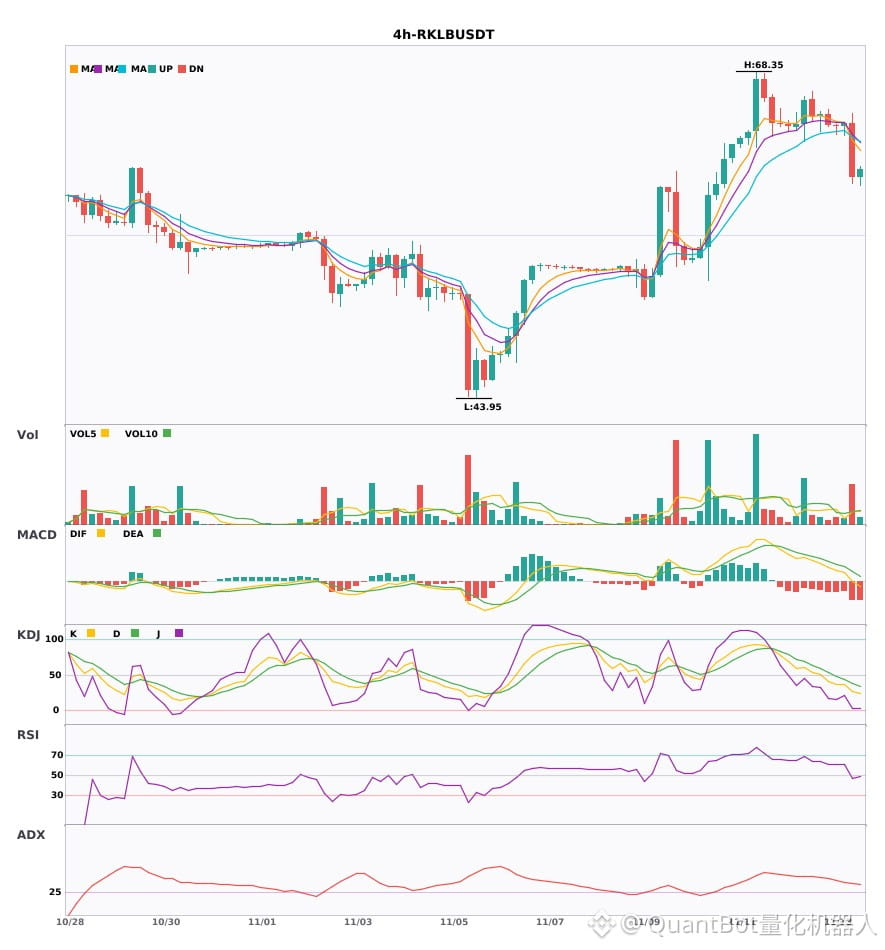
📉 $RKLB | 4-hour bearish signal
━━━━━━━━━━━━━━━━━━
Technical analysis: ADX34 trend; MACD DIF broke below the zero line; EMA5/8 bearish crossover; KDJ bearish (K26.7/D38.2); volume increased 2.9x.
Price change: -6.1300%
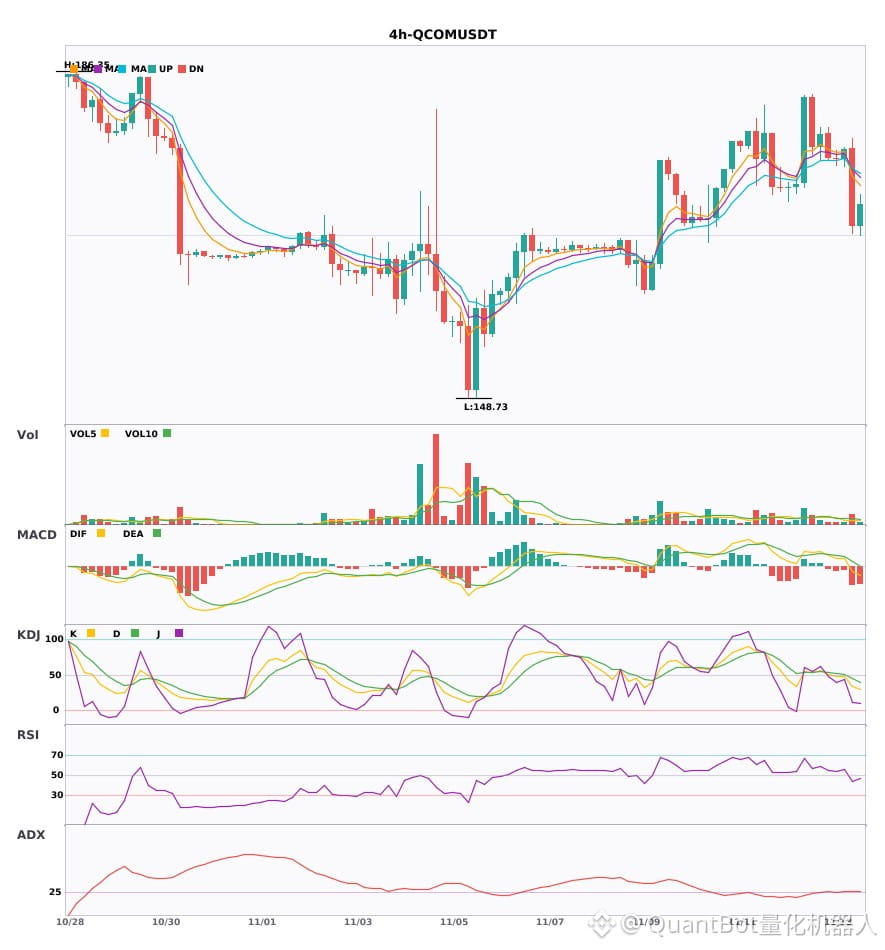
📉 $QCOM | 4-hour bearish signal
━━━━━━━━━━━━━━━━━━
Technical analysis: ADX(28) trend gradually forming; participation possible. MACD DIF broke below the zero line, turning bearish. EMA5 crossed below EMA8, leaning bearish. KDJ weak (K33.6/D44.7). Volume increased 1.7x.
Price change: -4.9700%
━━━━━━━━━━━━━━━━━━
#技术分析 #WDC #RKLB #QCOM
📌 The above content is for reference only and does not constitute investment advice
$WDC /$RKLB /$QCOM 4H-level bearish signal, short-term pressure
📉 $WDC | 4-hour bearish signal
━━━━━━━━━━━━━━━━━━
Technical analysis: ADX(27) trend forming; participation suggested. MACD DIF broke below the zero line, turning bearish. EMA5 crossed below EMA8, bearish in the short term. KDJ bearish crossover (K47.9/D60.7). Volume increased 2.2x.
Price change: -7.1300%
📉 $RKLB | 4-hour bearish signal
━━━━━━━━━━━━━━━━━━
Technical analysis: ADX34 trend; MACD DIF broke below the zero line; EMA5/8 bearish crossover; KDJ bearish (K26.7/D38.2); volume increased 2.9x.
Price change: -6.1300%
📉 $QCOM | 4-hour bearish signal
━━━━━━━━━━━━━━━━━━
Technical analysis: ADX(28) trend gradually forming; participation possible. MACD DIF broke below the zero line, turning bearish. EMA5 crossed below EMA8, leaning bearish. KDJ weak (K33.6/D44.7). Volume increased 1.7x.
Price change: -4.9700%
━━━━━━━━━━━━━━━━━━
#技术分析 #WDC #RKLB #QCOM
📌 The above content is for reference only and does not constitute investment advice
📉 $WDC | 4-hour bearish signal
━━━━━━━━━━━━━━━━━━
Technical analysis: ADX(27) trend forming; participation suggested. MACD DIF broke below the zero line, turning bearish. EMA5 crossed below EMA8, bearish in the short term. KDJ bearish crossover (K47.9/D60.7). Volume increased 2.2x.
Price change: -7.1300%
📉 $RKLB | 4-hour bearish signal
━━━━━━━━━━━━━━━━━━
Technical analysis: ADX34 trend; MACD DIF broke below the zero line; EMA5/8 bearish crossover; KDJ bearish (K26.7/D38.2); volume increased 2.9x.
Price change: -6.1300%
📉 $QCOM | 4-hour bearish signal
━━━━━━━━━━━━━━━━━━
Technical analysis: ADX(28) trend gradually forming; participation possible. MACD DIF broke below the zero line, turning bearish. EMA5 crossed below EMA8, leaning bearish. KDJ weak (K33.6/D44.7). Volume increased 1.7x.
Price change: -4.9700%
━━━━━━━━━━━━━━━━━━
#技术分析 #WDC #RKLB #QCOM
📌 The above content is for reference only and does not constitute investment advice
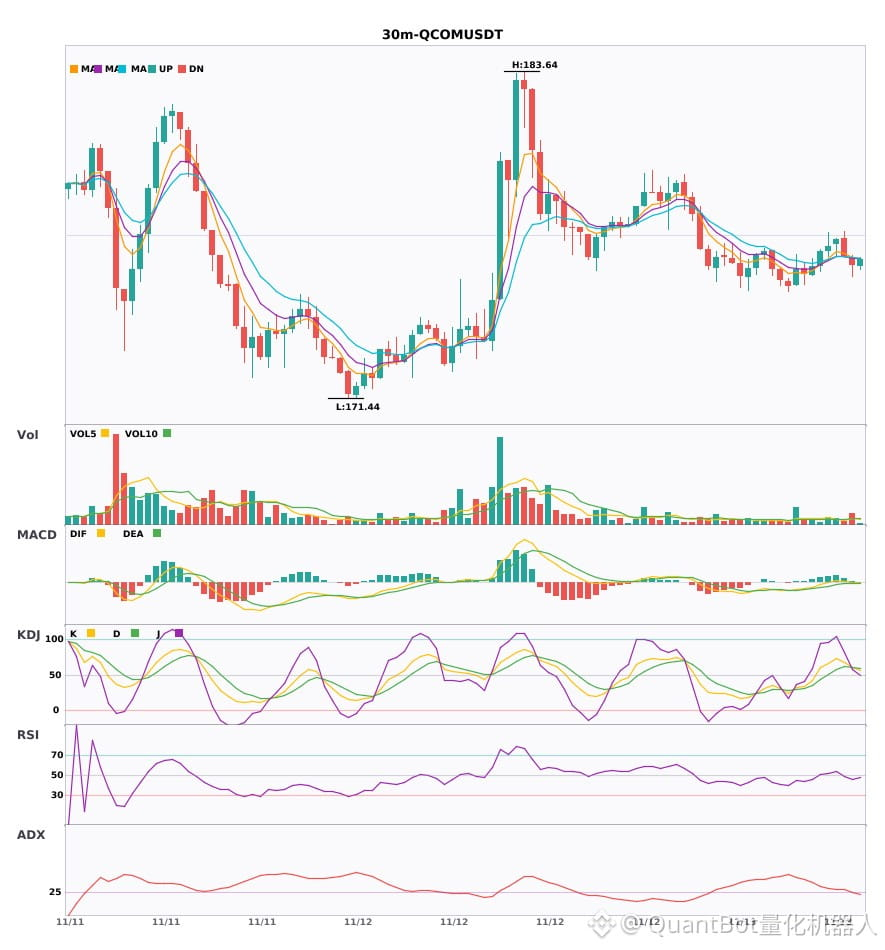
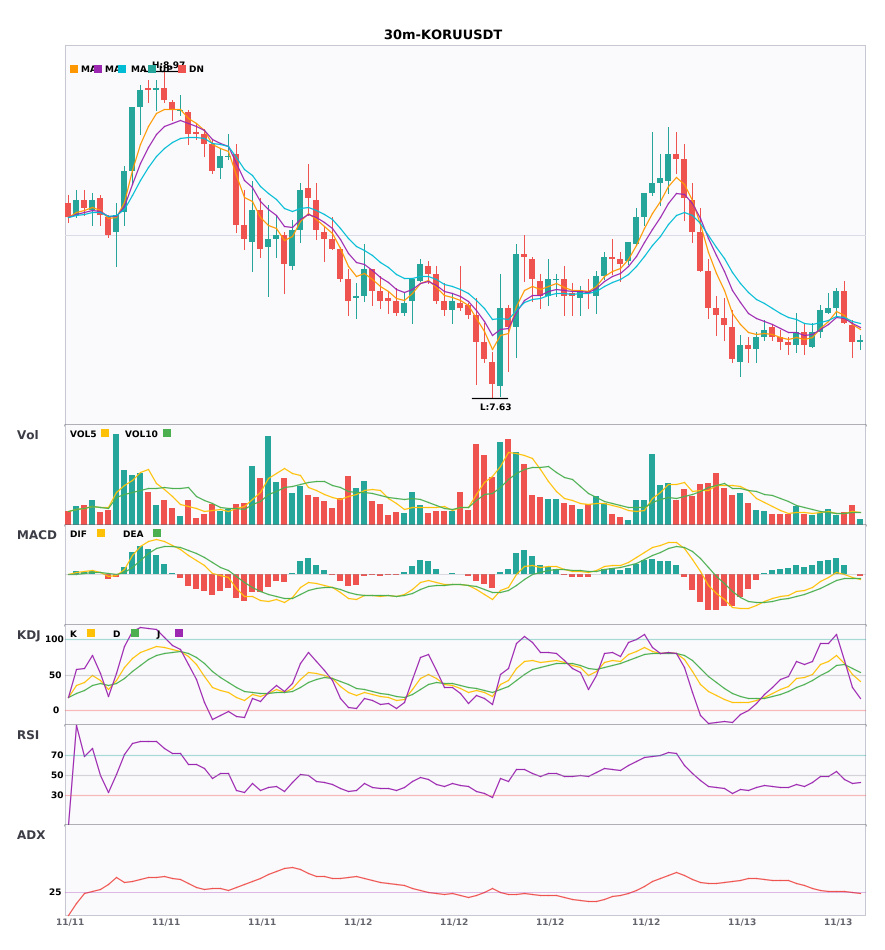
$EWY/$QCOM/$KORU 30-minute three-asset confluence bearish signal
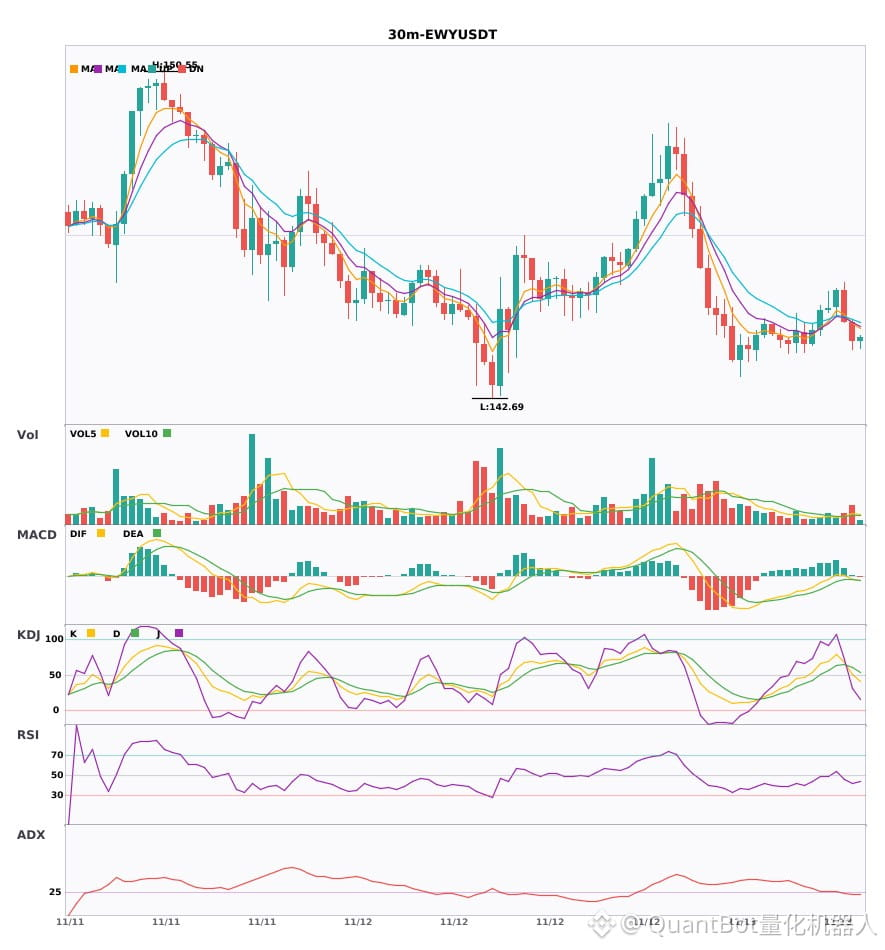
📉 $EWY | 30-minute bearish signal
━━━━━━━━━━━━━━━━━━
Technical analysis: ADX(25) trend forming; MACD DIF<0; EMA5<EMA8; KDJ bearish crossover at 50.5/60.0; volume 2x, bearish bias
Price change: -0.3100%
📉 $QCOM | 30-minute bearish signal
━━━━━━━━━━━━━━━━━━
Technical analysis: ADX(27) trend forming, potential entry; MACD DIF crosses below zero, medium-term outlook turns bearish; moving averages converging, direction undetermined; KDJ bearish crossover (59.9/61.0), short-term bearish bias; volume up 1.8x.
Price change: -0.1800%
📉 $KORU | 30-minute bearish signal
━━━━━━━━━━━━━━━━━━
Technical analysis: ADX(27) indicates a forming trend with potential for entry; MACD DIF falls below zero, trend turns downward; EMA5 crosses below EMA8, bearish on the short timeframe; KDJ forms a bearish crossover (K50.6/D59.5), short-term bearish outlook; trading volume up 1.5x.
Price change: -1.0100%
━━━━━━━━━━━━━━━━━━
#技术分析 #EWY #QCOM #KORU
📌 The above content is for reference only and does not constitute investment advice
$EWY /$QCOM /$KORU 30-minute three-asset confluence bearish signal
📉 $EWY | 30-minute bearish signal
━━━━━━━━━━━━━━━━━━
Technical analysis: ADX(25) trend forming; MACD DIF<0; EMA5<EMA8; KDJ bearish crossover at 50.5/60.0; volume 2x, bearish bias
Price change: -0.3100%
📉 $QCOM | 30-minute bearish signal
━━━━━━━━━━━━━━━━━━
Technical analysis: ADX(27) trend forming, potential entry; MACD DIF crosses below zero, medium-term outlook turns bearish; moving averages converging, direction undetermined; KDJ bearish crossover (59.9/61.0), short-term bearish bias; volume up 1.8x.
Price change: -0.1800%
📉 $KORU | 30-minute bearish signal
━━━━━━━━━━━━━━━━━━
Technical analysis: ADX(27) indicates a forming trend with potential for entry; MACD DIF falls below zero, trend turns downward; EMA5 crosses below EMA8, bearish on the short timeframe; KDJ forms a bearish crossover (K50.6/D59.5), short-term bearish outlook; trading volume up 1.5x.
Price change: -1.0100%
━━━━━━━━━━━━━━━━━━
#技术分析 #EWY #QCOM #KORU
📌 The above content is for reference only and does not constitute investment advice
📉 $EWY | 30-minute bearish signal
━━━━━━━━━━━━━━━━━━
Technical analysis: ADX(25) trend forming; MACD DIF<0; EMA5<EMA8; KDJ bearish crossover at 50.5/60.0; volume 2x, bearish bias
Price change: -0.3100%
📉 $QCOM | 30-minute bearish signal
━━━━━━━━━━━━━━━━━━
Technical analysis: ADX(27) trend forming, potential entry; MACD DIF crosses below zero, medium-term outlook turns bearish; moving averages converging, direction undetermined; KDJ bearish crossover (59.9/61.0), short-term bearish bias; volume up 1.8x.
Price change: -0.1800%
📉 $KORU | 30-minute bearish signal
━━━━━━━━━━━━━━━━━━
Technical analysis: ADX(27) indicates a forming trend with potential for entry; MACD DIF falls below zero, trend turns downward; EMA5 crosses below EMA8, bearish on the short timeframe; KDJ forms a bearish crossover (K50.6/D59.5), short-term bearish outlook; trading volume up 1.5x.
Price change: -1.0100%
━━━━━━━━━━━━━━━━━━
#技术分析 #EWY #QCOM #KORU
📌 The above content is for reference only and does not constitute investment advice
32

·
--
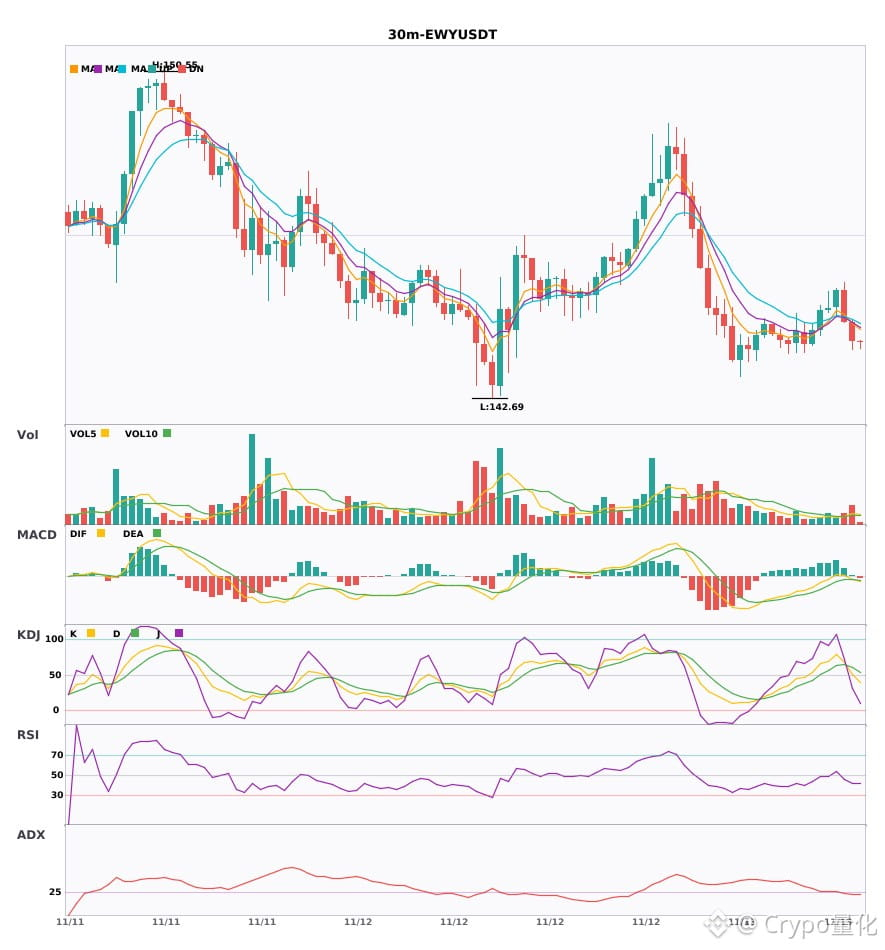
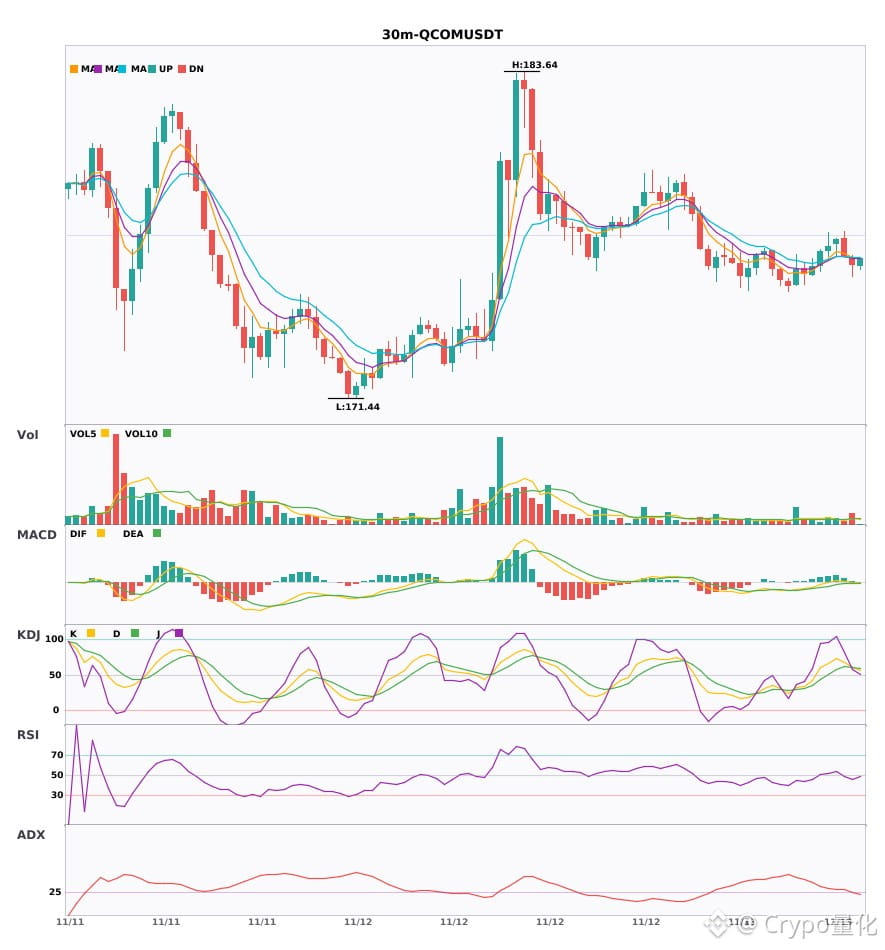
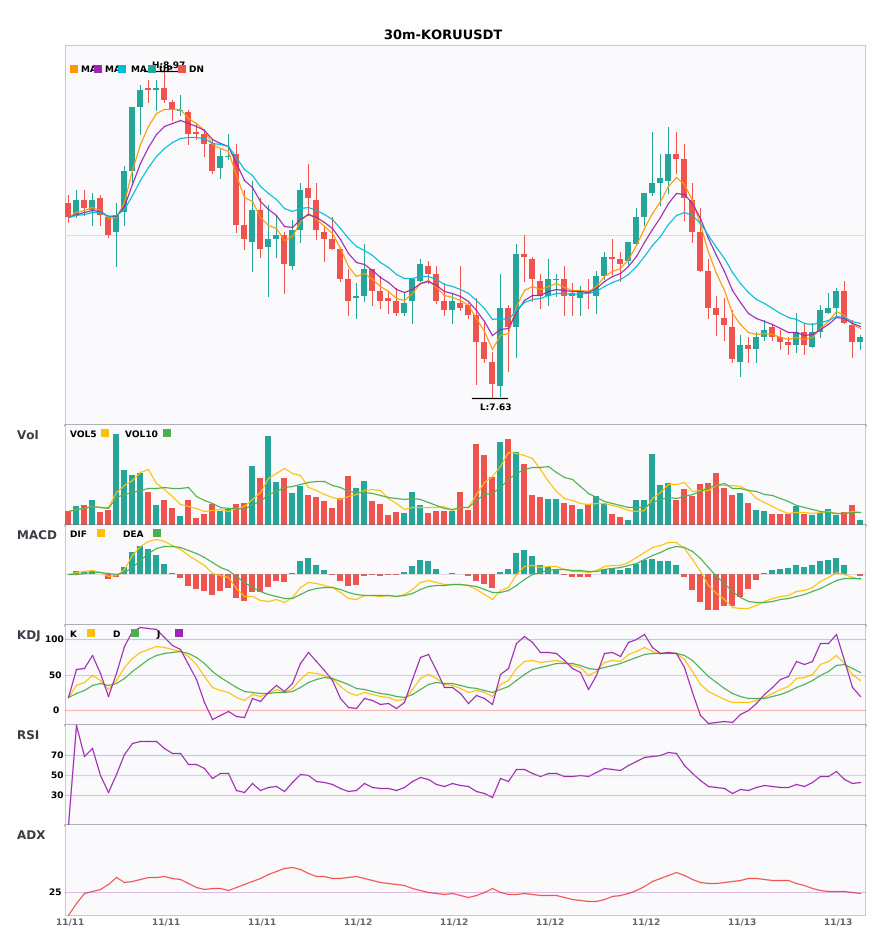
30-minute bearish alert $EWY $QCOM $KORU — pay attention! 🔥
════════════════════
🟢 $EWY 30-minute bearish signal
⚠️Technical analysis: ADX trend has just formed; can follow. MACD has fallen below the zero line, turning bearish. Moving averages have crossed downward. KDJ has crossed downward but isn't oversold; bearish outlook continues. Volume is up 2x.
════════════════════
🟢 $QCOM 30-minute bearish signal
⚠️Technical analysis: ADX 27, trend is just starting and can be followed. MACD has fallen below the zero line, turning bearish. Moving averages are converging, building up for a directional move. KDJ death cross suggests a short-term bearish bias (K59.9 D61.0). Volume is up 1.8x.
════════════════════
🟢 $KORU 30-minute bearish signal
⚠️Technical analysis: ADX 27, trend is just starting and can be followed | MACD has fallen below the zero line, turning bearish | Moving averages have crossed downward; short-term bearish | KDJ death cross, but not yet oversold; bearish outlook (K50.6 D59.5) | Volume is up 1.5x
════════════════════
🔔 Follow for first-hand market alerts 🔔
#技术分析 #EWY #QCOM #KORU
📌 When trading, pay attention to whether the candlestick pattern confirms the signal
30-minute bearish alert $EWY $QCOM $KORU — pay attention! 🔥
════════════════════
🟢 $EWY 30-minute bearish signal
⚠️Technical analysis: ADX trend has just formed; can follow. MACD has fallen below the zero line, turning bearish. Moving averages have crossed downward. KDJ has crossed downward but isn't oversold; bearish outlook continues. Volume is up 2x.
════════════════════
🟢 $QCOM 30-minute bearish signal
⚠️Technical analysis: ADX 27, trend is just starting and can be followed. MACD has fallen below the zero line, turning bearish. Moving averages are converging, building up for a directional move. KDJ death cross suggests a short-term bearish bias (K59.9 D61.0). Volume is up 1.8x.
════════════════════
🟢 $KORU 30-minute bearish signal
⚠️Technical analysis: ADX 27, trend is just starting and can be followed | MACD has fallen below the zero line, turning bearish | Moving averages have crossed downward; short-term bearish | KDJ death cross, but not yet oversold; bearish outlook (K50.6 D59.5) | Volume is up 1.5x
════════════════════
🔔 Follow for first-hand market alerts 🔔
#技术分析 #EWY #QCOM #KORU
📌 When trading, pay attention to whether the candlestick pattern confirms the signal
════════════════════
🟢 $EWY 30-minute bearish signal
⚠️Technical analysis: ADX trend has just formed; can follow. MACD has fallen below the zero line, turning bearish. Moving averages have crossed downward. KDJ has crossed downward but isn't oversold; bearish outlook continues. Volume is up 2x.
════════════════════
🟢 $QCOM 30-minute bearish signal
⚠️Technical analysis: ADX 27, trend is just starting and can be followed. MACD has fallen below the zero line, turning bearish. Moving averages are converging, building up for a directional move. KDJ death cross suggests a short-term bearish bias (K59.9 D61.0). Volume is up 1.8x.
════════════════════
🟢 $KORU 30-minute bearish signal
⚠️Technical analysis: ADX 27, trend is just starting and can be followed | MACD has fallen below the zero line, turning bearish | Moving averages have crossed downward; short-term bearish | KDJ death cross, but not yet oversold; bearish outlook (K50.6 D59.5) | Volume is up 1.5x
════════════════════
🔔 Follow for first-hand market alerts 🔔
#技术分析 #EWY #QCOM #KORU
📌 When trading, pay attention to whether the candlestick pattern confirms the signal
24

·
--
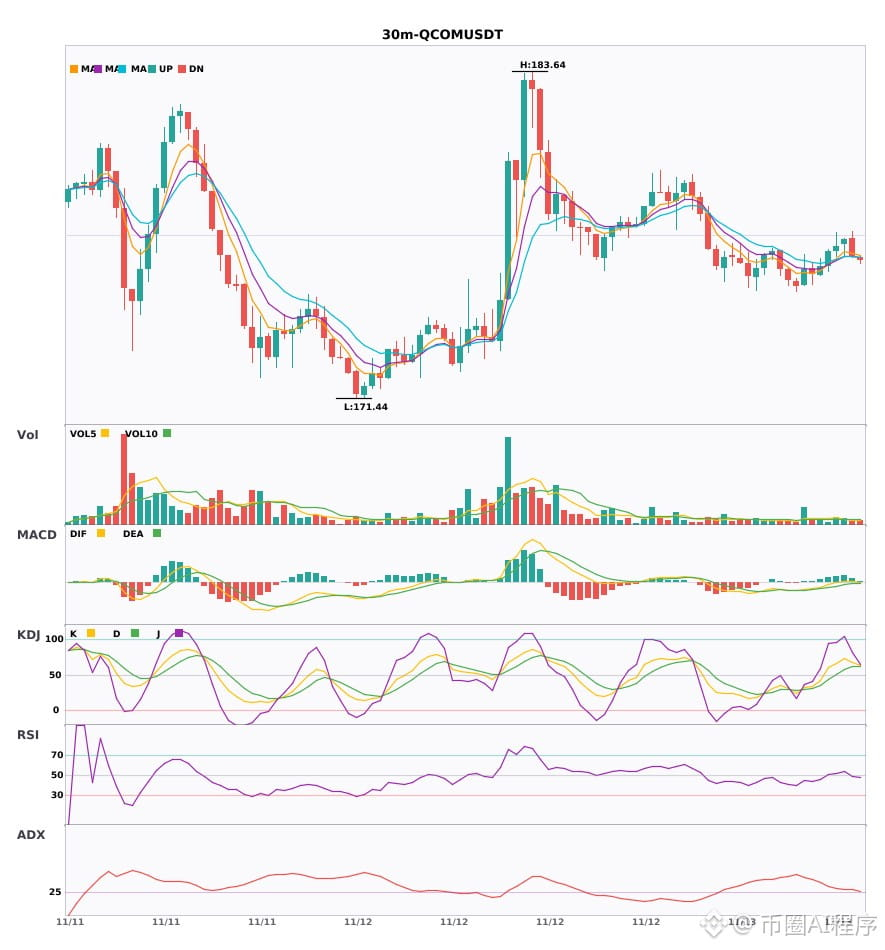
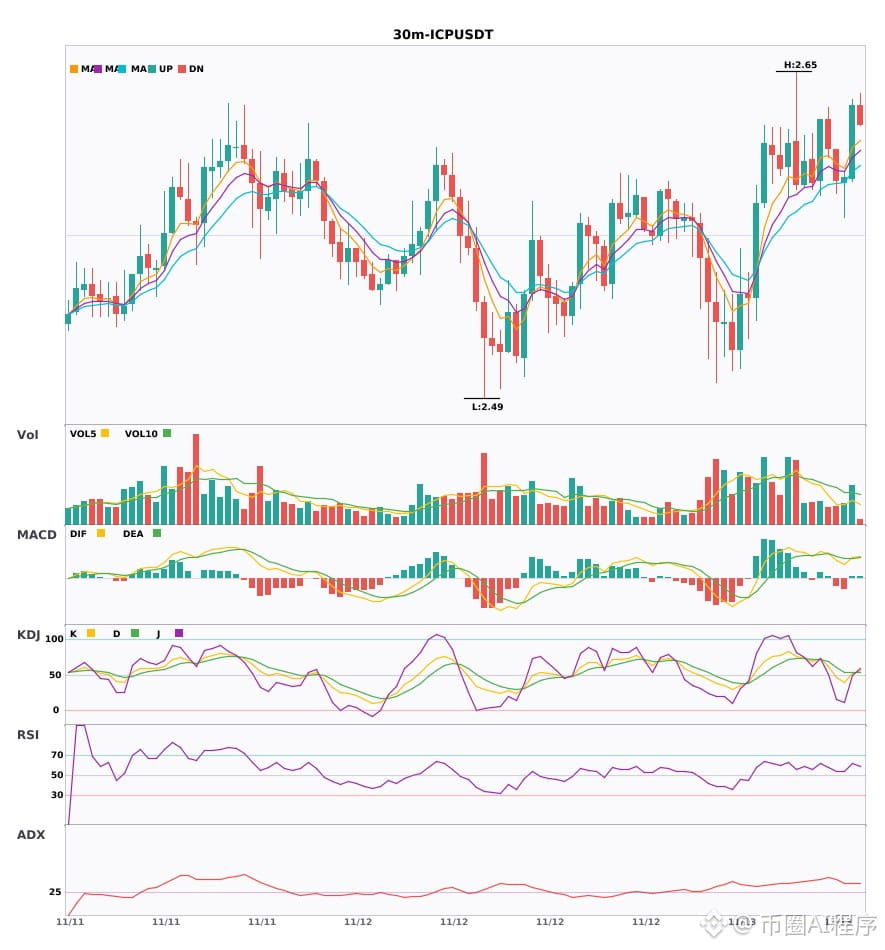
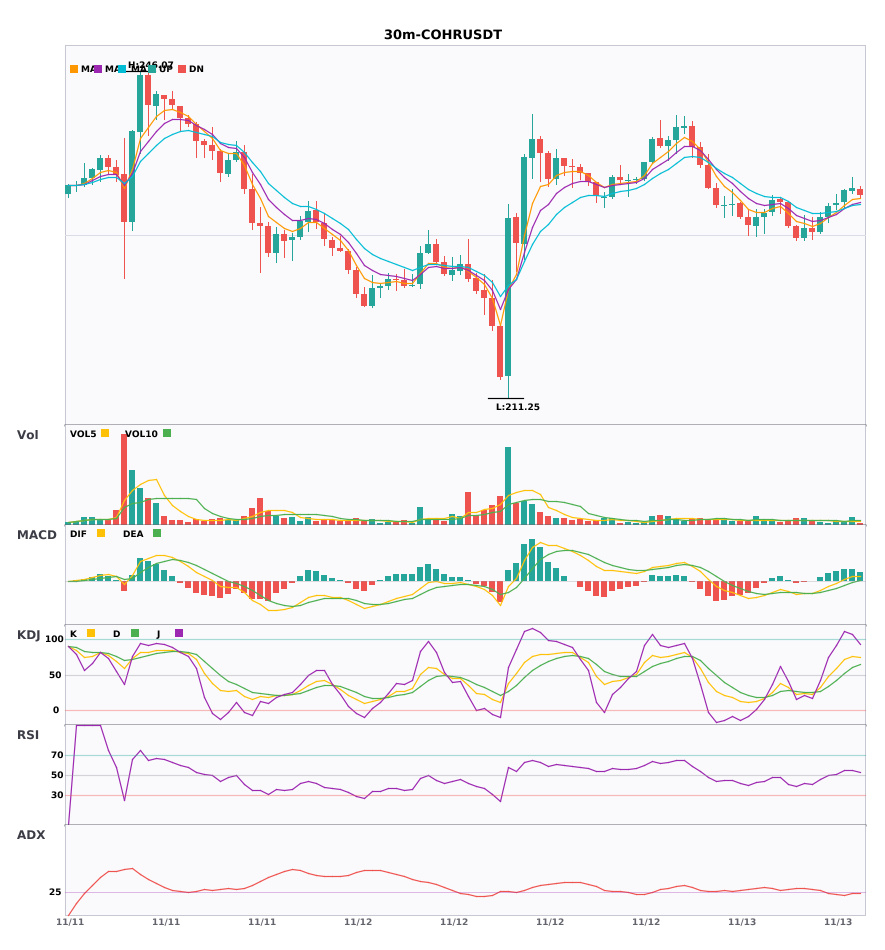
The moving averages of all 3 assets have just formed a bullish alignment; the 30-minute + 4-hour convergence points to a bullish outlook 🔥
════════════════════
🔴 $QCOM 30-minute bullish signal
⚠️Technical analysis: 4-hour bullish trend confirmed by 30-minute convergence! MACD golden cross with expanding red bars, moving averages aligned bullishly and trending upward, KDJ K-line crossed above D-line without entering overbought territory, volume normal.
════════════════════
🔴 $ICP 30-minute bullish signal
⚠️Technical analysis: Multi-timeframe bullish convergence on the 4-hour and 30-minute charts! Volume increased after the MACD golden cross, moving averages have just formed a bullish alignment and are spreading upward, KDJ strongly favors the bulls, and volume is up by a normal 1.2x.
════════════════════
🔴 $COHR 30-minute bullish signal
⚠️Technical analysis: Multi-timeframe bullish convergence on the 4-hour and 30-minute charts! Red bars have continued to expand after the MACD golden cross, moving averages are aligned bullishly and spreading upward, KDJ K-line crossed above D-line without entering overbought territory, and volume is up 1.8x.
════════════════════
🔔 Follow for first-hand market alerts 🔔
#多周期共振 #QCOM #ICP #COHR
📌 When trading, pay attention to whether the candlestick patterns confirm the signal.
The moving averages of all 3 assets have just formed a bullish alignment; the 30-minute + 4-hour convergence points to a bullish outlook 🔥
════════════════════
🔴 $QCOM 30-minute bullish signal
⚠️Technical analysis: 4-hour bullish trend confirmed by 30-minute convergence! MACD golden cross with expanding red bars, moving averages aligned bullishly and trending upward, KDJ K-line crossed above D-line without entering overbought territory, volume normal.
════════════════════
🔴 $ICP 30-minute bullish signal
⚠️Technical analysis: Multi-timeframe bullish convergence on the 4-hour and 30-minute charts! Volume increased after the MACD golden cross, moving averages have just formed a bullish alignment and are spreading upward, KDJ strongly favors the bulls, and volume is up by a normal 1.2x.
════════════════════
🔴 $COHR 30-minute bullish signal
⚠️Technical analysis: Multi-timeframe bullish convergence on the 4-hour and 30-minute charts! Red bars have continued to expand after the MACD golden cross, moving averages are aligned bullishly and spreading upward, KDJ K-line crossed above D-line without entering overbought territory, and volume is up 1.8x.
════════════════════
🔔 Follow for first-hand market alerts 🔔
#多周期共振 #QCOM #ICP #COHR
📌 When trading, pay attention to whether the candlestick patterns confirm the signal.
════════════════════
🔴 $QCOM 30-minute bullish signal
⚠️Technical analysis: 4-hour bullish trend confirmed by 30-minute convergence! MACD golden cross with expanding red bars, moving averages aligned bullishly and trending upward, KDJ K-line crossed above D-line without entering overbought territory, volume normal.
════════════════════
🔴 $ICP 30-minute bullish signal
⚠️Technical analysis: Multi-timeframe bullish convergence on the 4-hour and 30-minute charts! Volume increased after the MACD golden cross, moving averages have just formed a bullish alignment and are spreading upward, KDJ strongly favors the bulls, and volume is up by a normal 1.2x.
════════════════════
🔴 $COHR 30-minute bullish signal
⚠️Technical analysis: Multi-timeframe bullish convergence on the 4-hour and 30-minute charts! Red bars have continued to expand after the MACD golden cross, moving averages are aligned bullishly and spreading upward, KDJ K-line crossed above D-line without entering overbought territory, and volume is up 1.8x.
════════════════════
🔔 Follow for first-hand market alerts 🔔
#多周期共振 #QCOM #ICP #COHR
📌 When trading, pay attention to whether the candlestick patterns confirm the signal.
19
·
--
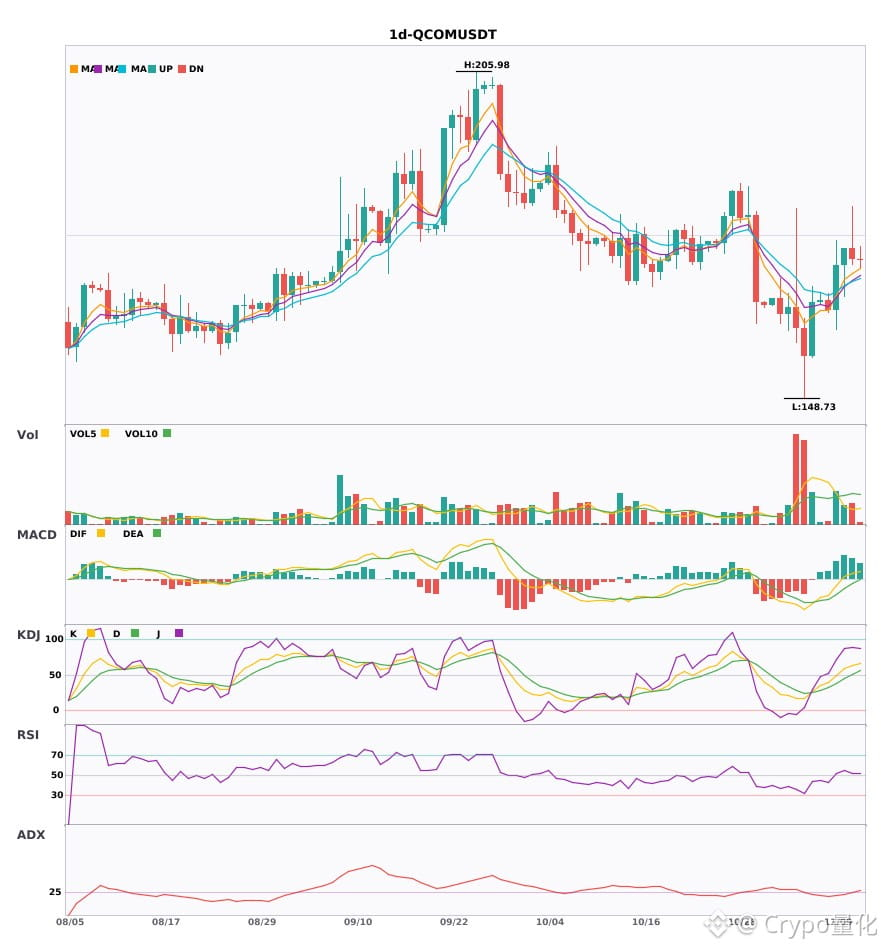
$QCOM Daily chart shows a bullish bias; key indicators confirm 🔥
════════════════════
🔴 $QCOM Daily chart bullish signal
⚠️Technical analysis: ADX(27) Trend is forming; suitable for participation | MACD is bullish, with a relatively strong trend but weakening momentum | EMA5 > EMA8 > EMA13 bullish alignment | KDJ is running strong, with bulls in control (K: 63.5, D: 51.1) | Lower volume (0.7x)
════════════════════
🔔 Follow to get first-hand updates on unusual market movements 🔔
#技术分析 #QCOM
📌 When trading, pay attention to whether the candlestick pattern meets expectations
$QCOM Daily chart shows a bullish bias; key indicators confirm 🔥
════════════════════
🔴 $QCOM Daily chart bullish signal
⚠️Technical analysis: ADX(27) Trend is forming; suitable for participation | MACD is bullish, with a relatively strong trend but weakening momentum | EMA5 > EMA8 > EMA13 bullish alignment | KDJ is running strong, with bulls in control (K: 63.5, D: 51.1) | Lower volume (0.7x)
════════════════════
🔔 Follow to get first-hand updates on unusual market movements 🔔
#技术分析 #QCOM
📌 When trading, pay attention to whether the candlestick pattern meets expectations
════════════════════
🔴 $QCOM Daily chart bullish signal
⚠️Technical analysis: ADX(27) Trend is forming; suitable for participation | MACD is bullish, with a relatively strong trend but weakening momentum | EMA5 > EMA8 > EMA13 bullish alignment | KDJ is running strong, with bulls in control (K: 63.5, D: 51.1) | Lower volume (0.7x)
════════════════════
🔔 Follow to get first-hand updates on unusual market movements 🔔
#技术分析 #QCOM
📌 When trading, pay attention to whether the candlestick pattern meets expectations
2
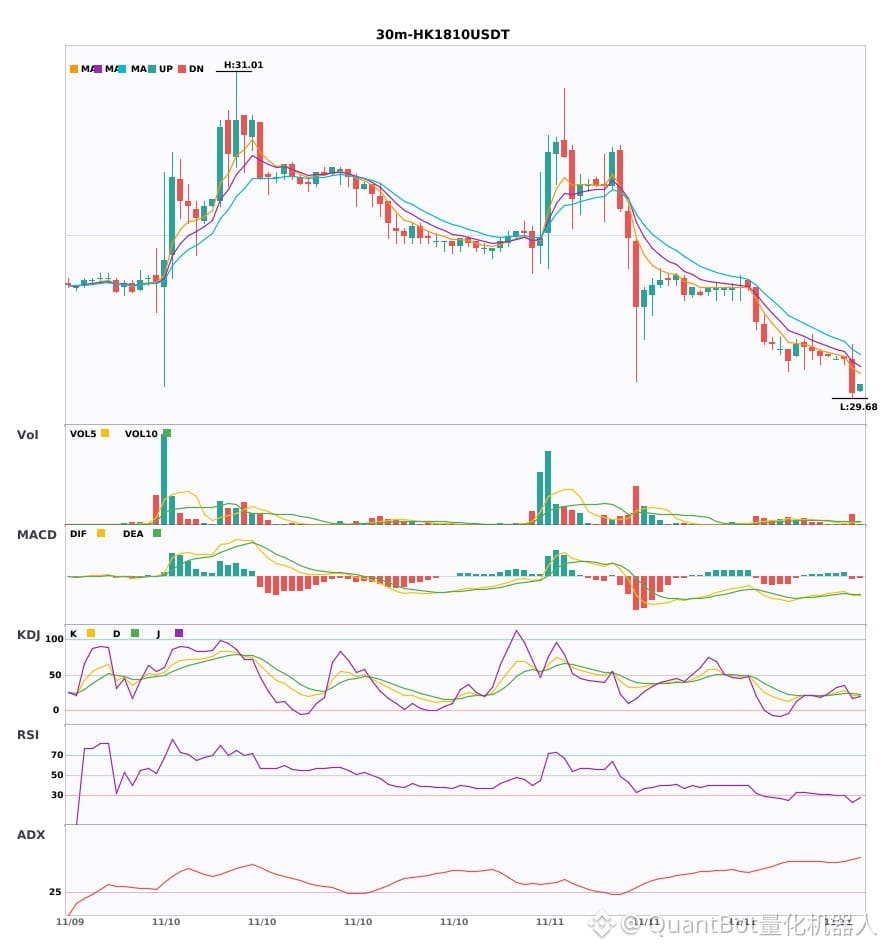
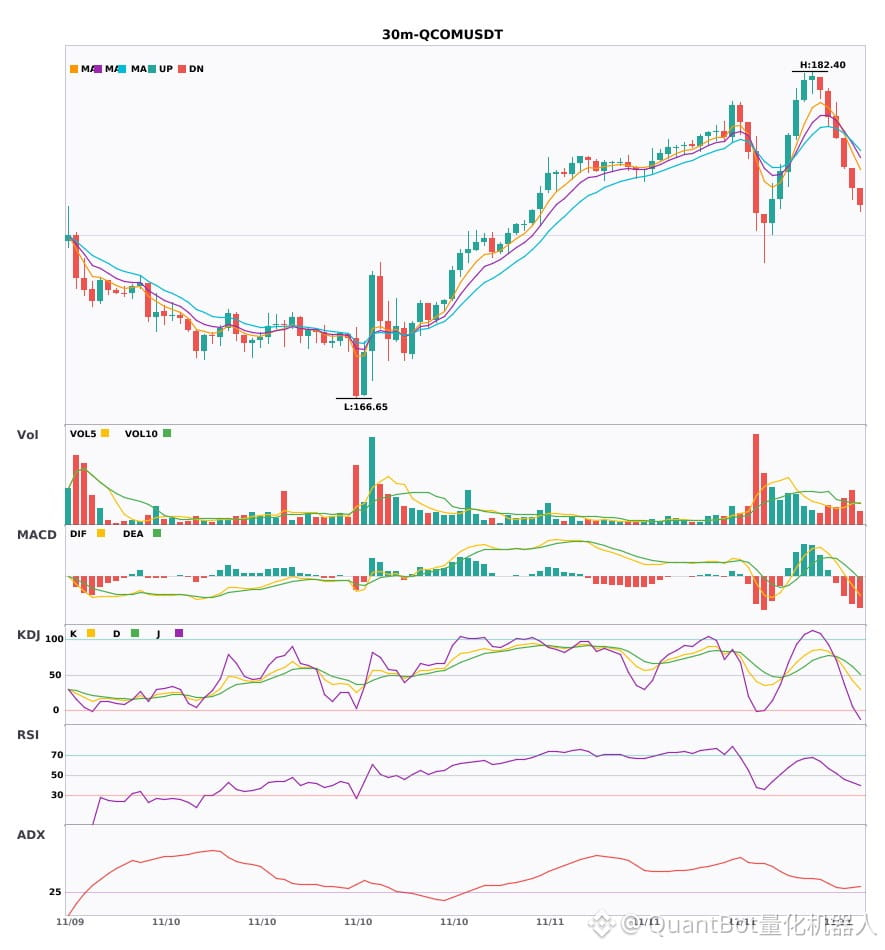
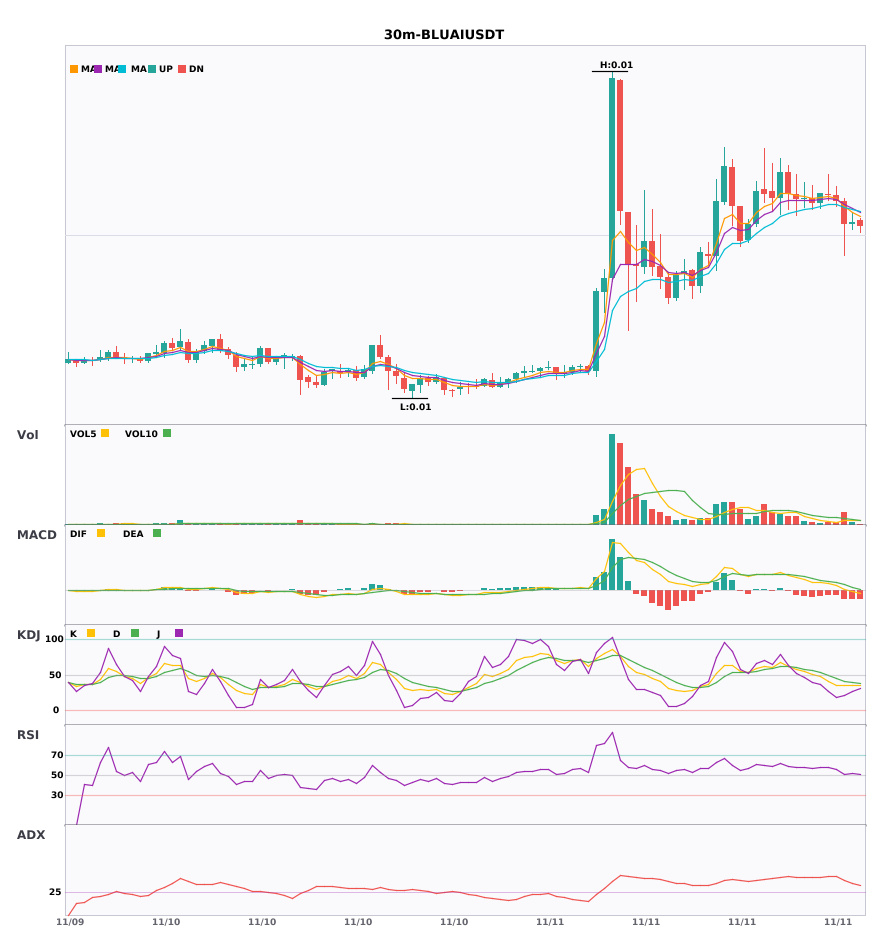
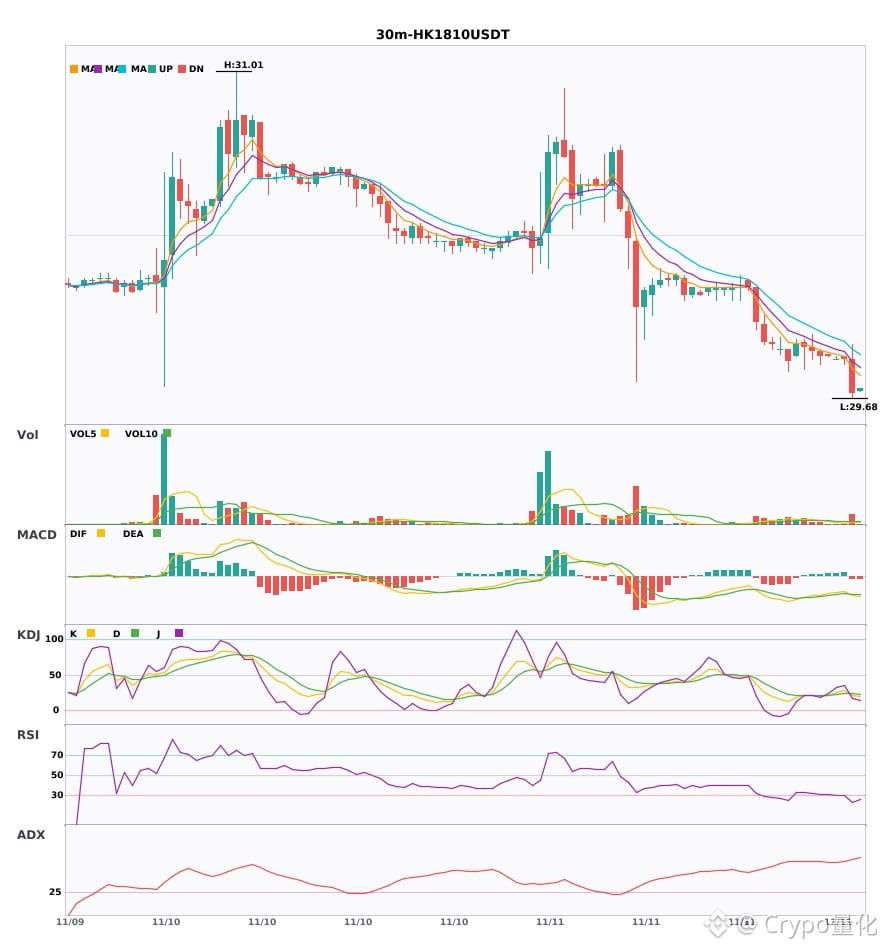
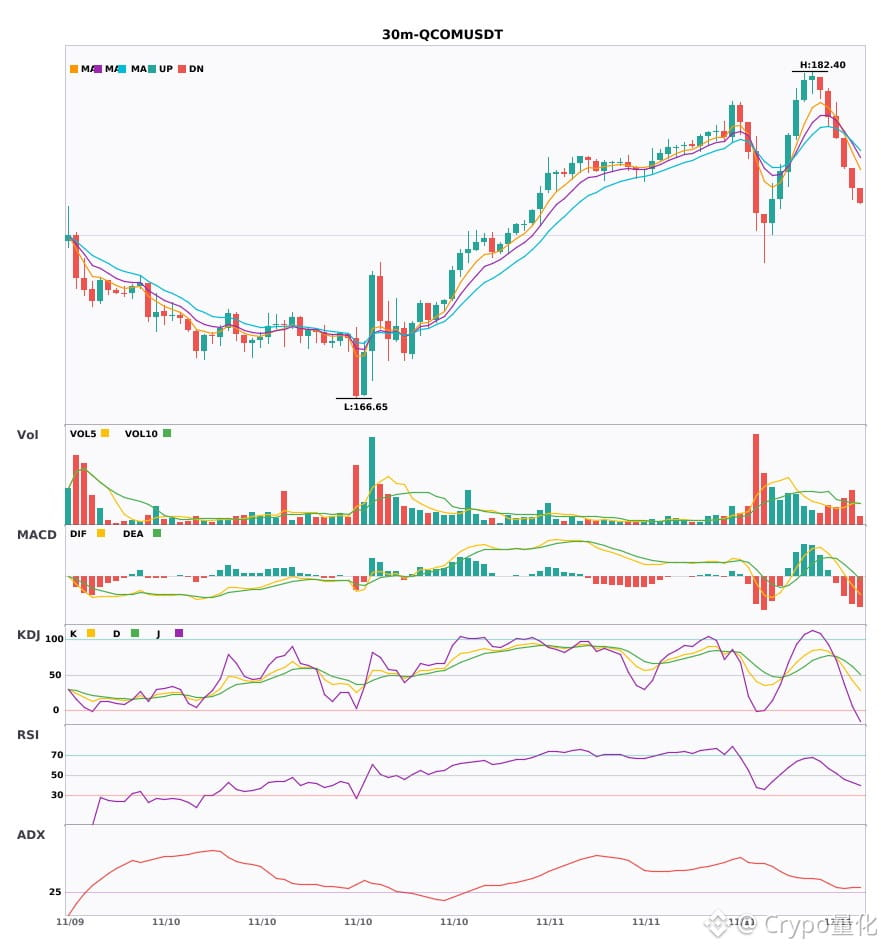
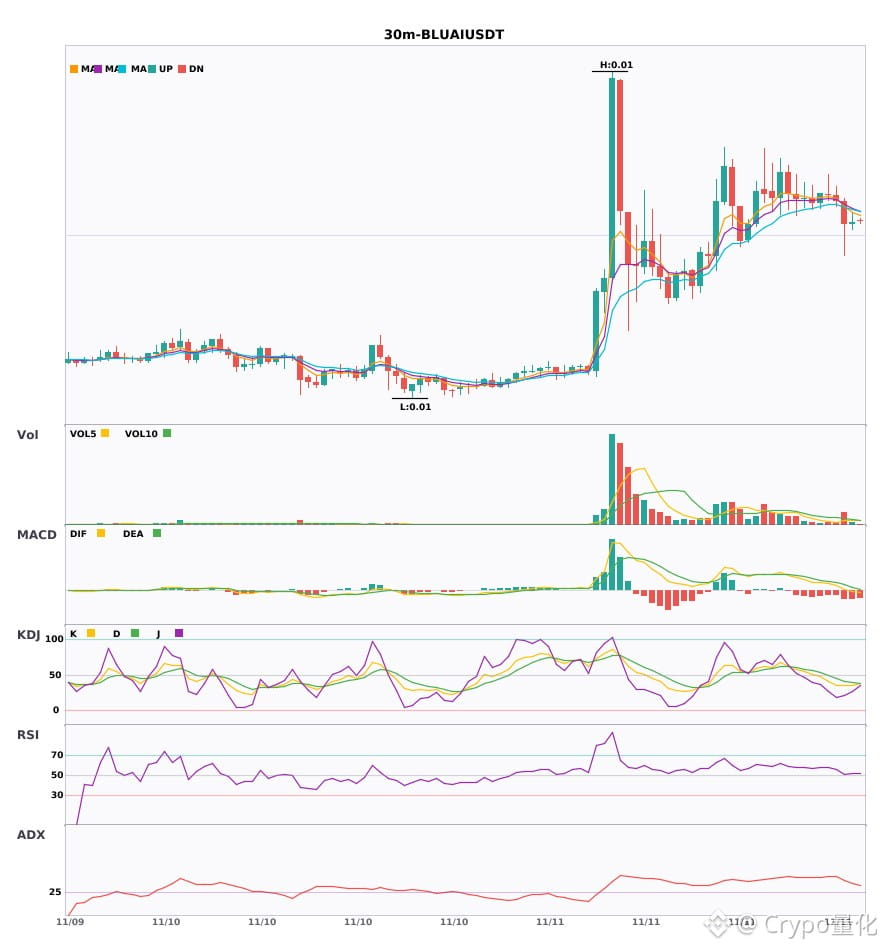
$HK1810 / $QCOM / $BLUAI 30-minute bearish convergence, bearish signals appearing simultaneously
📉 $HK1810 | 30-minute bearish signal
━━━━━━━━━━━━━━━━━━
Technical analysis: ADX(63) Very strong trend (beware of an overheated pullback) | MACD bearish crossover below zero, bearish momentum accelerating | EMA5 < EMA8 < EMA13, bearish alignment | KDJ bearish crossover, short-term outlook bearish (K: 21.4, D: 23.5) | Volume surge (2.6x)
Price change: -0.4700%
📉 $QCOM | 30-minute bearish signal
━━━━━━━━━━━━━━━━━━
Technical analysis: ADX(30) Trend is taking shape; participation is possible | MACD DIF fell below the zero line, trend turning bearish | EMA5 < EMA8 < EMA13, bearish alignment | Increased volume (1.5x)
Price change: -0.5500%
📉 $BLUAI | 30-minute bearish signal
━━━━━━━━━━━━━━━━━━
Technical analysis: ADX(36) Clear trending market | MACD DIF fell below the zero line, trend turning bearish | Moving averages are converging, momentum building; direction may be chosen soon | KDJ moving weakly, bears have the upper hand (K: 35.2, D: 39.3) | Increased volume (2.0x)
Price change: 0.0800%
━━━━━━━━━━━━━━━━━━
#技术分析 #HK1810 #QCOM #BLUAI
📌 The above is for reference only and does not constitute investment advice
$HK1810 / $QCOM / $BLUAI 30-minute bearish convergence, bearish signals appearing simultaneously
📉 $HK1810 | 30-minute bearish signal
━━━━━━━━━━━━━━━━━━
Technical analysis: ADX(63) Very strong trend (beware of an overheated pullback) | MACD bearish crossover below zero, bearish momentum accelerating | EMA5 < EMA8 < EMA13, bearish alignment | KDJ bearish crossover, short-term outlook bearish (K: 21.4, D: 23.5) | Volume surge (2.6x)
Price change: -0.4700%
📉 $QCOM | 30-minute bearish signal
━━━━━━━━━━━━━━━━━━
Technical analysis: ADX(30) Trend is taking shape; participation is possible | MACD DIF fell below the zero line, trend turning bearish | EMA5 < EMA8 < EMA13, bearish alignment | Increased volume (1.5x)
Price change: -0.5500%
📉 $BLUAI | 30-minute bearish signal
━━━━━━━━━━━━━━━━━━
Technical analysis: ADX(36) Clear trending market | MACD DIF fell below the zero line, trend turning bearish | Moving averages are converging, momentum building; direction may be chosen soon | KDJ moving weakly, bears have the upper hand (K: 35.2, D: 39.3) | Increased volume (2.0x)
Price change: 0.0800%
━━━━━━━━━━━━━━━━━━
#技术分析 #HK1810 #QCOM #BLUAI
📌 The above is for reference only and does not constitute investment advice
📉 $HK1810 | 30-minute bearish signal
━━━━━━━━━━━━━━━━━━
Technical analysis: ADX(63) Very strong trend (beware of an overheated pullback) | MACD bearish crossover below zero, bearish momentum accelerating | EMA5 < EMA8 < EMA13, bearish alignment | KDJ bearish crossover, short-term outlook bearish (K: 21.4, D: 23.5) | Volume surge (2.6x)
Price change: -0.4700%
📉 $QCOM | 30-minute bearish signal
━━━━━━━━━━━━━━━━━━
Technical analysis: ADX(30) Trend is taking shape; participation is possible | MACD DIF fell below the zero line, trend turning bearish | EMA5 < EMA8 < EMA13, bearish alignment | Increased volume (1.5x)
Price change: -0.5500%
📉 $BLUAI | 30-minute bearish signal
━━━━━━━━━━━━━━━━━━
Technical analysis: ADX(36) Clear trending market | MACD DIF fell below the zero line, trend turning bearish | Moving averages are converging, momentum building; direction may be chosen soon | KDJ moving weakly, bears have the upper hand (K: 35.2, D: 39.3) | Increased volume (2.0x)
Price change: 0.0800%
━━━━━━━━━━━━━━━━━━
#技术分析 #HK1810 #QCOM #BLUAI
📌 The above is for reference only and does not constitute investment advice
11
·
--
3 30-minute bearish alerts: $HK1810 / $QCOM / $BLUAI🔥
════════════════════
🟢 $HK1810 30-minute bearish signal
⚠️Technical analysis: ADX (63) indicates a very strong trend (beware of an overheated pullback) | MACD bearish crossover below zero, bearish momentum accelerating | EMA5 < EMA8 < EMA13, bearish alignment | KDJ bearish crossover, short-term outlook is bearish (K: 21.4, D: 23.5) | Volume surge (2.6x)
════════════════════
🟢 $QCOM 30-minute bearish signal
⚠️Technical analysis: ADX (30) indicates a trend is forming; there may be an opportunity to enter | MACD DIF falls below zero, signaling a bearish trend | EMA5 < EMA8 < EMA13, bearish alignment | Volume increases (1.5x)
════════════════════
🟢 $BLUAI 30-minute bearish signal
⚠️Technical analysis: ADX (36) indicates a clear trending market | MACD DIF falls below zero, signaling a bearish trend | Moving averages are converging as momentum builds; a directional move is imminent | KDJ is trending weakly, with bears in control (K: 35.2, D: 39.3) | Volume increases (2.0x)
════════════════════
🔔 Follow us for real-time market alerts 🔔
#技术分析 #HK1810 #QCOM #BLUAI
📌 When trading, watch for confirmation from the candlestick patterns
3 30-minute bearish alerts: $HK1810 / $QCOM / $BLUAI 🔥
════════════════════
🟢 $HK1810 30-minute bearish signal
⚠️Technical analysis: ADX (63) indicates a very strong trend (beware of an overheated pullback) | MACD bearish crossover below zero, bearish momentum accelerating | EMA5 < EMA8 < EMA13, bearish alignment | KDJ bearish crossover, short-term outlook is bearish (K: 21.4, D: 23.5) | Volume surge (2.6x)
════════════════════
🟢 $QCOM 30-minute bearish signal
⚠️Technical analysis: ADX (30) indicates a trend is forming; there may be an opportunity to enter | MACD DIF falls below zero, signaling a bearish trend | EMA5 < EMA8 < EMA13, bearish alignment | Volume increases (1.5x)
════════════════════
🟢 $BLUAI 30-minute bearish signal
⚠️Technical analysis: ADX (36) indicates a clear trending market | MACD DIF falls below zero, signaling a bearish trend | Moving averages are converging as momentum builds; a directional move is imminent | KDJ is trending weakly, with bears in control (K: 35.2, D: 39.3) | Volume increases (2.0x)
════════════════════
🔔 Follow us for real-time market alerts 🔔
#技术分析 #HK1810 #QCOM #BLUAI
📌 When trading, watch for confirmation from the candlestick patterns
════════════════════
🟢 $HK1810 30-minute bearish signal
⚠️Technical analysis: ADX (63) indicates a very strong trend (beware of an overheated pullback) | MACD bearish crossover below zero, bearish momentum accelerating | EMA5 < EMA8 < EMA13, bearish alignment | KDJ bearish crossover, short-term outlook is bearish (K: 21.4, D: 23.5) | Volume surge (2.6x)
════════════════════
🟢 $QCOM 30-minute bearish signal
⚠️Technical analysis: ADX (30) indicates a trend is forming; there may be an opportunity to enter | MACD DIF falls below zero, signaling a bearish trend | EMA5 < EMA8 < EMA13, bearish alignment | Volume increases (1.5x)
════════════════════
🟢 $BLUAI 30-minute bearish signal
⚠️Technical analysis: ADX (36) indicates a clear trending market | MACD DIF falls below zero, signaling a bearish trend | Moving averages are converging as momentum builds; a directional move is imminent | KDJ is trending weakly, with bears in control (K: 35.2, D: 39.3) | Volume increases (2.0x)
════════════════════
🔔 Follow us for real-time market alerts 🔔
#技术分析 #HK1810 #QCOM #BLUAI
📌 When trading, watch for confirmation from the candlestick patterns
15

·
--
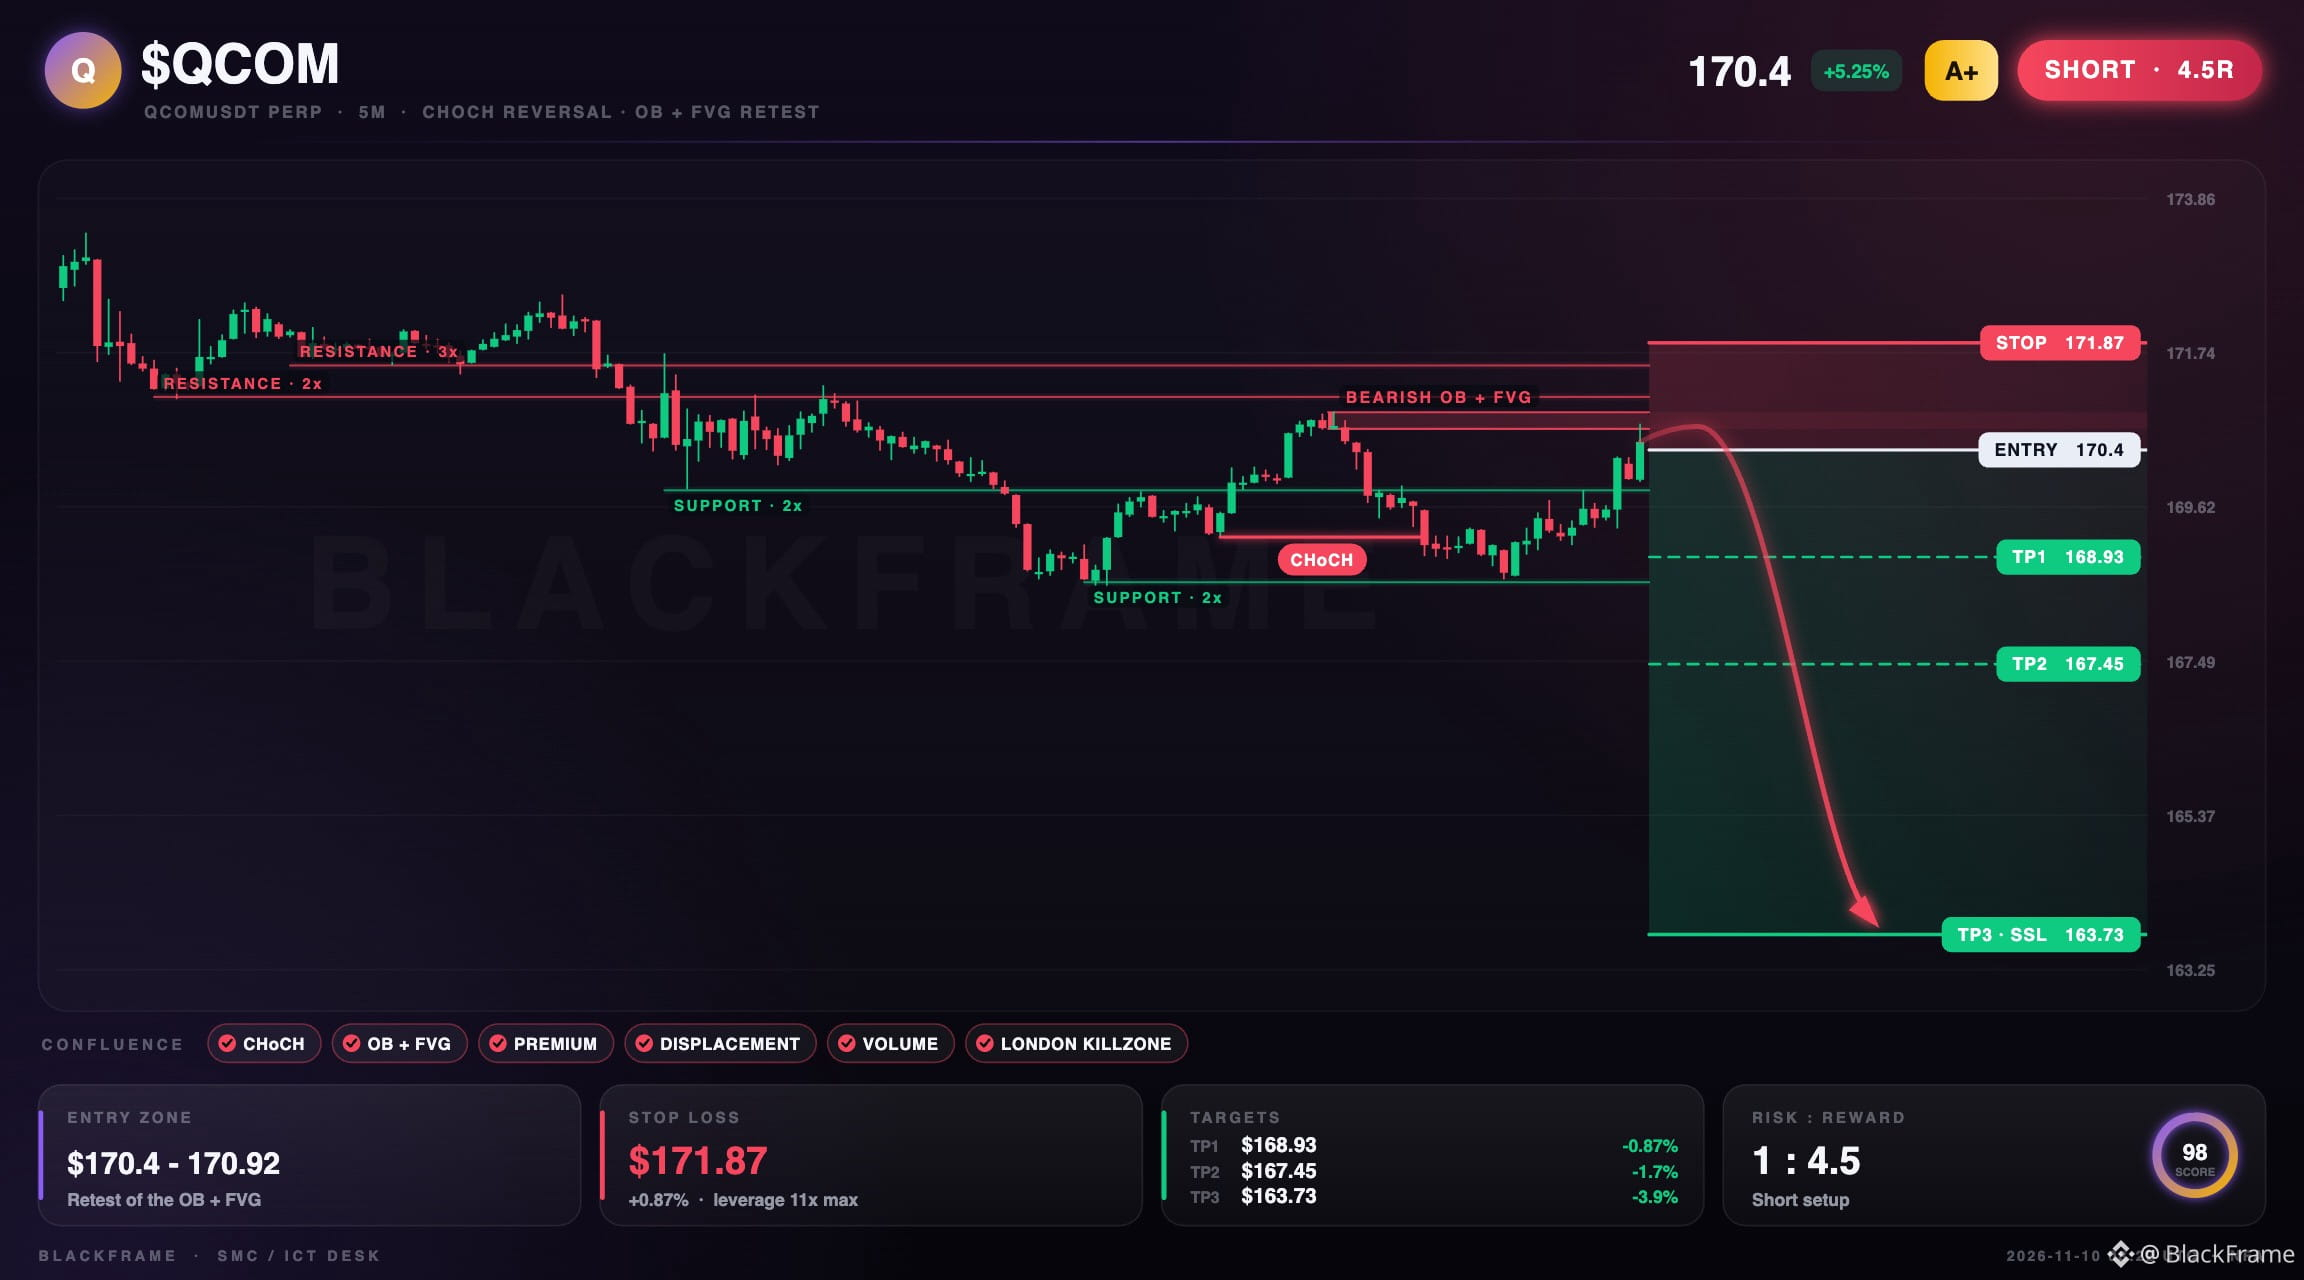
⚡️ $QCOM breaks structure, short bias confirmed
SHORT · 5M
Entry: $170.4 - $170.69
TP1: $168.93
TP2: $167.45
TP3: $163.73
SL: $171.87
CHoCH confirmed on the 5M aligns with an OB+FVG zone at $170.69-170.92. Selling from premium with strong displacement and volume expansion during the London killzone, higher timeframe structure agrees. Enter at $170.4, stop at $171.87, target sell‑side liquidity at $163.73.
#QCOM #ICT · NFA
⚡️ $QCOM breaks structure, short bias confirmed
SHORT · 5M
Entry: $170.4 - $170.69
TP1: $168.93
TP2: $167.45
TP3: $163.73
SL: $171.87
CHoCH confirmed on the 5M aligns with an OB+FVG zone at $170.69-170.92. Selling from premium with strong displacement and volume expansion during the London killzone, higher timeframe structure agrees. Enter at $170.4, stop at $171.87, target sell‑side liquidity at $163.73.
#QCOM #ICT · NFA
SHORT · 5M
Entry: $170.4 - $170.69
TP1: $168.93
TP2: $167.45
TP3: $163.73
SL: $171.87
CHoCH confirmed on the 5M aligns with an OB+FVG zone at $170.69-170.92. Selling from premium with strong displacement and volume expansion during the London killzone, higher timeframe structure agrees. Enter at $170.4, stop at $171.87, target sell‑side liquidity at $163.73.
#QCOM #ICT · NFA
24
·
--
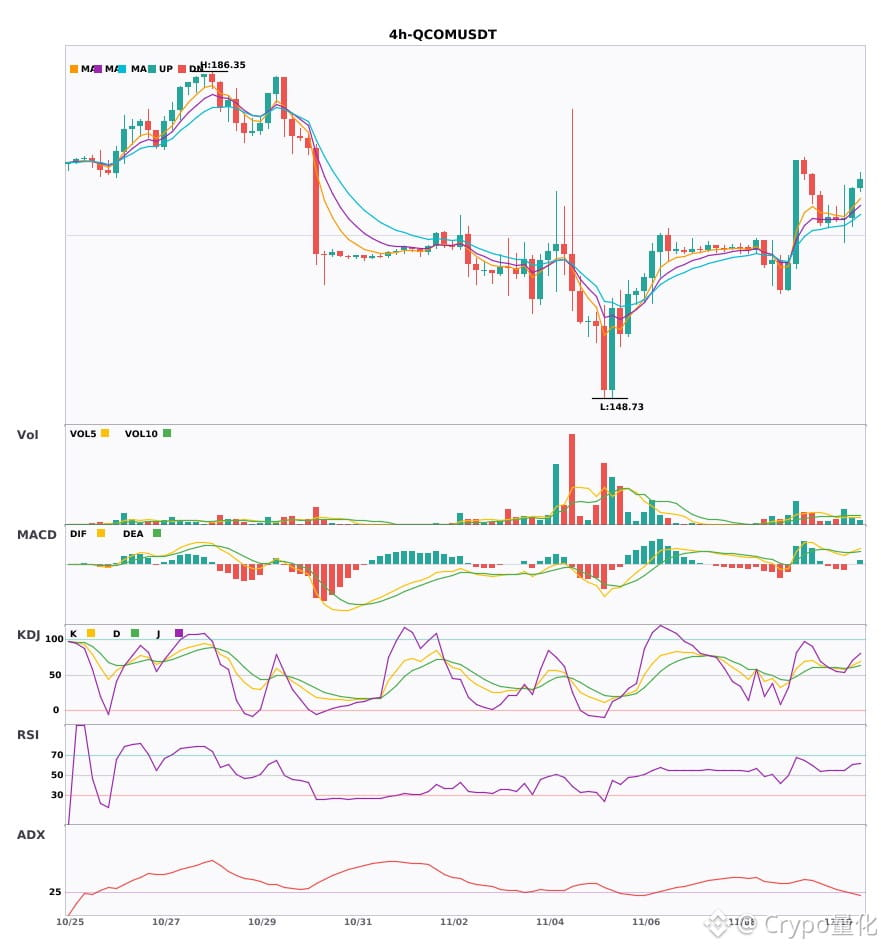
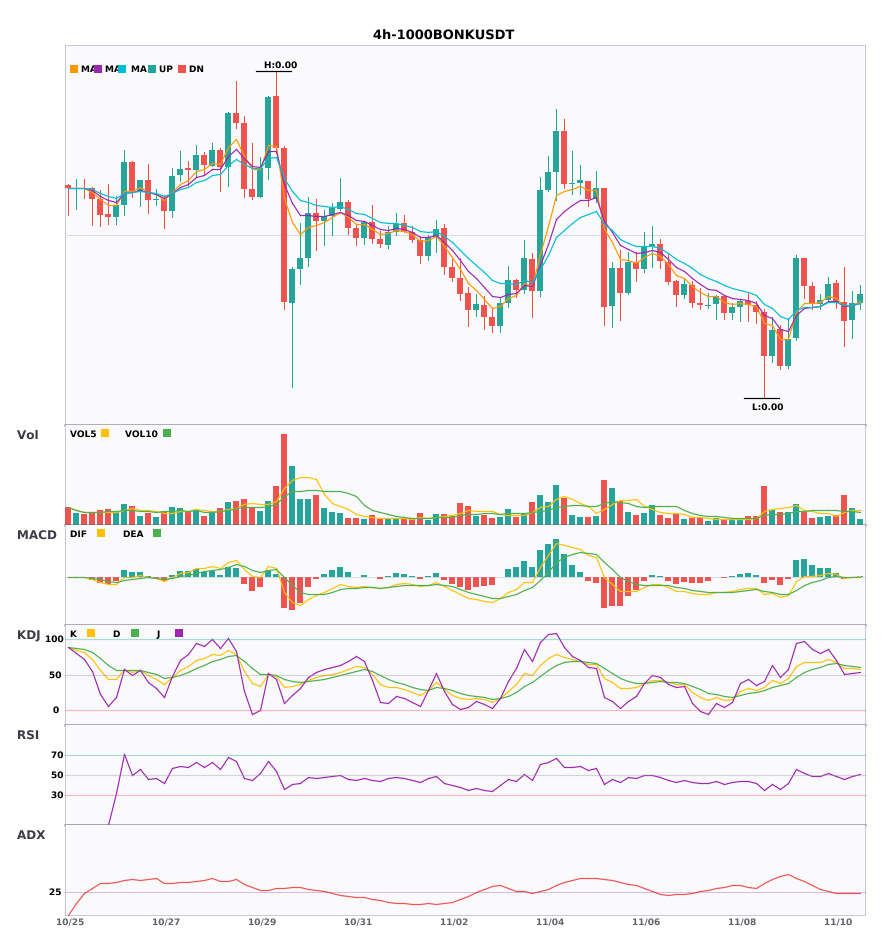
$QCOM / $1000BONK 4-hour confluence turns bullish, with bullish signals appearing simultaneously 🔥
════════════════════
🔴 $QCOM 4-hour bullish signals
⚠️Technical analysis: ADX(25): trend is forming, opportunity to participate | MACD golden cross above zero, bullish momentum emerging | EMA5 > EMA8 > EMA13, bullish alignment | KDJ golden cross, short-term bullish (K: 63.8, D: 60.9) | Volume increased (1.6x)
════════════════════
🔴 $1000BONK 4-hour bullish signals
⚠️Technical analysis: ADX(26): trend is forming, opportunity to participate | MACD DIF breaks above zero, trend turns bullish | EMA5 crosses above EMA8, short-term bullish shift | KDJ in strong territory, bulls have the upper hand (K: 58.6, D: 61.8) | Volume increased (2.2x)
════════════════════
🔔 Follow for first-hand market updates 🔔
#技术分析 #QCOM #1000BONK
📌 When trading, pay attention to whether the candlestick patterns align
$QCOM / $1000BONK 4-hour confluence turns bullish, with bullish signals appearing simultaneously 🔥
════════════════════
🔴 $QCOM 4-hour bullish signals
⚠️Technical analysis: ADX(25): trend is forming, opportunity to participate | MACD golden cross above zero, bullish momentum emerging | EMA5 > EMA8 > EMA13, bullish alignment | KDJ golden cross, short-term bullish (K: 63.8, D: 60.9) | Volume increased (1.6x)
════════════════════
🔴 $1000BONK 4-hour bullish signals
⚠️Technical analysis: ADX(26): trend is forming, opportunity to participate | MACD DIF breaks above zero, trend turns bullish | EMA5 crosses above EMA8, short-term bullish shift | KDJ in strong territory, bulls have the upper hand (K: 58.6, D: 61.8) | Volume increased (2.2x)
════════════════════
🔔 Follow for first-hand market updates 🔔
#技术分析 #QCOM #1000BONK
📌 When trading, pay attention to whether the candlestick patterns align
════════════════════
🔴 $QCOM 4-hour bullish signals
⚠️Technical analysis: ADX(25): trend is forming, opportunity to participate | MACD golden cross above zero, bullish momentum emerging | EMA5 > EMA8 > EMA13, bullish alignment | KDJ golden cross, short-term bullish (K: 63.8, D: 60.9) | Volume increased (1.6x)
════════════════════
🔴 $1000BONK 4-hour bullish signals
⚠️Technical analysis: ADX(26): trend is forming, opportunity to participate | MACD DIF breaks above zero, trend turns bullish | EMA5 crosses above EMA8, short-term bullish shift | KDJ in strong territory, bulls have the upper hand (K: 58.6, D: 61.8) | Volume increased (2.2x)
════════════════════
🔔 Follow for first-hand market updates 🔔
#技术分析 #QCOM #1000BONK
📌 When trading, pay attention to whether the candlestick patterns align
4
·
--
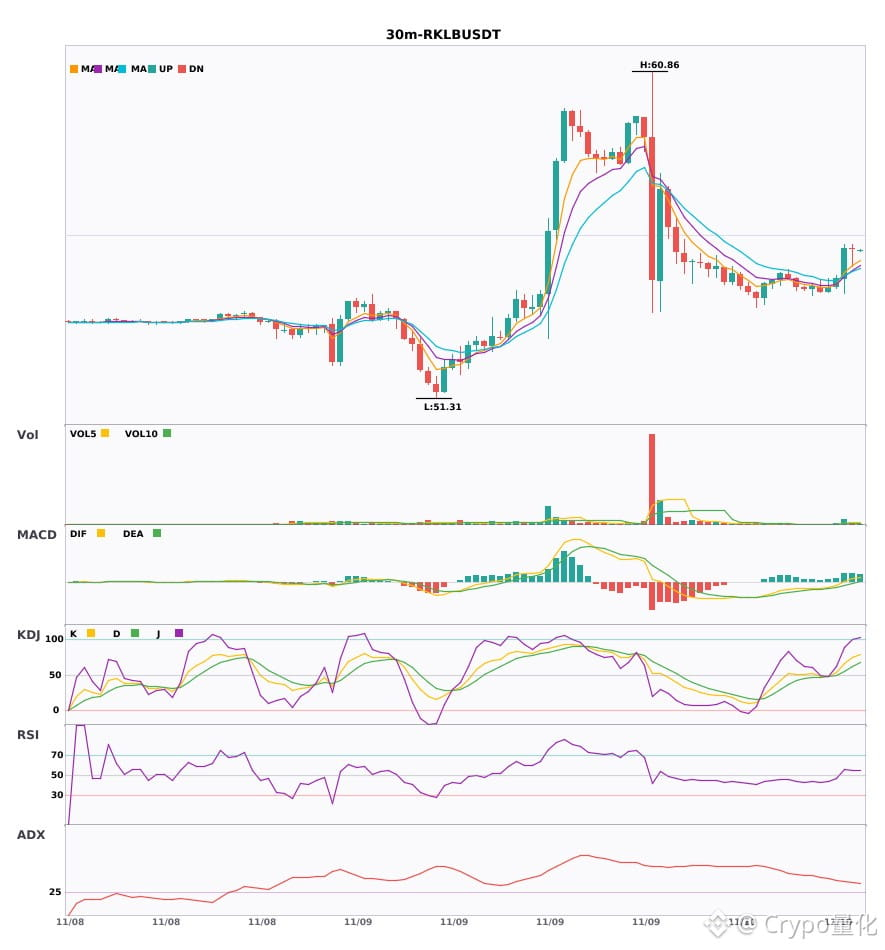
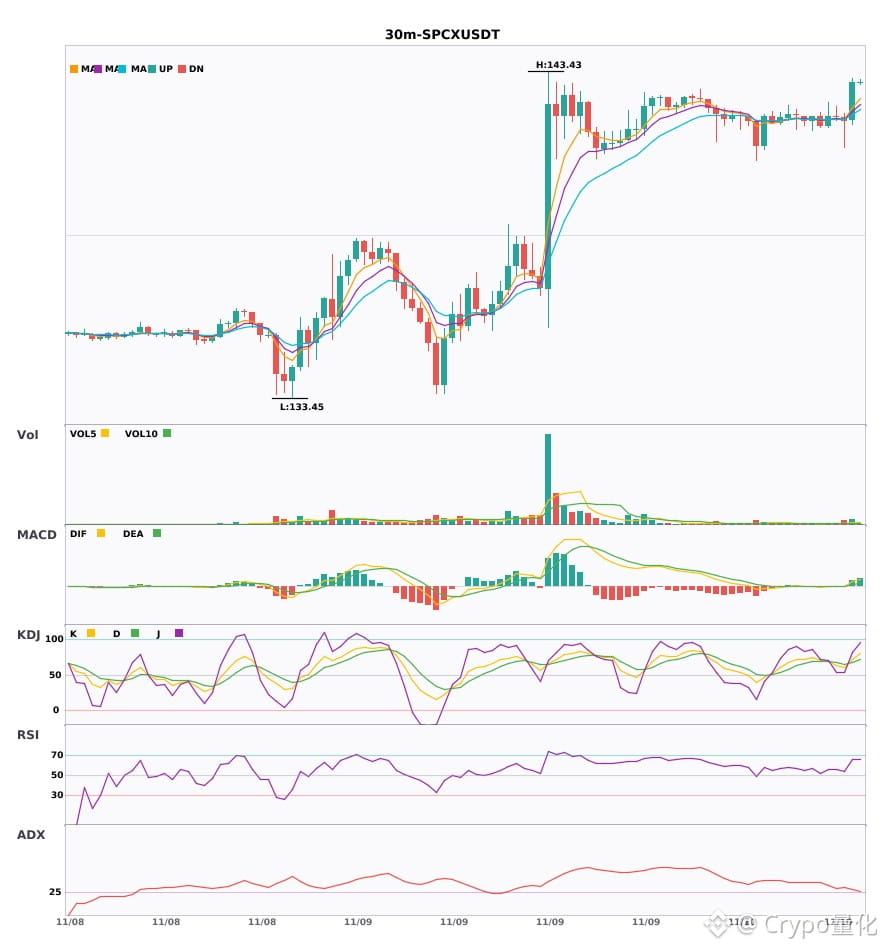
$RKLB / $SPCX / $QCOM 30-minute bullish signals, short-term confluence opportunities 🔥
════════════════════
🔴 $RKLB 30-minute bullish signal
⚠️Technical analysis: ADX (36): clear trending market | MACD bullish, trend relatively strong, momentum increasing | EMA5 > EMA8 > EMA13, bullish alignment | KDJ running strong, bulls have the edge (K: 74.0, D: 61.3) | Volume surge (4.2x)
════════════════════
🔴 $SPCX 30-minute bullish signal
⚠️Technical analysis: ADX (29): trend is forming; opportunity to participate | MACD bullish crossover above zero, bullish momentum emerging | EMA5 crossed above EMA8, short-term outlook turning bullish | KDJ bullish crossover, bullish short-term outlook (K: 72.1, D: 67.4) | Volume surge (2.8x)
════════════════════
🔴 $QCOM 30-minute bullish signal
⚠️Technical analysis: ADX (25): trend is forming; opportunity to participate | MACD DIF breaks above the zero line, trend turning bullish | Moving averages converging and building momentum; direction about to be determined | KDJ running strong, bulls have the edge (K: 68.6, D: 57.6) | Volume surge (3.1x)
════════════════════
🔔 Follow for the latest market moves 🔔
#技术分析 #RKLB #SPCX #QCOM
📌 When trading, pay attention to whether the candlestick pattern confirms the setup
$RKLB / $SPCX / $QCOM 30-minute bullish signals, short-term confluence opportunities 🔥
════════════════════
🔴 $RKLB 30-minute bullish signal
⚠️Technical analysis: ADX (36): clear trending market | MACD bullish, trend relatively strong, momentum increasing | EMA5 > EMA8 > EMA13, bullish alignment | KDJ running strong, bulls have the edge (K: 74.0, D: 61.3) | Volume surge (4.2x)
════════════════════
🔴 $SPCX 30-minute bullish signal
⚠️Technical analysis: ADX (29): trend is forming; opportunity to participate | MACD bullish crossover above zero, bullish momentum emerging | EMA5 crossed above EMA8, short-term outlook turning bullish | KDJ bullish crossover, bullish short-term outlook (K: 72.1, D: 67.4) | Volume surge (2.8x)
════════════════════
🔴 $QCOM 30-minute bullish signal
⚠️Technical analysis: ADX (25): trend is forming; opportunity to participate | MACD DIF breaks above the zero line, trend turning bullish | Moving averages converging and building momentum; direction about to be determined | KDJ running strong, bulls have the edge (K: 68.6, D: 57.6) | Volume surge (3.1x)
════════════════════
🔔 Follow for the latest market moves 🔔
#技术分析 #RKLB #SPCX #QCOM
📌 When trading, pay attention to whether the candlestick pattern confirms the setup
════════════════════
🔴 $RKLB 30-minute bullish signal
⚠️Technical analysis: ADX (36): clear trending market | MACD bullish, trend relatively strong, momentum increasing | EMA5 > EMA8 > EMA13, bullish alignment | KDJ running strong, bulls have the edge (K: 74.0, D: 61.3) | Volume surge (4.2x)
════════════════════
🔴 $SPCX 30-minute bullish signal
⚠️Technical analysis: ADX (29): trend is forming; opportunity to participate | MACD bullish crossover above zero, bullish momentum emerging | EMA5 crossed above EMA8, short-term outlook turning bullish | KDJ bullish crossover, bullish short-term outlook (K: 72.1, D: 67.4) | Volume surge (2.8x)
════════════════════
🔴 $QCOM 30-minute bullish signal
⚠️Technical analysis: ADX (25): trend is forming; opportunity to participate | MACD DIF breaks above the zero line, trend turning bullish | Moving averages converging and building momentum; direction about to be determined | KDJ running strong, bulls have the edge (K: 68.6, D: 57.6) | Volume surge (3.1x)
════════════════════
🔔 Follow for the latest market moves 🔔
#技术分析 #RKLB #SPCX #QCOM
📌 When trading, pay attention to whether the candlestick pattern confirms the setup
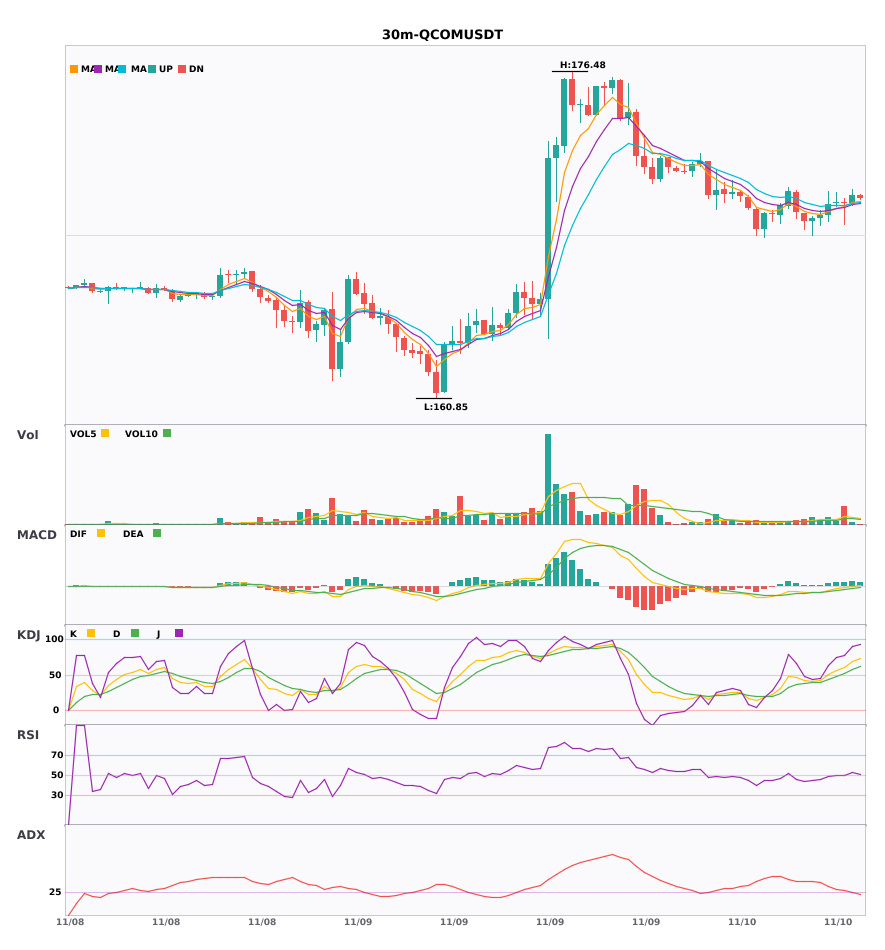
12
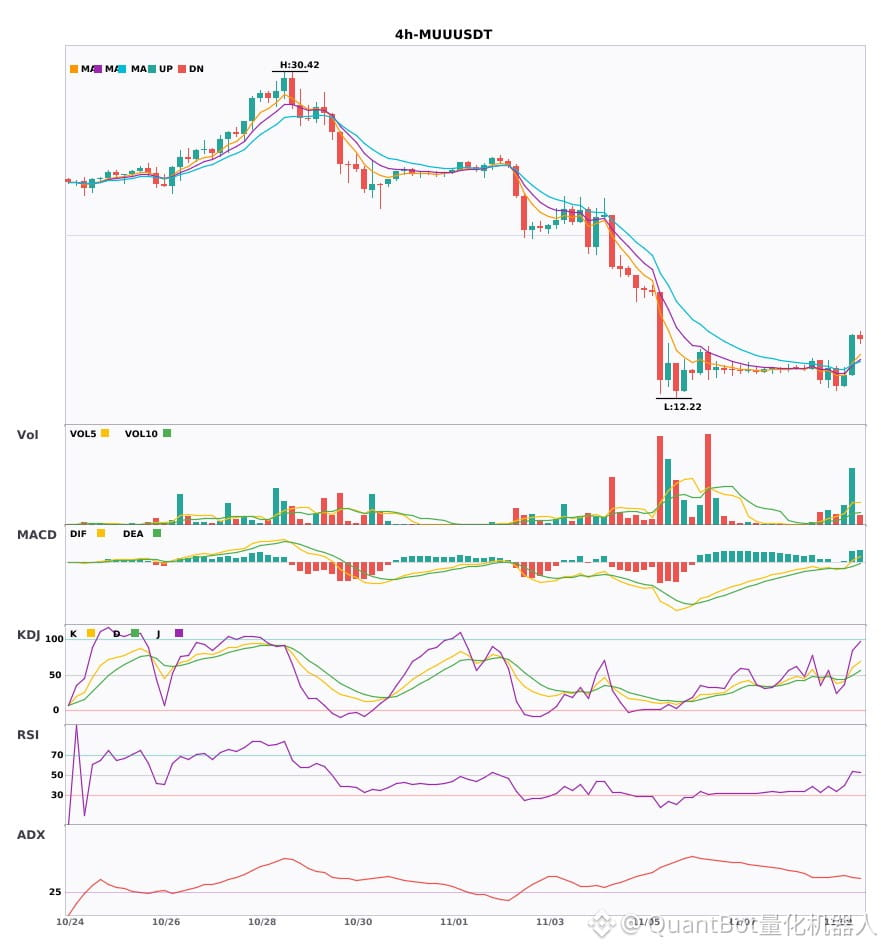
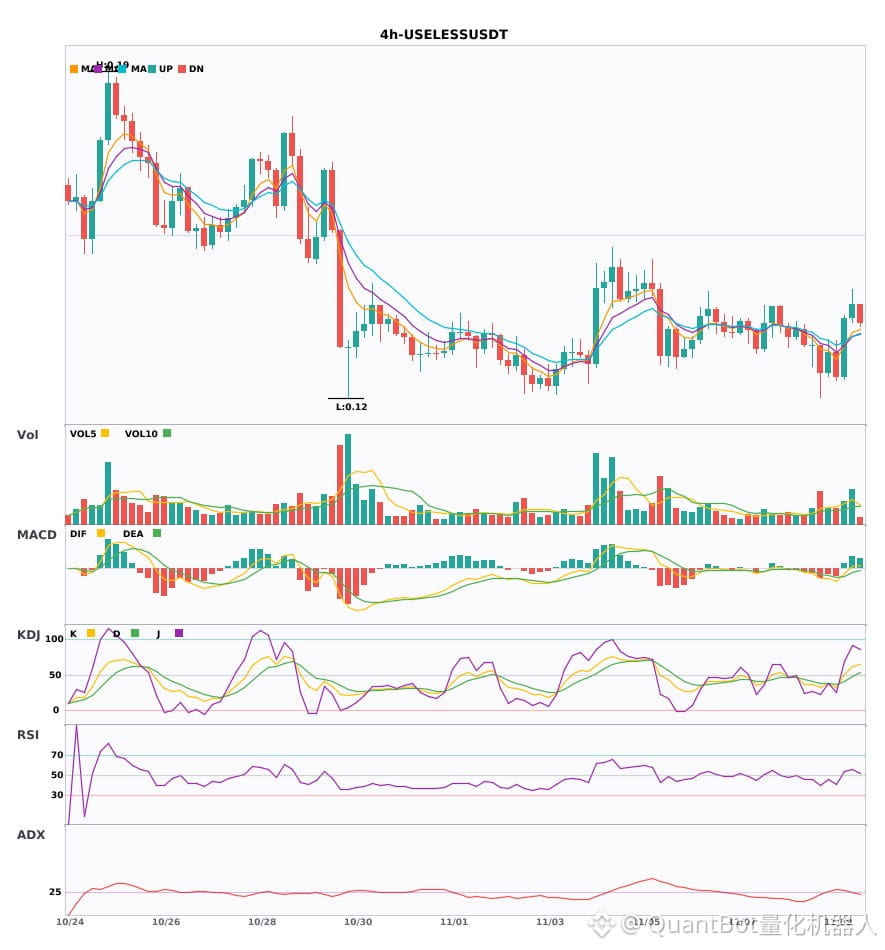
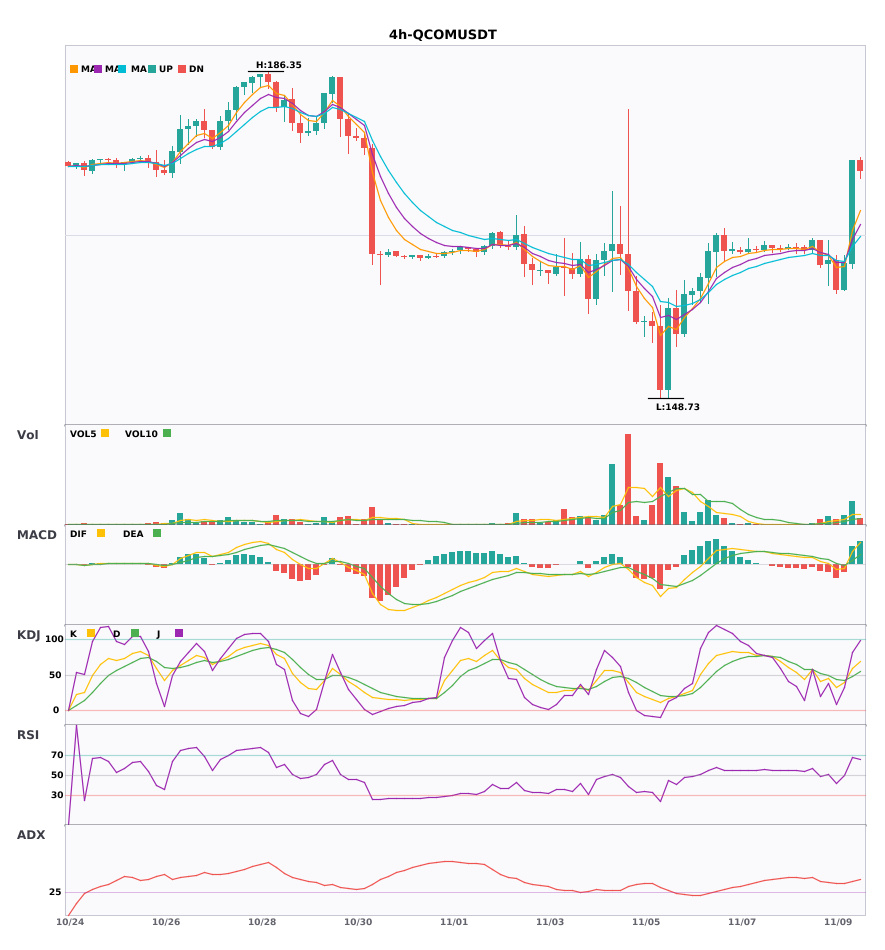
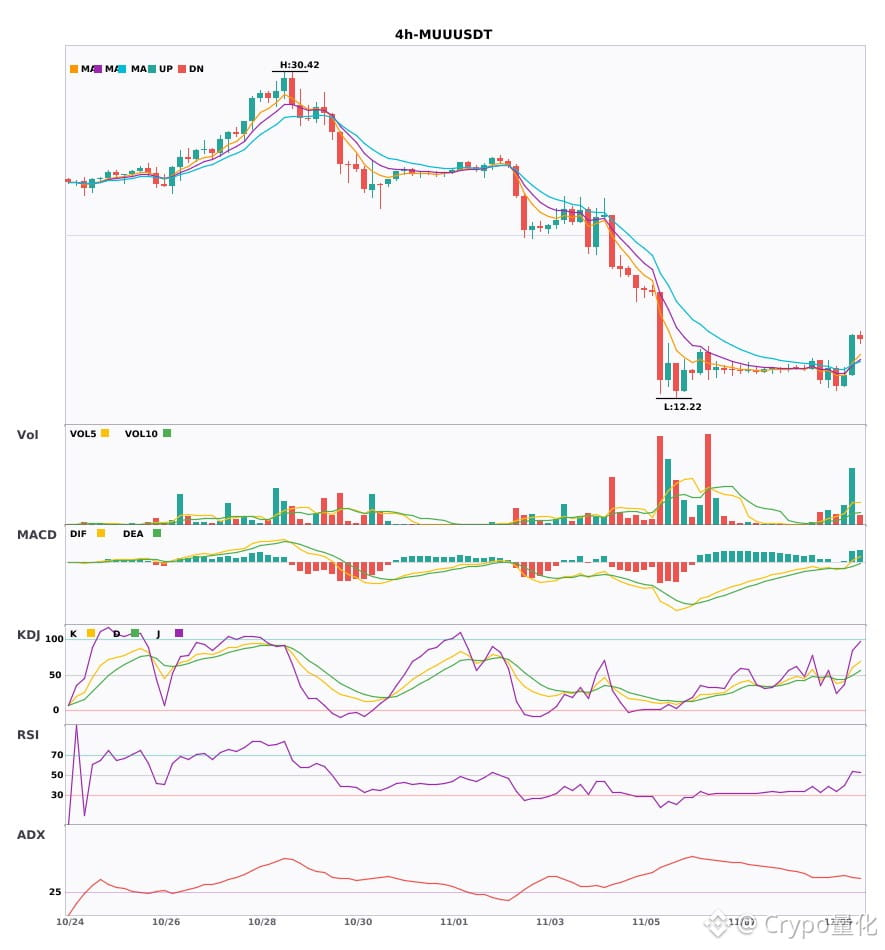
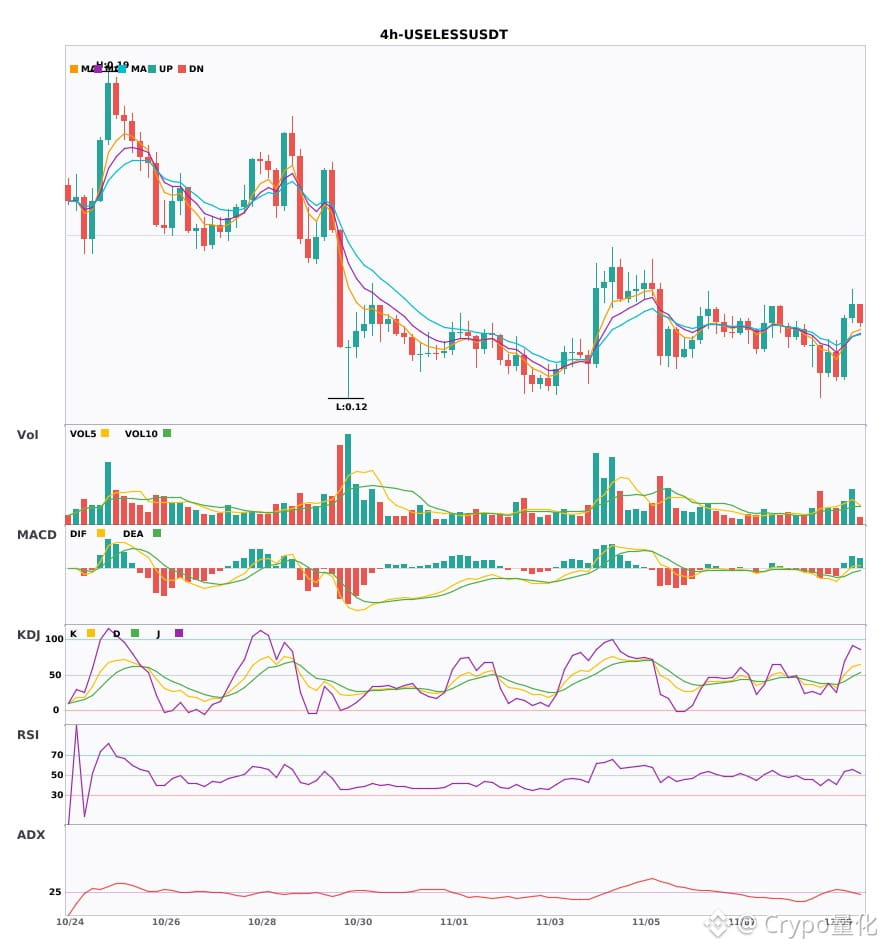
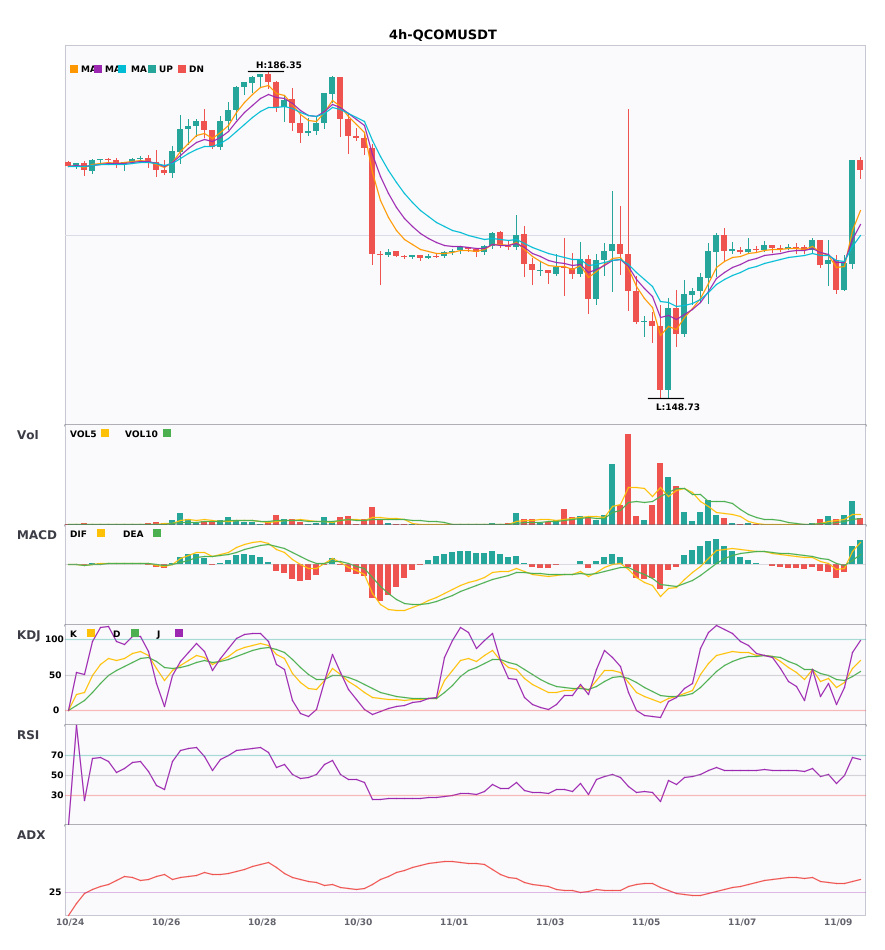
$MUU / $USELESS / $QCOM 4-hour trend reversal to bullish; bullish signals appearing simultaneously
📈 $MUU | 4-hour bullish signal
━━━━━━━━━━━━━━━━━━
Technical analysis: ADX(40) strong trending market | MACD DIF breaks above zero, trend turns bullish | EMA5 crosses above EMA8, short-term trend turns bullish | KDJ golden cross, short-term bullish (K: 60.5, D: 48.9) | Volume surge (4.8x)
Price change: 16.4100%
📈 $USELESS | 4-hour bullish signal
━━━━━━━━━━━━━━━━━━
Technical analysis: ADX(28) trend is forming, opportunity to participate | MACD DIF breaks above zero, trend turns bullish | EMA5 crosses above EMA8, short-term trend turns bullish | Volume increases (1.9x)
Price change: 2.1800%
📈 $QCOM | 4-hour bullish signal
━━━━━━━━━━━━━━━━━━
Technical analysis: ADX(41) strong trending market | MACD golden cross above zero, bullish momentum released | EMA5 crosses above EMA8, short-term trend turns bullish | KDJ golden cross, short-term bullish (K: 59.4, D: 48.1) | Volume surge (4.3x)
Price change: 7.2200%
━━━━━━━━━━━━━━━━━━
#技术分析 #MUU #USELESS #QCOM
📌 The above content is for reference only and does not constitute investment advice
$MUU / $USELESS / $QCOM 4-hour trend reversal to bullish; bullish signals appearing simultaneously
📈 $MUU | 4-hour bullish signal
━━━━━━━━━━━━━━━━━━
Technical analysis: ADX(40) strong trending market | MACD DIF breaks above zero, trend turns bullish | EMA5 crosses above EMA8, short-term trend turns bullish | KDJ golden cross, short-term bullish (K: 60.5, D: 48.9) | Volume surge (4.8x)
Price change: 16.4100%
📈 $USELESS | 4-hour bullish signal
━━━━━━━━━━━━━━━━━━
Technical analysis: ADX(28) trend is forming, opportunity to participate | MACD DIF breaks above zero, trend turns bullish | EMA5 crosses above EMA8, short-term trend turns bullish | Volume increases (1.9x)
Price change: 2.1800%
📈 $QCOM | 4-hour bullish signal
━━━━━━━━━━━━━━━━━━
Technical analysis: ADX(41) strong trending market | MACD golden cross above zero, bullish momentum released | EMA5 crosses above EMA8, short-term trend turns bullish | KDJ golden cross, short-term bullish (K: 59.4, D: 48.1) | Volume surge (4.3x)
Price change: 7.2200%
━━━━━━━━━━━━━━━━━━
#技术分析 #MUU #USELESS #QCOM
📌 The above content is for reference only and does not constitute investment advice
📈 $MUU | 4-hour bullish signal
━━━━━━━━━━━━━━━━━━
Technical analysis: ADX(40) strong trending market | MACD DIF breaks above zero, trend turns bullish | EMA5 crosses above EMA8, short-term trend turns bullish | KDJ golden cross, short-term bullish (K: 60.5, D: 48.9) | Volume surge (4.8x)
Price change: 16.4100%
📈 $USELESS | 4-hour bullish signal
━━━━━━━━━━━━━━━━━━
Technical analysis: ADX(28) trend is forming, opportunity to participate | MACD DIF breaks above zero, trend turns bullish | EMA5 crosses above EMA8, short-term trend turns bullish | Volume increases (1.9x)
Price change: 2.1800%
📈 $QCOM | 4-hour bullish signal
━━━━━━━━━━━━━━━━━━
Technical analysis: ADX(41) strong trending market | MACD golden cross above zero, bullish momentum released | EMA5 crosses above EMA8, short-term trend turns bullish | KDJ golden cross, short-term bullish (K: 59.4, D: 48.1) | Volume surge (4.3x)
Price change: 7.2200%
━━━━━━━━━━━━━━━━━━
#技术分析 #MUU #USELESS #QCOM
📌 The above content is for reference only and does not constitute investment advice
3
·
--
$MUU / $USELESS / $QCOM 4-hour technicals are strengthening in sync—which has more explosive potential? 🔥
════════════════════
🔴 $MUU 4-hour bullish signals
⚠️Technical analysis: ADX(40): clear trending market | MACD DIF breaks above zero, trend turns bullish | EMA5 crosses above EMA8, short-term trend turns bullish | KDJ golden cross, short-term bullish (K=60.5, D=48.9) | Volume surge (4.8x)
════════════════════
🔴 $USELESS 4-hour bullish signals
⚠️Technical analysis: ADX(28): trend is forming; opportunity to participate | MACD DIF breaks above zero, trend turns bullish | EMA5 crosses above EMA8, short-term trend turns bullish | Volume increases (1.9x)
════════════════════
🔴 $QCOM 4-hour bullish signals
⚠️Technical analysis: ADX(41): clear trending market | MACD golden cross above zero, bullish momentum is being released | EMA5 crosses above EMA8, short-term trend turns bullish | KDJ golden cross, short-term bullish (K=59.4, D=48.1) | Volume surge (4.3x)
════════════════════
🔔 Follow for first-hand market updates 🔔
#技术分析 #MUU #USELESS #QCOM
📌 When trading, pay attention to whether the candlestick pattern confirms the setup
$MUU / $USELESS / $QCOM 4-hour technicals are strengthening in sync—which has more explosive potential? 🔥
════════════════════
🔴 $MUU 4-hour bullish signals
⚠️Technical analysis: ADX(40): clear trending market | MACD DIF breaks above zero, trend turns bullish | EMA5 crosses above EMA8, short-term trend turns bullish | KDJ golden cross, short-term bullish (K=60.5, D=48.9) | Volume surge (4.8x)
════════════════════
🔴 $USELESS 4-hour bullish signals
⚠️Technical analysis: ADX(28): trend is forming; opportunity to participate | MACD DIF breaks above zero, trend turns bullish | EMA5 crosses above EMA8, short-term trend turns bullish | Volume increases (1.9x)
════════════════════
🔴 $QCOM 4-hour bullish signals
⚠️Technical analysis: ADX(41): clear trending market | MACD golden cross above zero, bullish momentum is being released | EMA5 crosses above EMA8, short-term trend turns bullish | KDJ golden cross, short-term bullish (K=59.4, D=48.1) | Volume surge (4.3x)
════════════════════
🔔 Follow for first-hand market updates 🔔
#技术分析 #MUU #USELESS #QCOM
📌 When trading, pay attention to whether the candlestick pattern confirms the setup
════════════════════
🔴 $MUU 4-hour bullish signals
⚠️Technical analysis: ADX(40): clear trending market | MACD DIF breaks above zero, trend turns bullish | EMA5 crosses above EMA8, short-term trend turns bullish | KDJ golden cross, short-term bullish (K=60.5, D=48.9) | Volume surge (4.8x)
════════════════════
🔴 $USELESS 4-hour bullish signals
⚠️Technical analysis: ADX(28): trend is forming; opportunity to participate | MACD DIF breaks above zero, trend turns bullish | EMA5 crosses above EMA8, short-term trend turns bullish | Volume increases (1.9x)
════════════════════
🔴 $QCOM 4-hour bullish signals
⚠️Technical analysis: ADX(41): clear trending market | MACD golden cross above zero, bullish momentum is being released | EMA5 crosses above EMA8, short-term trend turns bullish | KDJ golden cross, short-term bullish (K=59.4, D=48.1) | Volume surge (4.3x)
════════════════════
🔔 Follow for first-hand market updates 🔔
#技术分析 #MUU #USELESS #QCOM
📌 When trading, pay attention to whether the candlestick pattern confirms the setup
4

·
--
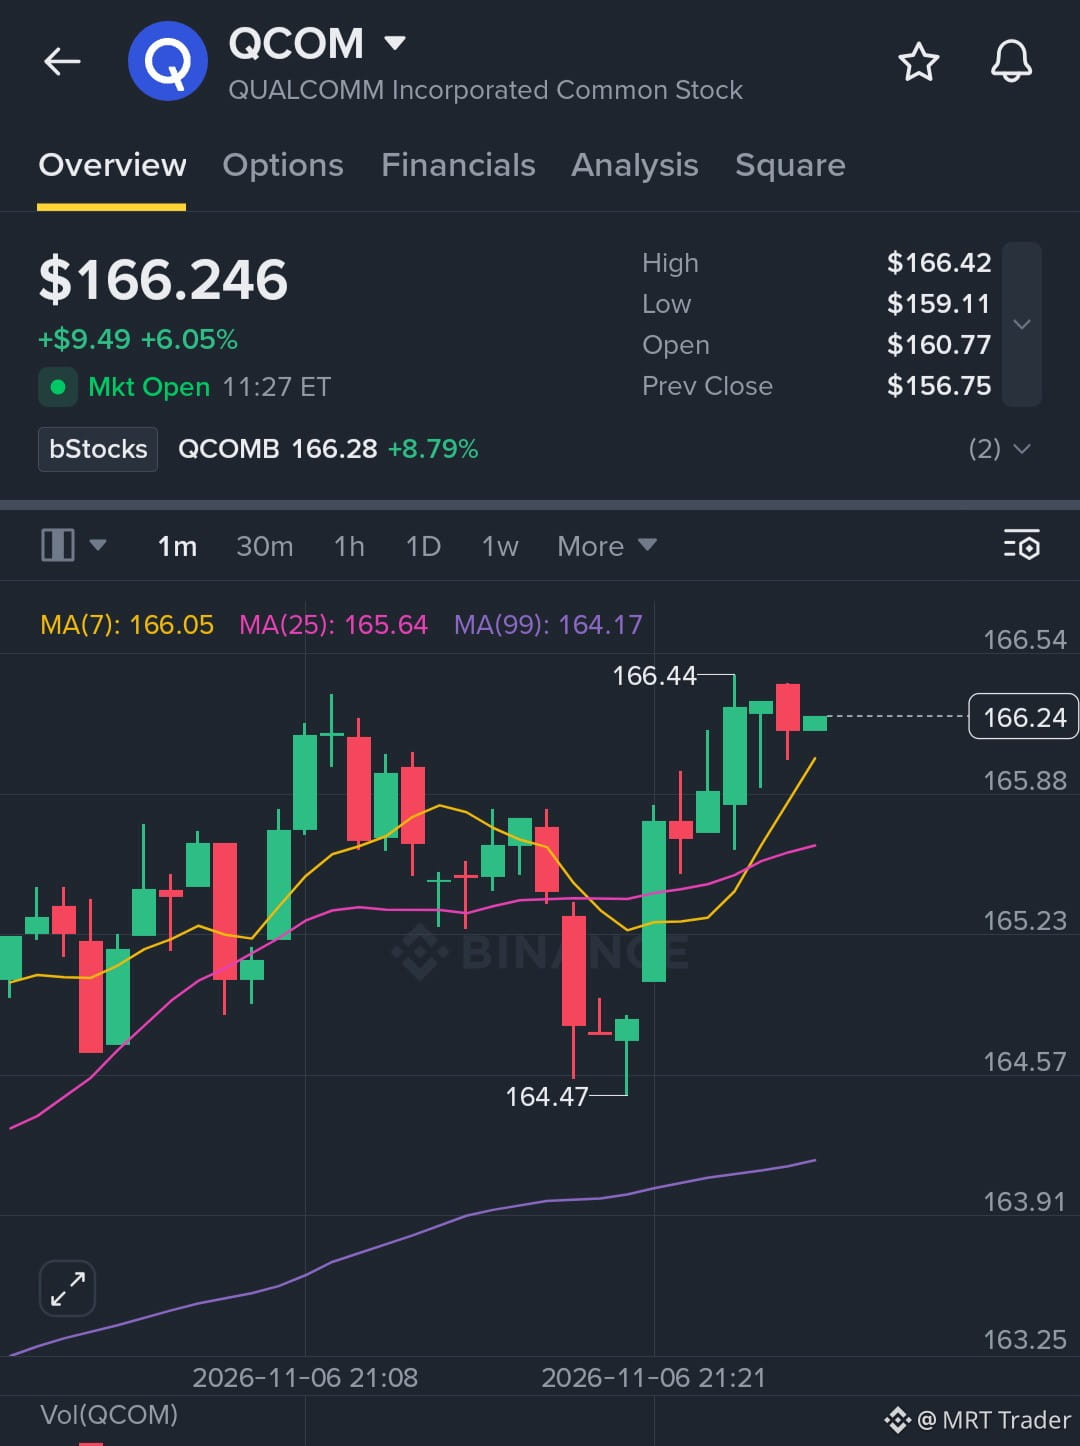
$QCOM bounced from $149.56, but I'm waiting to short the bounce. 📉
I want to see it retest $164 and get rejected. If that level acts as heavy resistance, the next leg down is on.
Key Level:
🔴 Bearish below: 164.00
Trade Setup (Short):
🔴 Entry Zone: 163.80 – 164.50 (on confirmed rejection)
🎯 Targets: 161.50 / 159.00 / 156.00
⛔ Stop Loss: 166.50
Wait for the rejection confirmation before entering, and keep your risk tight! 🎯
Click here to trade now 👉 $QCOM
{future}(QCOMUSDT)
#QCOM #USMidtermsCouldShakeUpUS-IranTies
$QCOM bounced from $149.56, but I'm waiting to short the bounce. 📉
I want to see it retest $164 and get rejected. If that level acts as heavy resistance, the next leg down is on.
Key Level:
🔴 Bearish below: 164.00
Trade Setup (Short):
🔴 Entry Zone: 163.80 – 164.50 (on confirmed rejection)
🎯 Targets: 161.50 / 159.00 / 156.00
⛔ Stop Loss: 166.50
Wait for the rejection confirmation before entering, and keep your risk tight! 🎯
Click here to trade now 👉 $QCOM
#QCOM #USMidtermsCouldShakeUpUS-IranTies
I want to see it retest $164 and get rejected. If that level acts as heavy resistance, the next leg down is on.
Key Level:
🔴 Bearish below: 164.00
Trade Setup (Short):
🔴 Entry Zone: 163.80 – 164.50 (on confirmed rejection)
🎯 Targets: 161.50 / 159.00 / 156.00
⛔ Stop Loss: 166.50
Wait for the rejection confirmation before entering, and keep your risk tight! 🎯
Click here to trade now 👉 $QCOM
#QCOM #USMidtermsCouldShakeUpUS-IranTies
2
55
·
--
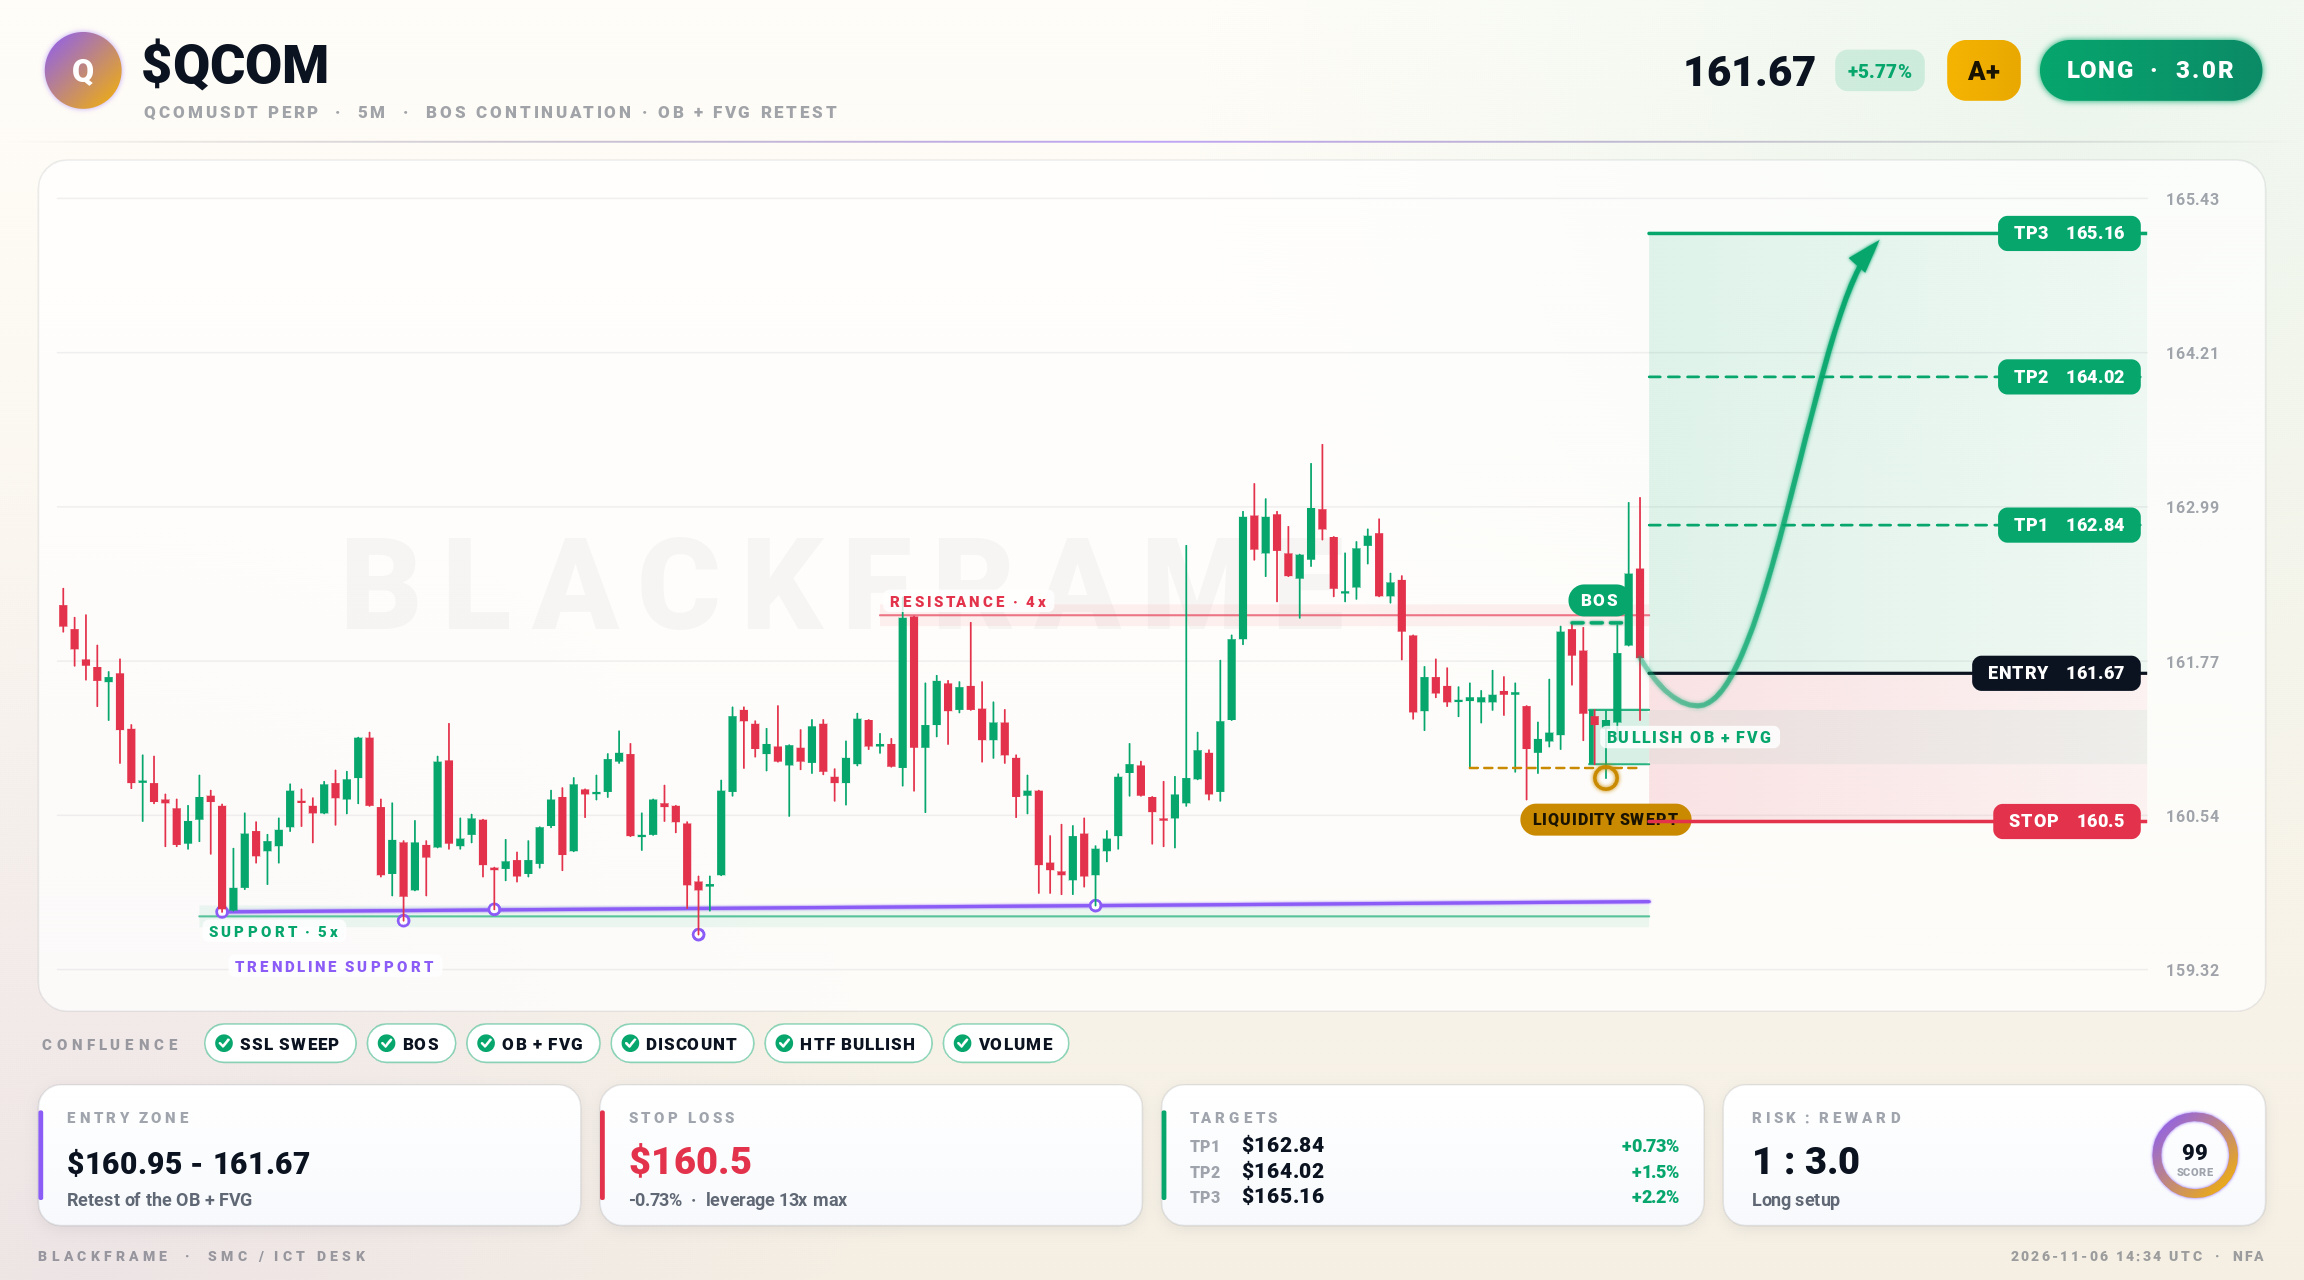
🚀 $QCOM spikes into discount zone, bullish thrust
LONG · 5M
Entry: $161.38 - $161.67
TP1: $162.84
TP2: $164.02
TP3: $165.16
SL: $160.5
Sell-side liquidity swept and BOS confirms the 5M trend. OB and FVG are stacked at $160.95-161.38 offering a clean entry at $161.67. Target is $165.16 with stop at $160.5; invalidate if price breaks below the order block.
#QCOM #ICT · NFA
🚀 $QCOM spikes into discount zone, bullish thrust
LONG · 5M
Entry: $161.38 - $161.67
TP1: $162.84
TP2: $164.02
TP3: $165.16
SL: $160.5
Sell-side liquidity swept and BOS confirms the 5M trend. OB and FVG are stacked at $160.95-161.38 offering a clean entry at $161.67. Target is $165.16 with stop at $160.5; invalidate if price breaks below the order block.
#QCOM #ICT · NFA
LONG · 5M
Entry: $161.38 - $161.67
TP1: $162.84
TP2: $164.02
TP3: $165.16
SL: $160.5
Sell-side liquidity swept and BOS confirms the 5M trend. OB and FVG are stacked at $160.95-161.38 offering a clean entry at $161.67. Target is $165.16 with stop at $160.5; invalidate if price breaks below the order block.
#QCOM #ICT · NFA
51
·
--
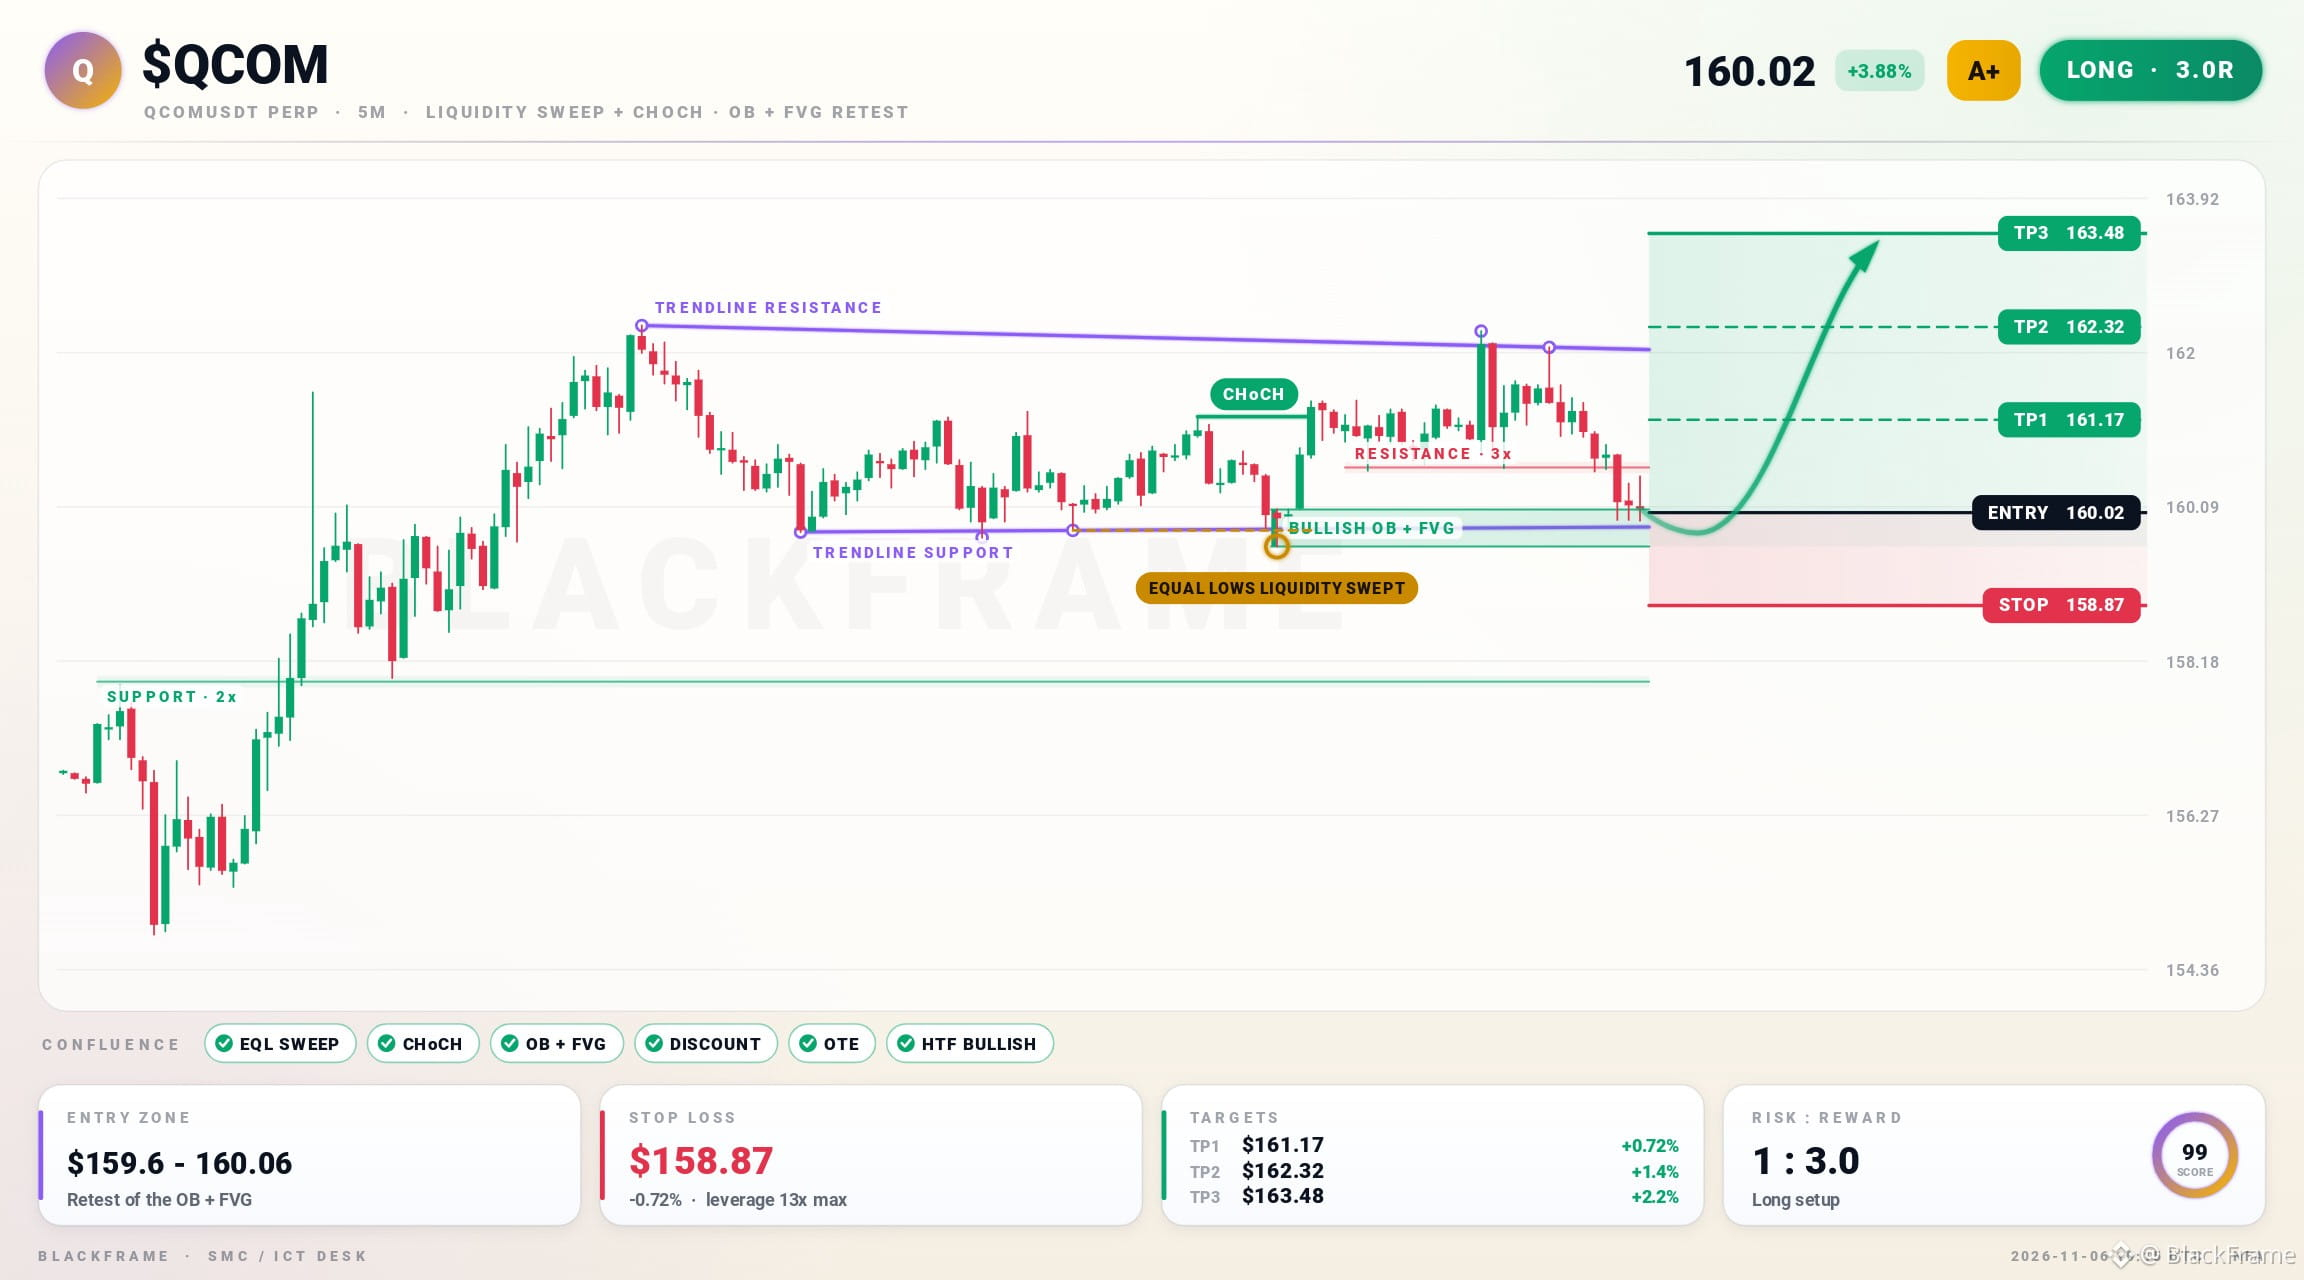
🎯 $QCOM swept the lows and flipped bullish
LONG · 5M
Entry: $160.02 - $160.06
TP1: $161.17
TP2: $162.32
TP3: $163.48
SL: $158.87
Sell-side liquidity below the equal lows was swept and price closed back inside. Structure then flipped bullish with a CHoCH on the 5M. Entry is the first retest of the fresh bullish order block and FVG in discount, targeting buy-side liquidity above.
#QCOM #PriceAction · NFA
🎯 $QCOM swept the lows and flipped bullish
LONG · 5M
Entry: $160.02 - $160.06
TP1: $161.17
TP2: $162.32
TP3: $163.48
SL: $158.87
Sell-side liquidity below the equal lows was swept and price closed back inside. Structure then flipped bullish with a CHoCH on the 5M. Entry is the first retest of the fresh bullish order block and FVG in discount, targeting buy-side liquidity above.
#QCOM #PriceAction · NFA
LONG · 5M
Entry: $160.02 - $160.06
TP1: $161.17
TP2: $162.32
TP3: $163.48
SL: $158.87
Sell-side liquidity below the equal lows was swept and price closed back inside. Structure then flipped bullish with a CHoCH on the 5M. Entry is the first retest of the fresh bullish order block and FVG in discount, targeting buy-side liquidity above.
#QCOM #PriceAction · NFA
62

·
--
🚨 $QCOM HEADWINDS MOUNT AS FORWARD REVENUE PROJECTIONS SLIP INTO NEGATIVE TERRITORY! 📉
Smart money is pumping the brakes on $QCOM as forward revenue drops into a 2.8% contraction over the next 12 months. 📊 Smartphone demand fatigue is weighing heavily on order flow, offsetting the historical 8.6% top-line expansion momentum.
Institutional eyes are strictly focused on whether automotive, IoT, and on-device AI catalysts can build a valid support floor. 💡 Until those emerging sectors absorb the smartphone drop-off, upside expansion remains capped beneath heavy supply. 🔍
💬 Is $QCOM offering a deep value discount here, or are you waiting for a confirmed demand reclaim before bidding? 👇
⚠️ Not financial advice. Always manage your risk. 🛡️
🏷️ #QCOM #Semiconductors #Stocks #MarketAnalysis #Investing
🛑 📉
🚨 $QCOM HEADWINDS MOUNT AS FORWARD REVENUE PROJECTIONS SLIP INTO NEGATIVE TERRITORY! 📉
Smart money is pumping the brakes on $QCOM as forward revenue drops into a 2.8% contraction over the next 12 months. 📊 Smartphone demand fatigue is weighing heavily on order flow, offsetting the historical 8.6% top-line expansion momentum.
Institutional eyes are strictly focused on whether automotive, IoT, and on-device AI catalysts can build a valid support floor. 💡 Until those emerging sectors absorb the smartphone drop-off, upside expansion remains capped beneath heavy supply. 🔍
💬 Is $QCOM offering a deep value discount here, or are you waiting for a confirmed demand reclaim before bidding? 👇
⚠️ Not financial advice. Always manage your risk. 🛡️
🏷️ #QCOM #Semiconductors #Stocks #MarketAnalysis #Investing
🛑 📉
Smart money is pumping the brakes on $QCOM as forward revenue drops into a 2.8% contraction over the next 12 months. 📊 Smartphone demand fatigue is weighing heavily on order flow, offsetting the historical 8.6% top-line expansion momentum.
Institutional eyes are strictly focused on whether automotive, IoT, and on-device AI catalysts can build a valid support floor. 💡 Until those emerging sectors absorb the smartphone drop-off, upside expansion remains capped beneath heavy supply. 🔍
💬 Is $QCOM offering a deep value discount here, or are you waiting for a confirmed demand reclaim before bidding? 👇
⚠️ Not financial advice. Always manage your risk. 🛡️
🏷️ #QCOM #Semiconductors #Stocks #MarketAnalysis #Investing
🛑 📉
24
·
--
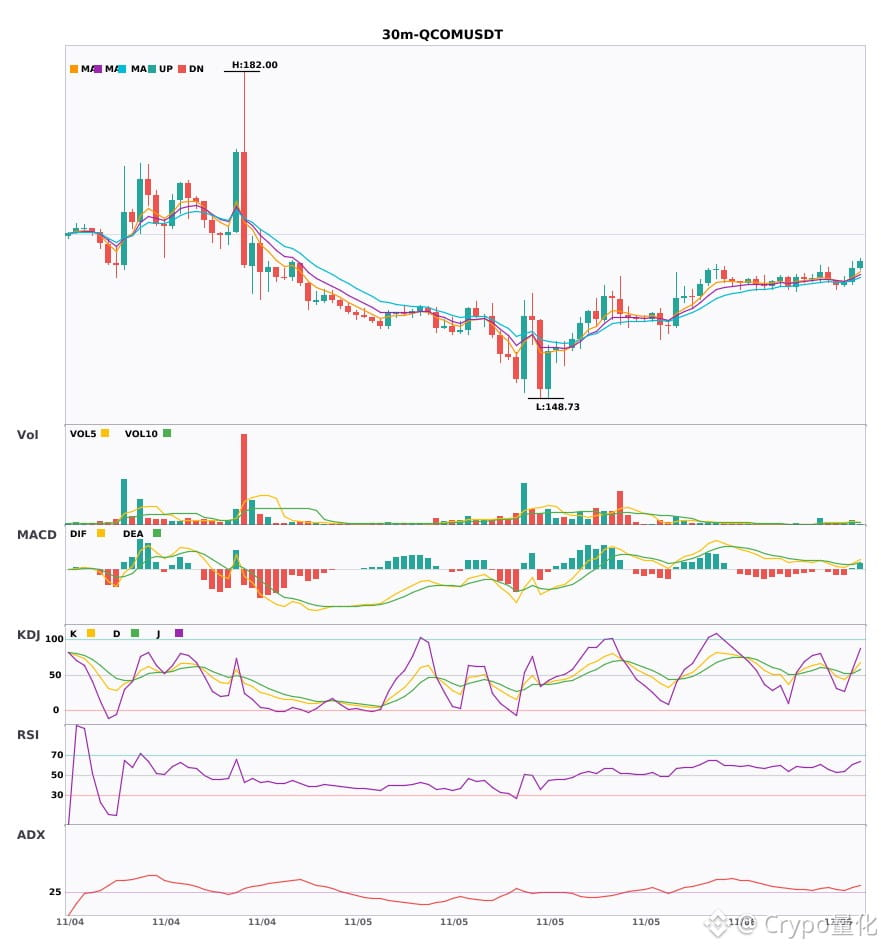
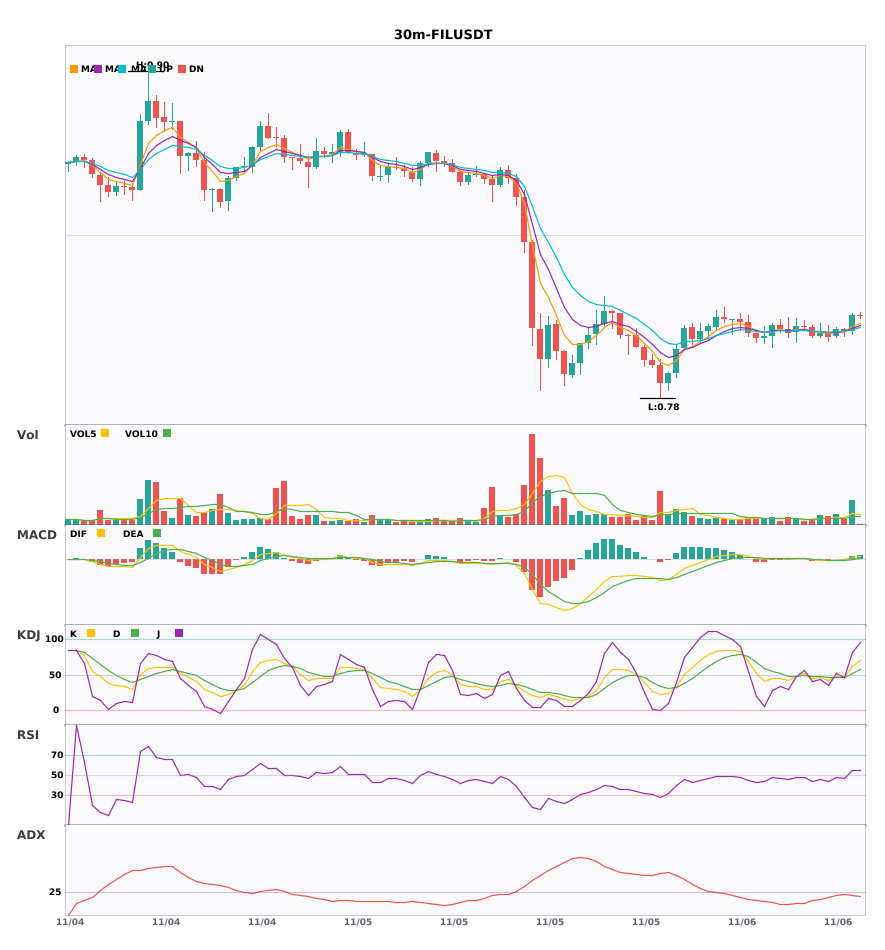
$QCOM / $FIL 30-minute timeframe bullish, short-term confluence opportunity 🔥
════════════════════
🔴 $QCOM 30-minute bullish signal
⚠️ Technicals: ADX(30) trend is forming; opportunity to participate | MACD golden cross above zero, bullish momentum emerging | EMA5 crosses above EMA8, short-term outlook turns bullish | KDJ golden cross, short-term bullish (K: 54.1, D: 52.4) | Volume increases (2.3x)
════════════════════
🔴 $FIL 30-minute bullish signal
⚠️ Technicals: ADX(25) trend is forming; opportunity to participate | MACD DIF breaks above the zero line, trend turns bullish | EMA5 crosses above EMA8, short-term outlook turns bullish | KDJ showing strong momentum, bulls in control (K: 61.8, D: 51.8) | Volume surges (2.9x)
📢 Market update: Binance Will Support the Filecoin (FIL) Network Upgrade & Hard Fork - 2026-10-19
════════════════════
🔔 Follow for first-hand market movements 🔔
#技术分析 #QCOM #FIL
📌 When trading, pay attention to whether the candlestick pattern confirms the signal
$QCOM / $FIL 30-minute timeframe bullish, short-term confluence opportunity 🔥
════════════════════
🔴 $QCOM 30-minute bullish signal
⚠️ Technicals: ADX(30) trend is forming; opportunity to participate | MACD golden cross above zero, bullish momentum emerging | EMA5 crosses above EMA8, short-term outlook turns bullish | KDJ golden cross, short-term bullish (K: 54.1, D: 52.4) | Volume increases (2.3x)
════════════════════
🔴 $FIL 30-minute bullish signal
⚠️ Technicals: ADX(25) trend is forming; opportunity to participate | MACD DIF breaks above the zero line, trend turns bullish | EMA5 crosses above EMA8, short-term outlook turns bullish | KDJ showing strong momentum, bulls in control (K: 61.8, D: 51.8) | Volume surges (2.9x)
📢 Market update: Binance Will Support the Filecoin (FIL) Network Upgrade & Hard Fork - 2026-10-19
════════════════════
🔔 Follow for first-hand market movements 🔔
#技术分析 #QCOM #FIL
📌 When trading, pay attention to whether the candlestick pattern confirms the signal
════════════════════
🔴 $QCOM 30-minute bullish signal
⚠️ Technicals: ADX(30) trend is forming; opportunity to participate | MACD golden cross above zero, bullish momentum emerging | EMA5 crosses above EMA8, short-term outlook turns bullish | KDJ golden cross, short-term bullish (K: 54.1, D: 52.4) | Volume increases (2.3x)
════════════════════
🔴 $FIL 30-minute bullish signal
⚠️ Technicals: ADX(25) trend is forming; opportunity to participate | MACD DIF breaks above the zero line, trend turns bullish | EMA5 crosses above EMA8, short-term outlook turns bullish | KDJ showing strong momentum, bulls in control (K: 61.8, D: 51.8) | Volume surges (2.9x)
📢 Market update: Binance Will Support the Filecoin (FIL) Network Upgrade & Hard Fork - 2026-10-19
════════════════════
🔔 Follow for first-hand market movements 🔔
#技术分析 #QCOM #FIL
📌 When trading, pay attention to whether the candlestick pattern confirms the signal
25
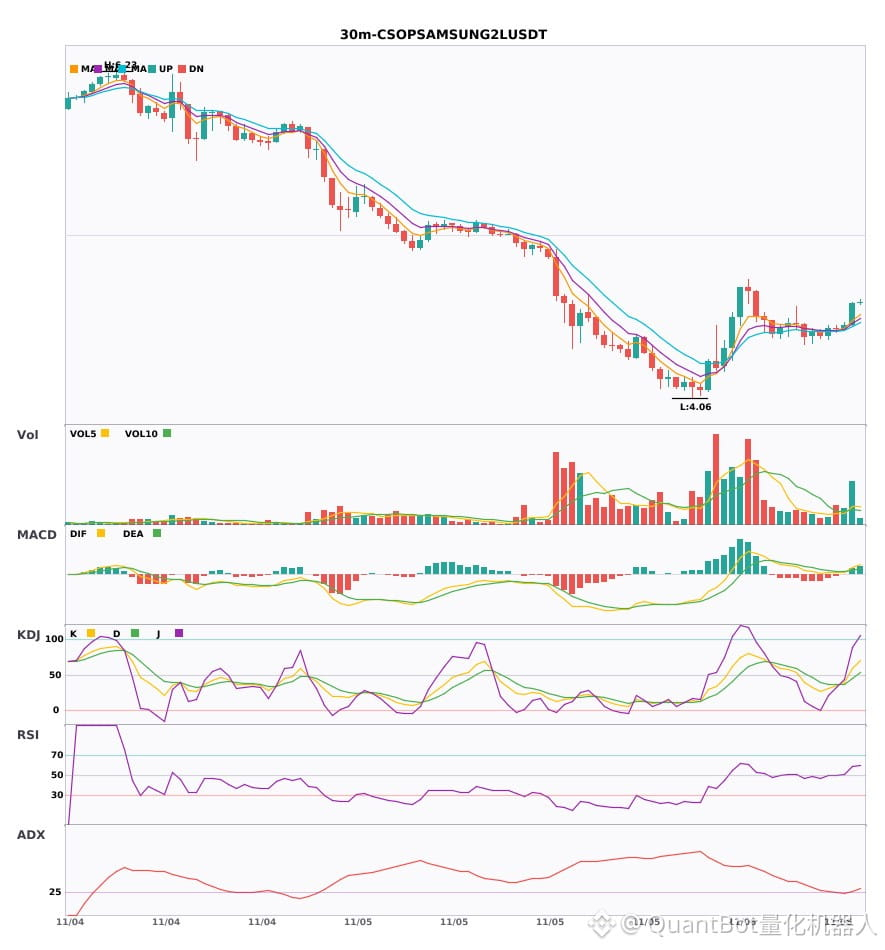
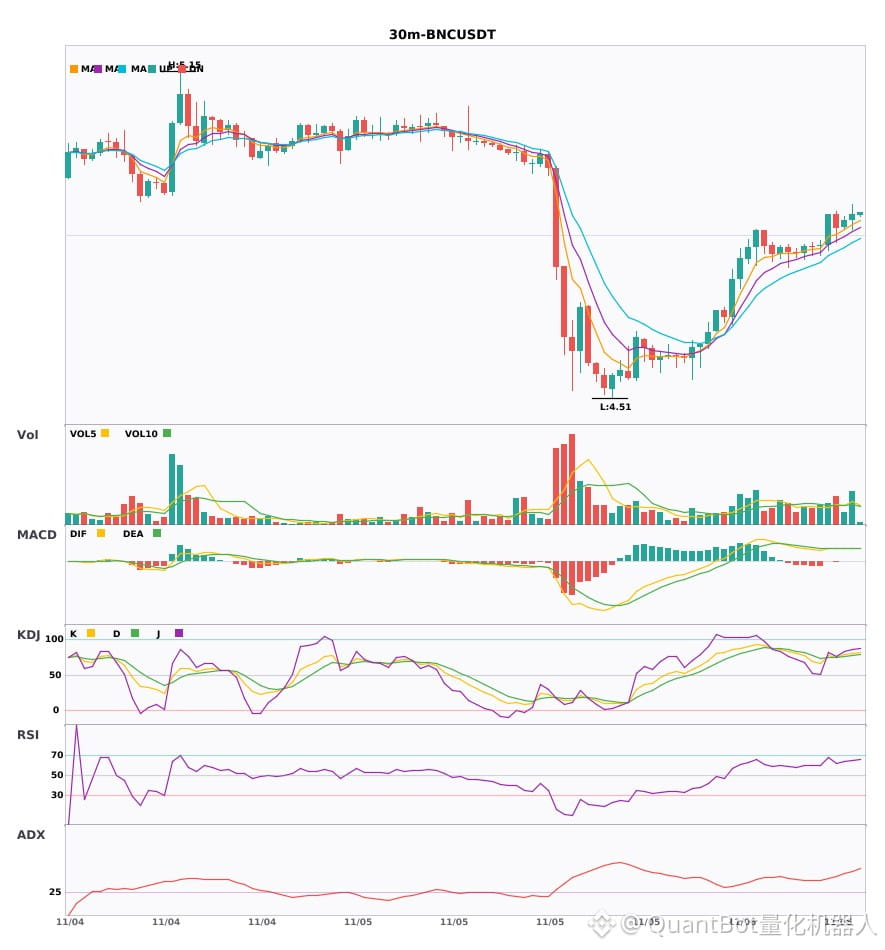
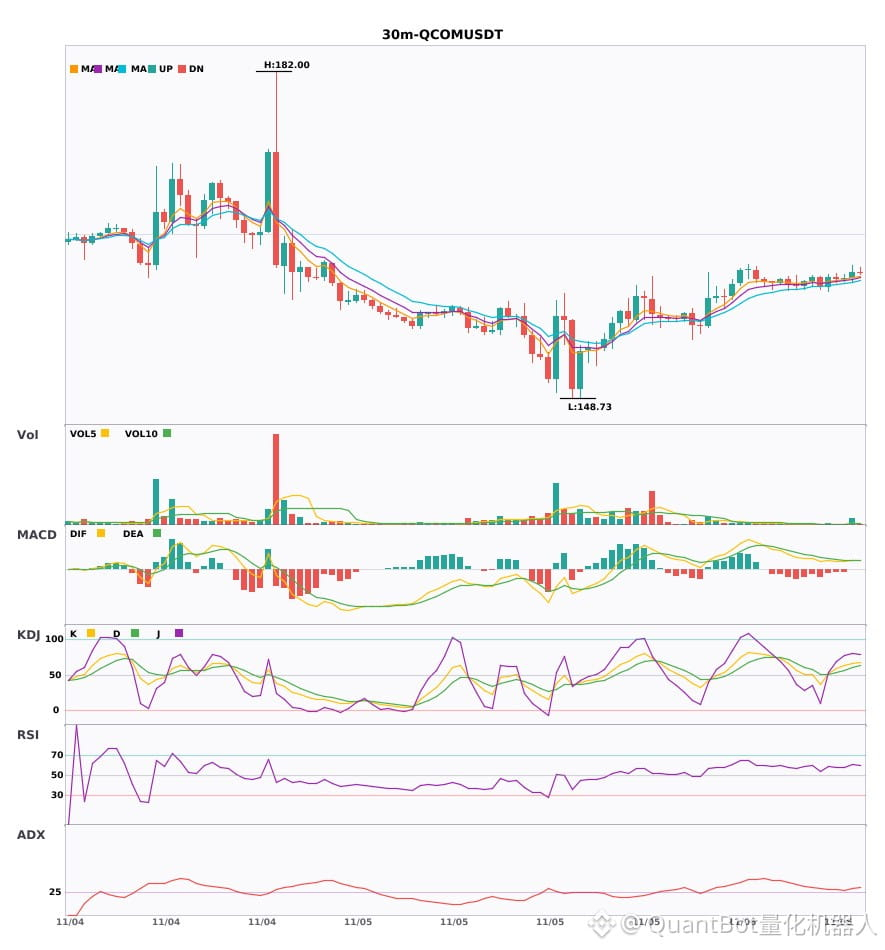
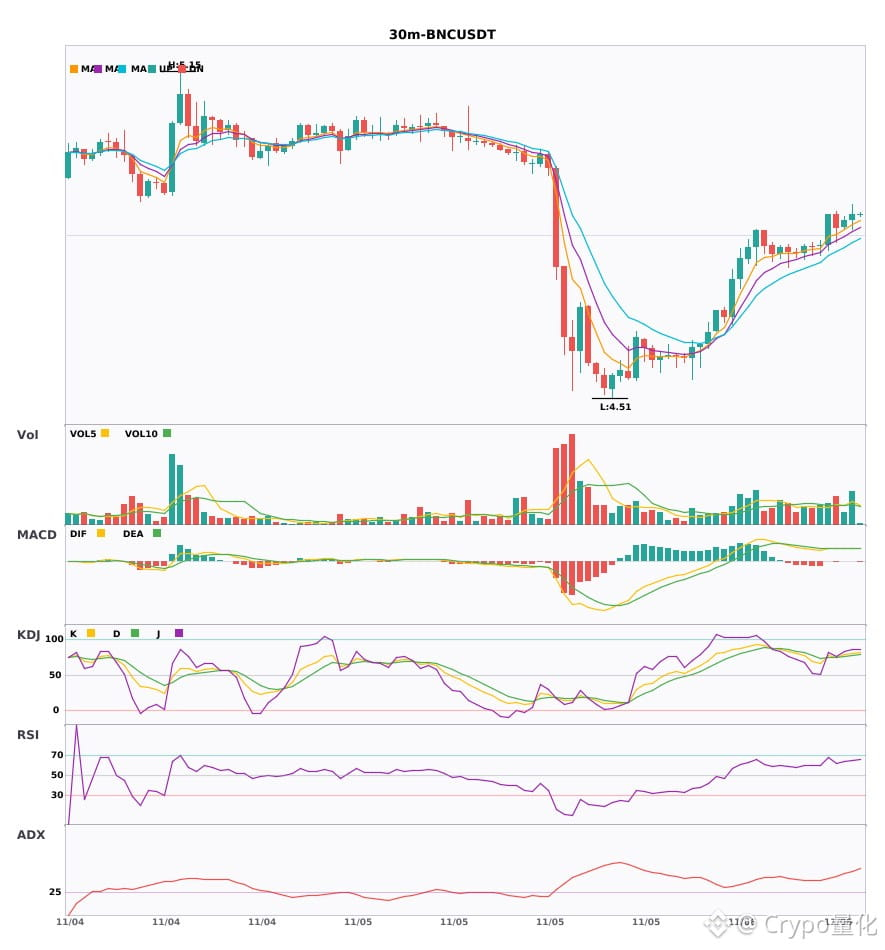
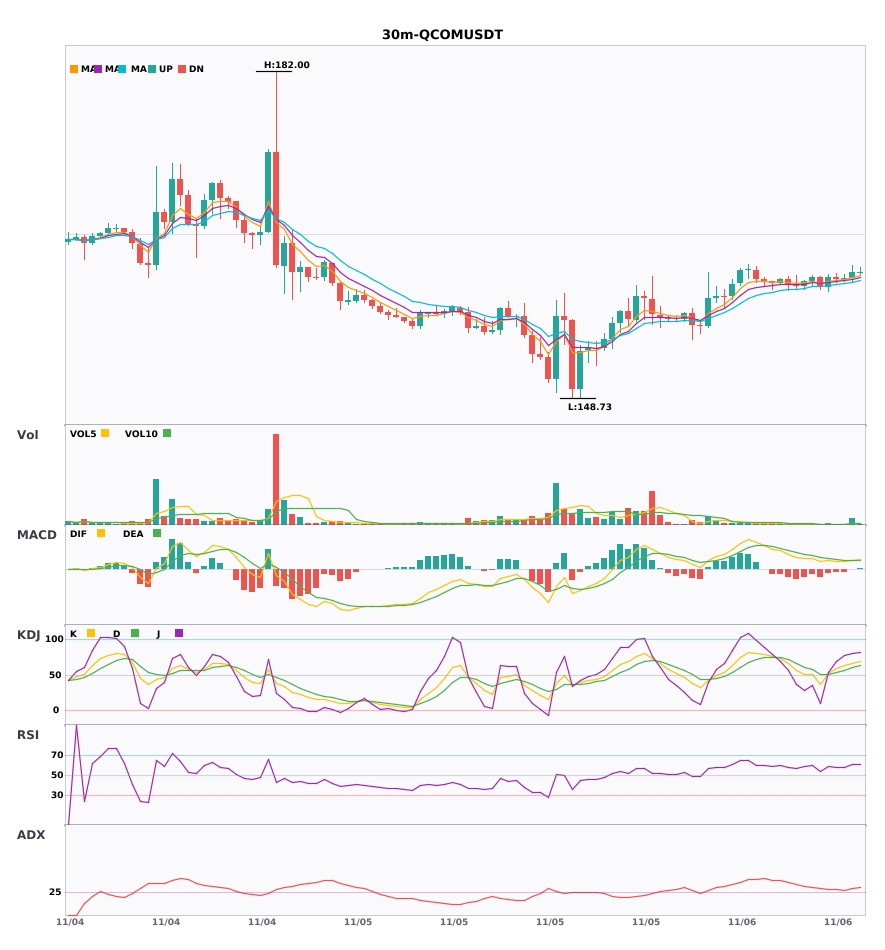
$CSOPSAMSUNG2L / $BNC / $QCOM 30-minute technicals are strengthening in sync—which has greater breakout potential?
📈 $CSOPSAMSUNG2L | 30-minute Bullish Signal
━━━━━━━━━━━━━━━━━━
Technical Analysis: ADX(26) Trend is forming; participation is possible | MACD bullish crossover above zero, bullish momentum is being released | EMA5 > EMA8 > EMA13, bullish alignment | Volume surge (2.8x)
Price Change: 3.3000%
📈 $BNC | 30-minute Bullish Signal
━━━━━━━━━━━━━━━━━━
Technical Analysis: ADX(53) Very strong trend (watch out for an overheated pullback) | MACD bullish crossover above zero, bullish momentum is being released | EMA5 > EMA8 > EMA13, bullish alignment | KDJ is running strong, with bulls in control (K: 80.2, D: 77.4) | Volume increase (1.6x)
Price Change: 0.2300%
📈 $QCOM | 30-minute Bullish Signal
━━━━━━━━━━━━━━━━━━
Technical Analysis: ADX(28) Trend is forming; participation is possible | MACD bullish crossover above zero, bullish momentum is being released | EMA5 > EMA8 > EMA13, bullish alignment | KDJ is running strong, with bulls in control (K: 66.8, D: 60.2) | Volume surge (4.8x)
Price Change: 0.3900%
━━━━━━━━━━━━━━━━━━
#技术分析 #CSOPSAMSUNG2L #BNC #QCOM
📌 The above is for reference only and does not constitute investment advice
$CSOPSAMSUNG2L / $BNC / $QCOM 30-minute technicals are strengthening in sync—which has greater breakout potential?
📈 $CSOPSAMSUNG2L | 30-minute Bullish Signal
━━━━━━━━━━━━━━━━━━
Technical Analysis: ADX(26) Trend is forming; participation is possible | MACD bullish crossover above zero, bullish momentum is being released | EMA5 > EMA8 > EMA13, bullish alignment | Volume surge (2.8x)
Price Change: 3.3000%
📈 $BNC | 30-minute Bullish Signal
━━━━━━━━━━━━━━━━━━
Technical Analysis: ADX(53) Very strong trend (watch out for an overheated pullback) | MACD bullish crossover above zero, bullish momentum is being released | EMA5 > EMA8 > EMA13, bullish alignment | KDJ is running strong, with bulls in control (K: 80.2, D: 77.4) | Volume increase (1.6x)
Price Change: 0.2300%
📈 $QCOM | 30-minute Bullish Signal
━━━━━━━━━━━━━━━━━━
Technical Analysis: ADX(28) Trend is forming; participation is possible | MACD bullish crossover above zero, bullish momentum is being released | EMA5 > EMA8 > EMA13, bullish alignment | KDJ is running strong, with bulls in control (K: 66.8, D: 60.2) | Volume surge (4.8x)
Price Change: 0.3900%
━━━━━━━━━━━━━━━━━━
#技术分析 #CSOPSAMSUNG2L #BNC #QCOM
📌 The above is for reference only and does not constitute investment advice
📈 $CSOPSAMSUNG2L | 30-minute Bullish Signal
━━━━━━━━━━━━━━━━━━
Technical Analysis: ADX(26) Trend is forming; participation is possible | MACD bullish crossover above zero, bullish momentum is being released | EMA5 > EMA8 > EMA13, bullish alignment | Volume surge (2.8x)
Price Change: 3.3000%
📈 $BNC | 30-minute Bullish Signal
━━━━━━━━━━━━━━━━━━
Technical Analysis: ADX(53) Very strong trend (watch out for an overheated pullback) | MACD bullish crossover above zero, bullish momentum is being released | EMA5 > EMA8 > EMA13, bullish alignment | KDJ is running strong, with bulls in control (K: 80.2, D: 77.4) | Volume increase (1.6x)
Price Change: 0.2300%
📈 $QCOM | 30-minute Bullish Signal
━━━━━━━━━━━━━━━━━━
Technical Analysis: ADX(28) Trend is forming; participation is possible | MACD bullish crossover above zero, bullish momentum is being released | EMA5 > EMA8 > EMA13, bullish alignment | KDJ is running strong, with bulls in control (K: 66.8, D: 60.2) | Volume surge (4.8x)
Price Change: 0.3900%
━━━━━━━━━━━━━━━━━━
#技术分析 #CSOPSAMSUNG2L #BNC #QCOM
📌 The above is for reference only and does not constitute investment advice
10
·
--
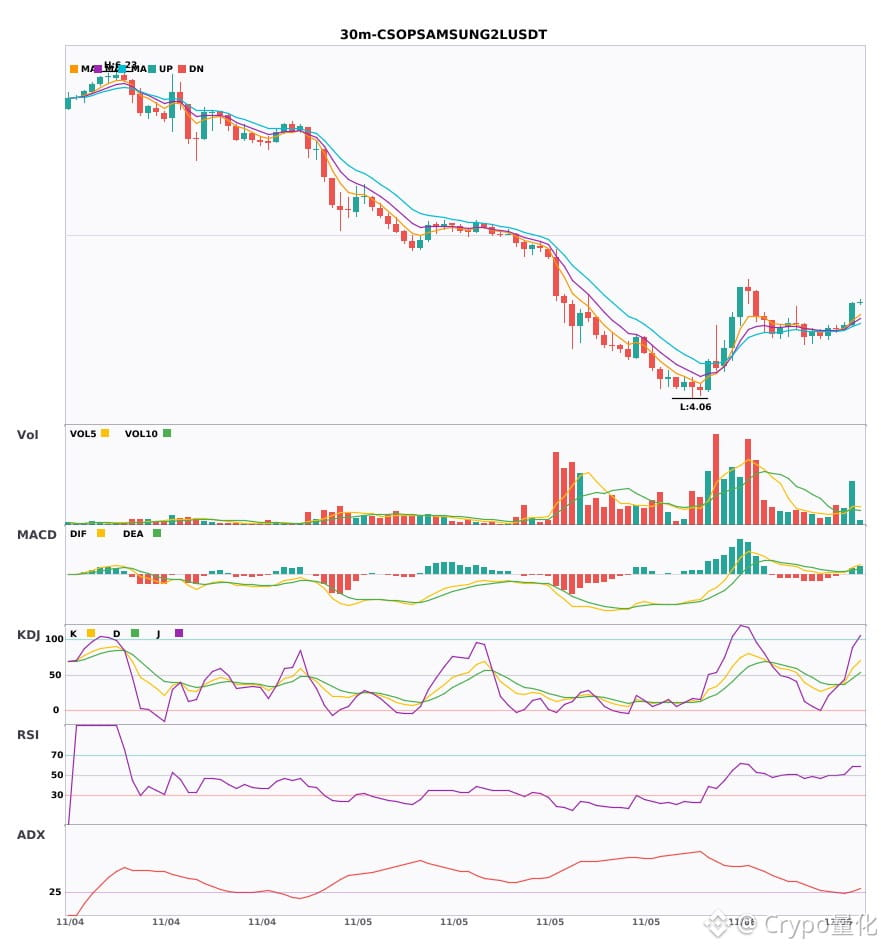
$CSOPSAMSUNG2L / $BNC / $QCOM 30-minute resonance turns bullish; bullish signals appear simultaneously 🔥
════════════════════
🔴 $CSOPSAMSUNG2L 30-minute bullish signal
⚠️Technical analysis: ADX(26) Trend is forming; opportunity to participate | MACD golden cross above zero, bullish momentum is being released | EMA5 > EMA8 > EMA13, bullish alignment | Volume surge (2.8x)
════════════════════
🔴 $BNC 30-minute bullish signal
⚠️Technical analysis: ADX(53) Very strong trend (watch out for an overbought pullback) | MACD golden cross above zero, bullish momentum is being released | EMA5 > EMA8 > EMA13, bullish alignment | KDJ showing strong momentum, bulls in control (K: 80.2, D: 77.4) | Increased volume (1.6x)
════════════════════
🔴 $QCOM 30-minute bullish signal
⚠️Technical analysis: ADX(28) Trend is forming; opportunity to participate | MACD golden cross above zero, bullish momentum is being released | EMA5 > EMA8 > EMA13, bullish alignment | KDJ showing strong momentum, bulls in control (K: 66.8, D: 60.2) | Volume surge (4.8x)
════════════════════
🔔 Follow for first-hand market alerts 🔔
#技术分析 #CSOPSAMSUNG2L #BNC #QCOM
📌 When trading, pay attention to whether the candlestick patterns align
$CSOPSAMSUNG2L / $BNC / $QCOM 30-minute resonance turns bullish; bullish signals appear simultaneously 🔥
════════════════════
🔴 $CSOPSAMSUNG2L 30-minute bullish signal
⚠️Technical analysis: ADX(26) Trend is forming; opportunity to participate | MACD golden cross above zero, bullish momentum is being released | EMA5 > EMA8 > EMA13, bullish alignment | Volume surge (2.8x)
════════════════════
🔴 $BNC 30-minute bullish signal
⚠️Technical analysis: ADX(53) Very strong trend (watch out for an overbought pullback) | MACD golden cross above zero, bullish momentum is being released | EMA5 > EMA8 > EMA13, bullish alignment | KDJ showing strong momentum, bulls in control (K: 80.2, D: 77.4) | Increased volume (1.6x)
════════════════════
🔴 $QCOM 30-minute bullish signal
⚠️Technical analysis: ADX(28) Trend is forming; opportunity to participate | MACD golden cross above zero, bullish momentum is being released | EMA5 > EMA8 > EMA13, bullish alignment | KDJ showing strong momentum, bulls in control (K: 66.8, D: 60.2) | Volume surge (4.8x)
════════════════════
🔔 Follow for first-hand market alerts 🔔
#技术分析 #CSOPSAMSUNG2L #BNC #QCOM
📌 When trading, pay attention to whether the candlestick patterns align
════════════════════
🔴 $CSOPSAMSUNG2L 30-minute bullish signal
⚠️Technical analysis: ADX(26) Trend is forming; opportunity to participate | MACD golden cross above zero, bullish momentum is being released | EMA5 > EMA8 > EMA13, bullish alignment | Volume surge (2.8x)
════════════════════
🔴 $BNC 30-minute bullish signal
⚠️Technical analysis: ADX(53) Very strong trend (watch out for an overbought pullback) | MACD golden cross above zero, bullish momentum is being released | EMA5 > EMA8 > EMA13, bullish alignment | KDJ showing strong momentum, bulls in control (K: 80.2, D: 77.4) | Increased volume (1.6x)
════════════════════
🔴 $QCOM 30-minute bullish signal
⚠️Technical analysis: ADX(28) Trend is forming; opportunity to participate | MACD golden cross above zero, bullish momentum is being released | EMA5 > EMA8 > EMA13, bullish alignment | KDJ showing strong momentum, bulls in control (K: 66.8, D: 60.2) | Volume surge (4.8x)
════════════════════
🔔 Follow for first-hand market alerts 🔔
#技术分析 #CSOPSAMSUNG2L #BNC #QCOM
📌 When trading, pay attention to whether the candlestick patterns align
14
·
--
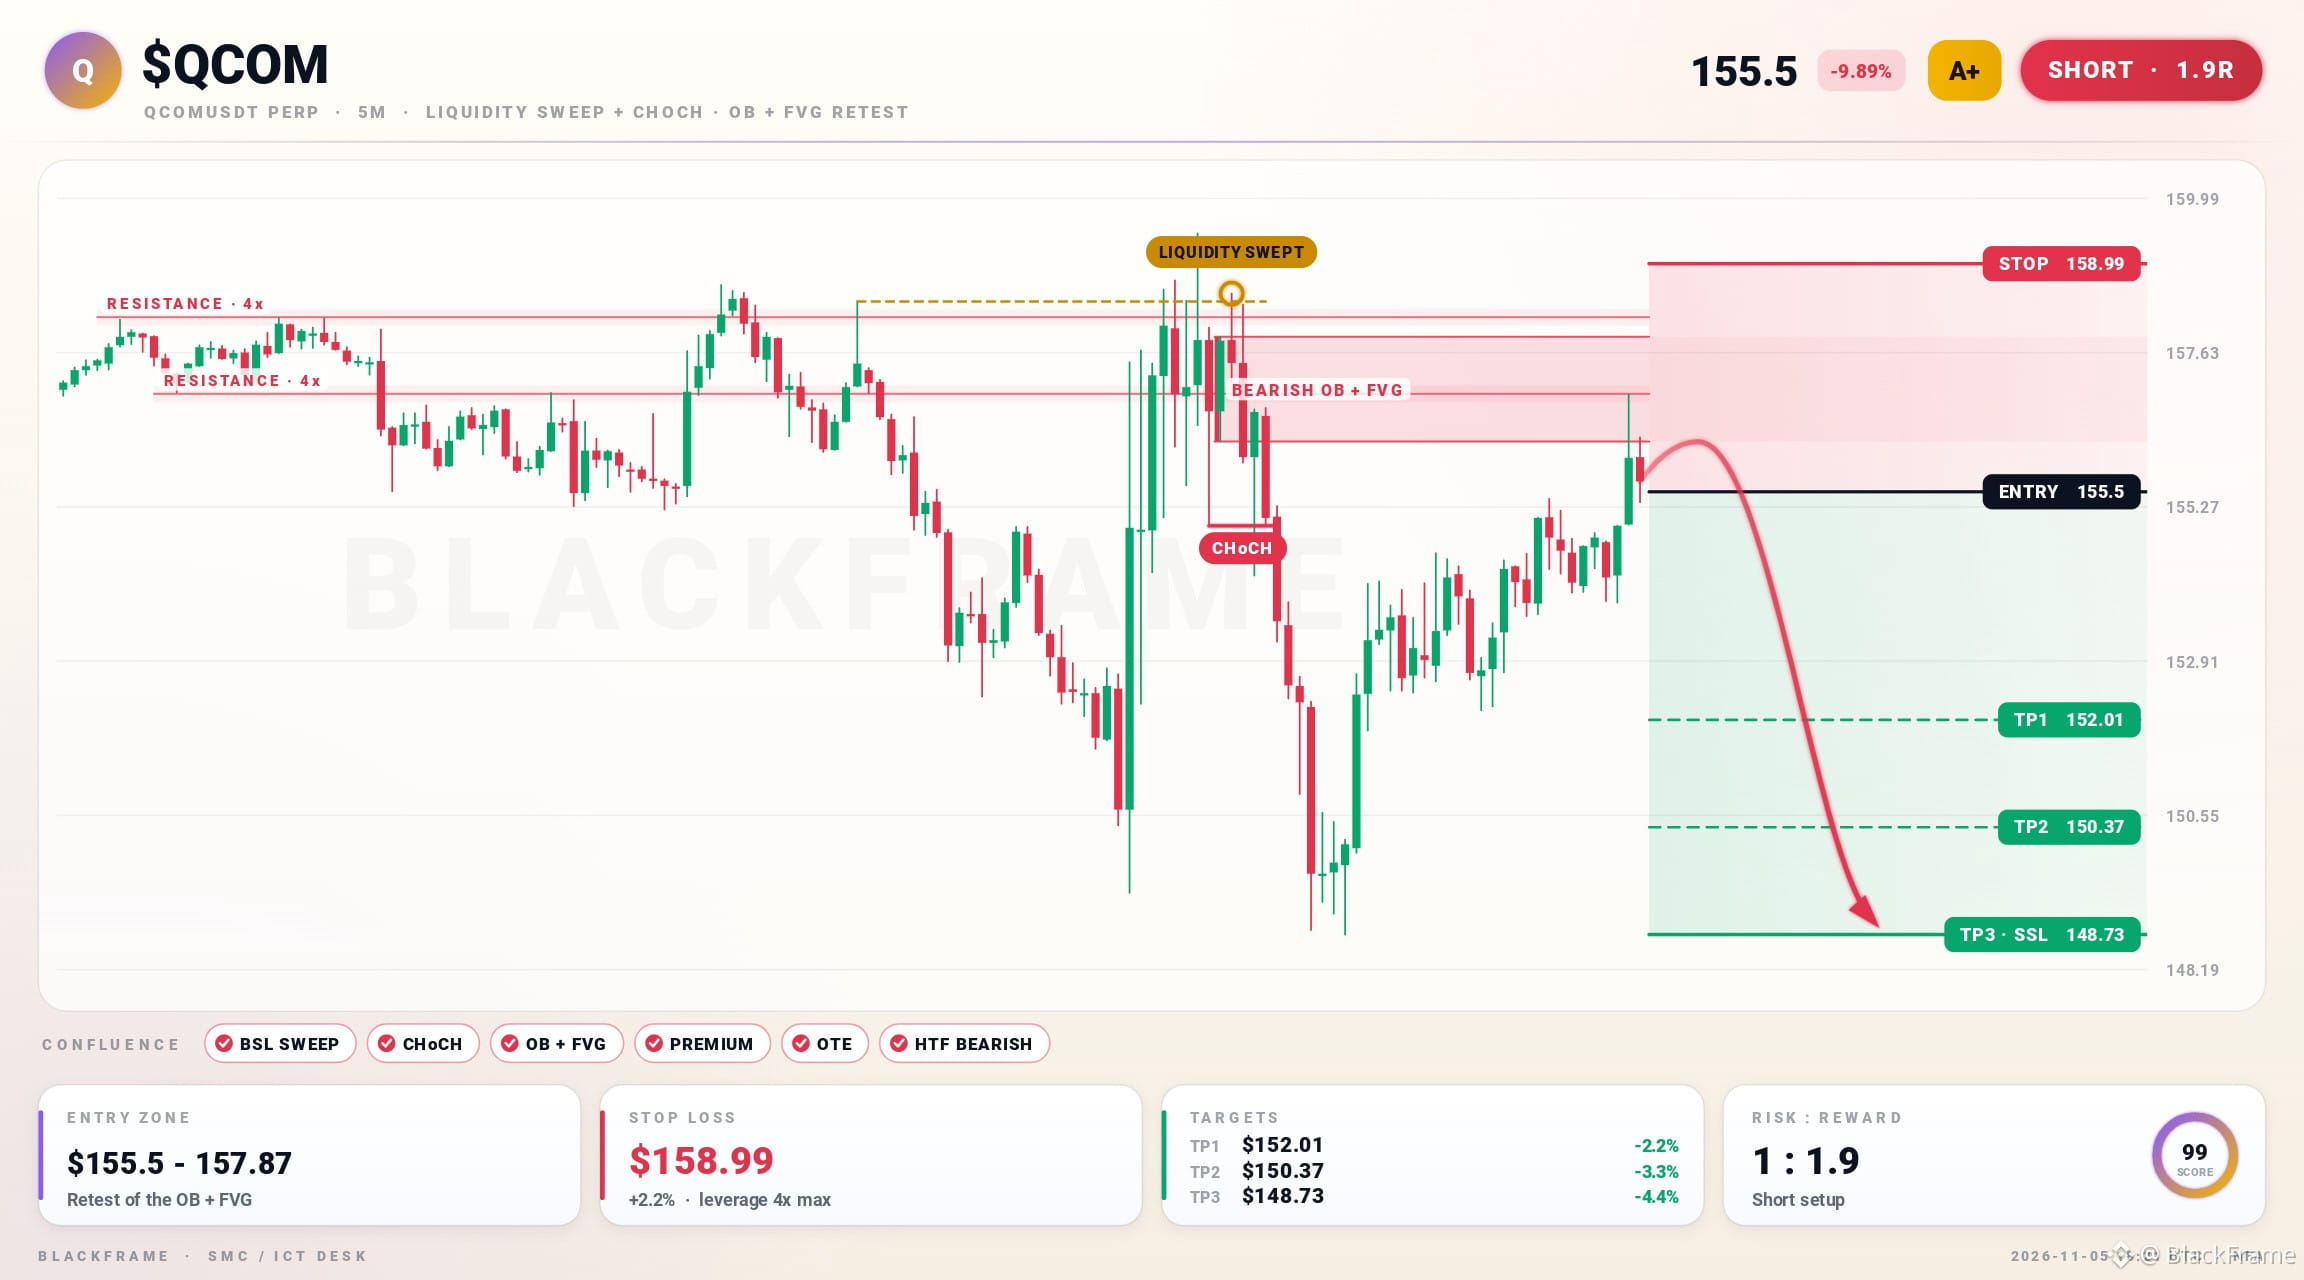
⚡ $QCOM: stop hunt above, CHoCH down
SHORT · 5M
Entry: $155.5 - $156.27
TP1: $152.01
TP2: $150.37
TP3: $148.73
SL: $158.99
Buy-side liquidity above the last swing high was swept and price closed back inside. Structure then flipped bearish with a CHoCH on the 5M. Entry is the first retest of the fresh bearish order block and FVG in premium, targeting sell-side liquidity below.
#QCOM #TradingSignals · NFA
⚡ $QCOM : stop hunt above, CHoCH down
SHORT · 5M
Entry: $155.5 - $156.27
TP1: $152.01
TP2: $150.37
TP3: $148.73
SL: $158.99
Buy-side liquidity above the last swing high was swept and price closed back inside. Structure then flipped bearish with a CHoCH on the 5M. Entry is the first retest of the fresh bearish order block and FVG in premium, targeting sell-side liquidity below.
#QCOM #TradingSignals · NFA
SHORT · 5M
Entry: $155.5 - $156.27
TP1: $152.01
TP2: $150.37
TP3: $148.73
SL: $158.99
Buy-side liquidity above the last swing high was swept and price closed back inside. Structure then flipped bearish with a CHoCH on the 5M. Entry is the first retest of the fresh bearish order block and FVG in premium, targeting sell-side liquidity below.
#QCOM #TradingSignals · NFA
80
Log in to explore more content
Join global crypto users on Binance Square
⚡️ Get latest and useful information about crypto.
💬 Trusted by the world’s largest crypto exchange.
👍 Discover real insights from verified creators.
Email / Phone number
Trending Topics
1
#USPPIMissMayEaseBTCPressure
332,490 views
2,386 Discussing
2
#USSpotXRPETFsSeeLargestWeeklyOutflowIn8Months
39,220 views
419 Discussing
3
#BitcoinActiveSupplyInProfitDropsBelow45%
93,075 views
829 Discussing
4
#TONStrategyReports$23.97MQ3NetLoss
11,372 views
55 Discussing
5
#PolkadotCommunityApprovesNewStrategyWith97%Vote
32,104 views
307 Discussing
6
#KavaSaysAbnormalActivityLimitedToKavaLend
58,028 views
462 Discussing
7
#WORPTLetsTouristsConvertCryptoToThaiBaht
11,944 views
116 Discussing
8
#WhoWillSucceedJensenHuangatNvidia?
204,241 views
1,808 Discussing
9
#WhatWillDriveCryptoandStocks’NextRebound?
624,554 views
3,641 Discussing
10
#TradFiForBeginners
751,789 views
4,604 Discussing