
#tradinganalysis
tradinganalysis
1.5M views
5,671 Discussing
Hot
Latest

·
--
$ETH
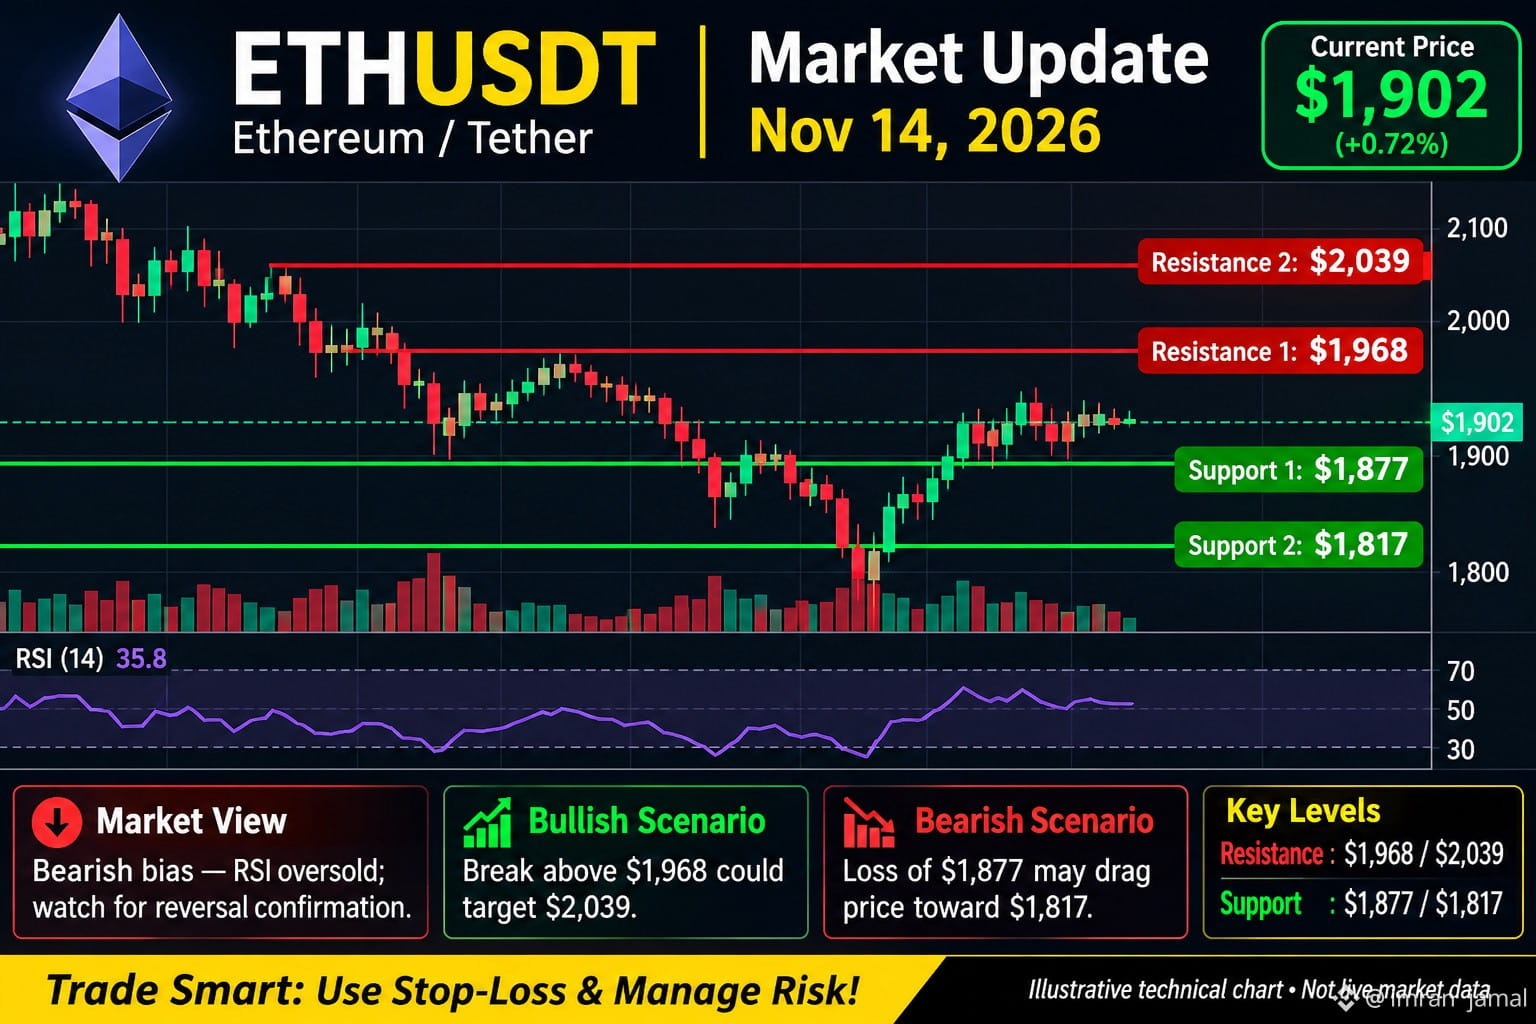
🚀 ETHEREUM (ETH) MARKET UPDATE | November 14, 2026
📉 Current Price: Around $1,902
Ethereum is facing selling pressure as bearish momentum continues across multiple timeframes. Buyers are trying to defend the $1,877 support zone.
📊 Key Levels
Support 1: $1,877
Support 2: $1,817
Resistance 1: $1,968
Resistance 2: $2,039
🐂 Bullish Scenario: A strong breakout above $1,968 could trigger a recovery toward $2,039.
🐻 Bearish Scenario: A breakdown below $1,877 may open the door toward $1,817.
🎯 Trading Strategy: Wait for volume confirmation before entering. Manage risk with a proper stop-loss.
#ETH #Ethereum! #CryptoMarket #Benince #TradingAnalysis
{spot}(ETHUSDT)
$ETH
🚀 ETHEREUM (ETH) MARKET UPDATE | November 14, 2026
📉 Current Price: Around $1,902
Ethereum is facing selling pressure as bearish momentum continues across multiple timeframes. Buyers are trying to defend the $1,877 support zone.
📊 Key Levels
Support 1: $1,877
Support 2: $1,817
Resistance 1: $1,968
Resistance 2: $2,039
🐂 Bullish Scenario: A strong breakout above $1,968 could trigger a recovery toward $2,039.
🐻 Bearish Scenario: A breakdown below $1,877 may open the door toward $1,817.
🎯 Trading Strategy: Wait for volume confirmation before entering. Manage risk with a proper stop-loss.
#ETH #Ethereum! #CryptoMarket #Benince #TradingAnalysis
🚀 ETHEREUM (ETH) MARKET UPDATE | November 14, 2026
📉 Current Price: Around $1,902
Ethereum is facing selling pressure as bearish momentum continues across multiple timeframes. Buyers are trying to defend the $1,877 support zone.
📊 Key Levels
Support 1: $1,877
Support 2: $1,817
Resistance 1: $1,968
Resistance 2: $2,039
🐂 Bullish Scenario: A strong breakout above $1,968 could trigger a recovery toward $2,039.
🐻 Bearish Scenario: A breakdown below $1,877 may open the door toward $1,817.
🎯 Trading Strategy: Wait for volume confirmation before entering. Manage risk with a proper stop-loss.
#ETH #Ethereum! #CryptoMarket #Benince #TradingAnalysis
58

·
--
🚨 INSTITUTIONAL ORDER FLOW ANOMALY DETECTED: $XRP
Quant metrics indicate severe overhead passive absorption alongside an aggressive spot CVD divergence at the local H4 Bearish Order Block. Sellers are executing deterministic block inventory.
Price has swept buy-side liquidity above key structure and is now rejecting directly within a critical Fair Value Gap (FVG). Mean-reversion probability to discount levels stands elevated as buy-side momentum exhausts.
EXECUTION MATRIX:
ENTRY: 0.9833 $XRP
SL: 1.0009
TP1: 0.9630
TP2: 0.9433
RR: 2.28:1
Is $XRP setting up an aggressive mean-reversion displacement or will latent bid liquidity absorb the premium distribution?
#XRPUSDT #BinanceSquare #SlowSclap #TradingAnalysis
🚨 INSTITUTIONAL ORDER FLOW ANOMALY DETECTED: $XRP
Quant metrics indicate severe overhead passive absorption alongside an aggressive spot CVD divergence at the local H4 Bearish Order Block. Sellers are executing deterministic block inventory.
Price has swept buy-side liquidity above key structure and is now rejecting directly within a critical Fair Value Gap (FVG). Mean-reversion probability to discount levels stands elevated as buy-side momentum exhausts.
EXECUTION MATRIX:
ENTRY: 0.9833 $XRP
SL: 1.0009
TP1: 0.9630
TP2: 0.9433
RR: 2.28:1
Is $XRP setting up an aggressive mean-reversion displacement or will latent bid liquidity absorb the premium distribution?
#XRPUSDT #BinanceSquare #SlowSclap #TradingAnalysis
Quant metrics indicate severe overhead passive absorption alongside an aggressive spot CVD divergence at the local H4 Bearish Order Block. Sellers are executing deterministic block inventory.
Price has swept buy-side liquidity above key structure and is now rejecting directly within a critical Fair Value Gap (FVG). Mean-reversion probability to discount levels stands elevated as buy-side momentum exhausts.
EXECUTION MATRIX:
ENTRY: 0.9833 $XRP
SL: 1.0009
TP1: 0.9630
TP2: 0.9433
RR: 2.28:1
Is $XRP setting up an aggressive mean-reversion displacement or will latent bid liquidity absorb the premium distribution?
#XRPUSDT #BinanceSquare #SlowSclap #TradingAnalysis
6
·
--
🚨 INSTITUTIONAL SELL ABSORPTION DETECTED: $SUI
CVD crashing into resistance. Aggressive taker sell volume is overpowering passive bids at the local highs.
LIQUIDITY SWEEP COMPLETE. Smart money is trapping late breakout longs at the range highs. Inflection point active. We fade the exhaustion.
EXECUTION PLAN:
ENTRY: 0.7472 $SUI
SL: 0.7757
TP1: 0.7337
TP2: 0.7180
RR: 1:2.1
Are we witnessing a violent liquidity flush or will buyers step in to defend the range low? Drop your bias below.
#SUI #BinanceSquare #SlowSclap #TradingAnalysis
🚨 INSTITUTIONAL SELL ABSORPTION DETECTED: $SUI
CVD crashing into resistance. Aggressive taker sell volume is overpowering passive bids at the local highs.
LIQUIDITY SWEEP COMPLETE. Smart money is trapping late breakout longs at the range highs. Inflection point active. We fade the exhaustion.
EXECUTION PLAN:
ENTRY: 0.7472 $SUI
SL: 0.7757
TP1: 0.7337
TP2: 0.7180
RR: 1:2.1
Are we witnessing a violent liquidity flush or will buyers step in to defend the range low? Drop your bias below.
#SUI #BinanceSquare #SlowSclap #TradingAnalysis
CVD crashing into resistance. Aggressive taker sell volume is overpowering passive bids at the local highs.
LIQUIDITY SWEEP COMPLETE. Smart money is trapping late breakout longs at the range highs. Inflection point active. We fade the exhaustion.
EXECUTION PLAN:
ENTRY: 0.7472 $SUI
SL: 0.7757
TP1: 0.7337
TP2: 0.7180
RR: 1:2.1
Are we witnessing a violent liquidity flush or will buyers step in to defend the range low? Drop your bias below.
#SUI #BinanceSquare #SlowSclap #TradingAnalysis
20


·
--
Bearish
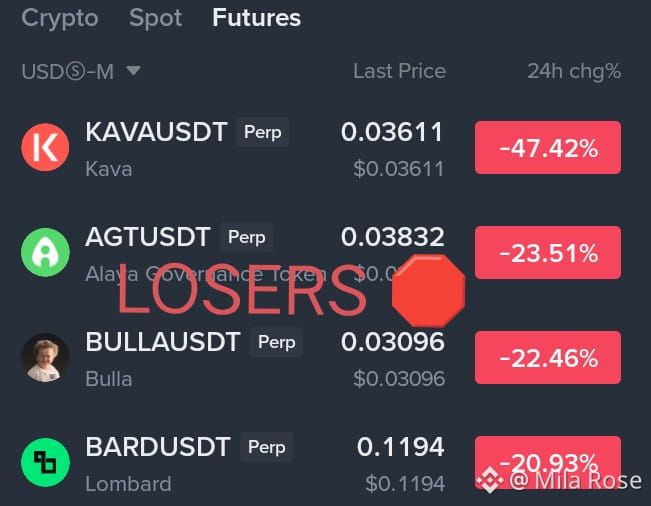
📉 BEARISH PERP LOSERS ANALYSIS🛑
$KAVA -47.42% 🔻
KAVA is leading the decline with a sharp drop, showing heavy selling pressure and significant short-term weakness.
$AGT -23.31% ⚠️
AGT is down over 23%, reflecting continued bearish momentum and downside pressure.
$BARD -20.86% 📉
BARD is also facing notable weakness, adding to the bearish trend across these perpetual markets.
📊 Market Insight
Perpetual markets are showing strong downside pressure, led by KAVA.
🔥 Key Theme
Sharp declines can trigger rebound attempts, but volatility remains elevated.
🎯 Key Takeaway
KAVA leads at -47.42%, followed by AGT at -23.31% and BARD at -20.86%. Trade cautiously and manage risk carefully.
#Binance #Crypto #Altcoins #TopLosers #TradingAnalysis
📉 BEARISH PERP LOSERS ANALYSIS🛑
$KAVA -47.42% 🔻
KAVA is leading the decline with a sharp drop, showing heavy selling pressure and significant short-term weakness.
$AGT -23.31% ⚠️
AGT is down over 23%, reflecting continued bearish momentum and downside pressure.
$BARD -20.86% 📉
BARD is also facing notable weakness, adding to the bearish trend across these perpetual markets.
📊 Market Insight
Perpetual markets are showing strong downside pressure, led by KAVA.
🔥 Key Theme
Sharp declines can trigger rebound attempts, but volatility remains elevated.
🎯 Key Takeaway
KAVA leads at -47.42%, followed by AGT at -23.31% and BARD at -20.86%. Trade cautiously and manage risk carefully.
#Binance #Crypto #Altcoins #TopLosers #TradingAnalysis
$KAVA -47.42% 🔻
KAVA is leading the decline with a sharp drop, showing heavy selling pressure and significant short-term weakness.
$AGT -23.31% ⚠️
AGT is down over 23%, reflecting continued bearish momentum and downside pressure.
$BARD -20.86% 📉
BARD is also facing notable weakness, adding to the bearish trend across these perpetual markets.
📊 Market Insight
Perpetual markets are showing strong downside pressure, led by KAVA.
🔥 Key Theme
Sharp declines can trigger rebound attempts, but volatility remains elevated.
🎯 Key Takeaway
KAVA leads at -47.42%, followed by AGT at -23.31% and BARD at -20.86%. Trade cautiously and manage risk carefully.
#Binance #Crypto #Altcoins #TopLosers #TradingAnalysis
221

🗞️ US Market Rotation: Bitcoin Weak, Nvidia Under Pressure, Apple Showing Relative Strength!Friday's market session showed a clear shift in investor sentiment. The Nasdaq dropped 1.84%, while the Semiconductor Index plunged 6.06%.
🔥 Key Market Highlights
- AMD dropped 10.40%, Nvidia lost 4.51%.
- Apple and Meta showed relative strength.
- Bitcoin remained under pressure, reflecting weakness in risk assets.
- Tech market rotation continues, making selective entries more important.
📊 15M Trading Setups
1️⃣ $BTC /USDT
Current: $67,184
- Long Entry: $67,600 (breakout confirmation)
- TP1: $68,175
- TP2: $68,550
- SL: $66,900
2️⃣ $NVDA USDT Perp
Current: $162.39
- Long Entry: $162.90
- TP1: $163.65
- TP2: $164.10
- SL: $161.75
3️⃣ $AAPL USDT Perp
Current: $356.37
- Long Entry: $356.90
- TP1: $357.40
- TP2: $357.90
- SL: $356.00
💡 My Market View
BTC needs to reclaim its resistance before a stronger recovery. Nvidia needs breakout confirmation, while Apple is holding relatively better.
Don't chase green candles. Wait for volume confirmation, protect your capital and respect your stop-loss.
⚠️ These are conditional 15-minute chart setups, not guaranteed predictions. Always manage risk.
#Bitcoin #BinanceSquare #TradingAnalysis #DYOR
{spot}(BTCUSDT)
{spot}(NVDABUSDT)
{future}(AAPLUSDT)
🗞️ US Market Rotation: Bitcoin Weak, Nvidia Under Pressure, Apple Showing Relative Strength!
Friday's market session showed a clear shift in investor sentiment. The Nasdaq dropped 1.84%, while the Semiconductor Index plunged 6.06%.
🔥 Key Market Highlights
- AMD dropped 10.40%, Nvidia lost 4.51%.
- Apple and Meta showed relative strength.
- Bitcoin remained under pressure, reflecting weakness in risk assets.
- Tech market rotation continues, making selective entries more important.
📊 15M Trading Setups
1️⃣ $BTC /USDT
Current: $67,184
- Long Entry: $67,600 (breakout confirmation)
- TP1: $68,175
- TP2: $68,550
- SL: $66,900
2️⃣ $NVDA USDT Perp
Current: $162.39
- Long Entry: $162.90
- TP1: $163.65
- TP2: $164.10
- SL: $161.75
3️⃣ $AAPL USDT Perp
Current: $356.37
- Long Entry: $356.90
- TP1: $357.40
- TP2: $357.90
- SL: $356.00
💡 My Market View
BTC needs to reclaim its resistance before a stronger recovery. Nvidia needs breakout confirmation, while Apple is holding relatively better.
Don't chase green candles. Wait for volume confirmation, protect your capital and respect your stop-loss.
⚠️ These are conditional 15-minute chart setups, not guaranteed predictions. Always manage risk.
#Bitcoin #BinanceSquare #TradingAnalysis #DYOR
🔥 Key Market Highlights
- AMD dropped 10.40%, Nvidia lost 4.51%.
- Apple and Meta showed relative strength.
- Bitcoin remained under pressure, reflecting weakness in risk assets.
- Tech market rotation continues, making selective entries more important.
📊 15M Trading Setups
1️⃣ $BTC /USDT
Current: $67,184
- Long Entry: $67,600 (breakout confirmation)
- TP1: $68,175
- TP2: $68,550
- SL: $66,900
2️⃣ $NVDA USDT Perp
Current: $162.39
- Long Entry: $162.90
- TP1: $163.65
- TP2: $164.10
- SL: $161.75
3️⃣ $AAPL USDT Perp
Current: $356.37
- Long Entry: $356.90
- TP1: $357.40
- TP2: $357.90
- SL: $356.00
💡 My Market View
BTC needs to reclaim its resistance before a stronger recovery. Nvidia needs breakout confirmation, while Apple is holding relatively better.
Don't chase green candles. Wait for volume confirmation, protect your capital and respect your stop-loss.
⚠️ These are conditional 15-minute chart setups, not guaranteed predictions. Always manage risk.
#Bitcoin #BinanceSquare #TradingAnalysis #DYOR
1
168
·
--
🚨 INSTITUTIONAL ORDER FLOW ALERT: $ADA EXHAUSTION
STRUCTURE BREAK DOWN. Notice the clean CHANGE OF CHARACTER on the lower timeframes as passive bids get swept. Aggressive market sell orders are absorbing liquidity while spot CVD shows clear bearish divergence. Price failed to reclaim overhead supply and is now retesting breakdown levels, presenting a high-probability asymmetric setup.
EXECUTION:
ENTRY: 0.1632 $ADA
SL: 0.1725
TP1: 0.1540
TP2: 0.1450
RR: 1:2.0
Risk management first: we are leaning on established resistance to invalidate this breakdown thesis cleanly.
Are we looking at a genuine CHOCH shift into a multi-day markdown, or is this just a liquidity hunt before reclaiming range highs?
#ADA #BinanceSquare #SlowSclap #TradingAnalysis
🚨 INSTITUTIONAL ORDER FLOW ALERT: $ADA EXHAUSTION
STRUCTURE BREAK DOWN. Notice the clean CHANGE OF CHARACTER on the lower timeframes as passive bids get swept. Aggressive market sell orders are absorbing liquidity while spot CVD shows clear bearish divergence. Price failed to reclaim overhead supply and is now retesting breakdown levels, presenting a high-probability asymmetric setup.
EXECUTION:
ENTRY: 0.1632 $ADA
SL: 0.1725
TP1: 0.1540
TP2: 0.1450
RR: 1:2.0
Risk management first: we are leaning on established resistance to invalidate this breakdown thesis cleanly.
Are we looking at a genuine CHOCH shift into a multi-day markdown, or is this just a liquidity hunt before reclaiming range highs?
#ADA #BinanceSquare #SlowSclap #TradingAnalysis
STRUCTURE BREAK DOWN. Notice the clean CHANGE OF CHARACTER on the lower timeframes as passive bids get swept. Aggressive market sell orders are absorbing liquidity while spot CVD shows clear bearish divergence. Price failed to reclaim overhead supply and is now retesting breakdown levels, presenting a high-probability asymmetric setup.
EXECUTION:
ENTRY: 0.1632 $ADA
SL: 0.1725
TP1: 0.1540
TP2: 0.1450
RR: 1:2.0
Risk management first: we are leaning on established resistance to invalidate this breakdown thesis cleanly.
Are we looking at a genuine CHOCH shift into a multi-day markdown, or is this just a liquidity hunt before reclaiming range highs?
#ADA #BinanceSquare #SlowSclap #TradingAnalysis
6
·
--
🚨 SMART MONEY TRAP DETECTED: $INJ ORDER FLOW ANOMALY
They pushed $INJ right into overhead supply to bait late breakout buyers, but tape analysis reveals heavy stealth absorption by dominant market makers. Cumulative Volume Delta (CVD) is violently diverging as spot distribution overtakes passive limit bids. Retail is walking straight into liquidity extraction before the real flush.
We front-run the institutional exit.
ENTRY: 8.009 $INJ
SL: 8.3159
TP1: 7.9420
TP2: 7.8200
RR: 1:4.6
The footprint confirms smart money is offloading fast. Are you tracking this distribution or will you be trapped holding their bags?
#INJUSDT #BinanceSquare #SlowSclap #TradingAnalysis
🚨 SMART MONEY TRAP DETECTED: $INJ ORDER FLOW ANOMALY
They pushed $INJ right into overhead supply to bait late breakout buyers, but tape analysis reveals heavy stealth absorption by dominant market makers. Cumulative Volume Delta (CVD) is violently diverging as spot distribution overtakes passive limit bids. Retail is walking straight into liquidity extraction before the real flush.
We front-run the institutional exit.
ENTRY: 8.009 $INJ
SL: 8.3159
TP1: 7.9420
TP2: 7.8200
RR: 1:4.6
The footprint confirms smart money is offloading fast. Are you tracking this distribution or will you be trapped holding their bags?
#INJUSDT #BinanceSquare #SlowSclap #TradingAnalysis
They pushed $INJ right into overhead supply to bait late breakout buyers, but tape analysis reveals heavy stealth absorption by dominant market makers. Cumulative Volume Delta (CVD) is violently diverging as spot distribution overtakes passive limit bids. Retail is walking straight into liquidity extraction before the real flush.
We front-run the institutional exit.
ENTRY: 8.009 $INJ
SL: 8.3159
TP1: 7.9420
TP2: 7.8200
RR: 1:4.6
The footprint confirms smart money is offloading fast. Are you tracking this distribution or will you be trapped holding their bags?
#INJUSDT #BinanceSquare #SlowSclap #TradingAnalysis
6
·
--
🚨 STRUCTURAL BREAK CONFIRMED: $INJ FLIPS ORDER FLOW
INSTITUTIONAL TAPE READING shows aggressive delta absorption at key demand. CVD is diverging sharply upward while price consolidates, confirming strong passive limit buying absorbing all market selling.
MARKET STRUCTURE LOGIC: We just printed a clean CHOCH on the lower timeframes, sweeping resting sell-side liquidity before printing a bullish BOS. Sellers failed to accept lower prices, leaving a high-probability liquidity gap above. Risk is strictly defined below the structural invalidation point.
EXECUTION BLUEPRINT:
ENTRY: 7.446 $INJ
SL: 6.865
TP1: 8.026
TP2: 8.607
RR: 1:2.0
Are we witnessing an institutional accumulation trap or a genuine trend reversal?
#INJ #BinanceSquare #SlowSclap #TradingAnalysis
🚨 STRUCTURAL BREAK CONFIRMED: $INJ FLIPS ORDER FLOW
INSTITUTIONAL TAPE READING shows aggressive delta absorption at key demand. CVD is diverging sharply upward while price consolidates, confirming strong passive limit buying absorbing all market selling.
MARKET STRUCTURE LOGIC: We just printed a clean CHOCH on the lower timeframes, sweeping resting sell-side liquidity before printing a bullish BOS. Sellers failed to accept lower prices, leaving a high-probability liquidity gap above. Risk is strictly defined below the structural invalidation point.
EXECUTION BLUEPRINT:
ENTRY: 7.446 $INJ
SL: 6.865
TP1: 8.026
TP2: 8.607
RR: 1:2.0
Are we witnessing an institutional accumulation trap or a genuine trend reversal?
#INJ #BinanceSquare #SlowSclap #TradingAnalysis
INSTITUTIONAL TAPE READING shows aggressive delta absorption at key demand. CVD is diverging sharply upward while price consolidates, confirming strong passive limit buying absorbing all market selling.
MARKET STRUCTURE LOGIC: We just printed a clean CHOCH on the lower timeframes, sweeping resting sell-side liquidity before printing a bullish BOS. Sellers failed to accept lower prices, leaving a high-probability liquidity gap above. Risk is strictly defined below the structural invalidation point.
EXECUTION BLUEPRINT:
ENTRY: 7.446 $INJ
SL: 6.865
TP1: 8.026
TP2: 8.607
RR: 1:2.0
Are we witnessing an institutional accumulation trap or a genuine trend reversal?
#INJ #BinanceSquare #SlowSclap #TradingAnalysis
10

·
--
$BARD
{future}(BARDUSDT)
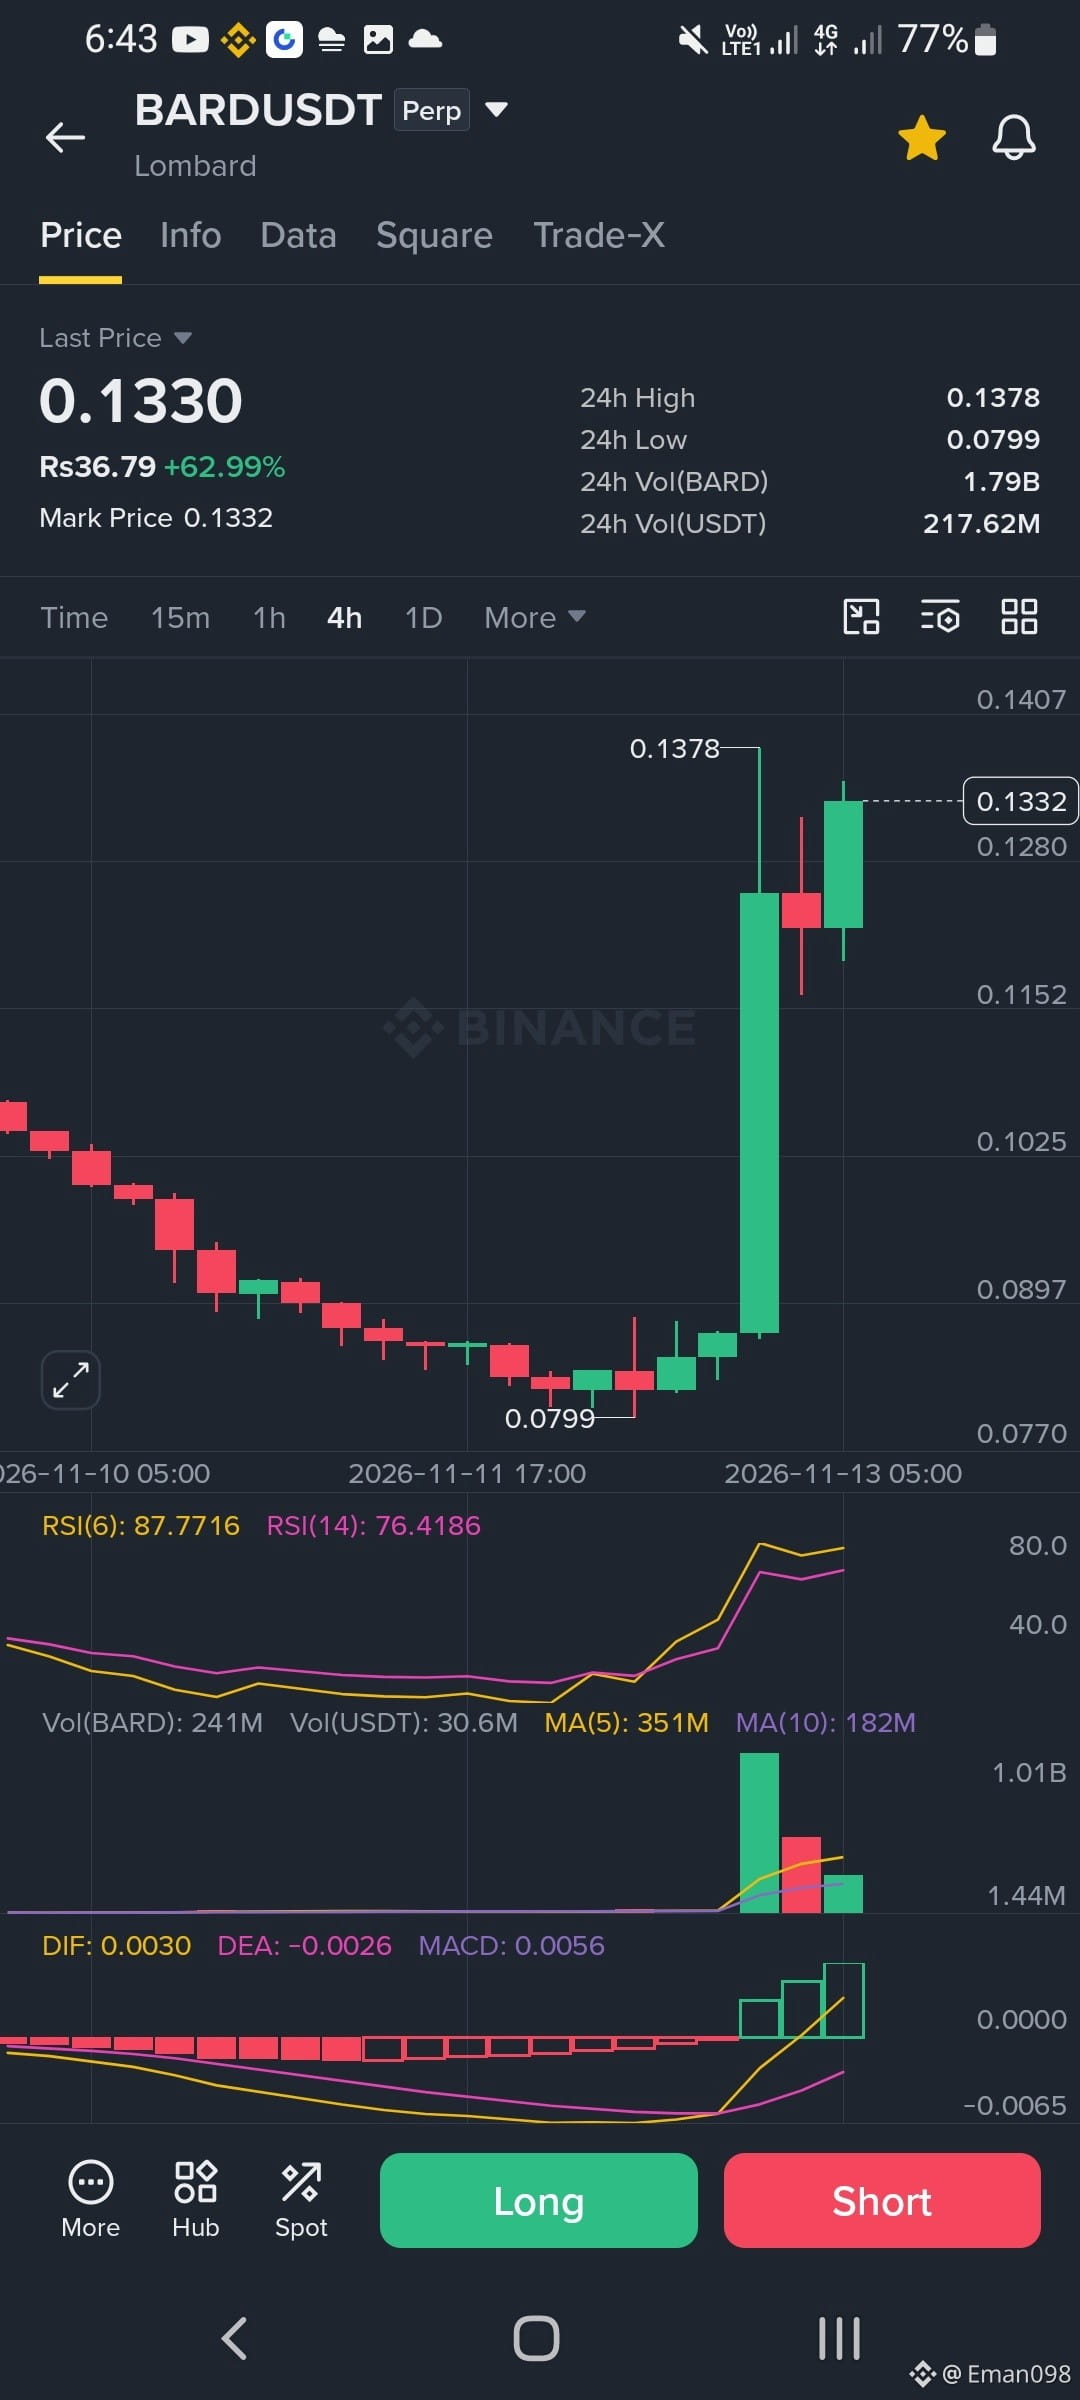
Perp 4h chart. Parabolic pump, overheated. Late-entry risk is very high.
Indicators
- RSI(6): 87.8, RSI(14): 76.4:** deeply overbought. This can stay overbought during a strong pum
- Volume:
the breakout candle had massive volume (~1B) against almost nothing before it. Volume is already fading on the next two candles (~350M MA5 vs 241M now), which suggests the initial burst of buying is cooling.
Bottom line:
the trend has flipped up, but this is a news or momentum-driven spike with no base built. Chasing a long here has poor risk/reward, since a stop would have to be far below. Shorting into a strong pump is also dangerous because these can squeeze higher. The safer approach is waiting for a pullback to 0.115-0.128 that holds, or for a clear breakout and retest of 0.1378. If you trade it, use very small size, low leverage, and wide stops, because candles this large can wick through tight stops and liquidate positions fast. Funding rates are also likely elevated on a move like this.
This is technical analysis, not financial advice. Are you looking at a long or short?
#TradingAnalysis
$BARD
Perp 4h chart. Parabolic pump, overheated. Late-entry risk is very high.
Indicators
- RSI(6): 87.8, RSI(14): 76.4:** deeply overbought. This can stay overbought during a strong pum
- Volume:
the breakout candle had massive volume (~1B) against almost nothing before it. Volume is already fading on the next two candles (~350M MA5 vs 241M now), which suggests the initial burst of buying is cooling.
Bottom line:
the trend has flipped up, but this is a news or momentum-driven spike with no base built. Chasing a long here has poor risk/reward, since a stop would have to be far below. Shorting into a strong pump is also dangerous because these can squeeze higher. The safer approach is waiting for a pullback to 0.115-0.128 that holds, or for a clear breakout and retest of 0.1378. If you trade it, use very small size, low leverage, and wide stops, because candles this large can wick through tight stops and liquidate positions fast. Funding rates are also likely elevated on a move like this.
This is technical analysis, not financial advice. Are you looking at a long or short?
#TradingAnalysis
Perp 4h chart. Parabolic pump, overheated. Late-entry risk is very high.
Indicators
- RSI(6): 87.8, RSI(14): 76.4:** deeply overbought. This can stay overbought during a strong pum
- Volume:
the breakout candle had massive volume (~1B) against almost nothing before it. Volume is already fading on the next two candles (~350M MA5 vs 241M now), which suggests the initial burst of buying is cooling.
Bottom line:
the trend has flipped up, but this is a news or momentum-driven spike with no base built. Chasing a long here has poor risk/reward, since a stop would have to be far below. Shorting into a strong pump is also dangerous because these can squeeze higher. The safer approach is waiting for a pullback to 0.115-0.128 that holds, or for a clear breakout and retest of 0.1378. If you trade it, use very small size, low leverage, and wide stops, because candles this large can wick through tight stops and liquidate positions fast. Funding rates are also likely elevated on a move like this.
This is technical analysis, not financial advice. Are you looking at a long or short?
#TradingAnalysis
Huzaifa313:
😍😍🤩🤩😎😎
1
3
403
·
--
🚨 SHADOW ACCUMULATION FAKE-OUT: $TIAUSDT
THEY WANT RETAIL BELIEVING THIS IS CONSOLIDATION. CVD reveals aggressive passive absorption at the highs while bid depth is quietly pulled beneath us.
SMART MONEY is orchestrating a classic liquidity trap right at the 0.4358 inflection zone. The tape doesn’t lie: distribution disguised as stability before the cascade. We front-run their exit.
EXECUTION:
ENTRY: 0.4358 $TIAUSDT
SL: 0.4464
TP1: 0.4285
TP2: 0.4249
RR: 1:1.02
Are WHALES engineering a brutal flush into discount zones, or will trapped late longs absorb this engineered supply drop?
#TIAUSDT #BinanceSquare #SlowSclap #TradingAnalysis
🚨 SHADOW ACCUMULATION FAKE-OUT: $TIAUSDT
THEY WANT RETAIL BELIEVING THIS IS CONSOLIDATION. CVD reveals aggressive passive absorption at the highs while bid depth is quietly pulled beneath us.
SMART MONEY is orchestrating a classic liquidity trap right at the 0.4358 inflection zone. The tape doesn’t lie: distribution disguised as stability before the cascade. We front-run their exit.
EXECUTION:
ENTRY: 0.4358 $TIAUSDT
SL: 0.4464
TP1: 0.4285
TP2: 0.4249
RR: 1:1.02
Are WHALES engineering a brutal flush into discount zones, or will trapped late longs absorb this engineered supply drop?
#TIAUSDT #BinanceSquare #SlowSclap #TradingAnalysis
THEY WANT RETAIL BELIEVING THIS IS CONSOLIDATION. CVD reveals aggressive passive absorption at the highs while bid depth is quietly pulled beneath us.
SMART MONEY is orchestrating a classic liquidity trap right at the 0.4358 inflection zone. The tape doesn’t lie: distribution disguised as stability before the cascade. We front-run their exit.
EXECUTION:
ENTRY: 0.4358 $TIAUSDT
SL: 0.4464
TP1: 0.4285
TP2: 0.4249
RR: 1:1.02
Are WHALES engineering a brutal flush into discount zones, or will trapped late longs absorb this engineered supply drop?
#TIAUSDT #BinanceSquare #SlowSclap #TradingAnalysis
37
·
--
🚨 AGGRESSIVE LIQUIDITY TRAP TRIGGERED: $TAOUSDT EXPLODING OFF LOWS!
INSTITUTIONAL BUYERS JUST SWALLOWED THE DUMP! WE HAVE MASSIVE CVD SPOT ABSORPTION CRUSHING THE LATE SHORTS RIGHT AT 209.00 KEY SUPPORT!
THE SQUEEZE IS LIVE. Bears overextended into empty bid books and retail panic got swept completely. Momentum is snapping back violently as order book depth vanishes on the ask side. Next stop is clean liquidation hunting above!
EXECUTION:
ENTRY: 209.12 $TAOUSDT
SL: 208.65
TP1: 212.40
TP2: 215.71
RR: 14:1
Did the bears just hand us the bottom on a silver platter, or can they defend the 213 resistance block? Drop your bids below!
#TAOUSDT #BinanceSquare #SlowSclap #TradingAnalysis
🚨 AGGRESSIVE LIQUIDITY TRAP TRIGGERED: $TAOUSDT EXPLODING OFF LOWS!
INSTITUTIONAL BUYERS JUST SWALLOWED THE DUMP! WE HAVE MASSIVE CVD SPOT ABSORPTION CRUSHING THE LATE SHORTS RIGHT AT 209.00 KEY SUPPORT!
THE SQUEEZE IS LIVE. Bears overextended into empty bid books and retail panic got swept completely. Momentum is snapping back violently as order book depth vanishes on the ask side. Next stop is clean liquidation hunting above!
EXECUTION:
ENTRY: 209.12 $TAOUSDT
SL: 208.65
TP1: 212.40
TP2: 215.71
RR: 14:1
Did the bears just hand us the bottom on a silver platter, or can they defend the 213 resistance block? Drop your bids below!
#TAOUSDT #BinanceSquare #SlowSclap #TradingAnalysis
INSTITUTIONAL BUYERS JUST SWALLOWED THE DUMP! WE HAVE MASSIVE CVD SPOT ABSORPTION CRUSHING THE LATE SHORTS RIGHT AT 209.00 KEY SUPPORT!
THE SQUEEZE IS LIVE. Bears overextended into empty bid books and retail panic got swept completely. Momentum is snapping back violently as order book depth vanishes on the ask side. Next stop is clean liquidation hunting above!
EXECUTION:
ENTRY: 209.12 $TAOUSDT
SL: 208.65
TP1: 212.40
TP2: 215.71
RR: 14:1
Did the bears just hand us the bottom on a silver platter, or can they defend the 213 resistance block? Drop your bids below!
#TAOUSDT #BinanceSquare #SlowSclap #TradingAnalysis
33
·
--
Bearish
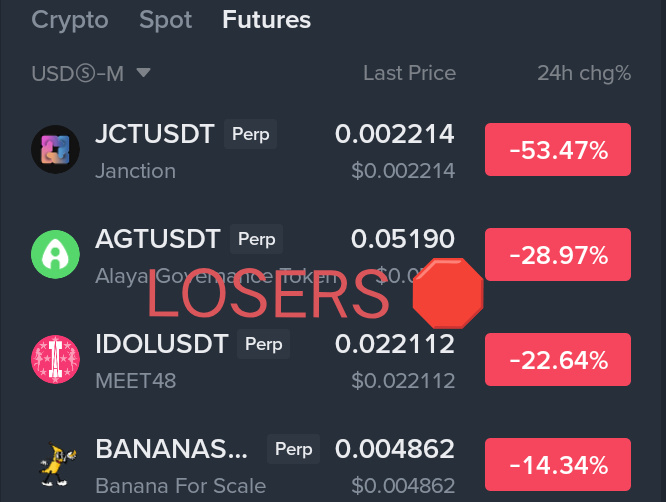
📉 BEARISH PERP LOSERS ANALYSIS🛑
$JCT -53.43% 🔻
{future}(JCTUSDT)
JCT is leading the decline with a massive drop, showing heavy selling pressure and significant downside momentum.
$AGT -29.53% ⚠️
{future}(AGTUSDT)
AGT is down nearly 30%, reflecting continued bearish pressure and notable weakness.
$IDOL
{future}(IDOLUSDT)
IDOL is also among today's selected losers, but its percentage change was not provided.
📊 Market Insight
Perpetual markets are showing strong downside pressure, led by JCT.
🔥 Key Theme
Sharp declines can trigger rebound attempts, but volatility remains elevated.
🎯 Key Takeaway
JCT leads at -53.43%, followed by AGT at -29.53%. Keep IDOL on your watchlist and manage risk carefully.
#Binance #Crypto #Altcoins #TopLosers #TradingAnalysis
📉 BEARISH PERP LOSERS ANALYSIS🛑
$JCT -53.43% 🔻
JCT is leading the decline with a massive drop, showing heavy selling pressure and significant downside momentum.
$AGT -29.53% ⚠️
AGT is down nearly 30%, reflecting continued bearish pressure and notable weakness.
$IDOL
IDOL is also among today's selected losers, but its percentage change was not provided.
📊 Market Insight
Perpetual markets are showing strong downside pressure, led by JCT.
🔥 Key Theme
Sharp declines can trigger rebound attempts, but volatility remains elevated.
🎯 Key Takeaway
JCT leads at -53.43%, followed by AGT at -29.53%. Keep IDOL on your watchlist and manage risk carefully.
#Binance #Crypto #Altcoins #TopLosers #TradingAnalysis
$JCT -53.43% 🔻
JCT is leading the decline with a massive drop, showing heavy selling pressure and significant downside momentum.
$AGT -29.53% ⚠️
AGT is down nearly 30%, reflecting continued bearish pressure and notable weakness.
$IDOL
IDOL is also among today's selected losers, but its percentage change was not provided.
📊 Market Insight
Perpetual markets are showing strong downside pressure, led by JCT.
🔥 Key Theme
Sharp declines can trigger rebound attempts, but volatility remains elevated.
🎯 Key Takeaway
JCT leads at -53.43%, followed by AGT at -29.53%. Keep IDOL on your watchlist and manage risk carefully.
#Binance #Crypto #Altcoins #TopLosers #TradingAnalysis
363
·
--
🚨 SEVERE SELL-SIDE DELTA DIVERGENCE: $ARBUSDT
Quantitative telemetry indicates a classic algorithmic distribution phase. We are observing aggressive Cumulative Volume Delta (CVD) breakdown against local high liquidity, confirming institutional mitigation inside the overhead Fair Value Gap (FVG). Price is rejecting key bearish Order Block resistance, signaling impending mean reversion as buy-side resting liquidity dries up completely.
SYSTEMATIC SHORT SETUP:
ENTRY: 0.14986 $ARBUSDT
SL: 0.15154
TP1: 0.14750
TP2: 0.14529
RR: 2.7:1
Does this structural displacement confirm an impulsive liquidity sweep, or are you modeling a re-accumulation range at the local POC?
#ARBUSDT #BinanceSquare #SlowSclap #TradingAnalysis
🚨 SEVERE SELL-SIDE DELTA DIVERGENCE: $ARBUSDT
Quantitative telemetry indicates a classic algorithmic distribution phase. We are observing aggressive Cumulative Volume Delta (CVD) breakdown against local high liquidity, confirming institutional mitigation inside the overhead Fair Value Gap (FVG). Price is rejecting key bearish Order Block resistance, signaling impending mean reversion as buy-side resting liquidity dries up completely.
SYSTEMATIC SHORT SETUP:
ENTRY: 0.14986 $ARBUSDT
SL: 0.15154
TP1: 0.14750
TP2: 0.14529
RR: 2.7:1
Does this structural displacement confirm an impulsive liquidity sweep, or are you modeling a re-accumulation range at the local POC?
#ARBUSDT #BinanceSquare #SlowSclap #TradingAnalysis
Quantitative telemetry indicates a classic algorithmic distribution phase. We are observing aggressive Cumulative Volume Delta (CVD) breakdown against local high liquidity, confirming institutional mitigation inside the overhead Fair Value Gap (FVG). Price is rejecting key bearish Order Block resistance, signaling impending mean reversion as buy-side resting liquidity dries up completely.
SYSTEMATIC SHORT SETUP:
ENTRY: 0.14986 $ARBUSDT
SL: 0.15154
TP1: 0.14750
TP2: 0.14529
RR: 2.7:1
Does this structural displacement confirm an impulsive liquidity sweep, or are you modeling a re-accumulation range at the local POC?
#ARBUSDT #BinanceSquare #SlowSclap #TradingAnalysis
2
·
--
🚨 CRITICAL MARKET STRUCTURE BREAK: $TRUMPUSDT
Price is carving out a clean CHANGE OF CHARACTER (CHOCH) after sweeping sell-side liquidity into the local demand block. CVD reflects absorption: aggressive sellers are getting trapped while passive limit bids swallow the downside pressure. We now have a confirmed structural shift favoring continuation.
EXECUTION SETUP:
ENTRY: 1.105 $TRUMP
SL: 1.0687
TP1: 1.128
TP2: 1.148
RR: 1.19
RISK MANAGEMENT NOTE: Never front-run the trigger. Invalidation sits below the sweep low at 1.0687. If that level breaks, structure fails and we step aside immediately. Protect capital first.
Are we witnessing an authentic trend reversal or just an engineered liquidity hunt before lower lows?
#TRUMP #BinanceSquare #SlowSclap #TradingAnalysis
🚨 CRITICAL MARKET STRUCTURE BREAK: $TRUMPUSDT
Price is carving out a clean CHANGE OF CHARACTER (CHOCH) after sweeping sell-side liquidity into the local demand block. CVD reflects absorption: aggressive sellers are getting trapped while passive limit bids swallow the downside pressure. We now have a confirmed structural shift favoring continuation.
EXECUTION SETUP:
ENTRY: 1.105 $TRUMP
SL: 1.0687
TP1: 1.128
TP2: 1.148
RR: 1.19
RISK MANAGEMENT NOTE: Never front-run the trigger. Invalidation sits below the sweep low at 1.0687. If that level breaks, structure fails and we step aside immediately. Protect capital first.
Are we witnessing an authentic trend reversal or just an engineered liquidity hunt before lower lows?
#TRUMP #BinanceSquare #SlowSclap #TradingAnalysis
Price is carving out a clean CHANGE OF CHARACTER (CHOCH) after sweeping sell-side liquidity into the local demand block. CVD reflects absorption: aggressive sellers are getting trapped while passive limit bids swallow the downside pressure. We now have a confirmed structural shift favoring continuation.
EXECUTION SETUP:
ENTRY: 1.105 $TRUMP
SL: 1.0687
TP1: 1.128
TP2: 1.148
RR: 1.19
RISK MANAGEMENT NOTE: Never front-run the trigger. Invalidation sits below the sweep low at 1.0687. If that level breaks, structure fails and we step aside immediately. Protect capital first.
Are we witnessing an authentic trend reversal or just an engineered liquidity hunt before lower lows?
#TRUMP #BinanceSquare #SlowSclap #TradingAnalysis
17
·
--
🚨 INSTITUTIONAL ORDER FLOW ALERT: $AAVE SHOWS STRUCTURAL WEAKNESS
Look closely at the 4H chart. We just printed a clear CHANGE OF CHARACTER (CHOCH) after rejecting overhead premium liquidity. CVD indicates aggressive passive limit sellers absorbing market buyers at the highs.
THE LOGIC: Smart money engineered liquidity above local highs before aggressively pushing lower. This break of structure confirms distribution. Our trade thesis is invalid if buyers reclaim that high-volume node, which defines our non-negotiable risk limit.
ENTRY: 117.14 $AAVE
SL: 123.87
TP1: 108.20
TP2: 98.50
RR: 1:2.75
Is $AAVE setting up a deeper macro pullback, or will buyer liquidity defend the golden pocket?
#AAVE #BinanceSquare #SlowSclap #TradingAnalysis
🚨 INSTITUTIONAL ORDER FLOW ALERT: $AAVE SHOWS STRUCTURAL WEAKNESS
Look closely at the 4H chart. We just printed a clear CHANGE OF CHARACTER (CHOCH) after rejecting overhead premium liquidity. CVD indicates aggressive passive limit sellers absorbing market buyers at the highs.
THE LOGIC: Smart money engineered liquidity above local highs before aggressively pushing lower. This break of structure confirms distribution. Our trade thesis is invalid if buyers reclaim that high-volume node, which defines our non-negotiable risk limit.
ENTRY: 117.14 $AAVE
SL: 123.87
TP1: 108.20
TP2: 98.50
RR: 1:2.75
Is $AAVE setting up a deeper macro pullback, or will buyer liquidity defend the golden pocket?
#AAVE #BinanceSquare #SlowSclap #TradingAnalysis
Look closely at the 4H chart. We just printed a clear CHANGE OF CHARACTER (CHOCH) after rejecting overhead premium liquidity. CVD indicates aggressive passive limit sellers absorbing market buyers at the highs.
THE LOGIC: Smart money engineered liquidity above local highs before aggressively pushing lower. This break of structure confirms distribution. Our trade thesis is invalid if buyers reclaim that high-volume node, which defines our non-negotiable risk limit.
ENTRY: 117.14 $AAVE
SL: 123.87
TP1: 108.20
TP2: 98.50
RR: 1:2.75
Is $AAVE setting up a deeper macro pullback, or will buyer liquidity defend the golden pocket?
#AAVE #BinanceSquare #SlowSclap #TradingAnalysis
31
·
--
🚨 INSTITUTIONAL ORDER FLOW DISLOCATION DETECTED: $ENA
Quantitative analysis reveals significant delta skew at micro-structure levels. Cumulative Volume Delta (CVD) divergence confirms aggressive passive absorption right at the dynamic H1 Bullish Fair Value Gap (FVG).
We observe liquidity resting below 0.1430 being mitigated, setting up an optimal equilibrium mean-reversion toward upper buy-side liquidity pools. The algorithm has printed an institutional Order Block (OB) demand confluence.
EXECUTION MATRIX:
ENTRY: 0.14481 $ENA
SL: 0.14214
TP1: 0.14920
TP2: 0.15373
RR: 3.34:1
Do you anticipate this discount FVG mitigation to cause an expansion phase, or are we tracking liquidity distribution into systemic low-timeframe resistance?
#ENA #BinanceSquare #SlowSclap #TradingAnalysis
🚨 INSTITUTIONAL ORDER FLOW DISLOCATION DETECTED: $ENA
Quantitative analysis reveals significant delta skew at micro-structure levels. Cumulative Volume Delta (CVD) divergence confirms aggressive passive absorption right at the dynamic H1 Bullish Fair Value Gap (FVG).
We observe liquidity resting below 0.1430 being mitigated, setting up an optimal equilibrium mean-reversion toward upper buy-side liquidity pools. The algorithm has printed an institutional Order Block (OB) demand confluence.
EXECUTION MATRIX:
ENTRY: 0.14481 $ENA
SL: 0.14214
TP1: 0.14920
TP2: 0.15373
RR: 3.34:1
Do you anticipate this discount FVG mitigation to cause an expansion phase, or are we tracking liquidity distribution into systemic low-timeframe resistance?
#ENA #BinanceSquare #SlowSclap #TradingAnalysis
Quantitative analysis reveals significant delta skew at micro-structure levels. Cumulative Volume Delta (CVD) divergence confirms aggressive passive absorption right at the dynamic H1 Bullish Fair Value Gap (FVG).
We observe liquidity resting below 0.1430 being mitigated, setting up an optimal equilibrium mean-reversion toward upper buy-side liquidity pools. The algorithm has printed an institutional Order Block (OB) demand confluence.
EXECUTION MATRIX:
ENTRY: 0.14481 $ENA
SL: 0.14214
TP1: 0.14920
TP2: 0.15373
RR: 3.34:1
Do you anticipate this discount FVG mitigation to cause an expansion phase, or are we tracking liquidity distribution into systemic low-timeframe resistance?
#ENA #BinanceSquare #SlowSclap #TradingAnalysis
84
·
--
🚨 INSTITUTIONAL SELL ORDER FLOW DETECTED: $ICPUSDT
AGGRESSIVE ASK ABSORPTION AT RESISTANCE. DELTA EXHAUSTION TRIGGERED.
CVD divergence confirms smart money distribution while retail chases the neutral float. Liquidity grab completed at local highs. Mean reversion dump is active.
EXECUTION SETUP:
ENTRY: 2.587 $ICP
SL: 2.643
TP1: 2.545
TP2: 2.518
RR: 1:1.24
EXECUTE WITH DISCIPLINE. DO NOT CHASE ONCE THE SPREAD WIDENS.
Are we watching $ICP break local support straight to 2.50 or will aggressive bids absorb the sweep? Drop your read below.
#ICP #BinanceSquare #SlowSclap #TradingAnalysis
🚨 INSTITUTIONAL SELL ORDER FLOW DETECTED: $ICPUSDT
AGGRESSIVE ASK ABSORPTION AT RESISTANCE. DELTA EXHAUSTION TRIGGERED.
CVD divergence confirms smart money distribution while retail chases the neutral float. Liquidity grab completed at local highs. Mean reversion dump is active.
EXECUTION SETUP:
ENTRY: 2.587 $ICP
SL: 2.643
TP1: 2.545
TP2: 2.518
RR: 1:1.24
EXECUTE WITH DISCIPLINE. DO NOT CHASE ONCE THE SPREAD WIDENS.
Are we watching $ICP break local support straight to 2.50 or will aggressive bids absorb the sweep? Drop your read below.
#ICP #BinanceSquare #SlowSclap #TradingAnalysis
AGGRESSIVE ASK ABSORPTION AT RESISTANCE. DELTA EXHAUSTION TRIGGERED.
CVD divergence confirms smart money distribution while retail chases the neutral float. Liquidity grab completed at local highs. Mean reversion dump is active.
EXECUTION SETUP:
ENTRY: 2.587 $ICP
SL: 2.643
TP1: 2.545
TP2: 2.518
RR: 1:1.24
EXECUTE WITH DISCIPLINE. DO NOT CHASE ONCE THE SPREAD WIDENS.
Are we watching $ICP break local support straight to 2.50 or will aggressive bids absorb the sweep? Drop your read below.
#ICP #BinanceSquare #SlowSclap #TradingAnalysis
10
·
--
🚨 INSTITUTIONAL ORDER FLOW ANOMALY: $INJ LIQUIDITY DISLOCATION
Aggressive limit absorption observed at the lower boundary with clear positive cumulative volume delta (CVD) divergence against local price structure.
A micro Fair Value Gap (FVG) confluence with a H1 bullish Order Block (OB) has formed at 7.91-7.92. Sell-side liquidity sweeps are failing to displace lower as passive bid clusters absorb market sell imbalance, signaling an immediate mean-reversion inflection point toward resting overhead buy-side liquidity.
ENTRY: 7.92 $INJ
SL: 7.8962
TP1: 8.0400
TP2: 8.1560
RR: 9.9:1
Does this structural FVG absorption confirm a clean expansion leg, or will overhead liquidity invalidate the OB retest?
#INJ #BinanceSquare #SlowSclap #TradingAnalysis
🚨 INSTITUTIONAL ORDER FLOW ANOMALY: $INJ LIQUIDITY DISLOCATION
Aggressive limit absorption observed at the lower boundary with clear positive cumulative volume delta (CVD) divergence against local price structure.
A micro Fair Value Gap (FVG) confluence with a H1 bullish Order Block (OB) has formed at 7.91-7.92. Sell-side liquidity sweeps are failing to displace lower as passive bid clusters absorb market sell imbalance, signaling an immediate mean-reversion inflection point toward resting overhead buy-side liquidity.
ENTRY: 7.92 $INJ
SL: 7.8962
TP1: 8.0400
TP2: 8.1560
RR: 9.9:1
Does this structural FVG absorption confirm a clean expansion leg, or will overhead liquidity invalidate the OB retest?
#INJ #BinanceSquare #SlowSclap #TradingAnalysis
Aggressive limit absorption observed at the lower boundary with clear positive cumulative volume delta (CVD) divergence against local price structure.
A micro Fair Value Gap (FVG) confluence with a H1 bullish Order Block (OB) has formed at 7.91-7.92. Sell-side liquidity sweeps are failing to displace lower as passive bid clusters absorb market sell imbalance, signaling an immediate mean-reversion inflection point toward resting overhead buy-side liquidity.
ENTRY: 7.92 $INJ
SL: 7.8962
TP1: 8.0400
TP2: 8.1560
RR: 9.9:1
Does this structural FVG absorption confirm a clean expansion leg, or will overhead liquidity invalidate the OB retest?
#INJ #BinanceSquare #SlowSclap #TradingAnalysis
11
·
--
🚨 MAJOR ORDER FLOW IMBALANCE: $HOTUSDT
AGGRESSIVE LONG CVD SURGE SHOWS DIVERGENCE FROM RECENT BEARISH ORDER BLOCK, INDICATING FAIR VALUE GAP REJECTION AT 0.0004250.
LIQUIDITY IS BEING GRABBED FROM THE 0.0004200 LEVEL, CREATING A BULLISH OB WITH A CLEAR FVG ABOVE 0.0004272. PRICE IS AT A CRITICAL INFLECTION, READY TO RECLAIM THE 0.0004534 TARGET.
NEUTRAL SENTIMENT REMAINS, BUT THE CVD METRICS SHOW STRONG BULLISH MOMENTUM.
ENTRY: 0.0004272 $HOTUSDT SL: 0.0004200361 TP1: 0.0004534 TP2: 0.0004796 RR: 3.6:1
IS $HOTUSDT FORMING A LOCAL TOP OR A SUPPLY FLIP?
#HOTUSDT #BinanceSquare #SlowSclap #TradingAnalysis
🚨 MAJOR ORDER FLOW IMBALANCE: $HOTUSDT
AGGRESSIVE LONG CVD SURGE SHOWS DIVERGENCE FROM RECENT BEARISH ORDER BLOCK, INDICATING FAIR VALUE GAP REJECTION AT 0.0004250.
LIQUIDITY IS BEING GRABBED FROM THE 0.0004200 LEVEL, CREATING A BULLISH OB WITH A CLEAR FVG ABOVE 0.0004272. PRICE IS AT A CRITICAL INFLECTION, READY TO RECLAIM THE 0.0004534 TARGET.
NEUTRAL SENTIMENT REMAINS, BUT THE CVD METRICS SHOW STRONG BULLISH MOMENTUM.
ENTRY: 0.0004272 $HOTUSDT SL: 0.0004200361 TP1: 0.0004534 TP2: 0.0004796 RR: 3.6:1
IS $HOTUSDT FORMING A LOCAL TOP OR A SUPPLY FLIP?
#HOTUSDT #BinanceSquare #SlowSclap #TradingAnalysis
AGGRESSIVE LONG CVD SURGE SHOWS DIVERGENCE FROM RECENT BEARISH ORDER BLOCK, INDICATING FAIR VALUE GAP REJECTION AT 0.0004250.
LIQUIDITY IS BEING GRABBED FROM THE 0.0004200 LEVEL, CREATING A BULLISH OB WITH A CLEAR FVG ABOVE 0.0004272. PRICE IS AT A CRITICAL INFLECTION, READY TO RECLAIM THE 0.0004534 TARGET.
NEUTRAL SENTIMENT REMAINS, BUT THE CVD METRICS SHOW STRONG BULLISH MOMENTUM.
ENTRY: 0.0004272 $HOTUSDT SL: 0.0004200361 TP1: 0.0004534 TP2: 0.0004796 RR: 3.6:1
IS $HOTUSDT FORMING A LOCAL TOP OR A SUPPLY FLIP?
#HOTUSDT #BinanceSquare #SlowSclap #TradingAnalysis
39
·
--
🚨 MAJOR ORDER FLOW IMBALANCE: DOGEUSDT
CVD SHOWS AGGRESSIVE BUYING ON THE 5‑MINUTE CHART WHILE PRICE HOLDS ABOVE THE 0.0680 SUPPORT, REVEALING A CLEAR DIVERGENCE.
WHILE RETAIL CHASERS SELL, WHALE DISTRIBUTION IS ACCUMULATING – THEY WANT YOU TO SHORT HERE, BUT THE FLOW TELLS A DIFFERENT STORY. LIQUIDITY IS BEING GRABBED FROM THE 0.0675 LEVEL, SETTING THE STAGE FOR A SHARP REBOUND.
THE WHALE'S LARGE MARKET ORDER AT 0.0680 IS ABSORBING SELLING PRESSURE, CREATING A TIGHT RANGE THAT WILL BREAK TO THE UPSIDE WHEN THE NEXT BTC SURGE OCCURS.
ENTRY: 0.06829 $DOGEUSDT
SL: 0.06731744
TP1: 0.06985
TP2: 0.0705
RR: 1.6:1
IS DOGEUSDT HITTING A LOCAL TOP OR A SUPPLY FLIP?
#DOGEUSDT #BINANCESQUARE #SLOWSCLAP #TRADINGANALYSIS
🚨 MAJOR ORDER FLOW IMBALANCE: DOGEUSDT
CVD SHOWS AGGRESSIVE BUYING ON THE 5‑MINUTE CHART WHILE PRICE HOLDS ABOVE THE 0.0680 SUPPORT, REVEALING A CLEAR DIVERGENCE.
WHILE RETAIL CHASERS SELL, WHALE DISTRIBUTION IS ACCUMULATING – THEY WANT YOU TO SHORT HERE, BUT THE FLOW TELLS A DIFFERENT STORY. LIQUIDITY IS BEING GRABBED FROM THE 0.0675 LEVEL, SETTING THE STAGE FOR A SHARP REBOUND.
THE WHALE'S LARGE MARKET ORDER AT 0.0680 IS ABSORBING SELLING PRESSURE, CREATING A TIGHT RANGE THAT WILL BREAK TO THE UPSIDE WHEN THE NEXT BTC SURGE OCCURS.
ENTRY: 0.06829 $DOGEUSDT
SL: 0.06731744
TP1: 0.06985
TP2: 0.0705
RR: 1.6:1
IS DOGEUSDT HITTING A LOCAL TOP OR A SUPPLY FLIP?
#DOGEUSDT #BINANCESQUARE #SLOWSCLAP #TRADINGANALYSIS
CVD SHOWS AGGRESSIVE BUYING ON THE 5‑MINUTE CHART WHILE PRICE HOLDS ABOVE THE 0.0680 SUPPORT, REVEALING A CLEAR DIVERGENCE.
WHILE RETAIL CHASERS SELL, WHALE DISTRIBUTION IS ACCUMULATING – THEY WANT YOU TO SHORT HERE, BUT THE FLOW TELLS A DIFFERENT STORY. LIQUIDITY IS BEING GRABBED FROM THE 0.0675 LEVEL, SETTING THE STAGE FOR A SHARP REBOUND.
THE WHALE'S LARGE MARKET ORDER AT 0.0680 IS ABSORBING SELLING PRESSURE, CREATING A TIGHT RANGE THAT WILL BREAK TO THE UPSIDE WHEN THE NEXT BTC SURGE OCCURS.
ENTRY: 0.06829 $DOGEUSDT
SL: 0.06731744
TP1: 0.06985
TP2: 0.0705
RR: 1.6:1
IS DOGEUSDT HITTING A LOCAL TOP OR A SUPPLY FLIP?
#DOGEUSDT #BINANCESQUARE #SLOWSCLAP #TRADINGANALYSIS
74
Log in to explore more content
Join global crypto users on Binance Square
⚡️ Get latest and useful information about crypto.
💬 Trusted by the world’s largest crypto exchange.
👍 Discover real insights from verified creators.
Email / Phone number
Trending Topics
1
#WhoWillSucceedJensenHuangatNvidia?
158,250 views
1,597 Discussing
2
#WhatWillDriveCryptoandStocks’NextRebound?
555,287 views
3,432 Discussing
3
#BitcoinActiveSupplyInProfitDropsBelow45%
68,593 views
677 Discussing
4
#KavaSaysAbnormalActivityLimitedToKavaLend
37,189 views
377 Discussing
5
#USSpotXRPETFsSeeLargestWeeklyOutflowIn8Months
29,412 views
330 Discussing
6
#USPPIMissMayEaseBTCPressure
287,647 views
2,232 Discussing
7
#WORPTLetsTouristsConvertCryptoToThaiBaht
9,738 views
89 Discussing
8
#TONStrategyReports$23.97MQ3NetLoss
10,377 views
43 Discussing
9
#PolkadotCommunityApprovesNewStrategyWith97%Vote
27,523 views
286 Discussing
10
#dYdXPlansV9.9UpgradeToShiftUSDCToInjective
25,815 views
247 Discussing