
#ram
ram
644,070 views
1,413 Discussing
Hot
Latest

·
--
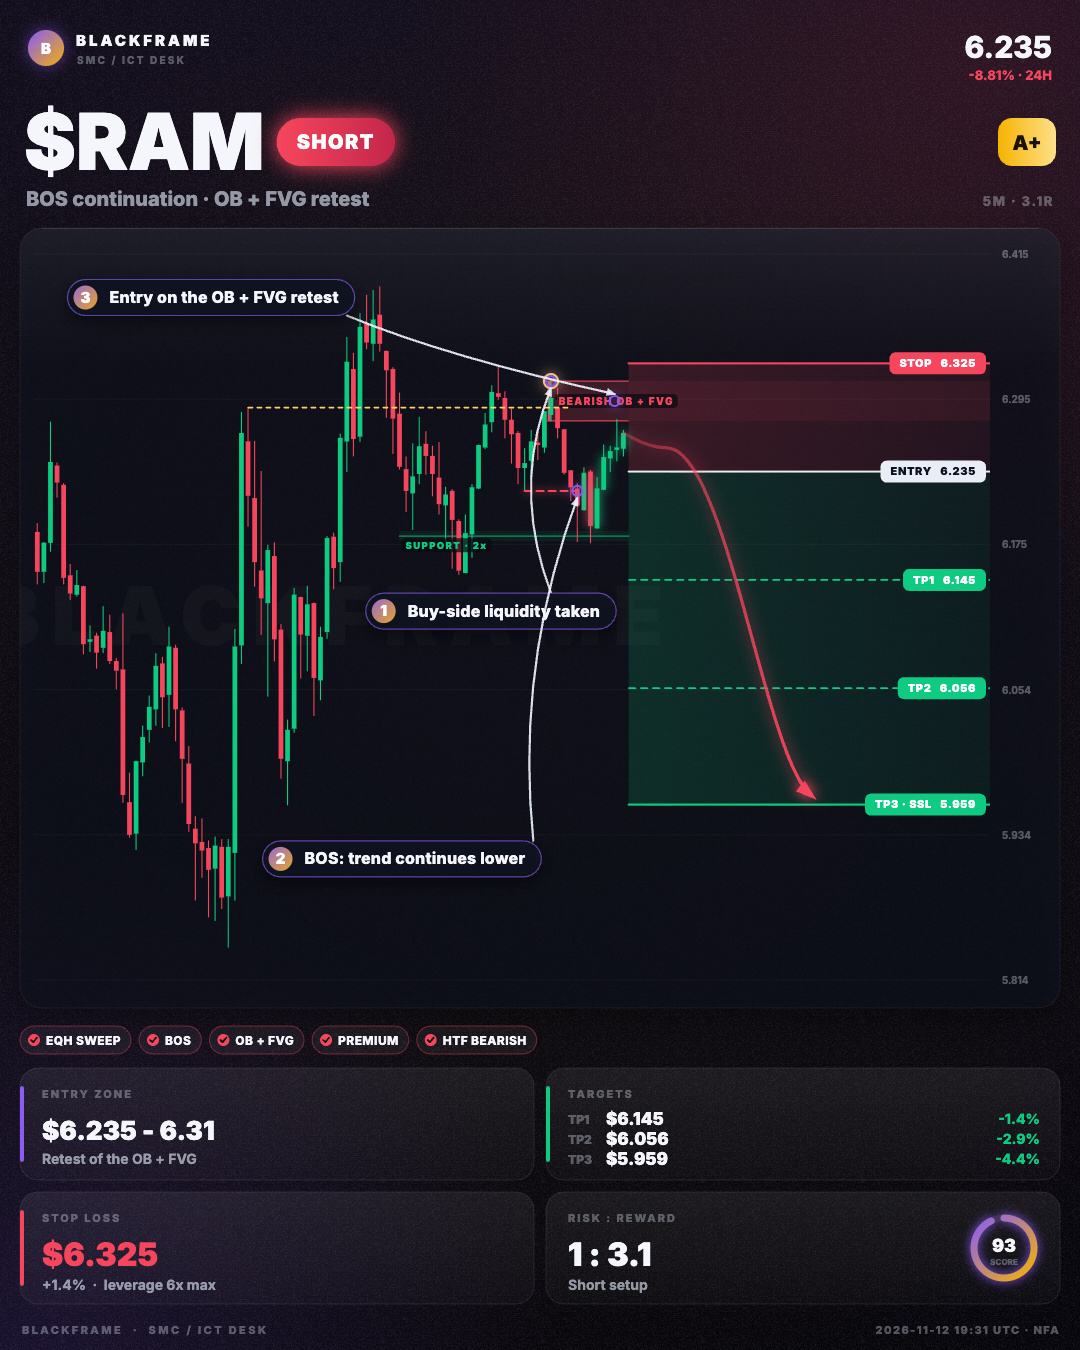
🔻 $RAM bearish order flow intact
SHORT · 5M
Entry: $6.235 - $6.277
TP1: $6.145
TP2: $6.056
TP3: $5.959
SL: $6.325
Buy-side liquidity above the equal highs was swept and price closed back inside. Structure continues lower with a fresh BOS on the 5M. Entry is the first retest of the fresh bearish order block and FVG in premium, targeting sell-side liquidity below.
#RAM #TradingSignals · NFA
🔻 $RAM bearish order flow intact
SHORT · 5M
Entry: $6.235 - $6.277
TP1: $6.145
TP2: $6.056
TP3: $5.959
SL: $6.325
Buy-side liquidity above the equal highs was swept and price closed back inside. Structure continues lower with a fresh BOS on the 5M. Entry is the first retest of the fresh bearish order block and FVG in premium, targeting sell-side liquidity below.
#RAM #TradingSignals · NFA
SHORT · 5M
Entry: $6.235 - $6.277
TP1: $6.145
TP2: $6.056
TP3: $5.959
SL: $6.325
Buy-side liquidity above the equal highs was swept and price closed back inside. Structure continues lower with a fresh BOS on the 5M. Entry is the first retest of the fresh bearish order block and FVG in premium, targeting sell-side liquidity below.
#RAM #TradingSignals · NFA
56

·
--
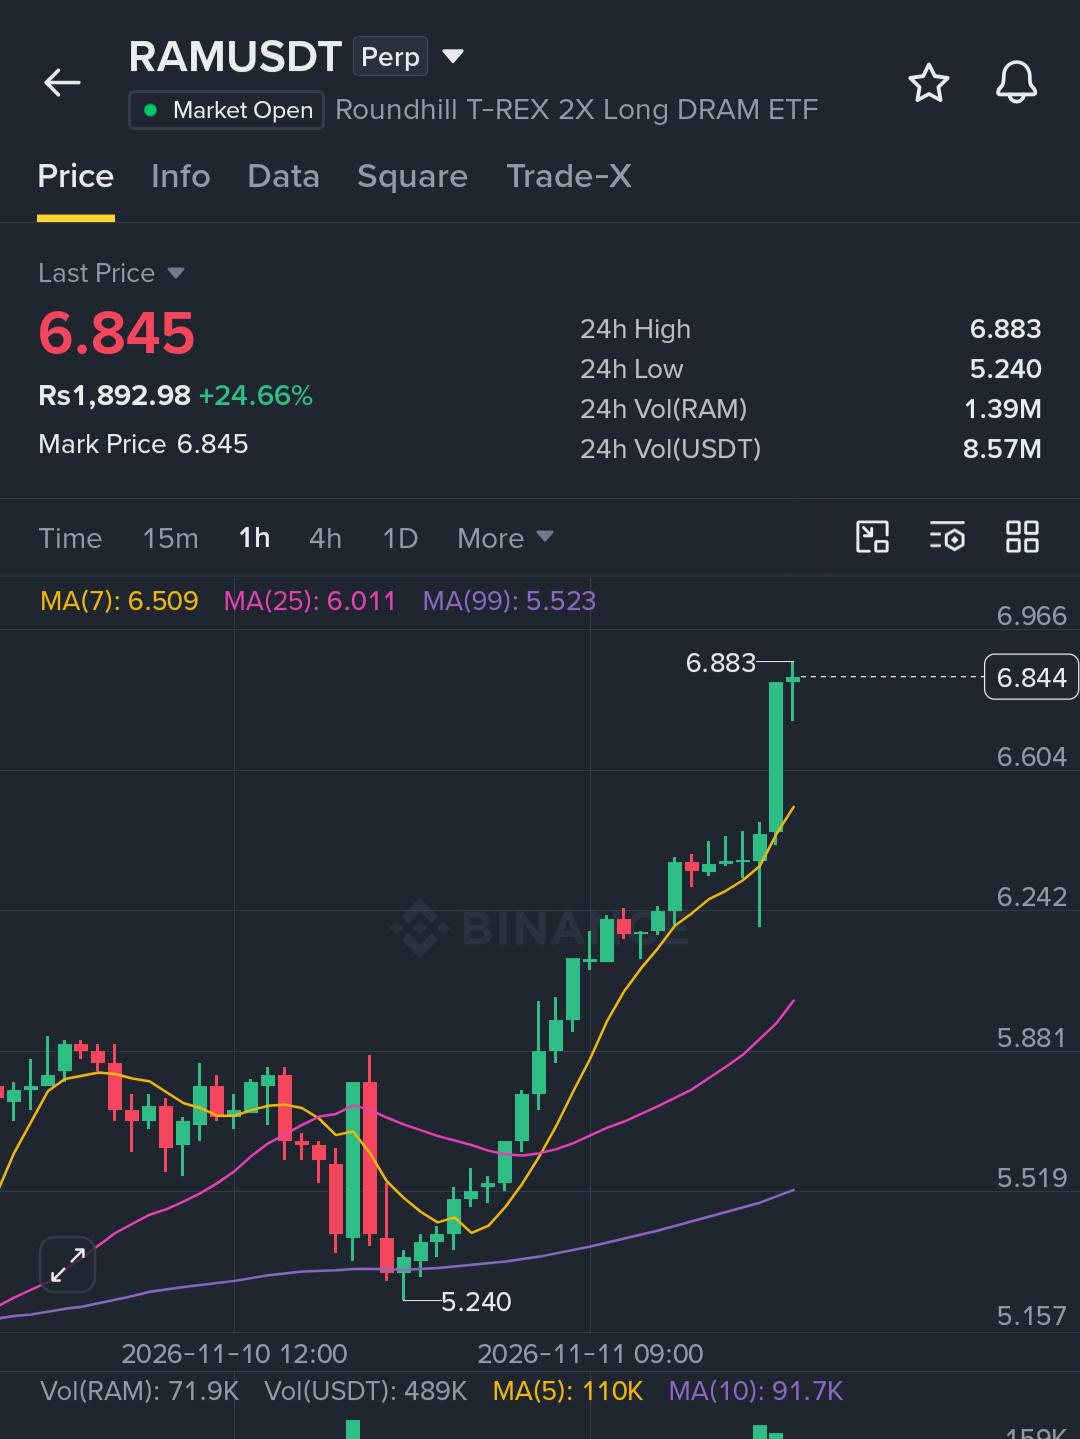
$RAM is surging with strong momentum, trading well above its key moving averages as buyers push higher. Structure favors continuation if it holds this zone. 🔥
Trade Setup (Long):
🟢 Entry Zone: 6.55 – 6.80
🎯 Targets: 7.05 / 7.40 / 7.80
⛔ Stop Loss: 6.15
Price is holding bullish strength. Enter on pullbacks and manage risk appropriately.
Click here to buy now 👉 $RAM
{future}(RAMUSDT)
#RAM #BarclaysRaisesBlackRockBitcoinETFStake48%
$RAM is surging with strong momentum, trading well above its key moving averages as buyers push higher. Structure favors continuation if it holds this zone. 🔥
Trade Setup (Long):
🟢 Entry Zone: 6.55 – 6.80
🎯 Targets: 7.05 / 7.40 / 7.80
⛔ Stop Loss: 6.15
Price is holding bullish strength. Enter on pullbacks and manage risk appropriately.
Click here to buy now 👉 $RAM
#RAM #BarclaysRaisesBlackRockBitcoinETFStake48%
Trade Setup (Long):
🟢 Entry Zone: 6.55 – 6.80
🎯 Targets: 7.05 / 7.40 / 7.80
⛔ Stop Loss: 6.15
Price is holding bullish strength. Enter on pullbacks and manage risk appropriately.
Click here to buy now 👉 $RAM
#RAM #BarclaysRaisesBlackRockBitcoinETFStake48%
2
21

·
--
Bullish
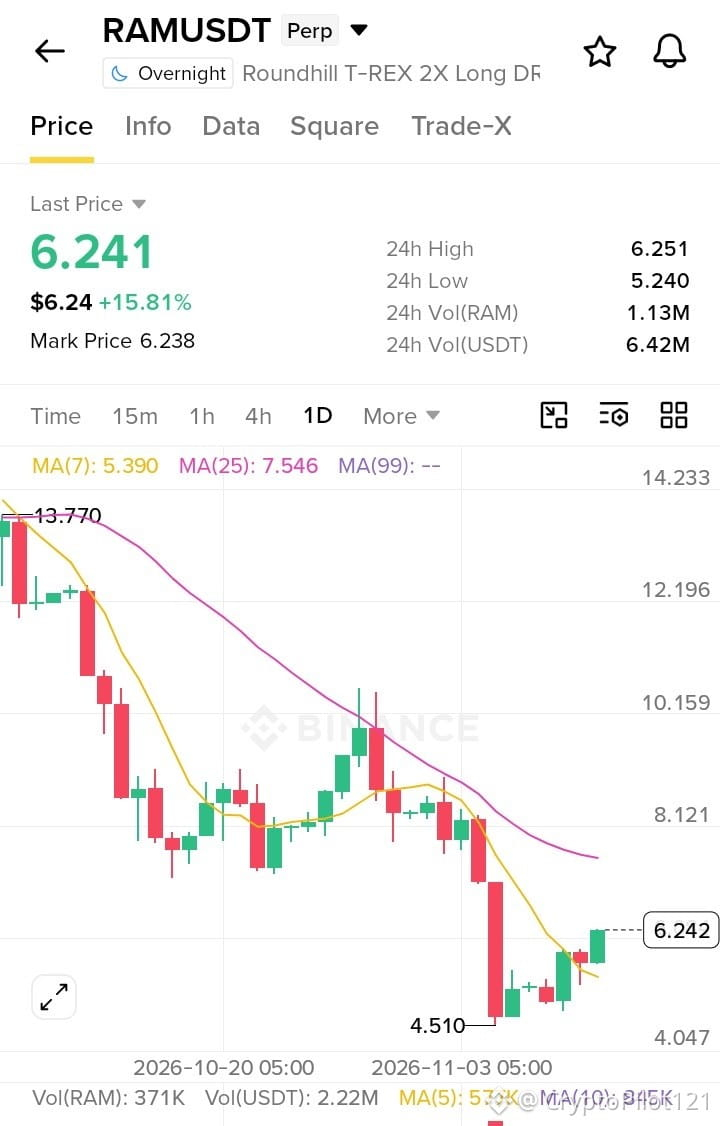
🚀 $RAM USDT Perp GAINS +🔥
Price: $6.241
**Mark:** $6.238
24h High: $6.251
✅ Bullish Reversal:
Price > MA(7): 5.390 ✅
Strong bounce from recent lows ($4.510).
🎯 Long Entry: $5.80 - $6.15
Stop Loss: $5.00
**Targets:** $7.00 → $8.00
📈 Volume rising → Momentum building.
#RAM #USDT #Trading #CanNvidiaEarningsEaseMarketConcerns?
$RAM
{future}(RAMUSDT)
🚀 $RAM USDT Perp GAINS +🔥
Price: $6.241
**Mark:** $6.238
24h High: $6.251
✅ Bullish Reversal:
Price > MA(7): 5.390 ✅
Strong bounce from recent lows ($4.510).
🎯 Long Entry: $5.80 - $6.15
Stop Loss: $5.00
**Targets:** $7.00 → $8.00
📈 Volume rising → Momentum building.
#RAM #USDT #Trading #CanNvidiaEarningsEaseMarketConcerns?
$RAM
Price: $6.241
**Mark:** $6.238
24h High: $6.251
✅ Bullish Reversal:
Price > MA(7): 5.390 ✅
Strong bounce from recent lows ($4.510).
🎯 Long Entry: $5.80 - $6.15
Stop Loss: $5.00
**Targets:** $7.00 → $8.00
📈 Volume rising → Momentum building.
#RAM #USDT #Trading #CanNvidiaEarningsEaseMarketConcerns?
$RAM
78

·
--
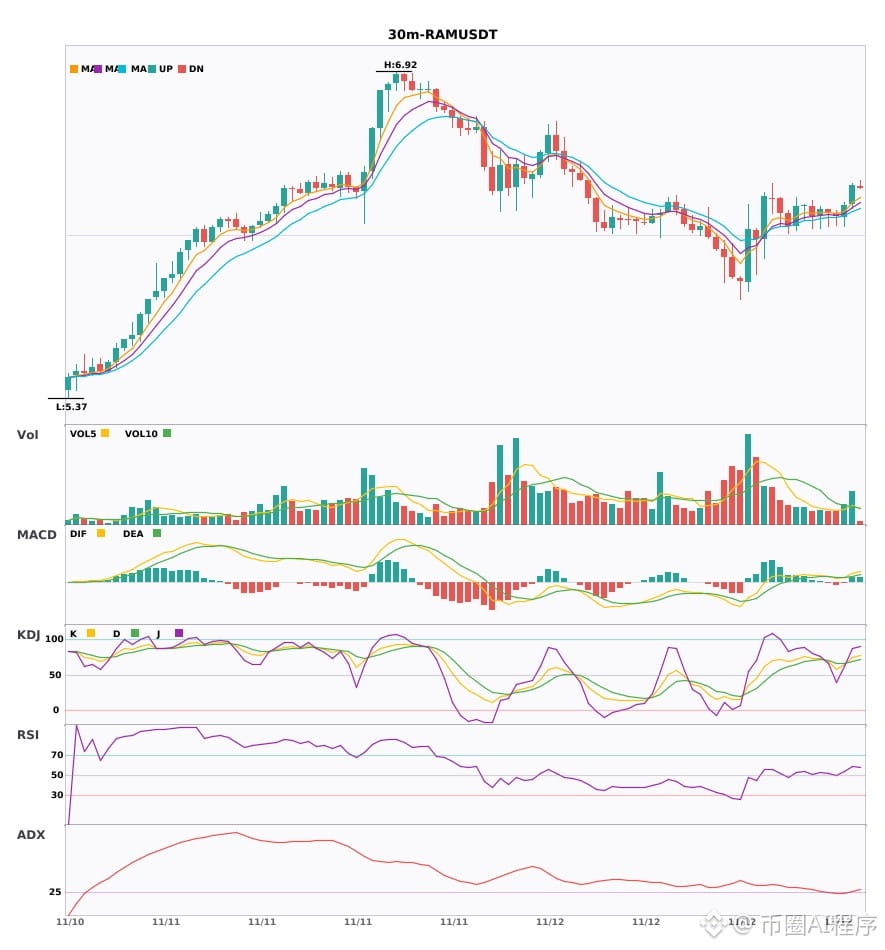
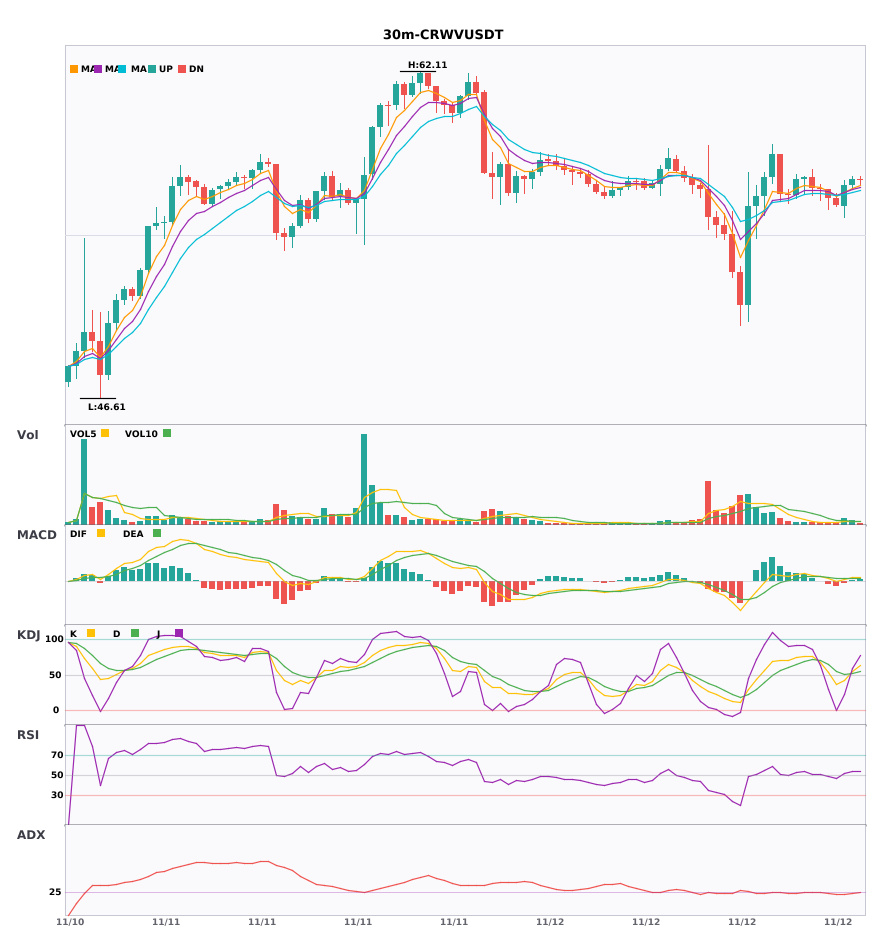
Multi-timeframe confluence: $RAM / $CSCO / $CRWV 30-minute strength, 4-hour bullish trend confirmed🔥
════════════════════
🔴 $RAM 30-minute bullish signal
⚠️Technical analysis: 4-hour bullish confluence confirmed | 30-minute entry: MACD golden cross above zero, bullish momentum released | EMA5 > EMA8 > EMA13 bullish alignment | KDJ golden cross, short-term bullish (K = 74.6, D = 68.5) | Volume expansion (1.8x)
════════════════════
🔴 $CSCO 30-minute bullish signal
⚠️Technical analysis: 4-hour bullish confluence confirmed | 30-minute entry: MACD golden cross above zero, bullish momentum released | EMA5 > EMA8 > EMA13 bullish alignment | KDJ running strong, bulls in control (K = 54.7, D = 66.7) | Volume surge (9.3x)
════════════════════
🔴 $CRWV 30-minute bullish signal
⚠️Technical analysis: 4-hour bullish confluence confirmed | 30-minute entry: MACD golden cross above zero, bullish momentum released | EMA5 > EMA8 > EMA13 bullish alignment | KDJ golden cross, short-term bullish (K = 54.6, D = 52.1) | Volume normal (1.4x)
════════════════════
🔔 Follow for first-hand market movement alerts 🔔
#多周期共振 #RAM #CSCO #CRWV
📌 When trading, pay attention to whether the candlestick pattern meets the criteria
Multi-timeframe confluence: $RAM / $CSCO / $CRWV 30-minute strength, 4-hour bullish trend confirmed🔥
════════════════════
🔴 $RAM 30-minute bullish signal
⚠️Technical analysis: 4-hour bullish confluence confirmed | 30-minute entry: MACD golden cross above zero, bullish momentum released | EMA5 > EMA8 > EMA13 bullish alignment | KDJ golden cross, short-term bullish (K = 74.6, D = 68.5) | Volume expansion (1.8x)
════════════════════
🔴 $CSCO 30-minute bullish signal
⚠️Technical analysis: 4-hour bullish confluence confirmed | 30-minute entry: MACD golden cross above zero, bullish momentum released | EMA5 > EMA8 > EMA13 bullish alignment | KDJ running strong, bulls in control (K = 54.7, D = 66.7) | Volume surge (9.3x)
════════════════════
🔴 $CRWV 30-minute bullish signal
⚠️Technical analysis: 4-hour bullish confluence confirmed | 30-minute entry: MACD golden cross above zero, bullish momentum released | EMA5 > EMA8 > EMA13 bullish alignment | KDJ golden cross, short-term bullish (K = 54.6, D = 52.1) | Volume normal (1.4x)
════════════════════
🔔 Follow for first-hand market movement alerts 🔔
#多周期共振 #RAM #CSCO #CRWV
📌 When trading, pay attention to whether the candlestick pattern meets the criteria
════════════════════
🔴 $RAM 30-minute bullish signal
⚠️Technical analysis: 4-hour bullish confluence confirmed | 30-minute entry: MACD golden cross above zero, bullish momentum released | EMA5 > EMA8 > EMA13 bullish alignment | KDJ golden cross, short-term bullish (K = 74.6, D = 68.5) | Volume expansion (1.8x)
════════════════════
🔴 $CSCO 30-minute bullish signal
⚠️Technical analysis: 4-hour bullish confluence confirmed | 30-minute entry: MACD golden cross above zero, bullish momentum released | EMA5 > EMA8 > EMA13 bullish alignment | KDJ running strong, bulls in control (K = 54.7, D = 66.7) | Volume surge (9.3x)
════════════════════
🔴 $CRWV 30-minute bullish signal
⚠️Technical analysis: 4-hour bullish confluence confirmed | 30-minute entry: MACD golden cross above zero, bullish momentum released | EMA5 > EMA8 > EMA13 bullish alignment | KDJ golden cross, short-term bullish (K = 54.6, D = 52.1) | Volume normal (1.4x)
════════════════════
🔔 Follow for first-hand market movement alerts 🔔
#多周期共振 #RAM #CSCO #CRWV
📌 When trading, pay attention to whether the candlestick pattern meets the criteria
17


·
--
Partly True
RAM surges 29% to break above $6.8! Following the semiconductor and chip sector
RAM, a tokenized stock linked to the semiconductor supply chain, surged 29.04% today to $6.865.
Correlation driver: No crypto protocol events were found today; the price rose entirely in tandem with semiconductor and hardware storage stocks.
Takeaway: Traditional finance stock perpetuals—keep a close eye on U.S. chip stocks and follow their order books for short intraday trades.
#RAM $RAM
{future}(RAMUSDT)
RAM surges 29% to break above $6.8! Following the semiconductor and chip sector
RAM, a tokenized stock linked to the semiconductor supply chain, surged 29.04% today to $6.865.
Correlation driver: No crypto protocol events were found today; the price rose entirely in tandem with semiconductor and hardware storage stocks.
Takeaway: Traditional finance stock perpetuals—keep a close eye on U.S. chip stocks and follow their order books for short intraday trades.
#RAM $RAM
RAM, a tokenized stock linked to the semiconductor supply chain, surged 29.04% today to $6.865.
Correlation driver: No crypto protocol events were found today; the price rose entirely in tandem with semiconductor and hardware storage stocks.
Takeaway: Traditional finance stock perpetuals—keep a close eye on U.S. chip stocks and follow their order books for short intraday trades.
#RAM $RAM
604

·
--
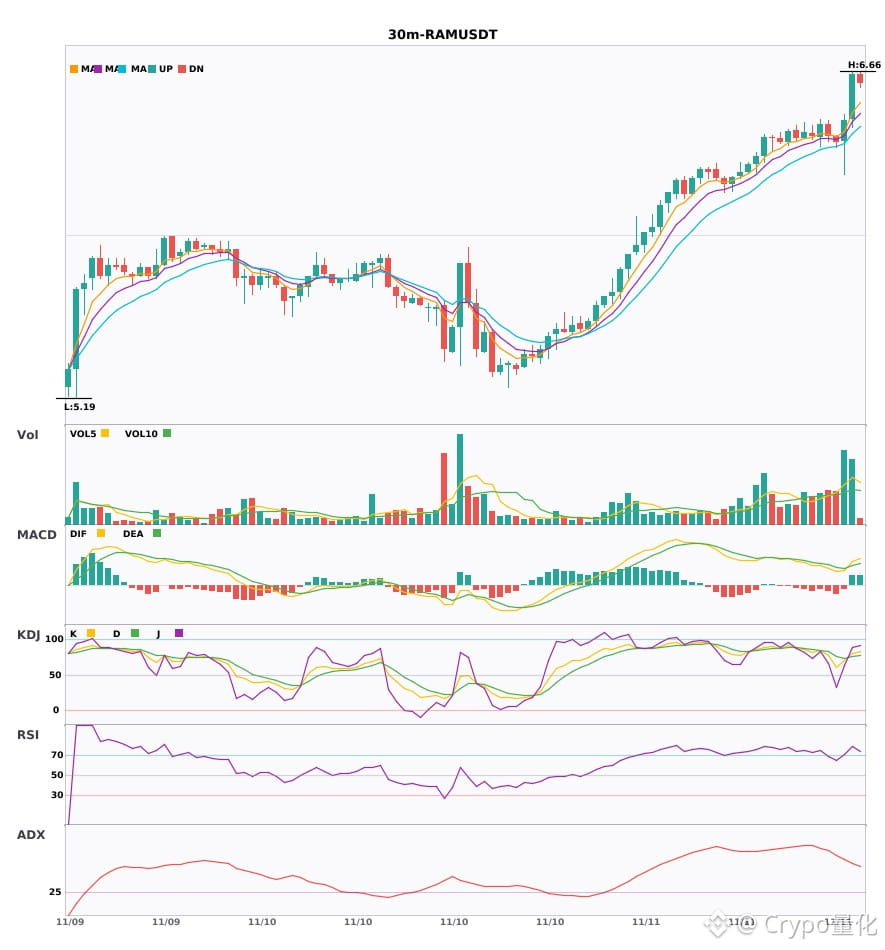
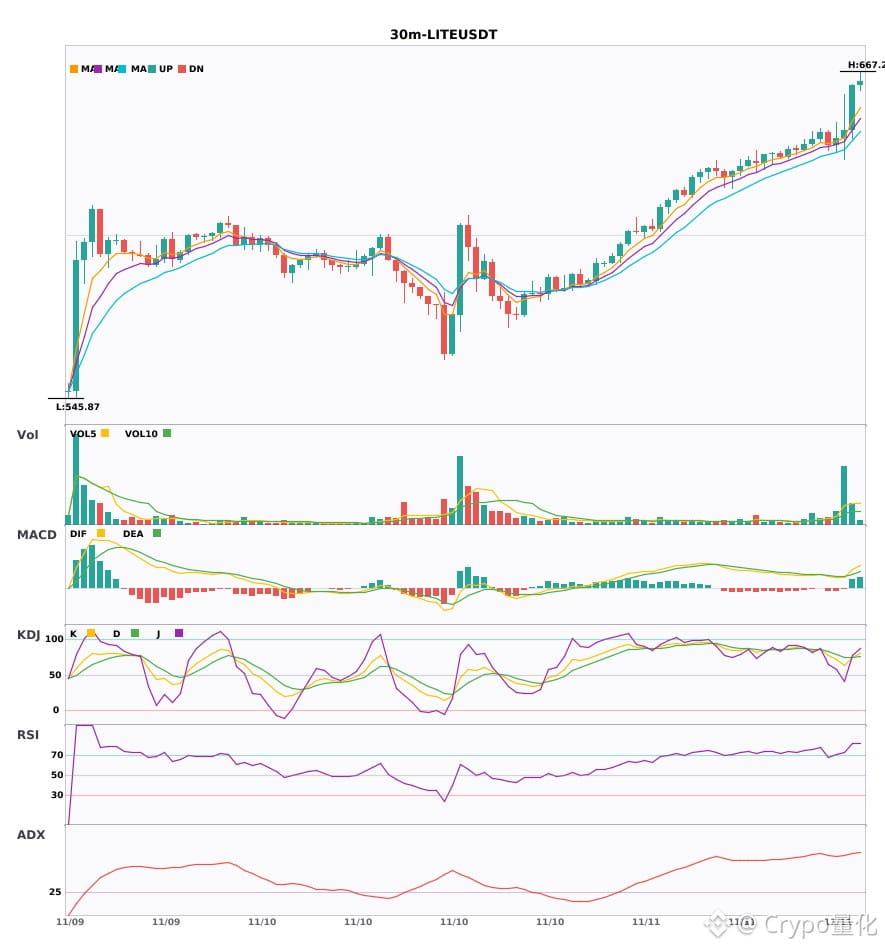
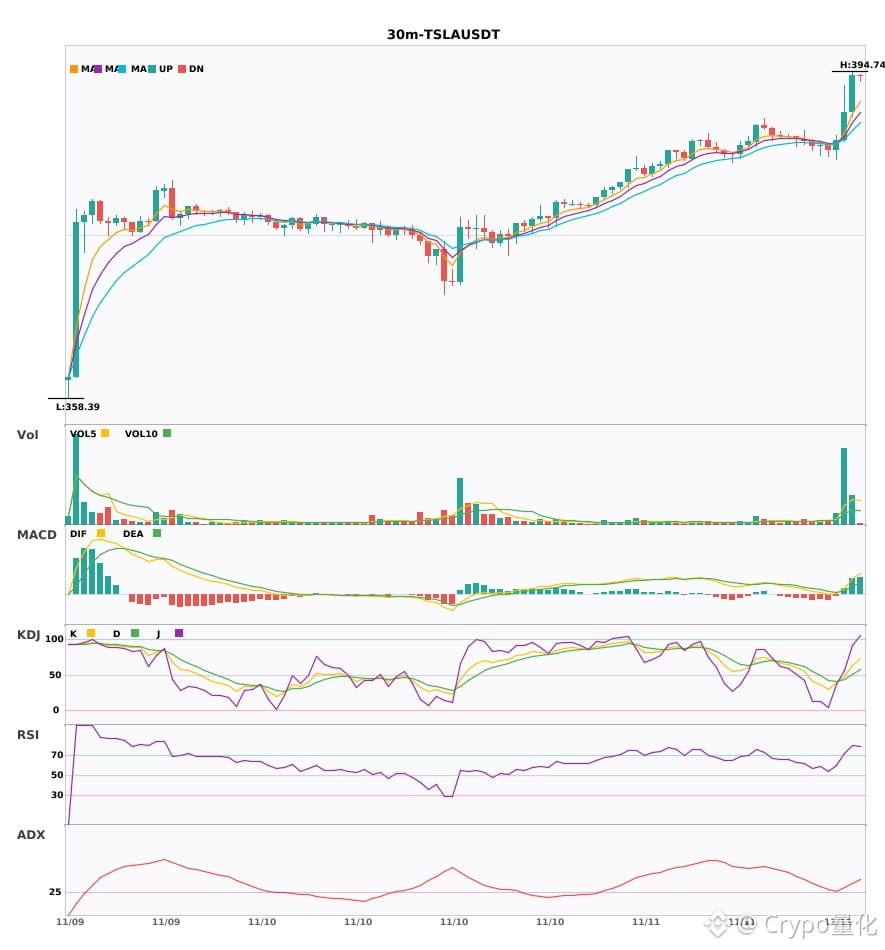
Three 30-minute bullish signals appeared simultaneously: $RAM / $LITE / $TSLA🔥
════════════════════
🔴 $RAM 30-minute bullish signal
⚠️Technical analysis: ADX(55) Very strong trend (beware of an overheated pullback) | MACD golden cross above zero, bullish momentum released | EMA5 > EMA8 > EMA13, bullish alignment | KDJ golden cross, short-term bullish (K: 79.8, D: 75.6) | Volume increased (2.3x)
════════════════════
🔴 $LITE 30-minute bullish signal
⚠️Technical analysis: ADX(69) Very strong trend (beware of an overheated pullback) | MACD golden cross above zero, bullish momentum released | EMA5 > EMA8 > EMA13, bullish alignment | KDJ golden cross, short-term bullish (K: 75.2, D: 74.3) | Volume surged (5.2x)
════════════════════
🔴 $TSLA 30-minute bullish signal
⚠️Technical analysis: ADX(30) Trend is forming; participation is possible | MACD golden cross above zero, bullish momentum released | EMA5 crossed above EMA8, short-term bullish turn | KDJ golden cross, short-term bullish (K: 47.9, D: 43.6) | Volume surged (6.5x)
════════════════════
🔔 Follow for real-time market alerts 🔔
#技术分析 #RAM #LITE #TSLA
📌 When trading, pay attention to whether the candlestick patterns confirm the signal
Three 30-minute bullish signals appeared simultaneously: $RAM / $LITE / $TSLA 🔥
════════════════════
🔴 $RAM 30-minute bullish signal
⚠️Technical analysis: ADX(55) Very strong trend (beware of an overheated pullback) | MACD golden cross above zero, bullish momentum released | EMA5 > EMA8 > EMA13, bullish alignment | KDJ golden cross, short-term bullish (K: 79.8, D: 75.6) | Volume increased (2.3x)
════════════════════
🔴 $LITE 30-minute bullish signal
⚠️Technical analysis: ADX(69) Very strong trend (beware of an overheated pullback) | MACD golden cross above zero, bullish momentum released | EMA5 > EMA8 > EMA13, bullish alignment | KDJ golden cross, short-term bullish (K: 75.2, D: 74.3) | Volume surged (5.2x)
════════════════════
🔴 $TSLA 30-minute bullish signal
⚠️Technical analysis: ADX(30) Trend is forming; participation is possible | MACD golden cross above zero, bullish momentum released | EMA5 crossed above EMA8, short-term bullish turn | KDJ golden cross, short-term bullish (K: 47.9, D: 43.6) | Volume surged (6.5x)
════════════════════
🔔 Follow for real-time market alerts 🔔
#技术分析 #RAM #LITE #TSLA
📌 When trading, pay attention to whether the candlestick patterns confirm the signal
════════════════════
🔴 $RAM 30-minute bullish signal
⚠️Technical analysis: ADX(55) Very strong trend (beware of an overheated pullback) | MACD golden cross above zero, bullish momentum released | EMA5 > EMA8 > EMA13, bullish alignment | KDJ golden cross, short-term bullish (K: 79.8, D: 75.6) | Volume increased (2.3x)
════════════════════
🔴 $LITE 30-minute bullish signal
⚠️Technical analysis: ADX(69) Very strong trend (beware of an overheated pullback) | MACD golden cross above zero, bullish momentum released | EMA5 > EMA8 > EMA13, bullish alignment | KDJ golden cross, short-term bullish (K: 75.2, D: 74.3) | Volume surged (5.2x)
════════════════════
🔴 $TSLA 30-minute bullish signal
⚠️Technical analysis: ADX(30) Trend is forming; participation is possible | MACD golden cross above zero, bullish momentum released | EMA5 crossed above EMA8, short-term bullish turn | KDJ golden cross, short-term bullish (K: 47.9, D: 43.6) | Volume surged (6.5x)
════════════════════
🔔 Follow for real-time market alerts 🔔
#技术分析 #RAM #LITE #TSLA
📌 When trading, pay attention to whether the candlestick patterns confirm the signal
6

·
--
Bullish
$RAM USDT
Market Analysis: RAM is showing strong upward momentum. Buyers are active, but volatility could increase after this rally. This is a leveraged DRAM ETF product, so manage risk carefully.
EP: $5.76
TP1: $5.9328
TP2: $6.1056
SL: $5.5872
Trading Plan: Wait for a healthy pullback and confirmation before entering LONG.
#RAM #CPITestsDecemberRateOutlook #NvidiaInvestigatesAfterHuang’sAffairApology #AIChipSlumpNasdaq #StrategyBuys1037BTCLastWeek
$RAM
{future}(RAMUSDT)
$RAM USDT
Market Analysis: RAM is showing strong upward momentum. Buyers are active, but volatility could increase after this rally. This is a leveraged DRAM ETF product, so manage risk carefully.
EP: $5.76
TP1: $5.9328
TP2: $6.1056
SL: $5.5872
Trading Plan: Wait for a healthy pullback and confirmation before entering LONG.
#RAM #CPITestsDecemberRateOutlook #NvidiaInvestigatesAfterHuang’sAffairApology #AIChipSlumpNasdaq #StrategyBuys1037BTCLastWeek
$RAM
Market Analysis: RAM is showing strong upward momentum. Buyers are active, but volatility could increase after this rally. This is a leveraged DRAM ETF product, so manage risk carefully.
EP: $5.76
TP1: $5.9328
TP2: $6.1056
SL: $5.5872
Trading Plan: Wait for a healthy pullback and confirmation before entering LONG.
#RAM #CPITestsDecemberRateOutlook #NvidiaInvestigatesAfterHuang’sAffairApology #AIChipSlumpNasdaq #StrategyBuys1037BTCLastWeek
$RAM
33
·
--
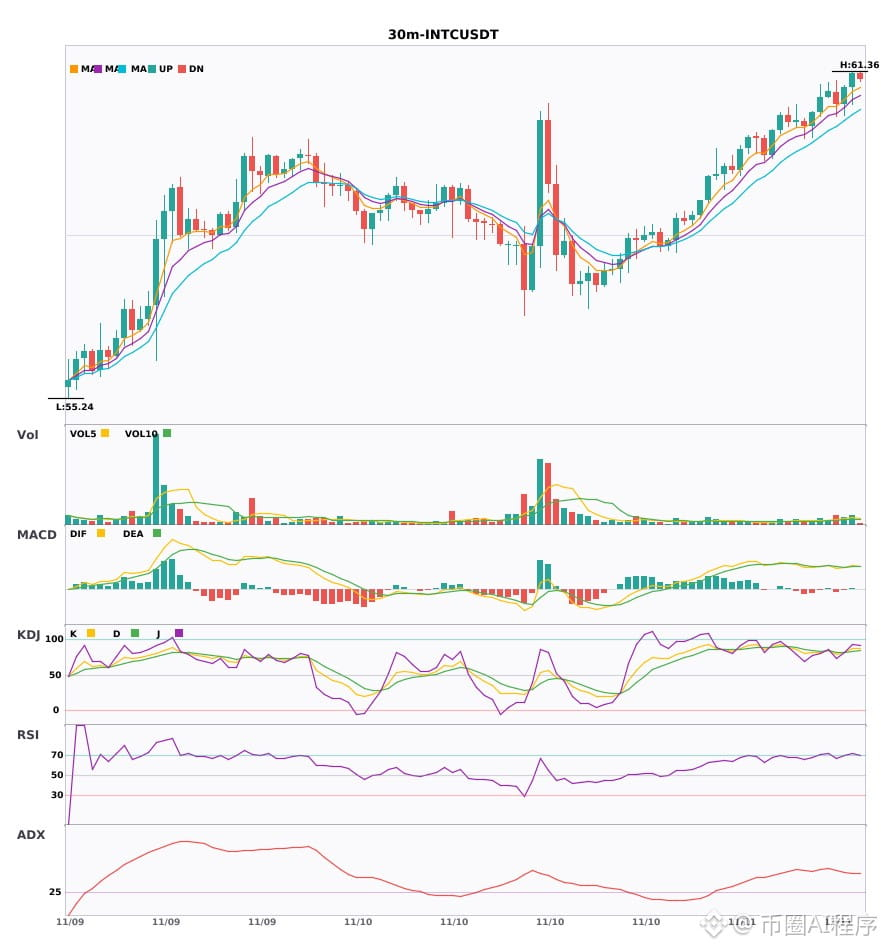
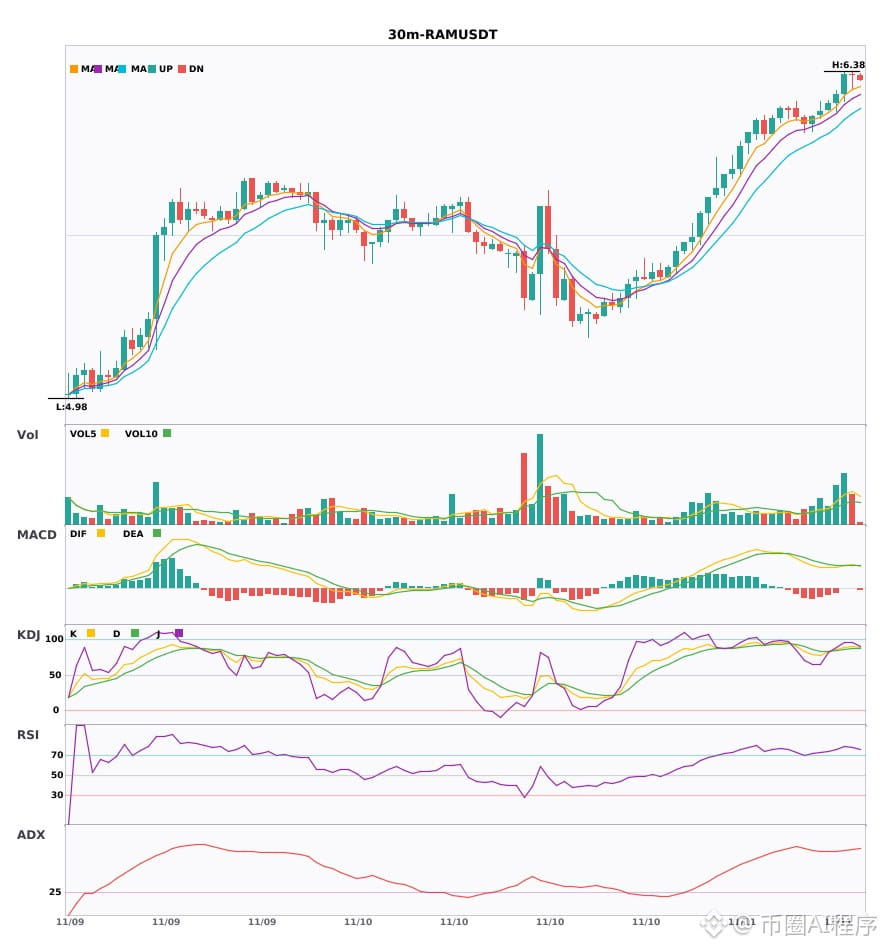
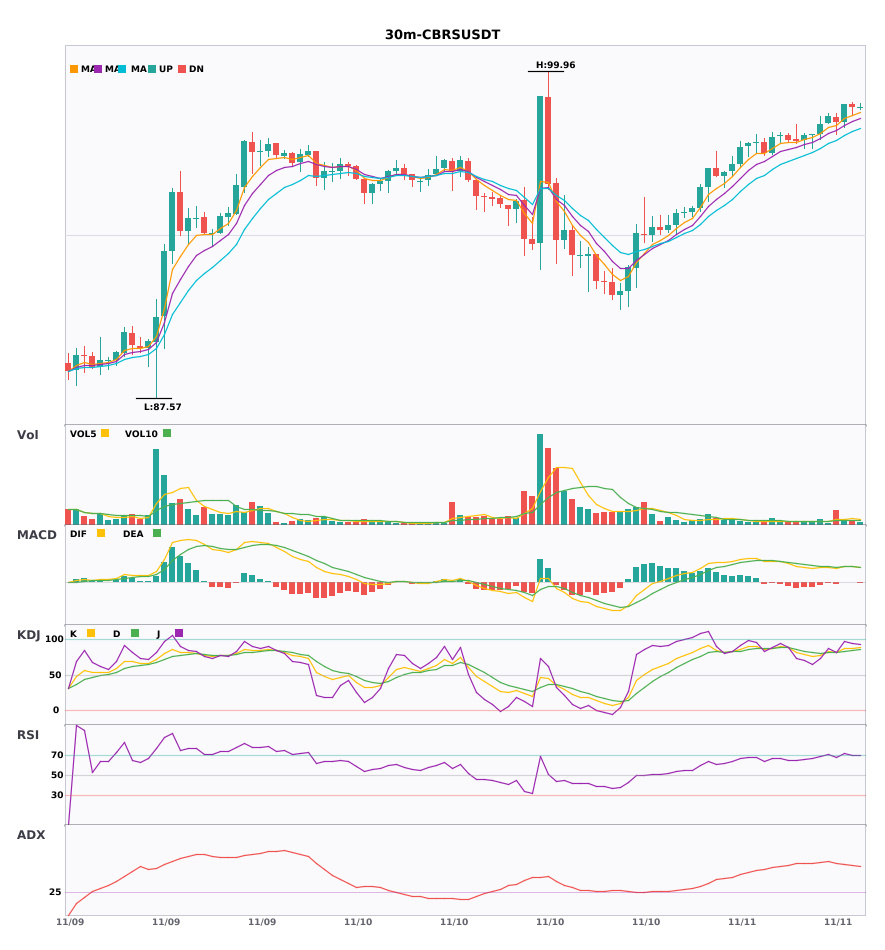
$INTC / $RAM / $CBRS 30-minute bullish signals, 4-hour bullish trend confirmed 🔥
════════════════════
🔴 $INTC 30-minute bullish signal
⚠️ Technical analysis: 4-hour bullish confluence confirmed | 30-minute entry: MACD golden cross above zero, bullish momentum released | EMA5 > EMA8 > EMA13, bullish alignment | KDJ golden cross, short-term outlook bullish (K: 86.6, D: 83.6) | Increased volume (1.5x)
════════════════════
🔴 $RAM 30-minute bullish signal
⚠️ Technical analysis: 4-hour bullish confluence confirmed | 30-minute entry: MACD golden cross above zero, bullish momentum released | EMA5 > EMA8 > EMA13, bullish alignment | KDJ in overbought territory, watch for pullback risk (K: 88.6, D: 85.3) | Increased volume (2.4x)
════════════════════
🔴 $CBRS 30-minute bullish signal
⚠️ Technical analysis: 4-hour bullish confluence confirmed | 30-minute entry: MACD golden cross above zero, bullish momentum released | EMA5 > EMA8 > EMA13, bullish alignment | KDJ in overbought territory, watch for pullback risk (K: 87.6, D: 83.2) | Volume surge (3.1x)
════════════════════
🔔 Follow for the latest market movements 🔔
#多周期共振 #INTC #RAM #CBRS
📌 When trading, pay attention to whether the candlestick pattern meets expectations
$INTC / $RAM / $CBRS 30-minute bullish signals, 4-hour bullish trend confirmed 🔥
════════════════════
🔴 $INTC 30-minute bullish signal
⚠️ Technical analysis: 4-hour bullish confluence confirmed | 30-minute entry: MACD golden cross above zero, bullish momentum released | EMA5 > EMA8 > EMA13, bullish alignment | KDJ golden cross, short-term outlook bullish (K: 86.6, D: 83.6) | Increased volume (1.5x)
════════════════════
🔴 $RAM 30-minute bullish signal
⚠️ Technical analysis: 4-hour bullish confluence confirmed | 30-minute entry: MACD golden cross above zero, bullish momentum released | EMA5 > EMA8 > EMA13, bullish alignment | KDJ in overbought territory, watch for pullback risk (K: 88.6, D: 85.3) | Increased volume (2.4x)
════════════════════
🔴 $CBRS 30-minute bullish signal
⚠️ Technical analysis: 4-hour bullish confluence confirmed | 30-minute entry: MACD golden cross above zero, bullish momentum released | EMA5 > EMA8 > EMA13, bullish alignment | KDJ in overbought territory, watch for pullback risk (K: 87.6, D: 83.2) | Volume surge (3.1x)
════════════════════
🔔 Follow for the latest market movements 🔔
#多周期共振 #INTC #RAM #CBRS
📌 When trading, pay attention to whether the candlestick pattern meets expectations
════════════════════
🔴 $INTC 30-minute bullish signal
⚠️ Technical analysis: 4-hour bullish confluence confirmed | 30-minute entry: MACD golden cross above zero, bullish momentum released | EMA5 > EMA8 > EMA13, bullish alignment | KDJ golden cross, short-term outlook bullish (K: 86.6, D: 83.6) | Increased volume (1.5x)
════════════════════
🔴 $RAM 30-minute bullish signal
⚠️ Technical analysis: 4-hour bullish confluence confirmed | 30-minute entry: MACD golden cross above zero, bullish momentum released | EMA5 > EMA8 > EMA13, bullish alignment | KDJ in overbought territory, watch for pullback risk (K: 88.6, D: 85.3) | Increased volume (2.4x)
════════════════════
🔴 $CBRS 30-minute bullish signal
⚠️ Technical analysis: 4-hour bullish confluence confirmed | 30-minute entry: MACD golden cross above zero, bullish momentum released | EMA5 > EMA8 > EMA13, bullish alignment | KDJ in overbought territory, watch for pullback risk (K: 87.6, D: 83.2) | Volume surge (3.1x)
════════════════════
🔔 Follow for the latest market movements 🔔
#多周期共振 #INTC #RAM #CBRS
📌 When trading, pay attention to whether the candlestick pattern meets expectations
6

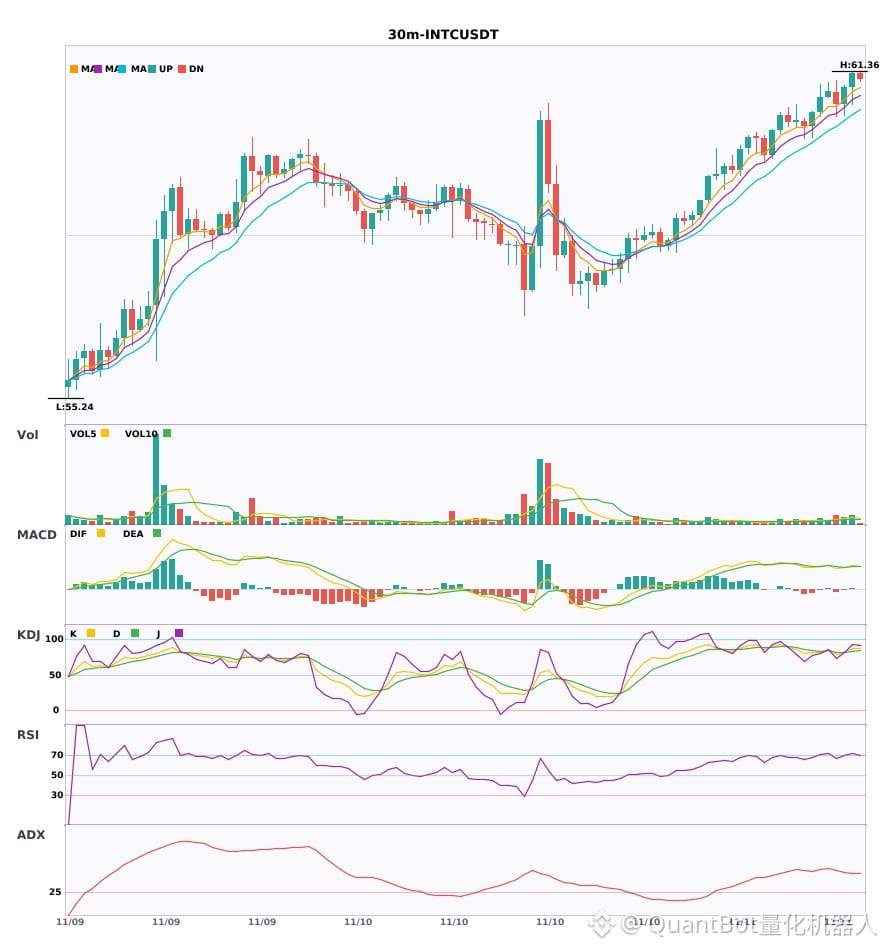
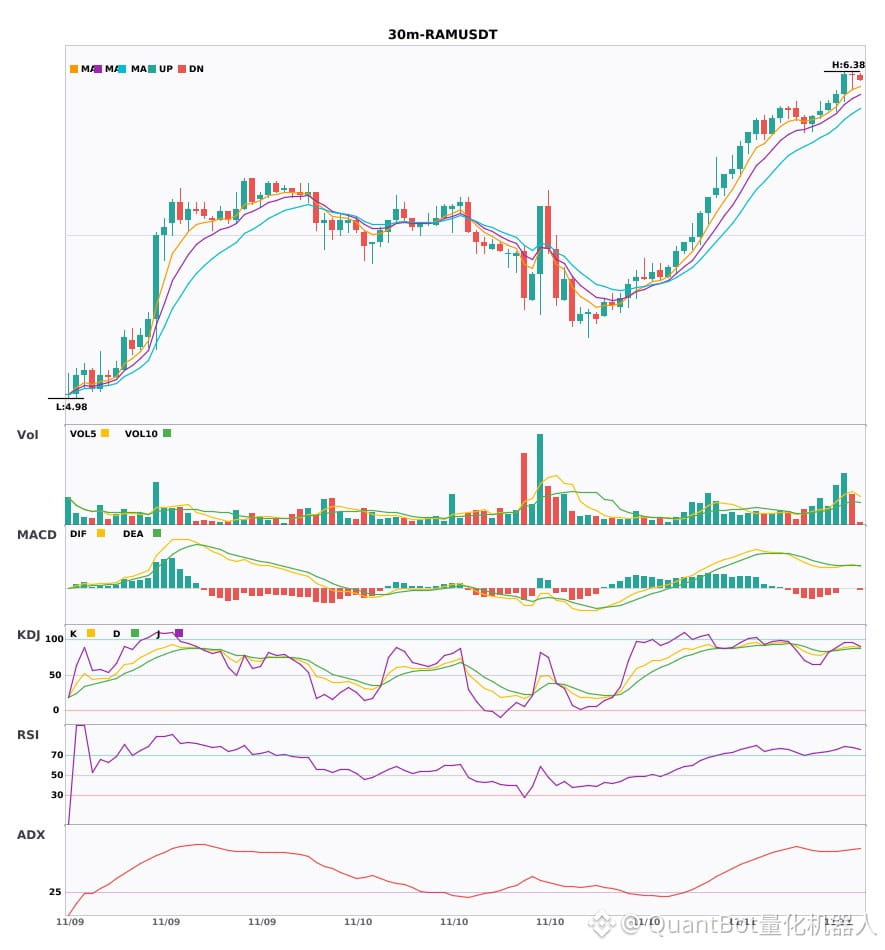
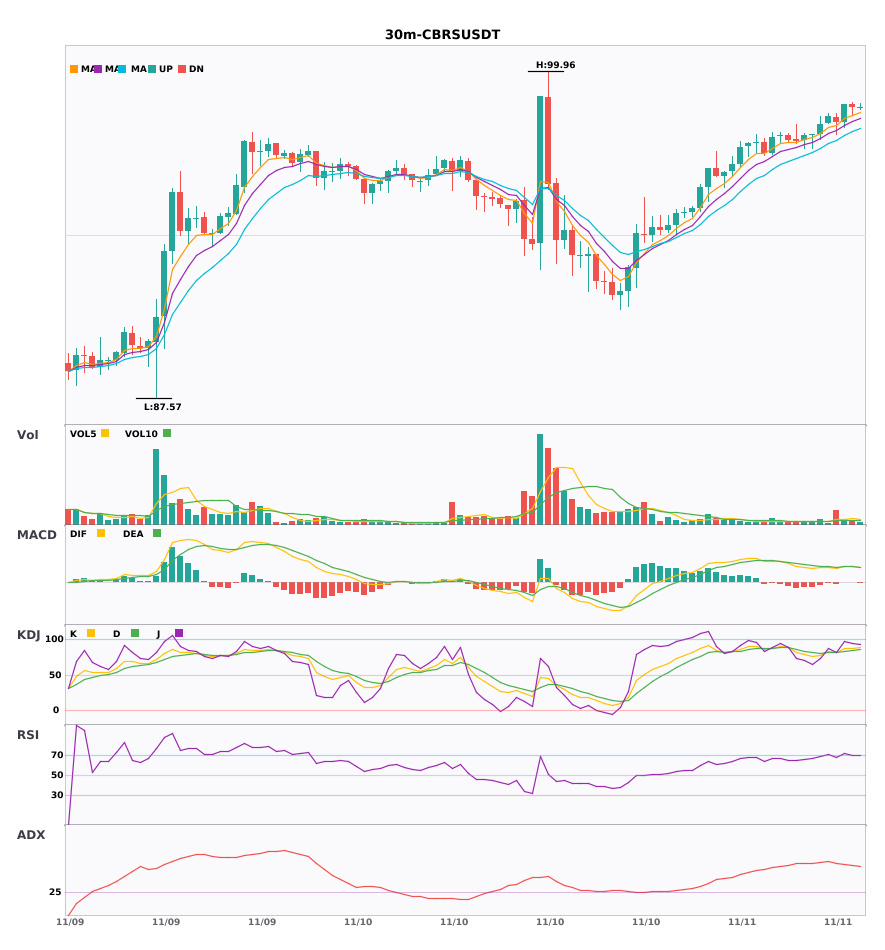
$INTC / $RAM / $CBRS 30-minute convergence turns bullish, with bullish signals appearing simultaneously
📈 $INTC | 30-minute bullish signal
━━━━━━━━━━━━━━━━━━
Technical analysis: ADX(47) Very strong trend (beware of an overbought pullback) | MACD bullish crossover above zero, bullish momentum released | EMA5 > EMA8 > EMA13, bullish alignment | KDJ bullish crossover, short-term outlook is bullish (K: 86.6, D: 83.6) | Volume increased (1.5x)
Price change: 0.4100%
📈 $RAM | 30-minute bullish signal
━━━━━━━━━━━━━━━━━━
Technical analysis: ADX(73) Very strong trend (beware of an overbought pullback) | MACD bullish crossover above zero, bullish momentum released | EMA5 > EMA8 > EMA13, bullish alignment | KDJ in overbought territory, watch for pullback risk (K: 88.6, D: 85.3) | Volume increased (2.4x)
Price change: 1.3500%
📈 $CBRS | 30-minute bullish signal
━━━━━━━━━━━━━━━━━━
Technical analysis: ADX(57) Very strong trend (beware of an overbought pullback) | MACD bullish crossover above zero, bullish momentum released | EMA5 > EMA8 > EMA13, bullish alignment | KDJ in overbought territory, watch for pullback risk (K: 87.6, D: 83.2) | Volume surged (3.1x)
Price change: 0.6700%
━━━━━━━━━━━━━━━━━━
#技术分析 #INTC #RAM #CBRS
📌 The above content is for reference only and does not constitute investment advice
$INTC / $RAM / $CBRS 30-minute convergence turns bullish, with bullish signals appearing simultaneously
📈 $INTC | 30-minute bullish signal
━━━━━━━━━━━━━━━━━━
Technical analysis: ADX(47) Very strong trend (beware of an overbought pullback) | MACD bullish crossover above zero, bullish momentum released | EMA5 > EMA8 > EMA13, bullish alignment | KDJ bullish crossover, short-term outlook is bullish (K: 86.6, D: 83.6) | Volume increased (1.5x)
Price change: 0.4100%
📈 $RAM | 30-minute bullish signal
━━━━━━━━━━━━━━━━━━
Technical analysis: ADX(73) Very strong trend (beware of an overbought pullback) | MACD bullish crossover above zero, bullish momentum released | EMA5 > EMA8 > EMA13, bullish alignment | KDJ in overbought territory, watch for pullback risk (K: 88.6, D: 85.3) | Volume increased (2.4x)
Price change: 1.3500%
📈 $CBRS | 30-minute bullish signal
━━━━━━━━━━━━━━━━━━
Technical analysis: ADX(57) Very strong trend (beware of an overbought pullback) | MACD bullish crossover above zero, bullish momentum released | EMA5 > EMA8 > EMA13, bullish alignment | KDJ in overbought territory, watch for pullback risk (K: 87.6, D: 83.2) | Volume surged (3.1x)
Price change: 0.6700%
━━━━━━━━━━━━━━━━━━
#技术分析 #INTC #RAM #CBRS
📌 The above content is for reference only and does not constitute investment advice
📈 $INTC | 30-minute bullish signal
━━━━━━━━━━━━━━━━━━
Technical analysis: ADX(47) Very strong trend (beware of an overbought pullback) | MACD bullish crossover above zero, bullish momentum released | EMA5 > EMA8 > EMA13, bullish alignment | KDJ bullish crossover, short-term outlook is bullish (K: 86.6, D: 83.6) | Volume increased (1.5x)
Price change: 0.4100%
📈 $RAM | 30-minute bullish signal
━━━━━━━━━━━━━━━━━━
Technical analysis: ADX(73) Very strong trend (beware of an overbought pullback) | MACD bullish crossover above zero, bullish momentum released | EMA5 > EMA8 > EMA13, bullish alignment | KDJ in overbought territory, watch for pullback risk (K: 88.6, D: 85.3) | Volume increased (2.4x)
Price change: 1.3500%
📈 $CBRS | 30-minute bullish signal
━━━━━━━━━━━━━━━━━━
Technical analysis: ADX(57) Very strong trend (beware of an overbought pullback) | MACD bullish crossover above zero, bullish momentum released | EMA5 > EMA8 > EMA13, bullish alignment | KDJ in overbought territory, watch for pullback risk (K: 87.6, D: 83.2) | Volume surged (3.1x)
Price change: 0.6700%
━━━━━━━━━━━━━━━━━━
#技术分析 #INTC #RAM #CBRS
📌 The above content is for reference only and does not constitute investment advice
12
·
--
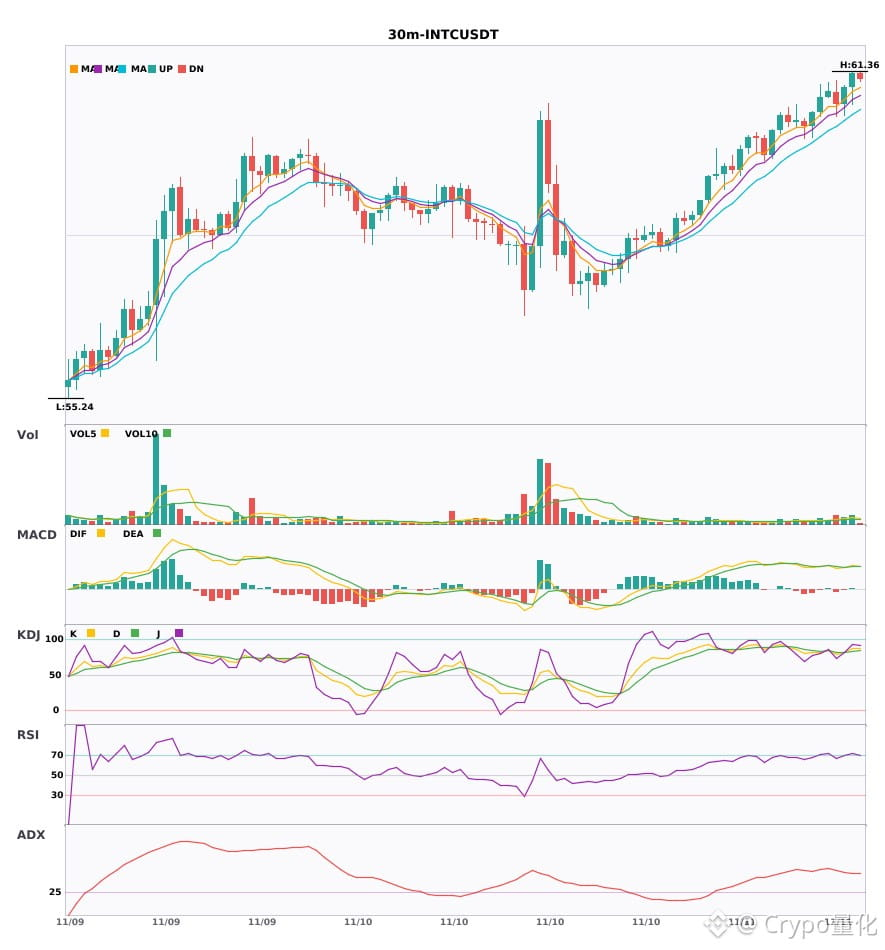
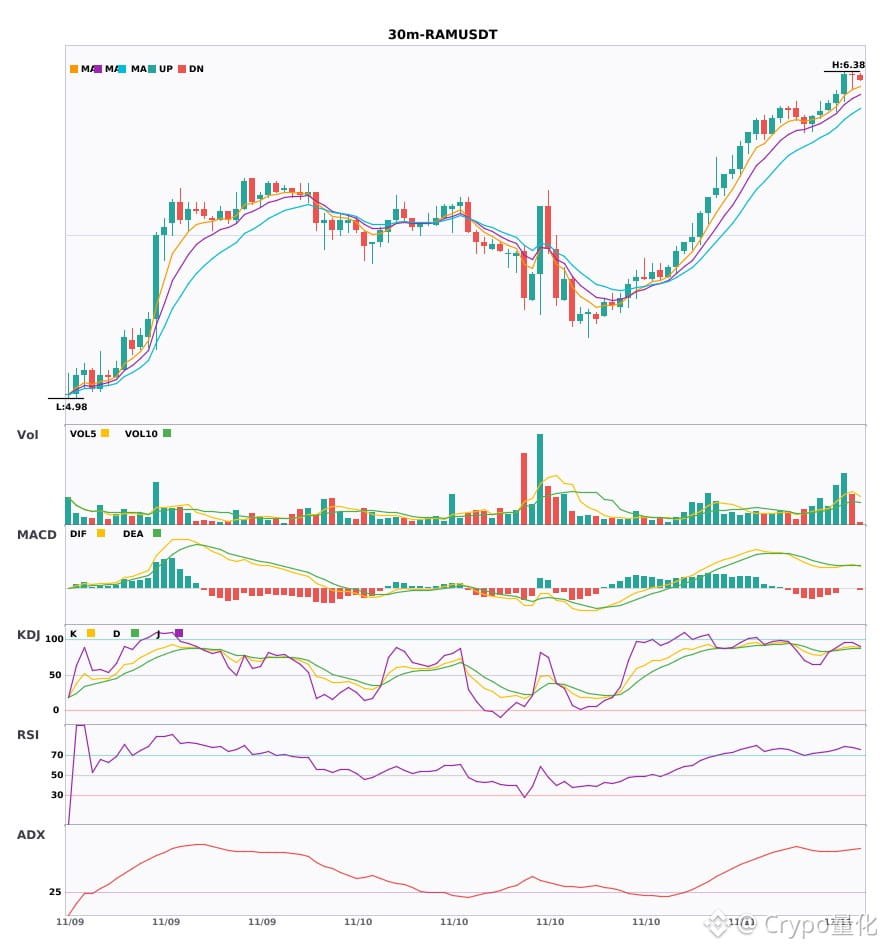
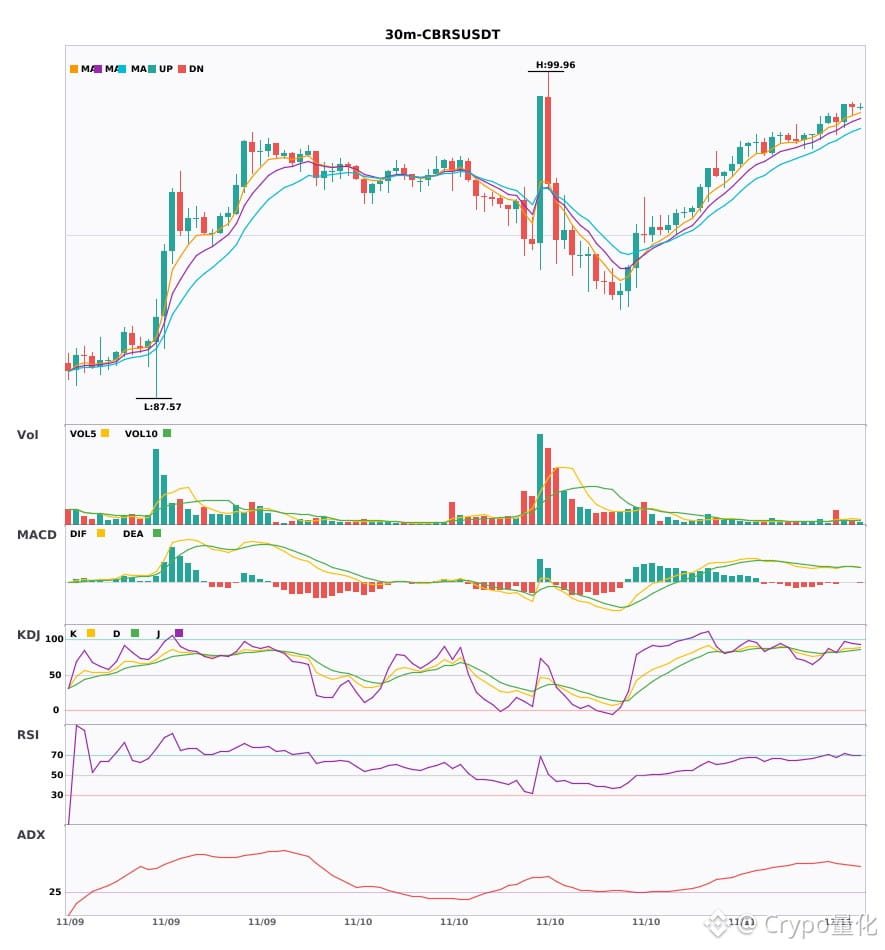
$INTC / $RAM / $CBRS 30-minute charts are bullish, with short-term confluence opportunities🔥
════════════════════
🔴 $INTC 30-minute bullish signal
⚠️Technical analysis: ADX(47) indicates a very strong trend (watch out for an overbought pullback) | MACD bullish crossover above zero, bullish momentum released | EMA5 > EMA8 > EMA13, bullish alignment | KDJ bullish crossover, short-term outlook is bullish (K: 86.6, D: 83.6) | Volume increased (1.5x)
════════════════════
🔴 $RAM 30-minute bullish signal
⚠️Technical analysis: ADX(73) indicates a very strong trend (watch out for an overbought pullback) | MACD bullish crossover above zero, bullish momentum released | EMA5 > EMA8 > EMA13, bullish alignment | KDJ in overbought territory; watch for pullback risk (K: 88.6, D: 85.3) | Volume increased (2.4x)
════════════════════
🔴 $CBRS 30-minute bullish signal
⚠️Technical analysis: ADX(57) indicates a very strong trend (watch out for an overbought pullback) | MACD bullish crossover above zero, bullish momentum released | EMA5 > EMA8 > EMA13, bullish alignment | KDJ in overbought territory; watch for pullback risk (K: 87.6, D: 83.2) | Volume surged (3.1x)
════════════════════
🔔 Follow for the latest market alerts 🔔
#技术分析 #INTC #RAM #CBRS
📌 When trading, pay attention to whether the candlestick pattern confirms the signal
$INTC / $RAM / $CBRS 30-minute charts are bullish, with short-term confluence opportunities🔥
════════════════════
🔴 $INTC 30-minute bullish signal
⚠️Technical analysis: ADX(47) indicates a very strong trend (watch out for an overbought pullback) | MACD bullish crossover above zero, bullish momentum released | EMA5 > EMA8 > EMA13, bullish alignment | KDJ bullish crossover, short-term outlook is bullish (K: 86.6, D: 83.6) | Volume increased (1.5x)
════════════════════
🔴 $RAM 30-minute bullish signal
⚠️Technical analysis: ADX(73) indicates a very strong trend (watch out for an overbought pullback) | MACD bullish crossover above zero, bullish momentum released | EMA5 > EMA8 > EMA13, bullish alignment | KDJ in overbought territory; watch for pullback risk (K: 88.6, D: 85.3) | Volume increased (2.4x)
════════════════════
🔴 $CBRS 30-minute bullish signal
⚠️Technical analysis: ADX(57) indicates a very strong trend (watch out for an overbought pullback) | MACD bullish crossover above zero, bullish momentum released | EMA5 > EMA8 > EMA13, bullish alignment | KDJ in overbought territory; watch for pullback risk (K: 87.6, D: 83.2) | Volume surged (3.1x)
════════════════════
🔔 Follow for the latest market alerts 🔔
#技术分析 #INTC #RAM #CBRS
📌 When trading, pay attention to whether the candlestick pattern confirms the signal
════════════════════
🔴 $INTC 30-minute bullish signal
⚠️Technical analysis: ADX(47) indicates a very strong trend (watch out for an overbought pullback) | MACD bullish crossover above zero, bullish momentum released | EMA5 > EMA8 > EMA13, bullish alignment | KDJ bullish crossover, short-term outlook is bullish (K: 86.6, D: 83.6) | Volume increased (1.5x)
════════════════════
🔴 $RAM 30-minute bullish signal
⚠️Technical analysis: ADX(73) indicates a very strong trend (watch out for an overbought pullback) | MACD bullish crossover above zero, bullish momentum released | EMA5 > EMA8 > EMA13, bullish alignment | KDJ in overbought territory; watch for pullback risk (K: 88.6, D: 85.3) | Volume increased (2.4x)
════════════════════
🔴 $CBRS 30-minute bullish signal
⚠️Technical analysis: ADX(57) indicates a very strong trend (watch out for an overbought pullback) | MACD bullish crossover above zero, bullish momentum released | EMA5 > EMA8 > EMA13, bullish alignment | KDJ in overbought territory; watch for pullback risk (K: 87.6, D: 83.2) | Volume surged (3.1x)
════════════════════
🔔 Follow for the latest market alerts 🔔
#技术分析 #INTC #RAM #CBRS
📌 When trading, pay attention to whether the candlestick pattern confirms the signal
10
·
--
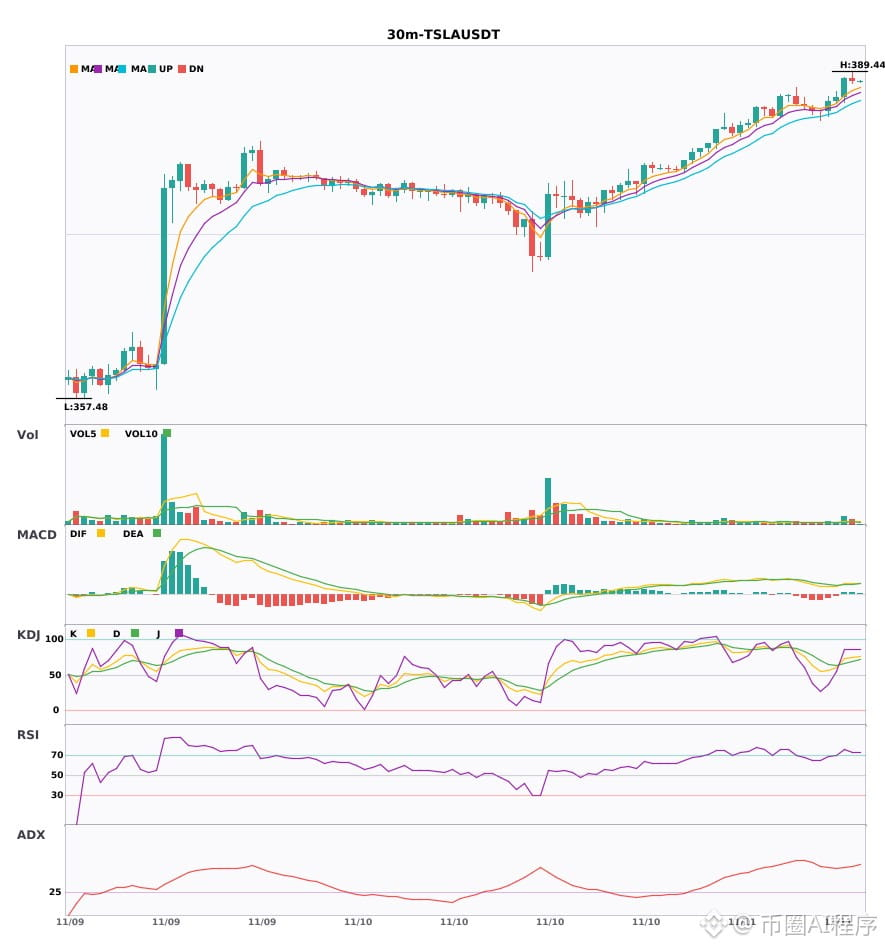
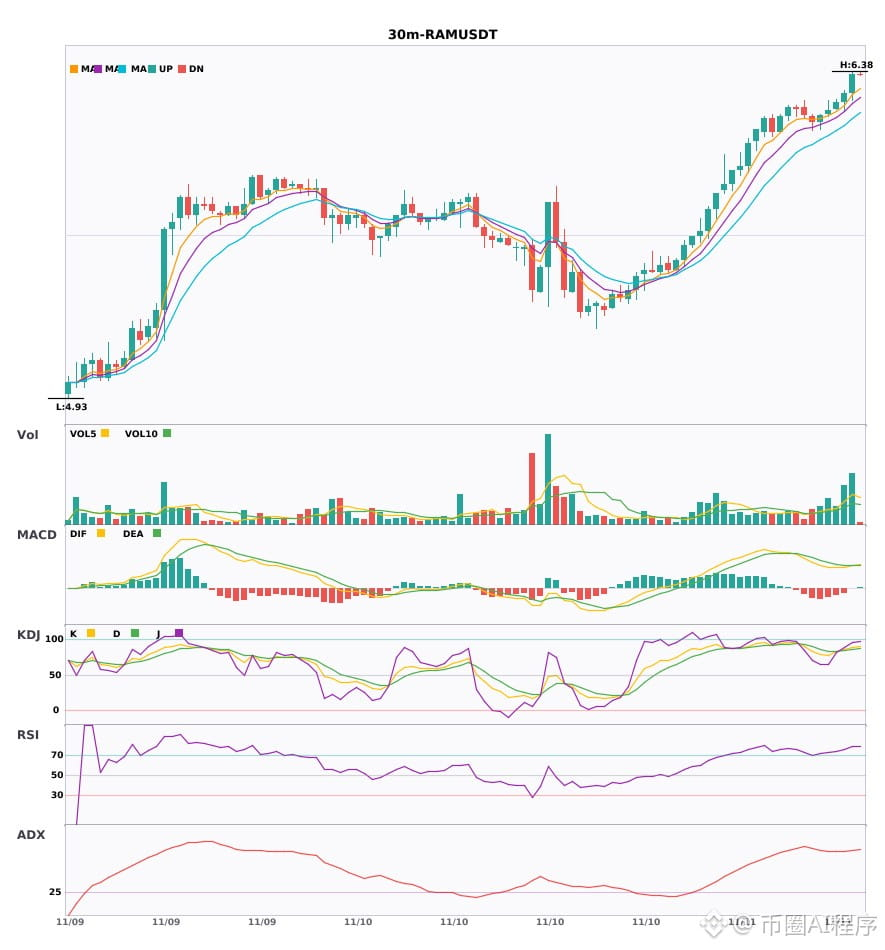
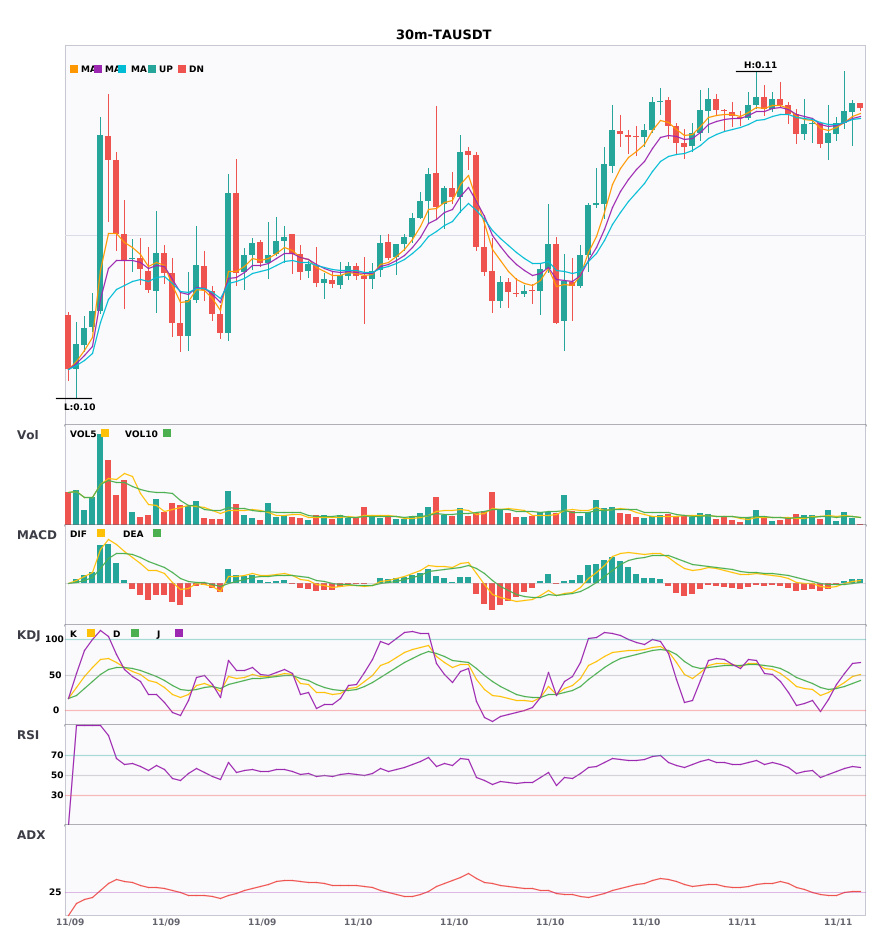
Multi-timeframe resonance: $TSLA / $RAM / $TA 30-minute strength, 4-hour bullish trend confirmed 🔥
════════════════════
🔴 $TSLA 30-minute bullish signal
⚠️Technical analysis: 4-hour bullish resonance confirmed | 30-minute entry: MACD golden cross above zero, bullish momentum released | EMA5 > EMA8 > EMA13, bullish alignment | KDJ golden cross, short-term outlook bullish (K: 73.1, D: 66.7) | Volume surge (2.8x)
════════════════════
🔴 $RAM 30-minute bullish signal
⚠️Technical analysis: 4-hour bullish resonance confirmed | 30-minute entry: MACD golden cross above zero, bullish momentum released | EMA5 > EMA8 > EMA13, bullish alignment | KDJ in overbought territory; watch for pullback risk (K: 88.6, D: 85.3) | Increased volume (2.4x)
════════════════════
🔴 $TA 30-minute bullish signal
⚠️Technical analysis: 4-hour bullish resonance confirmed | 30-minute entry: MACD DIF breaks above the zero line, trend turns bullish | EMA5 crosses above EMA8, short-term outlook turns bullish | KDJ is weak, bears have the upper hand (K: 47.7, D: 38.6) | Increased volume (1.6x)
════════════════════
🔔 Follow us for first-hand market alerts 🔔
#多周期共振 #TSLA #RAM #TA
📌 When trading, pay attention to whether the candlestick patterns align
Multi-timeframe resonance: $TSLA / $RAM / $TA 30-minute strength, 4-hour bullish trend confirmed 🔥
════════════════════
🔴 $TSLA 30-minute bullish signal
⚠️Technical analysis: 4-hour bullish resonance confirmed | 30-minute entry: MACD golden cross above zero, bullish momentum released | EMA5 > EMA8 > EMA13, bullish alignment | KDJ golden cross, short-term outlook bullish (K: 73.1, D: 66.7) | Volume surge (2.8x)
════════════════════
🔴 $RAM 30-minute bullish signal
⚠️Technical analysis: 4-hour bullish resonance confirmed | 30-minute entry: MACD golden cross above zero, bullish momentum released | EMA5 > EMA8 > EMA13, bullish alignment | KDJ in overbought territory; watch for pullback risk (K: 88.6, D: 85.3) | Increased volume (2.4x)
════════════════════
🔴 $TA 30-minute bullish signal
⚠️Technical analysis: 4-hour bullish resonance confirmed | 30-minute entry: MACD DIF breaks above the zero line, trend turns bullish | EMA5 crosses above EMA8, short-term outlook turns bullish | KDJ is weak, bears have the upper hand (K: 47.7, D: 38.6) | Increased volume (1.6x)
════════════════════
🔔 Follow us for first-hand market alerts 🔔
#多周期共振 #TSLA #RAM #TA
📌 When trading, pay attention to whether the candlestick patterns align
════════════════════
🔴 $TSLA 30-minute bullish signal
⚠️Technical analysis: 4-hour bullish resonance confirmed | 30-minute entry: MACD golden cross above zero, bullish momentum released | EMA5 > EMA8 > EMA13, bullish alignment | KDJ golden cross, short-term outlook bullish (K: 73.1, D: 66.7) | Volume surge (2.8x)
════════════════════
🔴 $RAM 30-minute bullish signal
⚠️Technical analysis: 4-hour bullish resonance confirmed | 30-minute entry: MACD golden cross above zero, bullish momentum released | EMA5 > EMA8 > EMA13, bullish alignment | KDJ in overbought territory; watch for pullback risk (K: 88.6, D: 85.3) | Increased volume (2.4x)
════════════════════
🔴 $TA 30-minute bullish signal
⚠️Technical analysis: 4-hour bullish resonance confirmed | 30-minute entry: MACD DIF breaks above the zero line, trend turns bullish | EMA5 crosses above EMA8, short-term outlook turns bullish | KDJ is weak, bears have the upper hand (K: 47.7, D: 38.6) | Increased volume (1.6x)
════════════════════
🔔 Follow us for first-hand market alerts 🔔
#多周期共振 #TSLA #RAM #TA
📌 When trading, pay attention to whether the candlestick patterns align
5
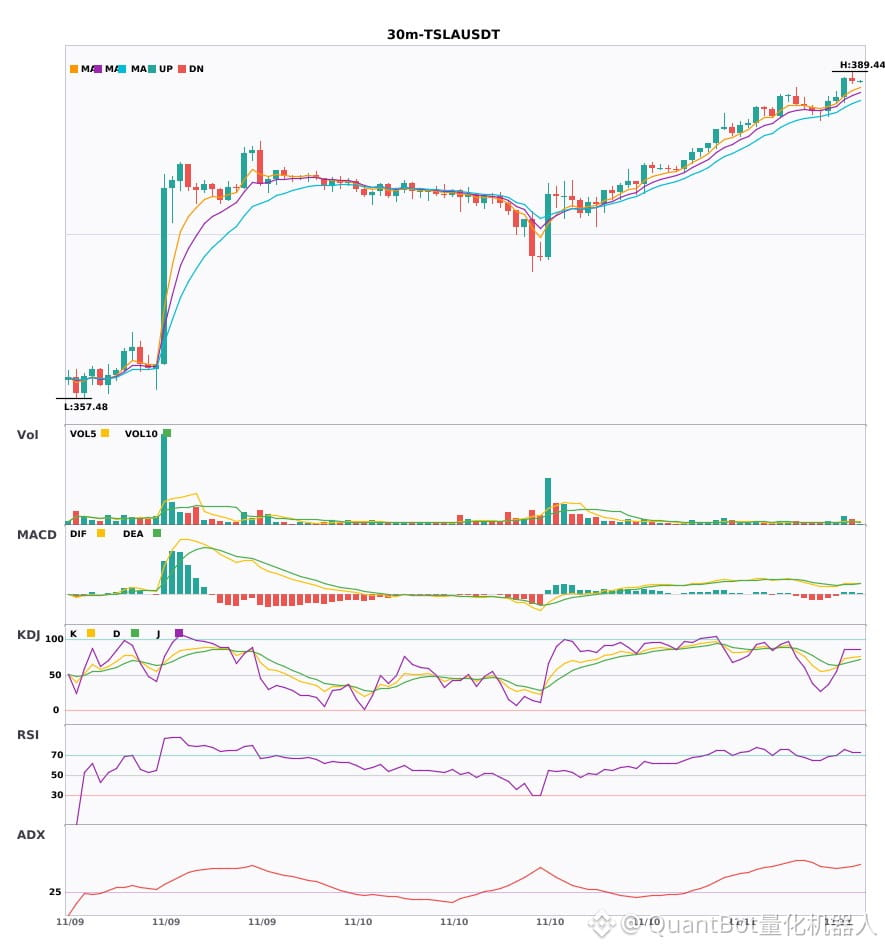
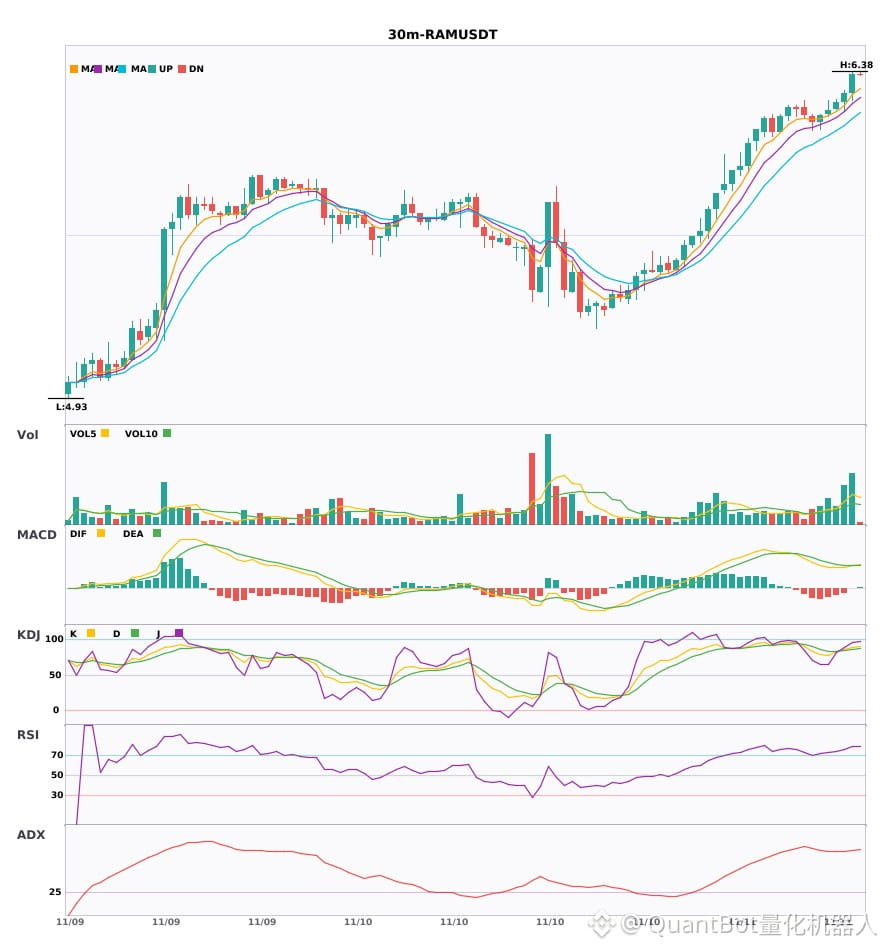
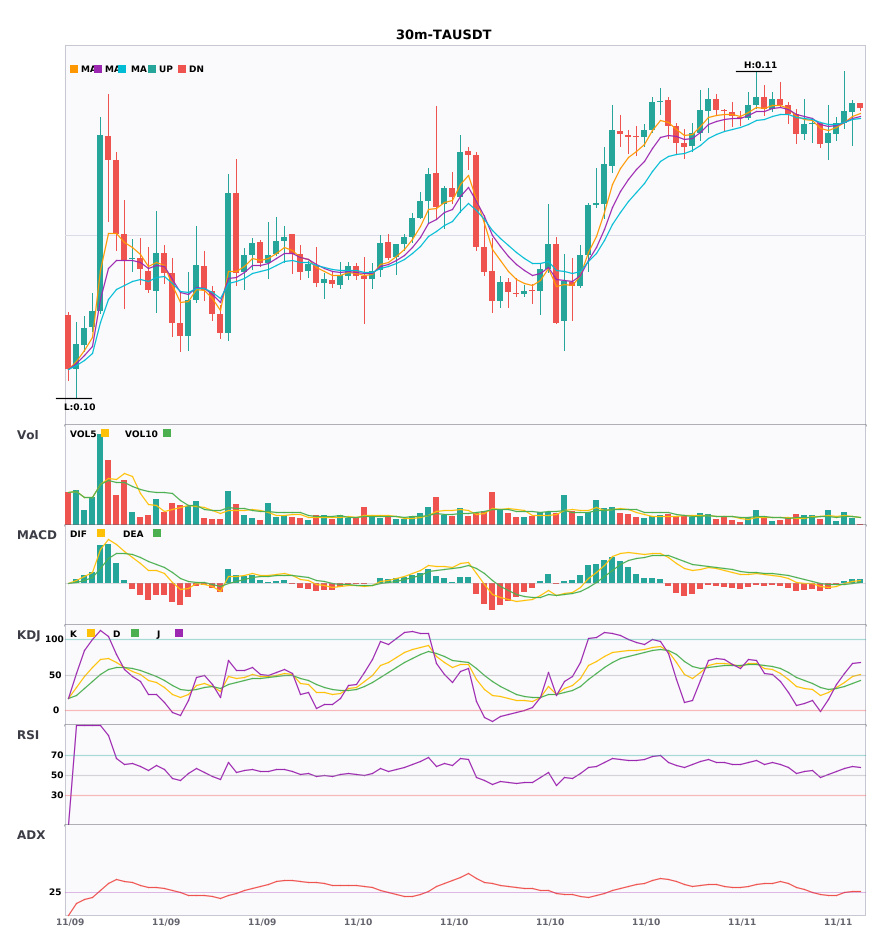
$TSLA / $RAM / $TA 30-minute technical indicators are strengthening in sync. Which has greater breakout potential?
📈 $TSLA | 30-minute bullish signal
━━━━━━━━━━━━━━━━━━
Technical analysis: ADX(53) Very strong trend (beware of pullback from overbought conditions) | MACD golden cross above zero, bullish momentum emerging | EMA5 greater than EMA8, greater than EMA13: bullish alignment | KDJ golden cross, bullish in the short term (K: 73.1, D: 66.7) | Volume surge (2.8x)
Price change: 0.4700%
📈 $RAM | 30-minute bullish signal
━━━━━━━━━━━━━━━━━━
Technical analysis: ADX(73) Very strong trend (beware of pullback from overbought conditions) | MACD golden cross above zero, bullish momentum emerging | EMA5 greater than EMA8, greater than EMA13: bullish alignment | KDJ in overbought territory, watch for pullback risk (K: 88.6, D: 85.3) | Volume increase (2.4x)
Price change: 1.3500%
📈 $TA | 30-minute bullish signal
━━━━━━━━━━━━━━━━━━
Technical analysis: ADX(26) Trend is forming; entry may be considered | MACD DIF breaks above the zero line, trend turns bullish | EMA5 crosses above EMA8, short-term trend turns bullish | KDJ is weak, with bears in control (K: 47.7, D: 38.6) | Volume increase (1.6x)
Price change: 0.3100%
━━━━━━━━━━━━━━━━━━
#技术分析 #TSLA #RAM #TA
📌 The above content is for reference only and does not constitute investment advice
$TSLA / $RAM / $TA 30-minute technical indicators are strengthening in sync. Which has greater breakout potential?
📈 $TSLA | 30-minute bullish signal
━━━━━━━━━━━━━━━━━━
Technical analysis: ADX(53) Very strong trend (beware of pullback from overbought conditions) | MACD golden cross above zero, bullish momentum emerging | EMA5 greater than EMA8, greater than EMA13: bullish alignment | KDJ golden cross, bullish in the short term (K: 73.1, D: 66.7) | Volume surge (2.8x)
Price change: 0.4700%
📈 $RAM | 30-minute bullish signal
━━━━━━━━━━━━━━━━━━
Technical analysis: ADX(73) Very strong trend (beware of pullback from overbought conditions) | MACD golden cross above zero, bullish momentum emerging | EMA5 greater than EMA8, greater than EMA13: bullish alignment | KDJ in overbought territory, watch for pullback risk (K: 88.6, D: 85.3) | Volume increase (2.4x)
Price change: 1.3500%
📈 $TA | 30-minute bullish signal
━━━━━━━━━━━━━━━━━━
Technical analysis: ADX(26) Trend is forming; entry may be considered | MACD DIF breaks above the zero line, trend turns bullish | EMA5 crosses above EMA8, short-term trend turns bullish | KDJ is weak, with bears in control (K: 47.7, D: 38.6) | Volume increase (1.6x)
Price change: 0.3100%
━━━━━━━━━━━━━━━━━━
#技术分析 #TSLA #RAM #TA
📌 The above content is for reference only and does not constitute investment advice
📈 $TSLA | 30-minute bullish signal
━━━━━━━━━━━━━━━━━━
Technical analysis: ADX(53) Very strong trend (beware of pullback from overbought conditions) | MACD golden cross above zero, bullish momentum emerging | EMA5 greater than EMA8, greater than EMA13: bullish alignment | KDJ golden cross, bullish in the short term (K: 73.1, D: 66.7) | Volume surge (2.8x)
Price change: 0.4700%
📈 $RAM | 30-minute bullish signal
━━━━━━━━━━━━━━━━━━
Technical analysis: ADX(73) Very strong trend (beware of pullback from overbought conditions) | MACD golden cross above zero, bullish momentum emerging | EMA5 greater than EMA8, greater than EMA13: bullish alignment | KDJ in overbought territory, watch for pullback risk (K: 88.6, D: 85.3) | Volume increase (2.4x)
Price change: 1.3500%
📈 $TA | 30-minute bullish signal
━━━━━━━━━━━━━━━━━━
Technical analysis: ADX(26) Trend is forming; entry may be considered | MACD DIF breaks above the zero line, trend turns bullish | EMA5 crosses above EMA8, short-term trend turns bullish | KDJ is weak, with bears in control (K: 47.7, D: 38.6) | Volume increase (1.6x)
Price change: 0.3100%
━━━━━━━━━━━━━━━━━━
#技术分析 #TSLA #RAM #TA
📌 The above content is for reference only and does not constitute investment advice
8
·
--
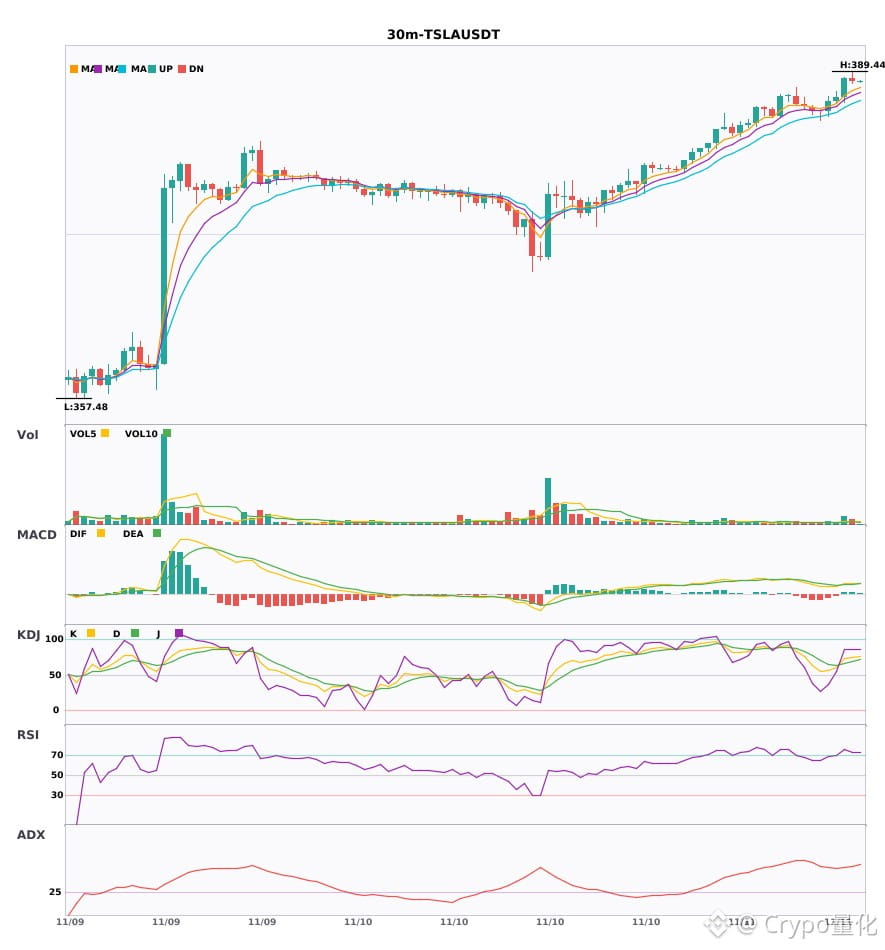
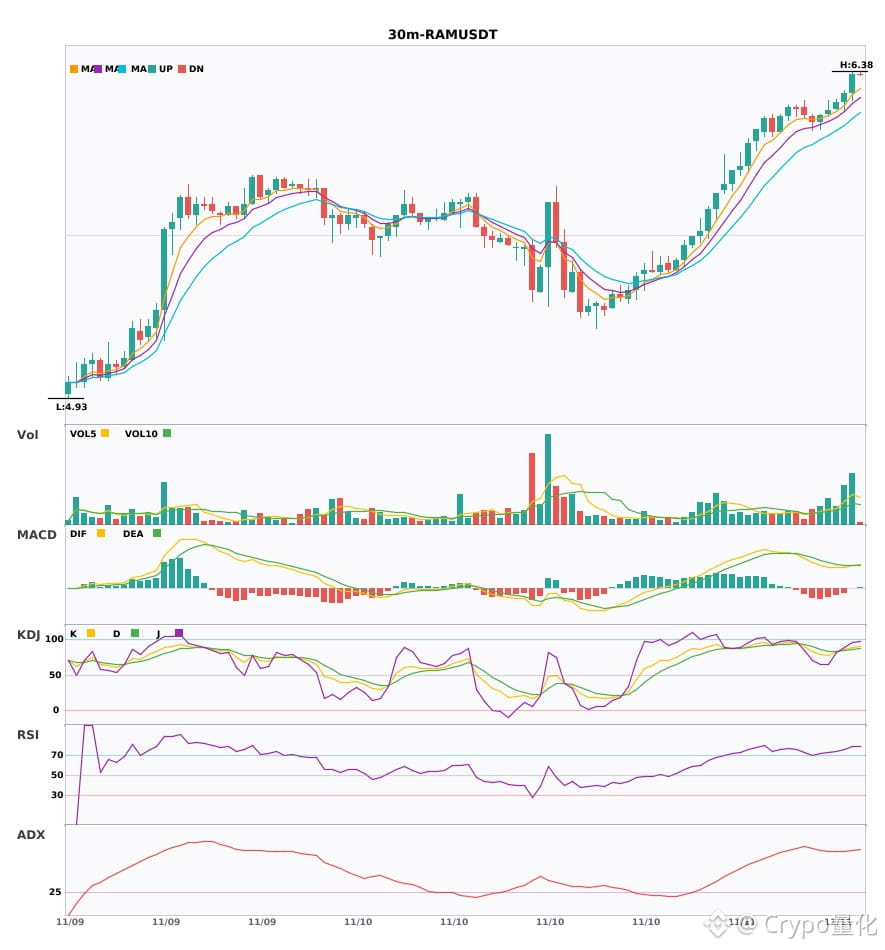
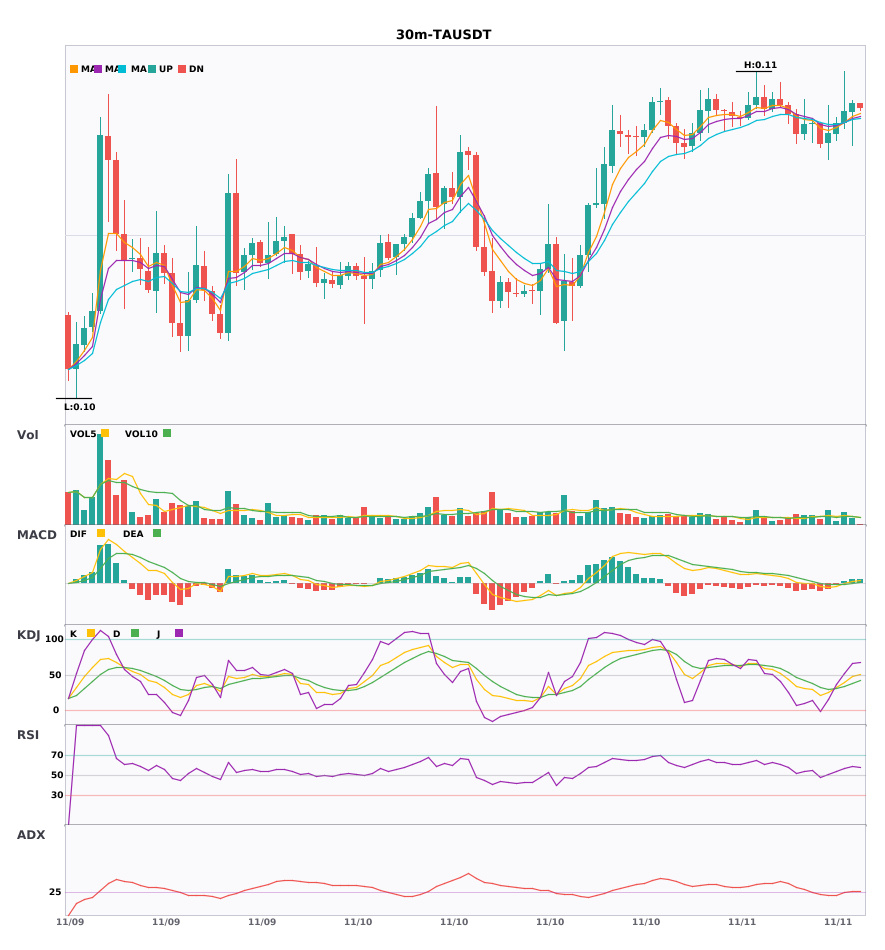
$TSLA / $RAM / $TA 30-minute confluence turns bullish; bullish signals appear simultaneously 🔥
════════════════════
🔴 $TSLA 30-minute bullish signal
⚠️ Technical analysis: ADX (53) indicates a very strong trend (beware of an overbought pullback) | MACD golden cross above zero, bullish momentum released | EMA5 > EMA8 > EMA13, bullish alignment | KDJ golden cross, short-term outlook bullish (K: 73.1, D: 66.7) | Volume surge (2.8x)
════════════════════
🔴 $RAM 30-minute bullish signal
⚠️ Technical analysis: ADX (73) indicates a very strong trend (beware of an overbought pullback) | MACD golden cross above zero, bullish momentum released | EMA5 > EMA8 > EMA13, bullish alignment | KDJ in overbought territory; beware of pullback risk (K: 88.6, D: 85.3) | Volume increase (2.4x)
════════════════════
🔴 $TA 30-minute bullish signal
⚠️ Technical analysis: ADX (26), trend is taking shape; entry is possible | MACD DIF breaks above the zero line, trend turns bullish | EMA5 crosses above EMA8, short-term outlook turns bullish | KDJ is weak, bears have the upper hand (K: 47.7, D: 38.6) | Volume increase (1.6x)
════════════════════
🔔 Follow for the latest market movements 🔔
#技术分析 #TSLA #RAM #TA
📌 When trading, pay attention to whether the candlestick pattern confirms the signal
$TSLA / $RAM / $TA 30-minute confluence turns bullish; bullish signals appear simultaneously 🔥
════════════════════
🔴 $TSLA 30-minute bullish signal
⚠️ Technical analysis: ADX (53) indicates a very strong trend (beware of an overbought pullback) | MACD golden cross above zero, bullish momentum released | EMA5 > EMA8 > EMA13, bullish alignment | KDJ golden cross, short-term outlook bullish (K: 73.1, D: 66.7) | Volume surge (2.8x)
════════════════════
🔴 $RAM 30-minute bullish signal
⚠️ Technical analysis: ADX (73) indicates a very strong trend (beware of an overbought pullback) | MACD golden cross above zero, bullish momentum released | EMA5 > EMA8 > EMA13, bullish alignment | KDJ in overbought territory; beware of pullback risk (K: 88.6, D: 85.3) | Volume increase (2.4x)
════════════════════
🔴 $TA 30-minute bullish signal
⚠️ Technical analysis: ADX (26), trend is taking shape; entry is possible | MACD DIF breaks above the zero line, trend turns bullish | EMA5 crosses above EMA8, short-term outlook turns bullish | KDJ is weak, bears have the upper hand (K: 47.7, D: 38.6) | Volume increase (1.6x)
════════════════════
🔔 Follow for the latest market movements 🔔
#技术分析 #TSLA #RAM #TA
📌 When trading, pay attention to whether the candlestick pattern confirms the signal
════════════════════
🔴 $TSLA 30-minute bullish signal
⚠️ Technical analysis: ADX (53) indicates a very strong trend (beware of an overbought pullback) | MACD golden cross above zero, bullish momentum released | EMA5 > EMA8 > EMA13, bullish alignment | KDJ golden cross, short-term outlook bullish (K: 73.1, D: 66.7) | Volume surge (2.8x)
════════════════════
🔴 $RAM 30-minute bullish signal
⚠️ Technical analysis: ADX (73) indicates a very strong trend (beware of an overbought pullback) | MACD golden cross above zero, bullish momentum released | EMA5 > EMA8 > EMA13, bullish alignment | KDJ in overbought territory; beware of pullback risk (K: 88.6, D: 85.3) | Volume increase (2.4x)
════════════════════
🔴 $TA 30-minute bullish signal
⚠️ Technical analysis: ADX (26), trend is taking shape; entry is possible | MACD DIF breaks above the zero line, trend turns bullish | EMA5 crosses above EMA8, short-term outlook turns bullish | KDJ is weak, bears have the upper hand (K: 47.7, D: 38.6) | Volume increase (1.6x)
════════════════════
🔔 Follow for the latest market movements 🔔
#技术分析 #TSLA #RAM #TA
📌 When trading, pay attention to whether the candlestick pattern confirms the signal
9
·
--
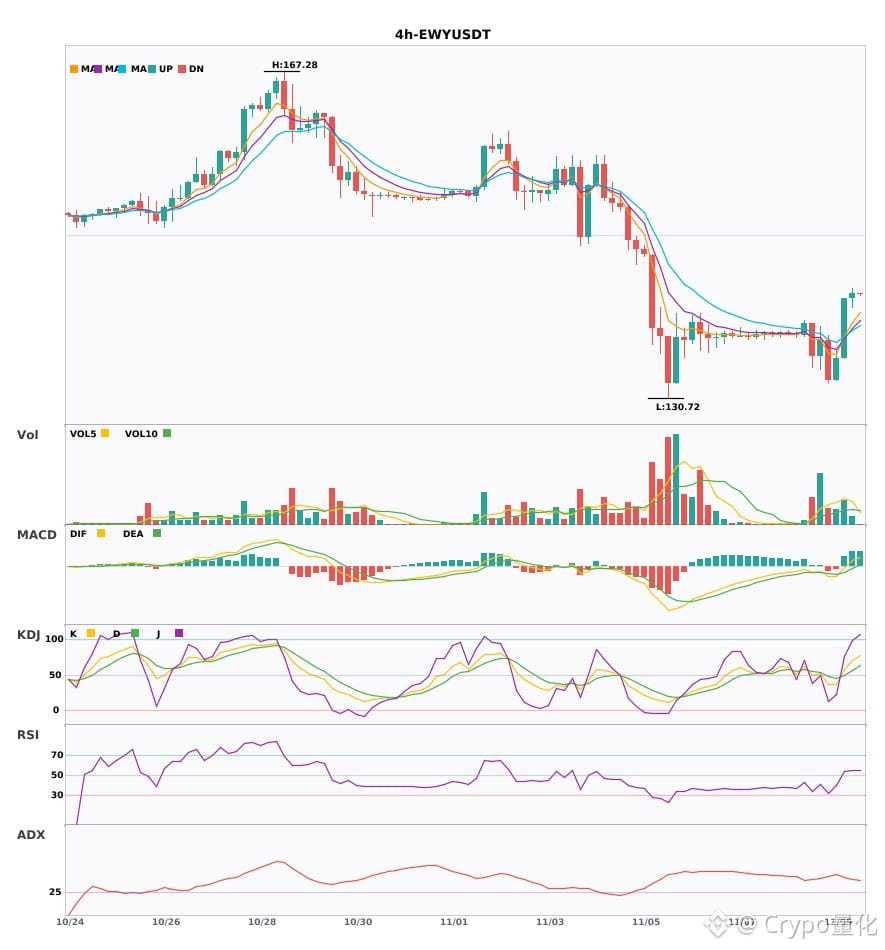
3 simultaneous 4-hour bullish signals: $EWY / $RAM / $CSOPSAMSUNG2L🔥
════════════════════
🔴 $EWY 4-hour bullish signal
⚠️Technical analysis: ADX(40) Strong trending market | MACD DIF breaks above zero, trend turns bullish | EMA5 > EMA8 > EMA13 bullish alignment | KDJ running strong, bulls in control (K: 70.1, D: 56.1) | Volume increases (1.7x)
════════════════════
🔴 $RAM 4-hour bullish signal
⚠️Technical analysis: ADX(37) Strong trending market | MACD bullish, trend leaning strong, momentum increasing | EMA5 > EMA8 > EMA13 bullish alignment | KDJ running strong, bulls in control (K: 70.1, D: 54.9) | Volume increases (1.7x)
════════════════════
🔴 $CSOPSAMSUNG2L 4-hour bullish signal
⚠️Technical analysis: ADX(32) Strong trending market | MACD DIF breaks above zero, trend turns bullish | EMA5 > EMA8 > EMA13 bullish alignment | KDJ running strong, bulls in control (K: 67.6, D: 53.2) | Volume increases (2.4x)
════════════════════
🔔 Follow for first-hand market alerts 🔔
#技术分析 #EWY #RAM #CSOPSAMSUNG2L
📌 When trading, check whether the candlestick pattern confirms the setup
3 simultaneous 4-hour bullish signals: $EWY / $RAM / $CSOPSAMSUNG2L 🔥
════════════════════
🔴 $EWY 4-hour bullish signal
⚠️Technical analysis: ADX(40) Strong trending market | MACD DIF breaks above zero, trend turns bullish | EMA5 > EMA8 > EMA13 bullish alignment | KDJ running strong, bulls in control (K: 70.1, D: 56.1) | Volume increases (1.7x)
════════════════════
🔴 $RAM 4-hour bullish signal
⚠️Technical analysis: ADX(37) Strong trending market | MACD bullish, trend leaning strong, momentum increasing | EMA5 > EMA8 > EMA13 bullish alignment | KDJ running strong, bulls in control (K: 70.1, D: 54.9) | Volume increases (1.7x)
════════════════════
🔴 $CSOPSAMSUNG2L 4-hour bullish signal
⚠️Technical analysis: ADX(32) Strong trending market | MACD DIF breaks above zero, trend turns bullish | EMA5 > EMA8 > EMA13 bullish alignment | KDJ running strong, bulls in control (K: 67.6, D: 53.2) | Volume increases (2.4x)
════════════════════
🔔 Follow for first-hand market alerts 🔔
#技术分析 #EWY #RAM #CSOPSAMSUNG2L
📌 When trading, check whether the candlestick pattern confirms the setup
════════════════════
🔴 $EWY 4-hour bullish signal
⚠️Technical analysis: ADX(40) Strong trending market | MACD DIF breaks above zero, trend turns bullish | EMA5 > EMA8 > EMA13 bullish alignment | KDJ running strong, bulls in control (K: 70.1, D: 56.1) | Volume increases (1.7x)
════════════════════
🔴 $RAM 4-hour bullish signal
⚠️Technical analysis: ADX(37) Strong trending market | MACD bullish, trend leaning strong, momentum increasing | EMA5 > EMA8 > EMA13 bullish alignment | KDJ running strong, bulls in control (K: 70.1, D: 54.9) | Volume increases (1.7x)
════════════════════
🔴 $CSOPSAMSUNG2L 4-hour bullish signal
⚠️Technical analysis: ADX(32) Strong trending market | MACD DIF breaks above zero, trend turns bullish | EMA5 > EMA8 > EMA13 bullish alignment | KDJ running strong, bulls in control (K: 67.6, D: 53.2) | Volume increases (2.4x)
════════════════════
🔔 Follow for first-hand market alerts 🔔
#技术分析 #EWY #RAM #CSOPSAMSUNG2L
📌 When trading, check whether the candlestick pattern confirms the setup
2
·
--
Bearish
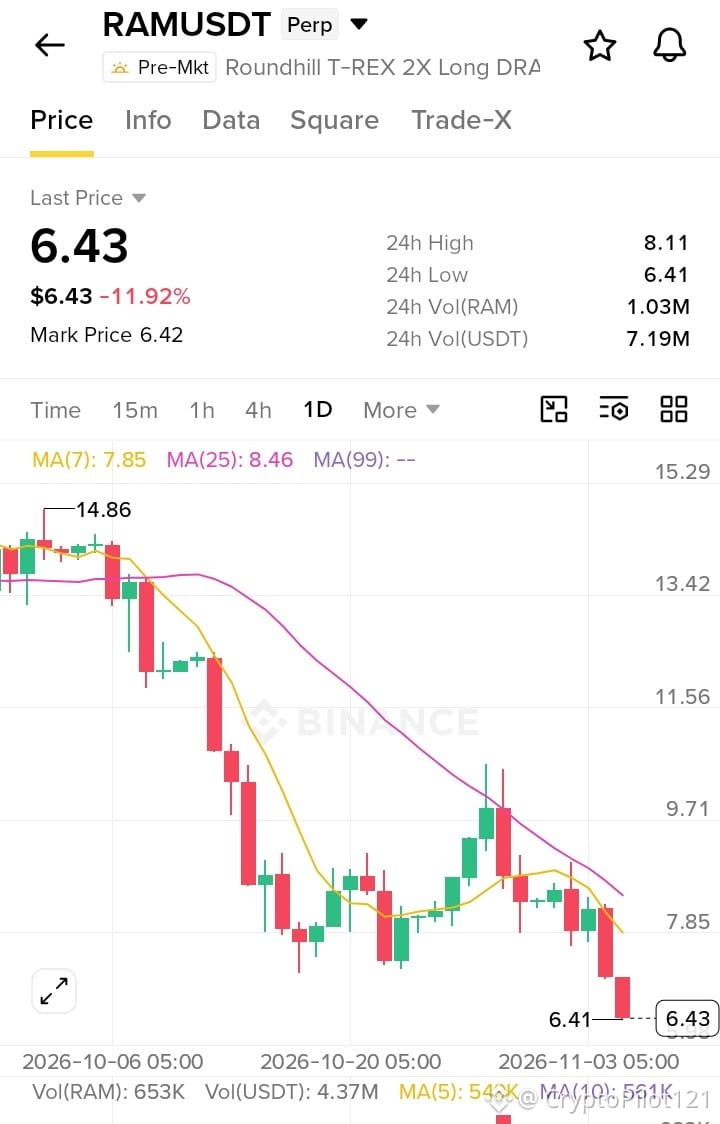
🔻 $RAM USDT Perp – Short Setup
Entry Zone: 6.43 – 6.80
Target 1: 6.00
Target 2: 5.50
Stop Loss: 7.50
Why Short?
· Clear continuation of a strong macro downtrend from the 14.86 high
· Downtrend at -11.92%
· Price is rejecting from the moving averages and breaking to new local lows below MA(7): 7.85 and MA(25): 8.46, with heavy red volume confirming bearish dominance
Key Levels:
🔴 Resistance: 7.50
🟢 Support: 6.00 → 5.50
#RAM #Trading #ShortSignal #Crypto #Binance
$RAM
{future}(RAMUSDT)
🔻 $RAM USDT Perp – Short Setup
Entry Zone: 6.43 – 6.80
Target 1: 6.00
Target 2: 5.50
Stop Loss: 7.50
Why Short?
· Clear continuation of a strong macro downtrend from the 14.86 high
· Downtrend at -11.92%
· Price is rejecting from the moving averages and breaking to new local lows below MA(7): 7.85 and MA(25): 8.46, with heavy red volume confirming bearish dominance
Key Levels:
🔴 Resistance: 7.50
🟢 Support: 6.00 → 5.50
#RAM #Trading #ShortSignal #Crypto #Binance
$RAM
Entry Zone: 6.43 – 6.80
Target 1: 6.00
Target 2: 5.50
Stop Loss: 7.50
Why Short?
· Clear continuation of a strong macro downtrend from the 14.86 high
· Downtrend at -11.92%
· Price is rejecting from the moving averages and breaking to new local lows below MA(7): 7.85 and MA(25): 8.46, with heavy red volume confirming bearish dominance
Key Levels:
🔴 Resistance: 7.50
🟢 Support: 6.00 → 5.50
#RAM #Trading #ShortSignal #Crypto #Binance
$RAM
121

·
--
RAM is down 28.94% over 24h, yet aggressive buyers still have the upper hand—that’s where the current divergence lies.
Binance TradFi Perpetuals (traditional financial assets; high risk of price gaps outside trading hours) | RAM remains weak intraday; any recovery depends first on whether selling pressure eases. Current price is around 4.96, with 24h trading volume at about 11.5958 million. The 30m volume ratio is 1.6x, indicating rising participation. Flows: 66% of accounts are long; the aggressive buy/sell ratio is 1.62 (aggressive buyers lead despite the price decline); 30m open interest is up 24.1%; funding rate is +0.0615%.
Reference indicators: The 30m RSI is 22.96, in oversold territory, suggesting short-term panic is already elevated. The 30m ATR trend-band reference level is 5.281612; the current price has fallen below it, suggesting the trend-support level is coming under pressure.
Watch just two thresholds: Can the aggressive buy/sell ratio stay above 1 to help stabilize the price? Can the 30m RSI recover above 30? Two paths lie ahead: a recovery after panic subsides, or a weak continuation after a low-volume bounce.
#RAM #Unusual Movement Alert
RAM is down 28.94% over 24h, yet aggressive buyers still have the upper hand—that’s where the current divergence lies.
Binance TradFi Perpetuals (traditional financial assets; high risk of price gaps outside trading hours) | RAM remains weak intraday; any recovery depends first on whether selling pressure eases. Current price is around 4.96, with 24h trading volume at about 11.5958 million. The 30m volume ratio is 1.6x, indicating rising participation. Flows: 66% of accounts are long; the aggressive buy/sell ratio is 1.62 (aggressive buyers lead despite the price decline); 30m open interest is up 24.1%; funding rate is +0.0615%.
Reference indicators: The 30m RSI is 22.96, in oversold territory, suggesting short-term panic is already elevated. The 30m ATR trend-band reference level is 5.281612; the current price has fallen below it, suggesting the trend-support level is coming under pressure.
Watch just two thresholds: Can the aggressive buy/sell ratio stay above 1 to help stabilize the price? Can the 30m RSI recover above 30? Two paths lie ahead: a recovery after panic subsides, or a weak continuation after a low-volume bounce.
#RAM #Unusual Movement Alert
Binance TradFi Perpetuals (traditional financial assets; high risk of price gaps outside trading hours) | RAM remains weak intraday; any recovery depends first on whether selling pressure eases. Current price is around 4.96, with 24h trading volume at about 11.5958 million. The 30m volume ratio is 1.6x, indicating rising participation. Flows: 66% of accounts are long; the aggressive buy/sell ratio is 1.62 (aggressive buyers lead despite the price decline); 30m open interest is up 24.1%; funding rate is +0.0615%.
Reference indicators: The 30m RSI is 22.96, in oversold territory, suggesting short-term panic is already elevated. The 30m ATR trend-band reference level is 5.281612; the current price has fallen below it, suggesting the trend-support level is coming under pressure.
Watch just two thresholds: Can the aggressive buy/sell ratio stay above 1 to help stabilize the price? Can the 30m RSI recover above 30? Two paths lie ahead: a recovery after panic subsides, or a weak continuation after a low-volume bounce.
#RAM #Unusual Movement Alert
57

·
--
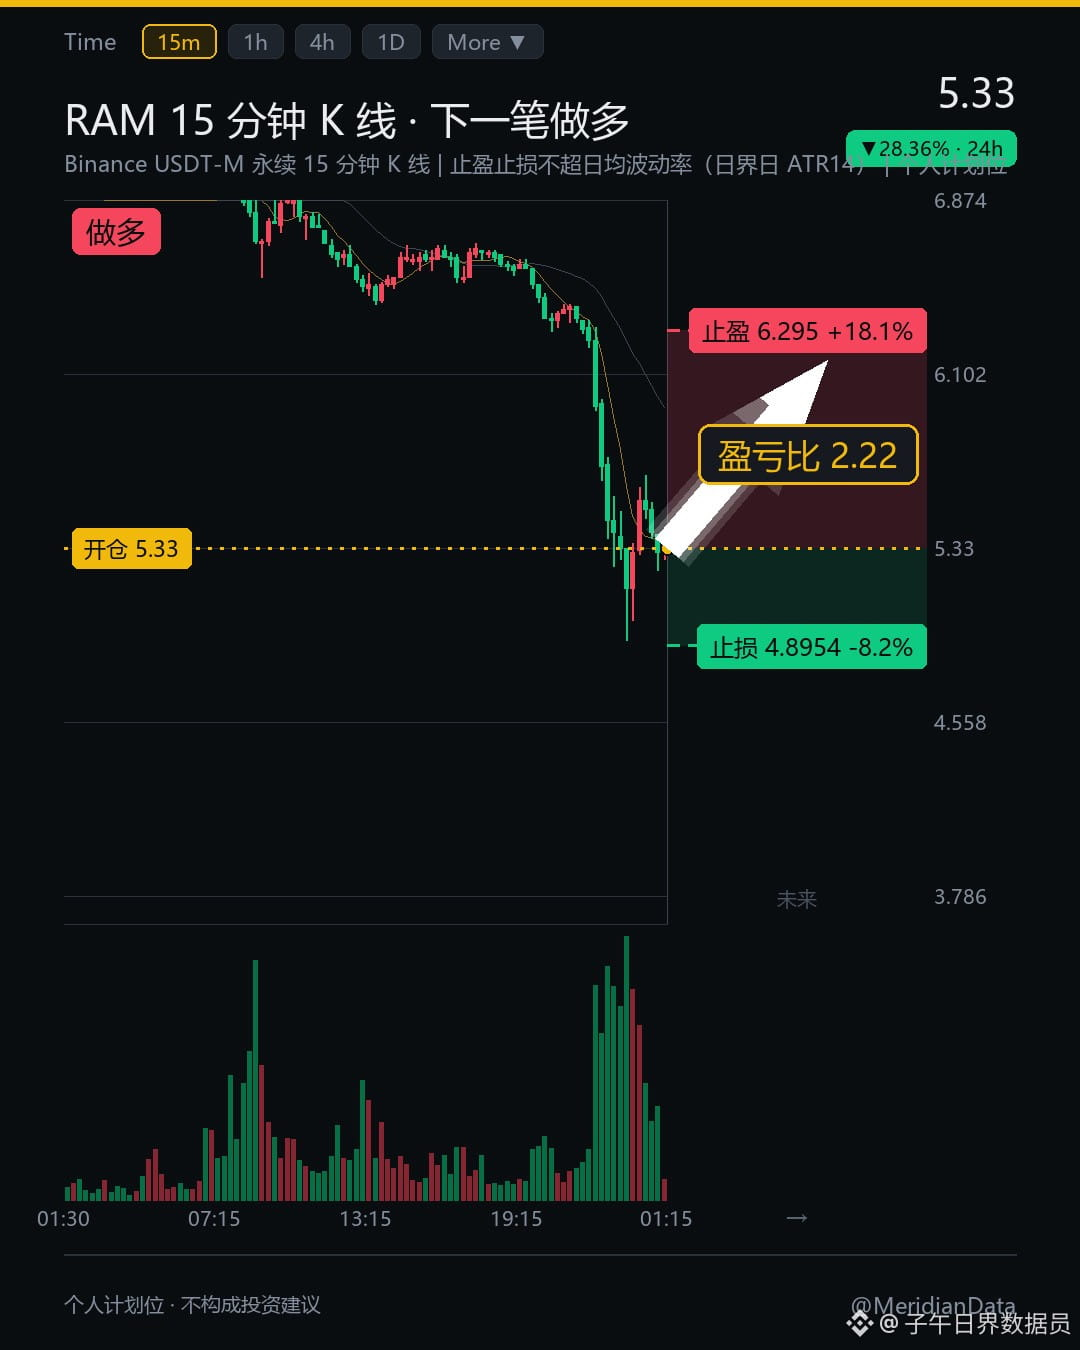
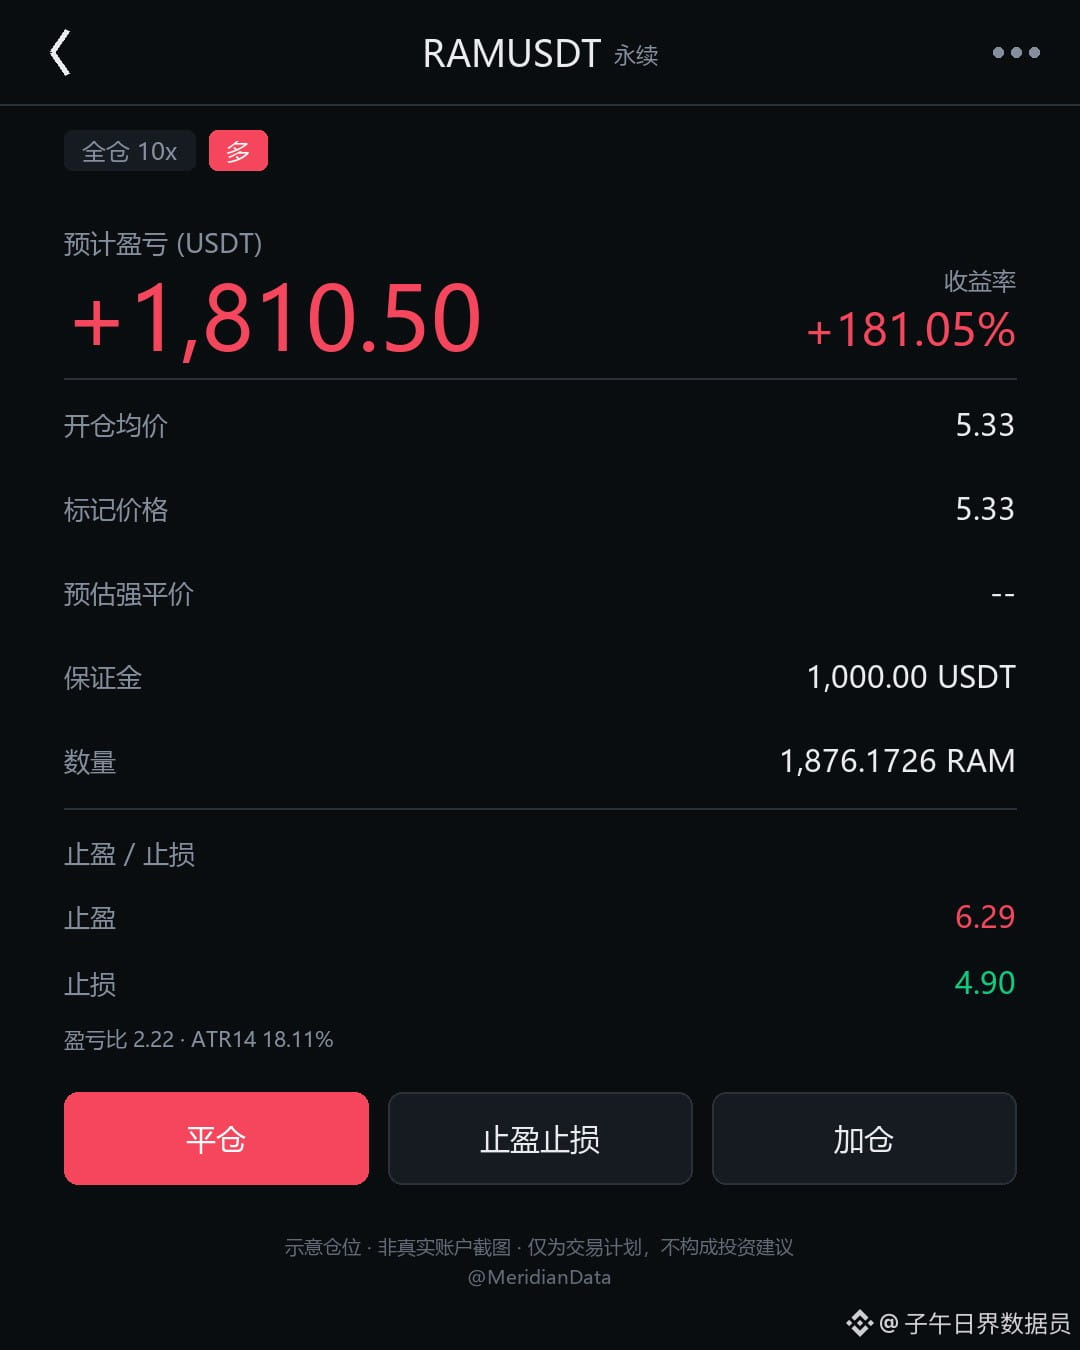
Everyone, I'm preparing to open a large long position on $RAM .
Take profit: 6.295
Stop loss: 4.8954 👇
{future}(RAMUSDT)
You may be wondering the obvious question: why am I going long at this level?
First, let's look at the setup.
The latest 15-minute candle closed at 5.33. Over the past seven days, it has fallen 36.01%—a sharp, steep drop.
So where are we now?
Over the past 20 days, the lower end of its daily range is 4.92 and the upper end is 10.63. The current price is at the 7.2nd percentile, almost on the floor.
At first glance, I thought that percentile had to be wrong. I checked twice before I believed it.
The broader market isn't doing well either. Over the same period, $BTC fell 5.135% and $ETH fell 7.210%. Its 36.01% drop is down to its own holders rotating their positions.
It's like crouching on the very bottom step of a staircase: the step is solid, and there's not much farther to fall.
How did I set the take profit and stop loss?
Its average daily volatility is around 18.11%. I set the take profit at 6.295, which is +18.10% from the current price,
and the stop loss at 4.8954, which is -8.15% from the current price. Both levels are within that range.
The take-profit level is 18.1 percentage points above the current price, and the stop-loss level is 8.15 percentage points below it. Both are within its average daily volatility.
A wick won't break my rules—that's what matters most to me about this trade.
The market is small, and when liquidity is thin, slippage comes first.
I haven't yet seen buyers stepping in after the drop, so for this trade I'm sticking to the setup.
The risk/reward ratio is about 2.22. I'm not chasing that straight-line move, and I'm not expecting it to pay off that quickly.
I'm willing to take a chance at this level, betting on a recovery after being oversold—not on it making back its losses in a day.
What do you think of this level?
#RAM #AT #Cryptocurrency
The above is a record of my personal trading system and observations of data. It does not constitute investment advice.
Everyone, I'm preparing to open a large long position on $RAM .
Take profit: 6.295
Stop loss: 4.8954 👇
You may be wondering the obvious question: why am I going long at this level?
First, let's look at the setup.
The latest 15-minute candle closed at 5.33. Over the past seven days, it has fallen 36.01%—a sharp, steep drop.
So where are we now?
Over the past 20 days, the lower end of its daily range is 4.92 and the upper end is 10.63. The current price is at the 7.2nd percentile, almost on the floor.
At first glance, I thought that percentile had to be wrong. I checked twice before I believed it.
The broader market isn't doing well either. Over the same period, $BTC fell 5.135% and $ETH fell 7.210%. Its 36.01% drop is down to its own holders rotating their positions.
It's like crouching on the very bottom step of a staircase: the step is solid, and there's not much farther to fall.
How did I set the take profit and stop loss?
Its average daily volatility is around 18.11%. I set the take profit at 6.295, which is +18.10% from the current price,
and the stop loss at 4.8954, which is -8.15% from the current price. Both levels are within that range.
The take-profit level is 18.1 percentage points above the current price, and the stop-loss level is 8.15 percentage points below it. Both are within its average daily volatility.
A wick won't break my rules—that's what matters most to me about this trade.
The market is small, and when liquidity is thin, slippage comes first.
I haven't yet seen buyers stepping in after the drop, so for this trade I'm sticking to the setup.
The risk/reward ratio is about 2.22. I'm not chasing that straight-line move, and I'm not expecting it to pay off that quickly.
I'm willing to take a chance at this level, betting on a recovery after being oversold—not on it making back its losses in a day.
What do you think of this level?
#RAM #AT #Cryptocurrency
The above is a record of my personal trading system and observations of data. It does not constitute investment advice.
Take profit: 6.295
Stop loss: 4.8954 👇
You may be wondering the obvious question: why am I going long at this level?
First, let's look at the setup.
The latest 15-minute candle closed at 5.33. Over the past seven days, it has fallen 36.01%—a sharp, steep drop.
So where are we now?
Over the past 20 days, the lower end of its daily range is 4.92 and the upper end is 10.63. The current price is at the 7.2nd percentile, almost on the floor.
At first glance, I thought that percentile had to be wrong. I checked twice before I believed it.
The broader market isn't doing well either. Over the same period, $BTC fell 5.135% and $ETH fell 7.210%. Its 36.01% drop is down to its own holders rotating their positions.
It's like crouching on the very bottom step of a staircase: the step is solid, and there's not much farther to fall.
How did I set the take profit and stop loss?
Its average daily volatility is around 18.11%. I set the take profit at 6.295, which is +18.10% from the current price,
and the stop loss at 4.8954, which is -8.15% from the current price. Both levels are within that range.
The take-profit level is 18.1 percentage points above the current price, and the stop-loss level is 8.15 percentage points below it. Both are within its average daily volatility.
A wick won't break my rules—that's what matters most to me about this trade.
The market is small, and when liquidity is thin, slippage comes first.
I haven't yet seen buyers stepping in after the drop, so for this trade I'm sticking to the setup.
The risk/reward ratio is about 2.22. I'm not chasing that straight-line move, and I'm not expecting it to pay off that quickly.
I'm willing to take a chance at this level, betting on a recovery after being oversold—not on it making back its losses in a day.
What do you think of this level?
#RAM #AT #Cryptocurrency
The above is a record of my personal trading system and observations of data. It does not constitute investment advice.
608
·
--
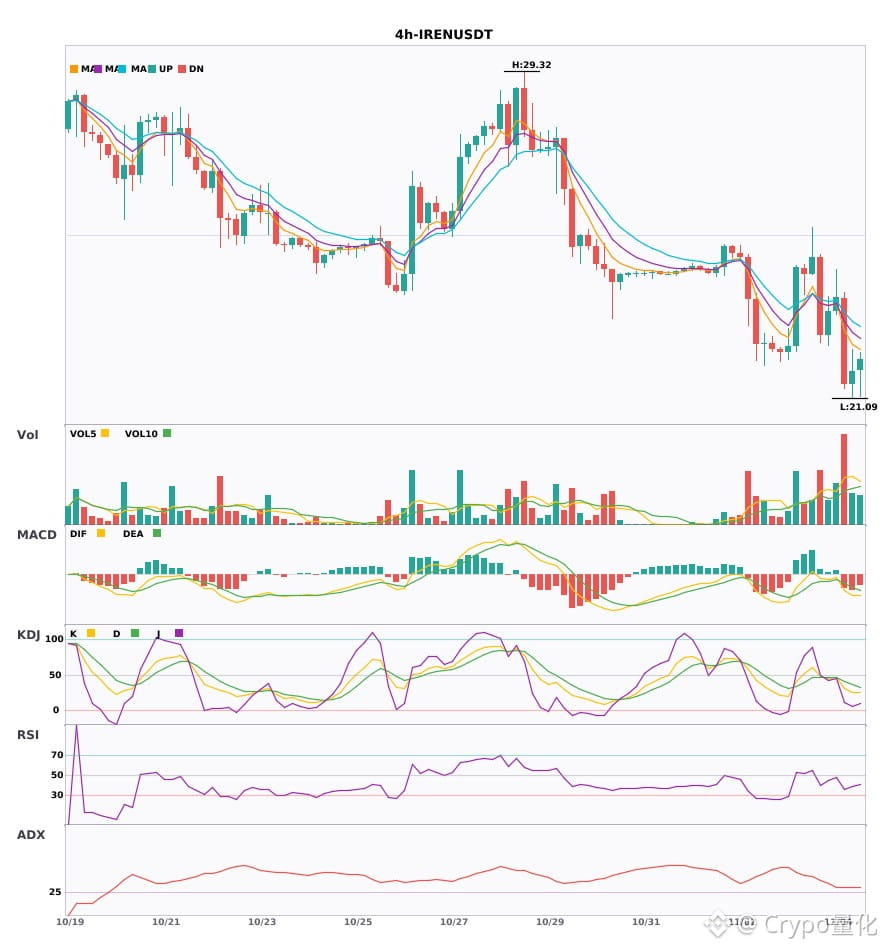
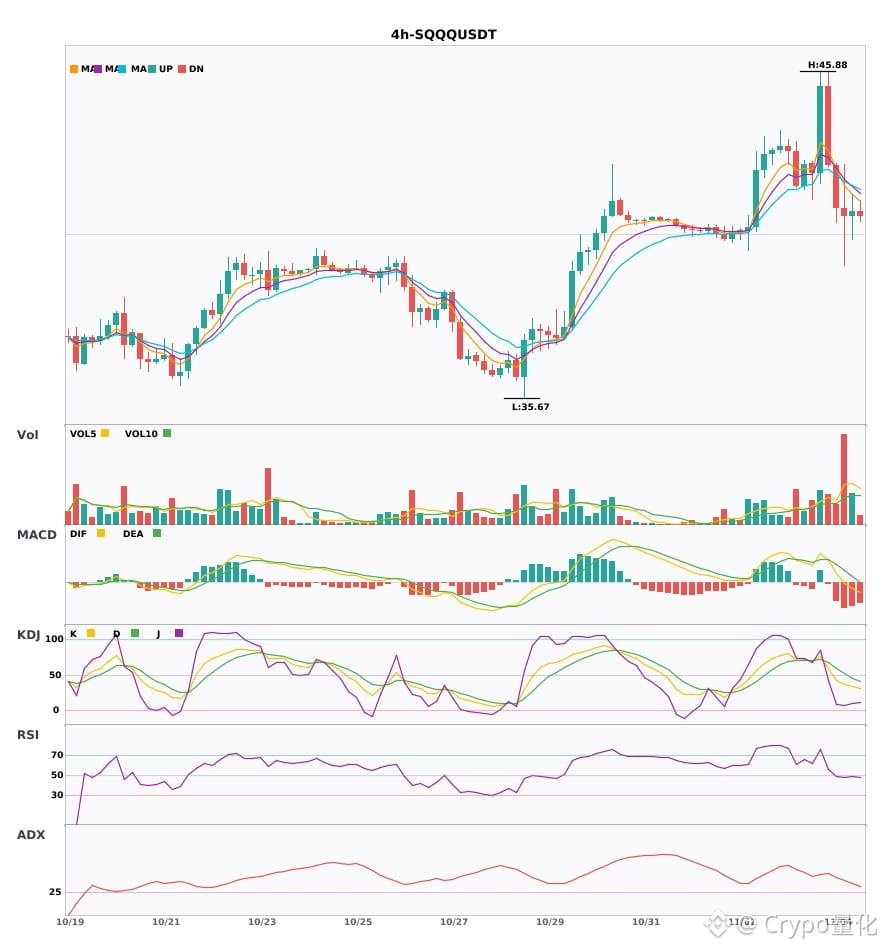
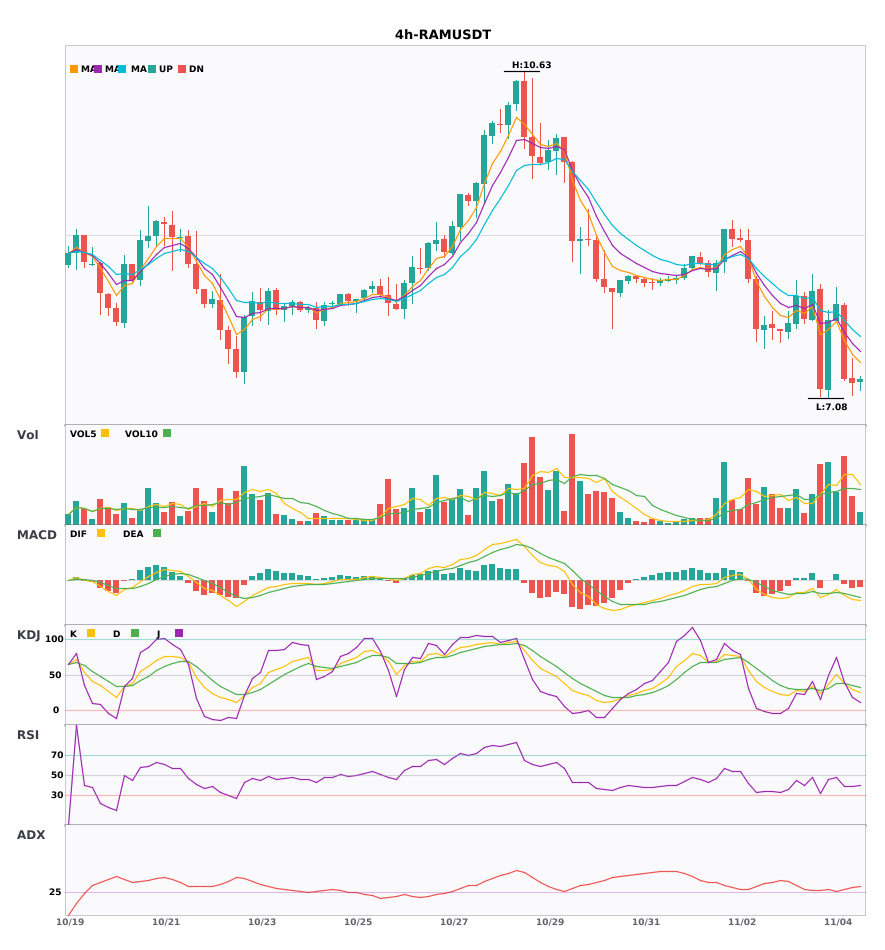
$IREN / $SQQQ / $RAM 4-hour technical indicators are weakening simultaneously. Be aware of the risks 🔥
════════════════════
🟢 $IREN 4-hour bearish signal
⚠️Technical indicators: ADX (31): clear trending market | MACD bearish crossover below zero, bearish momentum accelerating | EMA5 crossed below EMA8, short-term trend turning bearish | KDJ trending weakly, bears in control (K: 31.3, D: 41.2) | Volume spike (2.7x)
════════════════════
🟢 $SQQQ 4-hour bearish signal
⚠️Technical indicators: ADX (33): clear trending market | MACD bearish, trend is weak and momentum is fading | EMA5 < EMA8 < EMA13, bearish alignment | KDJ trending weakly, bears in control (K: 33.8, D: 45.8) | Volume spike (3.3x)
════════════════════
🟢 $RAM 4-hour bearish signal
⚠️Technical indicators: ADX (29): trend is forming; potential opportunity to participate | MACD bearish crossover below zero, bearish momentum accelerating | EMA5 < EMA8 < EMA13, bearish alignment | KDJ trending weakly, bears in control (K: 38.5, D: 38.0) | Volume increase (1.9x)
════════════════════
🔔 Follow for first-hand market updates 🔔
#技术分析 #IREN #SQQQ #RAM
📌 When trading, check whether the candlestick pattern confirms the signal
$IREN / $SQQQ / $RAM 4-hour technical indicators are weakening simultaneously. Be aware of the risks 🔥
════════════════════
🟢 $IREN 4-hour bearish signal
⚠️Technical indicators: ADX (31): clear trending market | MACD bearish crossover below zero, bearish momentum accelerating | EMA5 crossed below EMA8, short-term trend turning bearish | KDJ trending weakly, bears in control (K: 31.3, D: 41.2) | Volume spike (2.7x)
════════════════════
🟢 $SQQQ 4-hour bearish signal
⚠️Technical indicators: ADX (33): clear trending market | MACD bearish, trend is weak and momentum is fading | EMA5 < EMA8 < EMA13, bearish alignment | KDJ trending weakly, bears in control (K: 33.8, D: 45.8) | Volume spike (3.3x)
════════════════════
🟢 $RAM 4-hour bearish signal
⚠️Technical indicators: ADX (29): trend is forming; potential opportunity to participate | MACD bearish crossover below zero, bearish momentum accelerating | EMA5 < EMA8 < EMA13, bearish alignment | KDJ trending weakly, bears in control (K: 38.5, D: 38.0) | Volume increase (1.9x)
════════════════════
🔔 Follow for first-hand market updates 🔔
#技术分析 #IREN #SQQQ #RAM
📌 When trading, check whether the candlestick pattern confirms the signal
════════════════════
🟢 $IREN 4-hour bearish signal
⚠️Technical indicators: ADX (31): clear trending market | MACD bearish crossover below zero, bearish momentum accelerating | EMA5 crossed below EMA8, short-term trend turning bearish | KDJ trending weakly, bears in control (K: 31.3, D: 41.2) | Volume spike (2.7x)
════════════════════
🟢 $SQQQ 4-hour bearish signal
⚠️Technical indicators: ADX (33): clear trending market | MACD bearish, trend is weak and momentum is fading | EMA5 < EMA8 < EMA13, bearish alignment | KDJ trending weakly, bears in control (K: 33.8, D: 45.8) | Volume spike (3.3x)
════════════════════
🟢 $RAM 4-hour bearish signal
⚠️Technical indicators: ADX (29): trend is forming; potential opportunity to participate | MACD bearish crossover below zero, bearish momentum accelerating | EMA5 < EMA8 < EMA13, bearish alignment | KDJ trending weakly, bears in control (K: 38.5, D: 38.0) | Volume increase (1.9x)
════════════════════
🔔 Follow for first-hand market updates 🔔
#技术分析 #IREN #SQQQ #RAM
📌 When trading, check whether the candlestick pattern confirms the signal
7
·
--
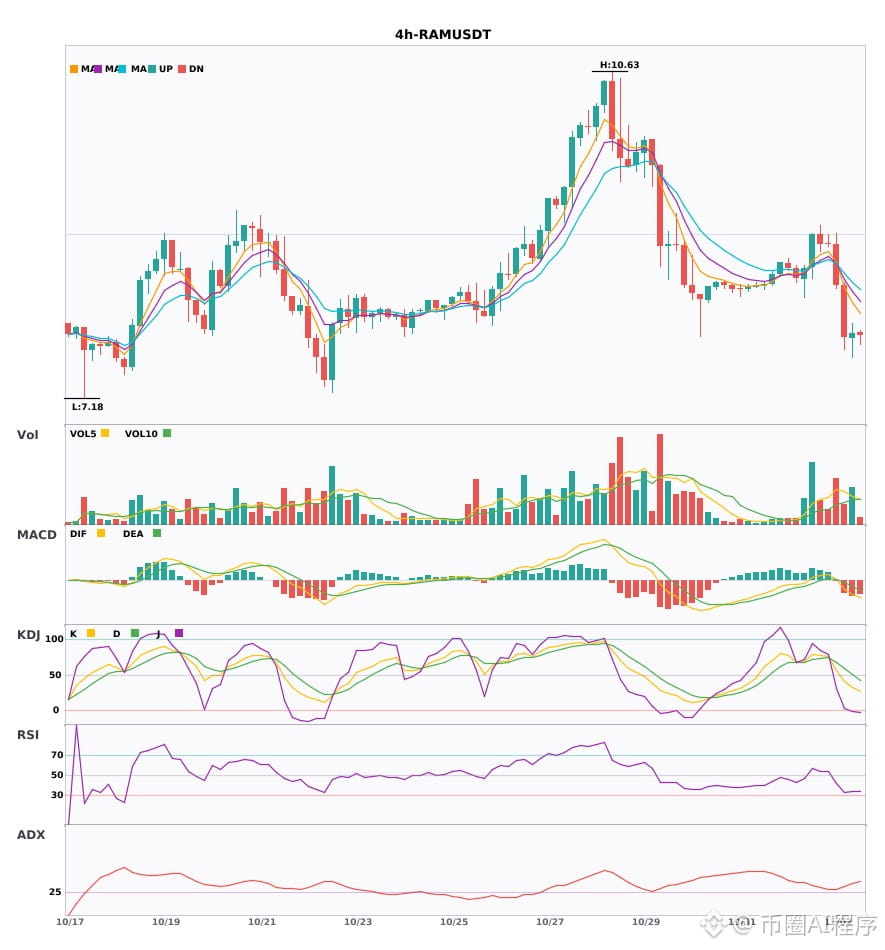
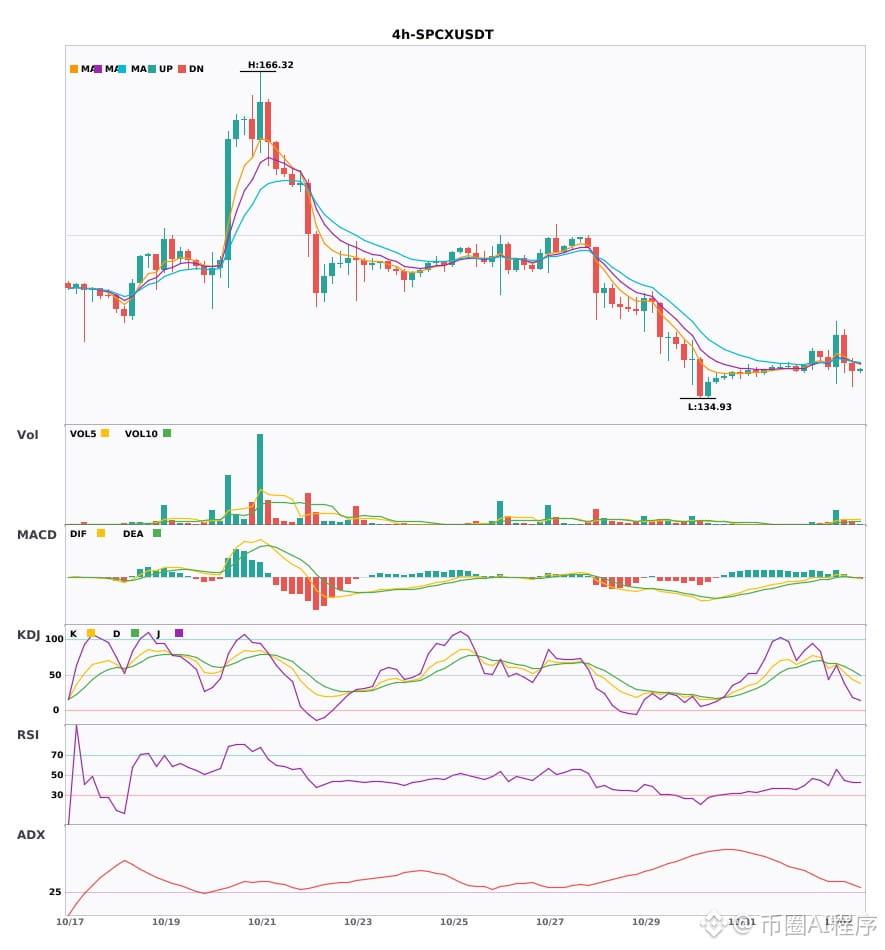
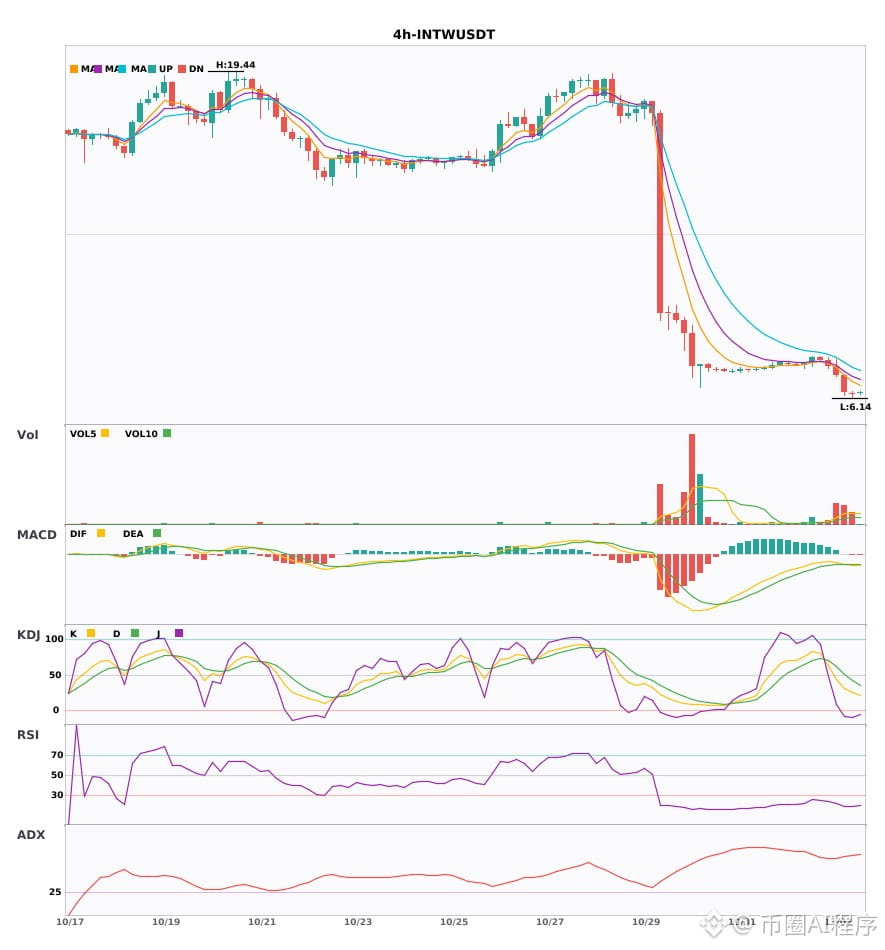
$RAM / $SPCX / $INTW 4-hour bearish signals, daily bearish trend confirmed 🔥
════════════════════
🟢 $RAM 4-hour bearish signal
⚠️Technical analysis: Daily bearish confluence confirmed | 4-hour entry: MACD DIF falls below the zero line, trend turns bearish | EMA5 crosses below EMA8, short-term trend turns bearish | Volume increases (2.3x)
════════════════════
🟢 $SPCX 4-hour bearish signal
⚠️Technical analysis: Daily bearish confluence confirmed | 4-hour entry: MACD bearish crossover below zero, bearish momentum accelerates | EMA5 crosses below EMA8, short-term trend turns bearish | Volume increases (1.9x)
════════════════════
🟢 $INTW 4-hour bearish signal
⚠️Technical analysis: Daily bearish confluence confirmed | 4-hour entry: MACD bearish crossover below zero, bearish momentum accelerates | EMA5 < EMA8 < EMA13, bearish alignment | Volume surges (4.6x)
════════════════════
🔔 Follow for real-time market alerts 🔔
#多周期共振 #RAM #SPCX #INTW
📌 When trading, check whether the candlestick pattern confirms the signal
$RAM / $SPCX / $INTW 4-hour bearish signals, daily bearish trend confirmed 🔥
════════════════════
🟢 $RAM 4-hour bearish signal
⚠️Technical analysis: Daily bearish confluence confirmed | 4-hour entry: MACD DIF falls below the zero line, trend turns bearish | EMA5 crosses below EMA8, short-term trend turns bearish | Volume increases (2.3x)
════════════════════
🟢 $SPCX 4-hour bearish signal
⚠️Technical analysis: Daily bearish confluence confirmed | 4-hour entry: MACD bearish crossover below zero, bearish momentum accelerates | EMA5 crosses below EMA8, short-term trend turns bearish | Volume increases (1.9x)
════════════════════
🟢 $INTW 4-hour bearish signal
⚠️Technical analysis: Daily bearish confluence confirmed | 4-hour entry: MACD bearish crossover below zero, bearish momentum accelerates | EMA5 < EMA8 < EMA13, bearish alignment | Volume surges (4.6x)
════════════════════
🔔 Follow for real-time market alerts 🔔
#多周期共振 #RAM #SPCX #INTW
📌 When trading, check whether the candlestick pattern confirms the signal
════════════════════
🟢 $RAM 4-hour bearish signal
⚠️Technical analysis: Daily bearish confluence confirmed | 4-hour entry: MACD DIF falls below the zero line, trend turns bearish | EMA5 crosses below EMA8, short-term trend turns bearish | Volume increases (2.3x)
════════════════════
🟢 $SPCX 4-hour bearish signal
⚠️Technical analysis: Daily bearish confluence confirmed | 4-hour entry: MACD bearish crossover below zero, bearish momentum accelerates | EMA5 crosses below EMA8, short-term trend turns bearish | Volume increases (1.9x)
════════════════════
🟢 $INTW 4-hour bearish signal
⚠️Technical analysis: Daily bearish confluence confirmed | 4-hour entry: MACD bearish crossover below zero, bearish momentum accelerates | EMA5 < EMA8 < EMA13, bearish alignment | Volume surges (4.6x)
════════════════════
🔔 Follow for real-time market alerts 🔔
#多周期共振 #RAM #SPCX #INTW
📌 When trading, check whether the candlestick pattern confirms the signal
68
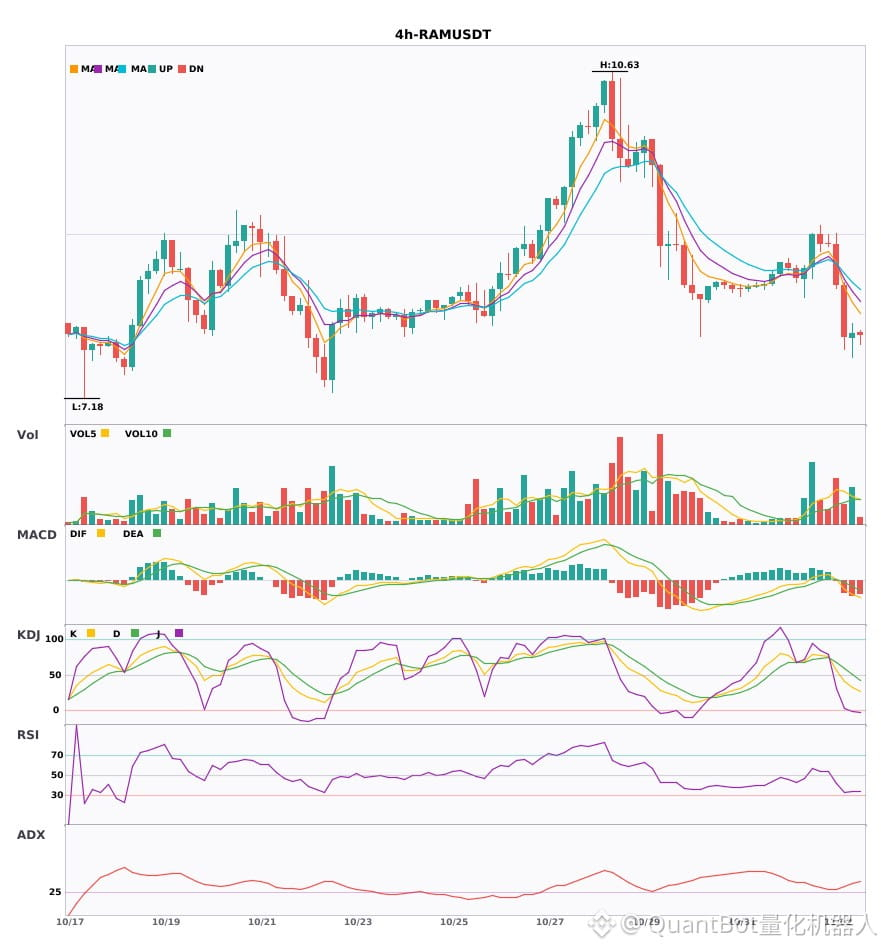
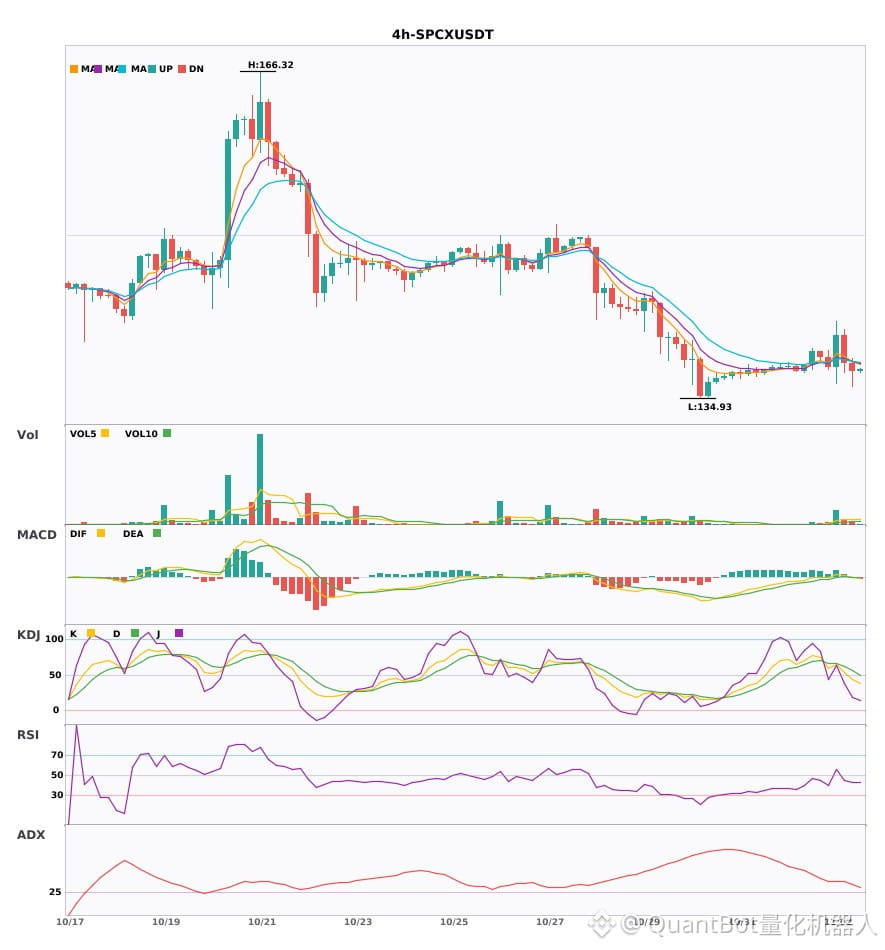
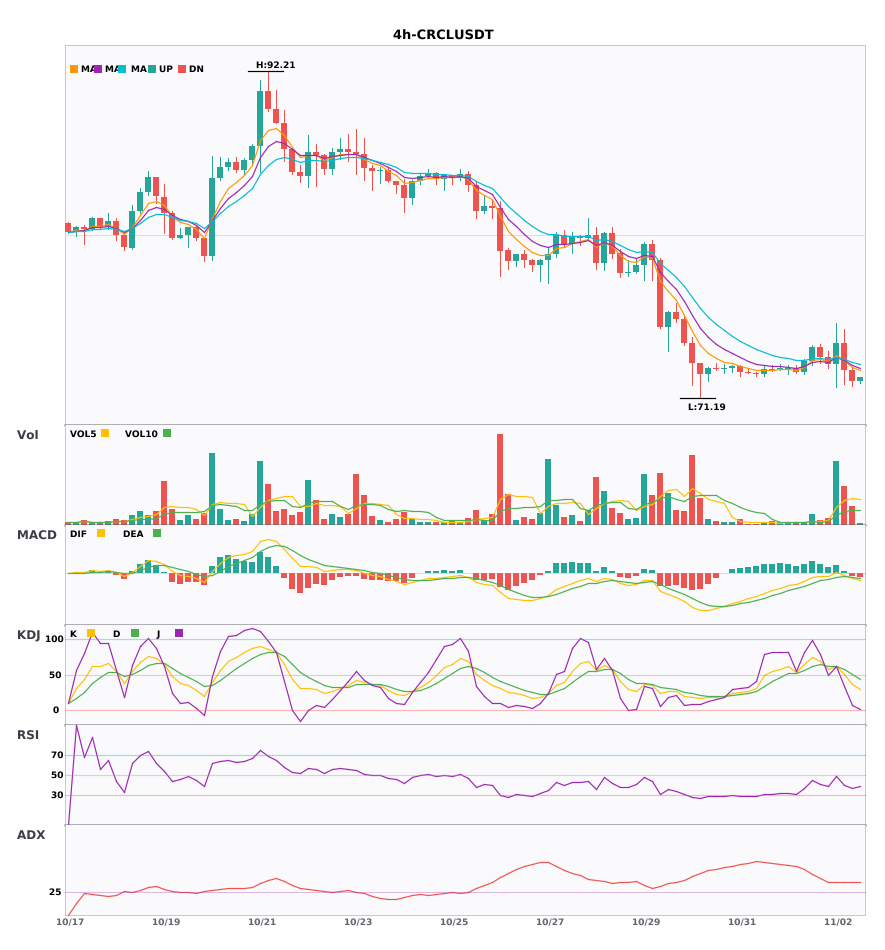
3 Four-Hour Bearish Alerts: $RAM / $SPCX / $CRCL
📉 $RAM | 4-hour bearish signal
━━━━━━━━━━━━━━━━━━
Technical analysis: ADX(32) indicates a clear trend | MACD DIF fell below zero, turning the trend bearish | EMA5 crossed below EMA8, indicating a short-term bearish trend | Volume increased (2.3x)
Price change: -6.4500%
📉 $SPCX | 4-hour bearish signal
━━━━━━━━━━━━━━━━━━
Technical analysis: ADX(33) indicates a clear trend | MACD bearish crossover below zero, bearish momentum accelerating | EMA5 crossed below EMA8, indicating a short-term bearish trend | Volume increased (1.9x)
Price change: -0.5900%
📉 $CRCL | 4-hour bearish signal
━━━━━━━━━━━━━━━━━━
Technical analysis: ADX(39) indicates a clear trend | MACD bearish crossover below zero, bearish momentum accelerating | EMA5 crossed below EMA8, indicating a short-term bearish trend | Volume surged (2.9x)
Price change: -0.9700%
━━━━━━━━━━━━━━━━━━
#技术分析 #RAM #SPCX #CRCL
📌 The above is for reference only and does not constitute investment advice
3 Four-Hour Bearish Alerts: $RAM / $SPCX / $CRCL
📉 $RAM | 4-hour bearish signal
━━━━━━━━━━━━━━━━━━
Technical analysis: ADX(32) indicates a clear trend | MACD DIF fell below zero, turning the trend bearish | EMA5 crossed below EMA8, indicating a short-term bearish trend | Volume increased (2.3x)
Price change: -6.4500%
📉 $SPCX | 4-hour bearish signal
━━━━━━━━━━━━━━━━━━
Technical analysis: ADX(33) indicates a clear trend | MACD bearish crossover below zero, bearish momentum accelerating | EMA5 crossed below EMA8, indicating a short-term bearish trend | Volume increased (1.9x)
Price change: -0.5900%
📉 $CRCL | 4-hour bearish signal
━━━━━━━━━━━━━━━━━━
Technical analysis: ADX(39) indicates a clear trend | MACD bearish crossover below zero, bearish momentum accelerating | EMA5 crossed below EMA8, indicating a short-term bearish trend | Volume surged (2.9x)
Price change: -0.9700%
━━━━━━━━━━━━━━━━━━
#技术分析 #RAM #SPCX #CRCL
📌 The above is for reference only and does not constitute investment advice
📉 $RAM | 4-hour bearish signal
━━━━━━━━━━━━━━━━━━
Technical analysis: ADX(32) indicates a clear trend | MACD DIF fell below zero, turning the trend bearish | EMA5 crossed below EMA8, indicating a short-term bearish trend | Volume increased (2.3x)
Price change: -6.4500%
📉 $SPCX | 4-hour bearish signal
━━━━━━━━━━━━━━━━━━
Technical analysis: ADX(33) indicates a clear trend | MACD bearish crossover below zero, bearish momentum accelerating | EMA5 crossed below EMA8, indicating a short-term bearish trend | Volume increased (1.9x)
Price change: -0.5900%
📉 $CRCL | 4-hour bearish signal
━━━━━━━━━━━━━━━━━━
Technical analysis: ADX(39) indicates a clear trend | MACD bearish crossover below zero, bearish momentum accelerating | EMA5 crossed below EMA8, indicating a short-term bearish trend | Volume surged (2.9x)
Price change: -0.9700%
━━━━━━━━━━━━━━━━━━
#技术分析 #RAM #SPCX #CRCL
📌 The above is for reference only and does not constitute investment advice
32
Log in to explore more content
Join global crypto users on Binance Square
⚡️ Get latest and useful information about crypto.
💬 Trusted by the world’s largest crypto exchange.
👍 Discover real insights from verified creators.
Email / Phone number
Trending Topics
1
#USPPIMissMayEaseBTCPressure
336,242 views
2,410 Discussing
2
#USSpotXRPETFsSeeLargestWeeklyOutflowIn8Months
40,042 views
429 Discussing
3
#BitcoinActiveSupplyInProfitDropsBelow45%
94,781 views
847 Discussing
4
#TONStrategyReports$23.97MQ3NetLoss
11,462 views
56 Discussing
5
#PolkadotCommunityApprovesNewStrategyWith97%Vote
32,580 views
322 Discussing
6
#KavaSaysAbnormalActivityLimitedToKavaLend
59,637 views
476 Discussing
7
#WORPTLetsTouristsConvertCryptoToThaiBaht
12,125 views
119 Discussing
8
#WhoWillSucceedJensenHuangatNvidia?
207,101 views
1,815 Discussing
9
#WhatWillDriveCryptoandStocks’NextRebound?
629,458 views
3,646 Discussing
10
#TradFiForBeginners
753,374 views
4,610 Discussing