
#parti
parti
4.2M views
11,019 Discussing
Hot
Latest

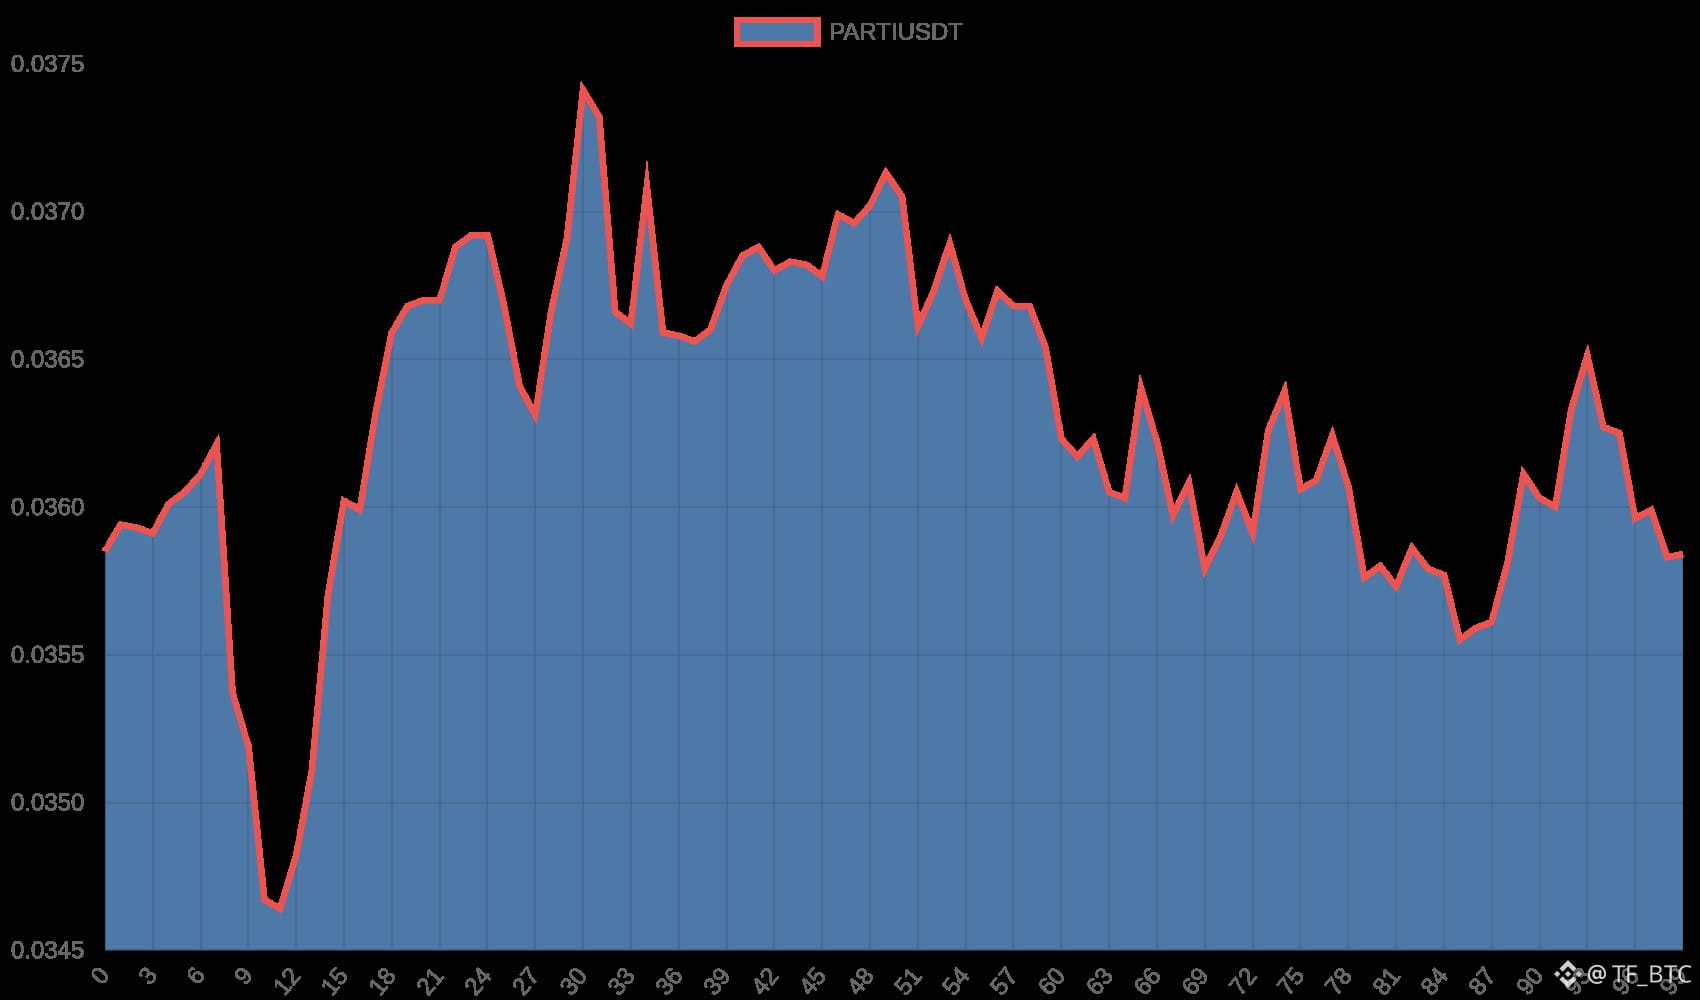

The Silent Signal Most Traders Miss on $PARTI Right Now
Everyone is watching $PARTI’s price bleed. Few are watching what the protocol is actually shipping.
While the chart looks ugly, the fundamental engine is quietly accelerating.
Here are the hard numbers most are overlooking:
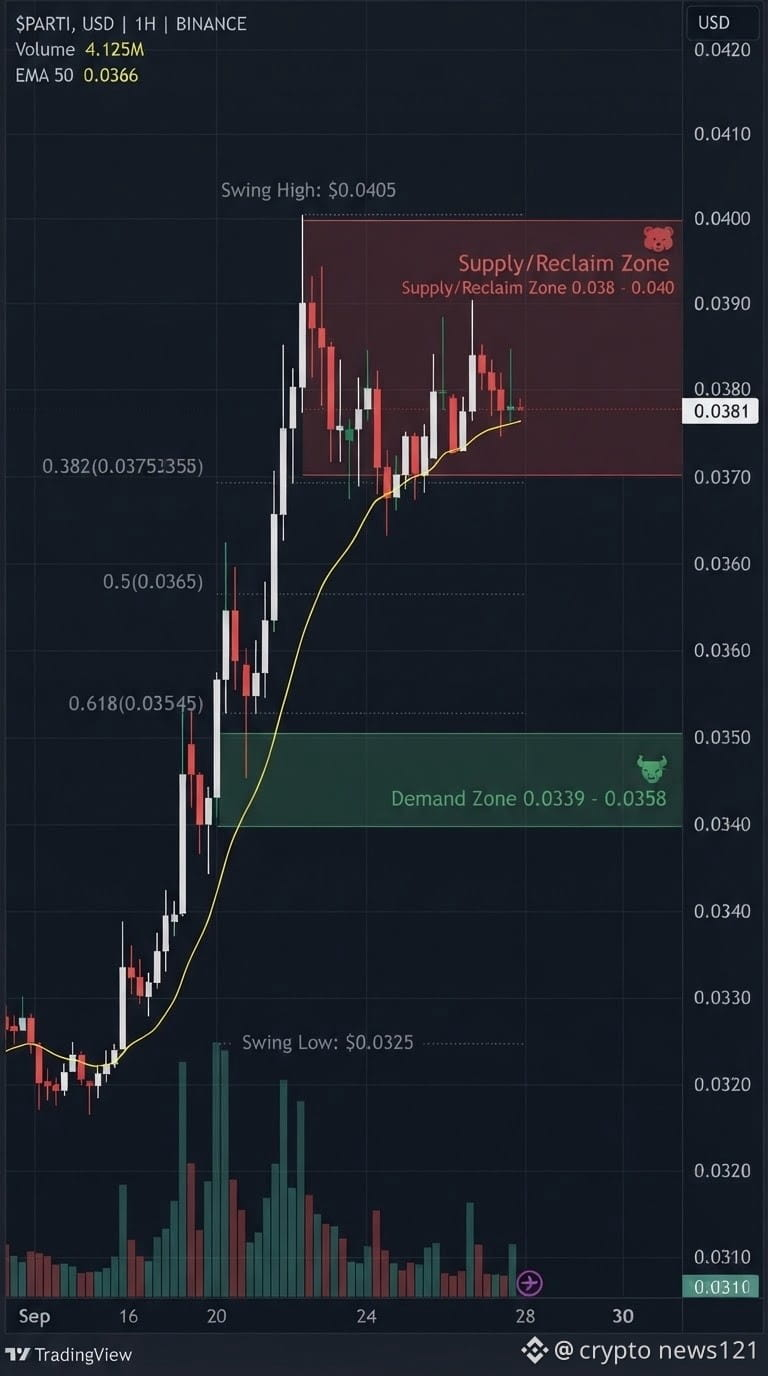
• Support Under Pressure: $PARTI is testing the **$0.0339–$0.0358** demand shelf after a sharp 25%+ flush from local highs. The immediate reclaim zone sits at **$0.038–$0.040**; failure to flip that level keeps the structure defensive.
• The “10x” Upgrade Nobody Priced In: Universal Account V2 is live. The team rebuilt the account layer from scratch, claiming 10x improvement in performance and security over V1, with a self-developed multi-chain data engine for in-block cross-chain execution. Adoption is already live on UniversalX and dozens of integrations.
• Real Usage, Not Hype: The testnet phase attracted 1.6 million users and over 200 million UA transactions across Arbitrum, Base, and Berachain co-testnets. SDK monthly downloads are at all-time highs, and Universal Accounts are now the most widely adopted EIP-7702-based chain abstraction product in the industry.
The contrarian take: In a market where liquidity is thinning and pure narrative coins are bleeding out, infrastructure with measurable developer traction and a live product cycle tends to build a higher floor than the chart suggests. Chain abstraction is a slow-burn thesis—but $PARTI is one of the few names actually shipping against it.
This is education, not financial advice. Always DYOR.
Are you watching $PARTI’s fundamentals or just the candles? Drop your key level below 👇
{future}(PARTIUSDT)
#PARTI #BinanceSquare #ChainAbstraction #RippleRLUSDMarketCapSurpassesPayPalPYUSD #CryptoMarket
The Silent Signal Most Traders Miss on $PARTI Right Now
Everyone is watching $PARTI ’s price bleed. Few are watching what the protocol is actually shipping.
While the chart looks ugly, the fundamental engine is quietly accelerating.
Here are the hard numbers most are overlooking:
• Support Under Pressure: $PARTI is testing the **$0.0339–$0.0358** demand shelf after a sharp 25%+ flush from local highs. The immediate reclaim zone sits at **$0.038–$0.040**; failure to flip that level keeps the structure defensive.
• The “10x” Upgrade Nobody Priced In: Universal Account V2 is live. The team rebuilt the account layer from scratch, claiming 10x improvement in performance and security over V1, with a self-developed multi-chain data engine for in-block cross-chain execution. Adoption is already live on UniversalX and dozens of integrations.
• Real Usage, Not Hype: The testnet phase attracted 1.6 million users and over 200 million UA transactions across Arbitrum, Base, and Berachain co-testnets. SDK monthly downloads are at all-time highs, and Universal Accounts are now the most widely adopted EIP-7702-based chain abstraction product in the industry.
The contrarian take: In a market where liquidity is thinning and pure narrative coins are bleeding out, infrastructure with measurable developer traction and a live product cycle tends to build a higher floor than the chart suggests. Chain abstraction is a slow-burn thesis—but $PARTI is one of the few names actually shipping against it.
This is education, not financial advice. Always DYOR.
Are you watching $PARTI ’s fundamentals or just the candles? Drop your key level below 👇
#PARTI #BinanceSquare #ChainAbstraction #RippleRLUSDMarketCapSurpassesPayPalPYUSD #CryptoMarket
Everyone is watching $PARTI ’s price bleed. Few are watching what the protocol is actually shipping.
While the chart looks ugly, the fundamental engine is quietly accelerating.
Here are the hard numbers most are overlooking:
• Support Under Pressure: $PARTI is testing the **$0.0339–$0.0358** demand shelf after a sharp 25%+ flush from local highs. The immediate reclaim zone sits at **$0.038–$0.040**; failure to flip that level keeps the structure defensive.
• The “10x” Upgrade Nobody Priced In: Universal Account V2 is live. The team rebuilt the account layer from scratch, claiming 10x improvement in performance and security over V1, with a self-developed multi-chain data engine for in-block cross-chain execution. Adoption is already live on UniversalX and dozens of integrations.
• Real Usage, Not Hype: The testnet phase attracted 1.6 million users and over 200 million UA transactions across Arbitrum, Base, and Berachain co-testnets. SDK monthly downloads are at all-time highs, and Universal Accounts are now the most widely adopted EIP-7702-based chain abstraction product in the industry.
The contrarian take: In a market where liquidity is thinning and pure narrative coins are bleeding out, infrastructure with measurable developer traction and a live product cycle tends to build a higher floor than the chart suggests. Chain abstraction is a slow-burn thesis—but $PARTI is one of the few names actually shipping against it.
This is education, not financial advice. Always DYOR.
Are you watching $PARTI ’s fundamentals or just the candles? Drop your key level below 👇
#PARTI #BinanceSquare #ChainAbstraction #RippleRLUSDMarketCapSurpassesPayPalPYUSD #CryptoMarket
94

·
--
$PARTI +1.42% | $MUB +1.35% | $JST +1.18%
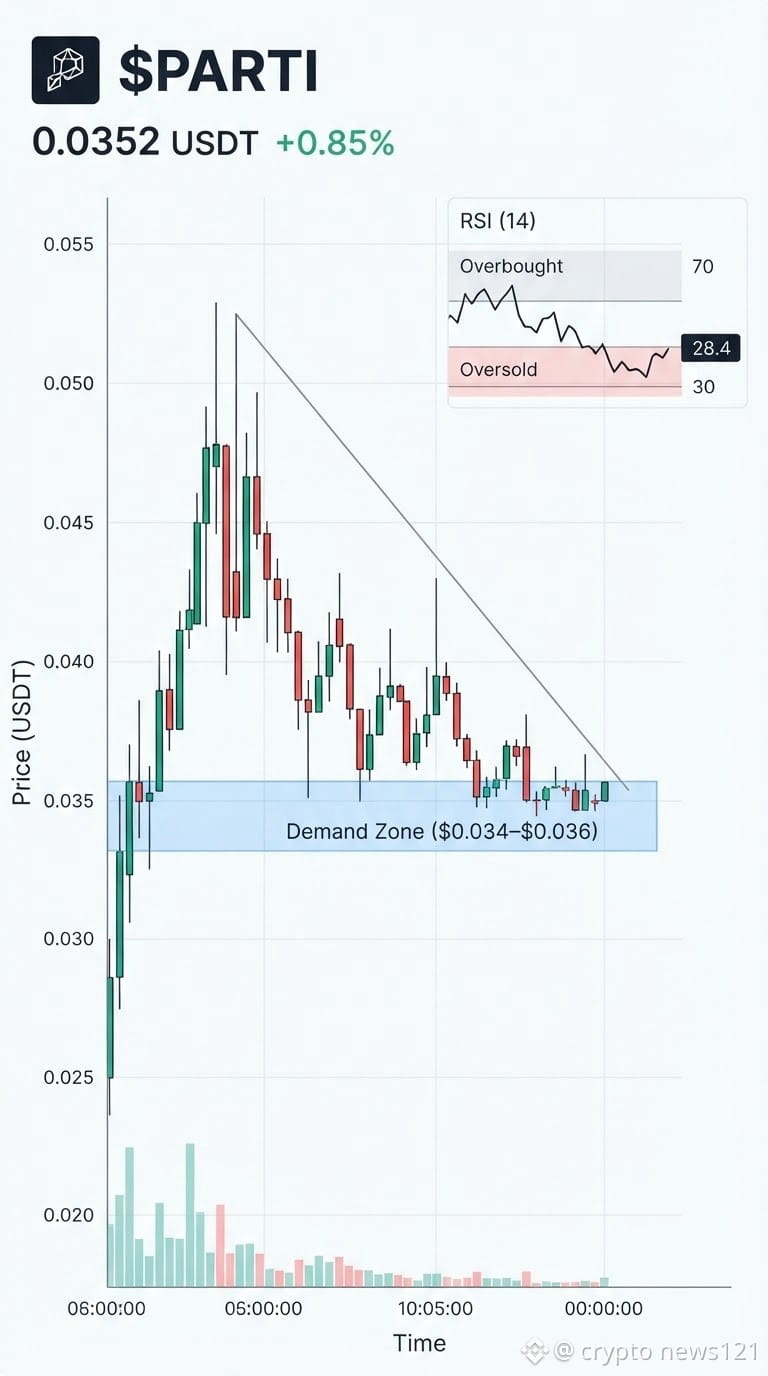
#PARTI nudged to $0.0357, up +1.42% on $1.4 M volume. Its Layer‑1 focus on chain abstraction could help pull liquidity into a fragmented Web3 landscape.
#MUB rose to $790.23, up +1.35% with $14.7 M changing hands. The modest gain on such heavy turnover suggests steady interest from larger players.
#JST climbed to $0.1463, up +1.18% on $3.2 M volume. A gentle lift that may hint at renewed attention to its niche use‑case.
⚡️ Watch how the differing volume scales could affect the durability of these modest gains.
#Write2Earn #Binance
$PARTI +1.42% | $MUB +1.35% | $JST +1.18%
#PARTI nudged to $0.0357, up +1.42% on $1.4 M volume. Its Layer‑1 focus on chain abstraction could help pull liquidity into a fragmented Web3 landscape.
#MUB rose to $790.23, up +1.35% with $14.7 M changing hands. The modest gain on such heavy turnover suggests steady interest from larger players.
#JST climbed to $0.1463, up +1.18% on $3.2 M volume. A gentle lift that may hint at renewed attention to its niche use‑case.
⚡️ Watch how the differing volume scales could affect the durability of these modest gains.
#Write2Earn #Binance
#PARTI nudged to $0.0357, up +1.42% on $1.4 M volume. Its Layer‑1 focus on chain abstraction could help pull liquidity into a fragmented Web3 landscape.
#MUB rose to $790.23, up +1.35% with $14.7 M changing hands. The modest gain on such heavy turnover suggests steady interest from larger players.
#JST climbed to $0.1463, up +1.18% on $3.2 M volume. A gentle lift that may hint at renewed attention to its niche use‑case.
⚡️ Watch how the differing volume scales could affect the durability of these modest gains.
#Write2Earn #Binance
4
·
--
$PARTI +4.67% | $ONE +3.73% | $COCOS +3.44%
#PARTI at $0.0359, up +4.67% on $1.5 M volume. Its Particle Network aims to unify users and liquidity across Web3 as a Layer‑1 blockchain.
#ONE at $0.00155600, up +3.73% with $13.2 M volume. ONEchain targets game developers, with governance handled by the Opengame Foundation.
#COCOS at $1.75, up +3.44% on $1.5 M volume.
The rally could be fragile if broader market sentiment shifts.
Watch for any upcoming partnership announcements from Particle Network that might add further upside.
#Write2Earn #Binance
$PARTI +4.67% | $ONE +3.73% | $COCOS +3.44%
#PARTI at $0.0359, up +4.67% on $1.5 M volume. Its Particle Network aims to unify users and liquidity across Web3 as a Layer‑1 blockchain.
#ONE at $0.00155600, up +3.73% with $13.2 M volume. ONEchain targets game developers, with governance handled by the Opengame Foundation.
#COCOS at $1.75, up +3.44% on $1.5 M volume.
The rally could be fragile if broader market sentiment shifts.
Watch for any upcoming partnership announcements from Particle Network that might add further upside.
#Write2Earn #Binance
#PARTI at $0.0359, up +4.67% on $1.5 M volume. Its Particle Network aims to unify users and liquidity across Web3 as a Layer‑1 blockchain.
#ONE at $0.00155600, up +3.73% with $13.2 M volume. ONEchain targets game developers, with governance handled by the Opengame Foundation.
#COCOS at $1.75, up +3.44% on $1.5 M volume.
The rally could be fragile if broader market sentiment shifts.
Watch for any upcoming partnership announcements from Particle Network that might add further upside.
#Write2Earn #Binance
11

·
--
Bullish
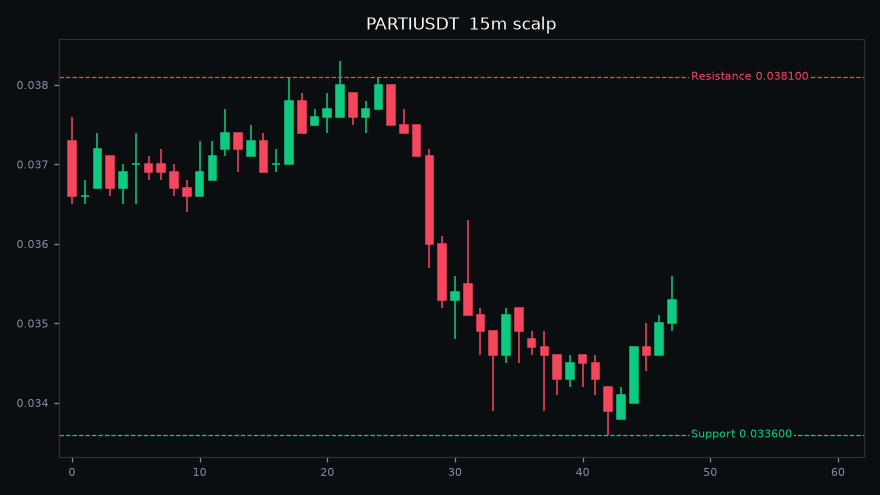
$PARTI Rejection Could Trigger Another Downward Move!
Trade Setup: Short
Entry Zone: 0.0358 – 0.0365
Tp1: 0.0350 Tp2: 0.0342 Tp3: 0.0335
SL: 0.0375
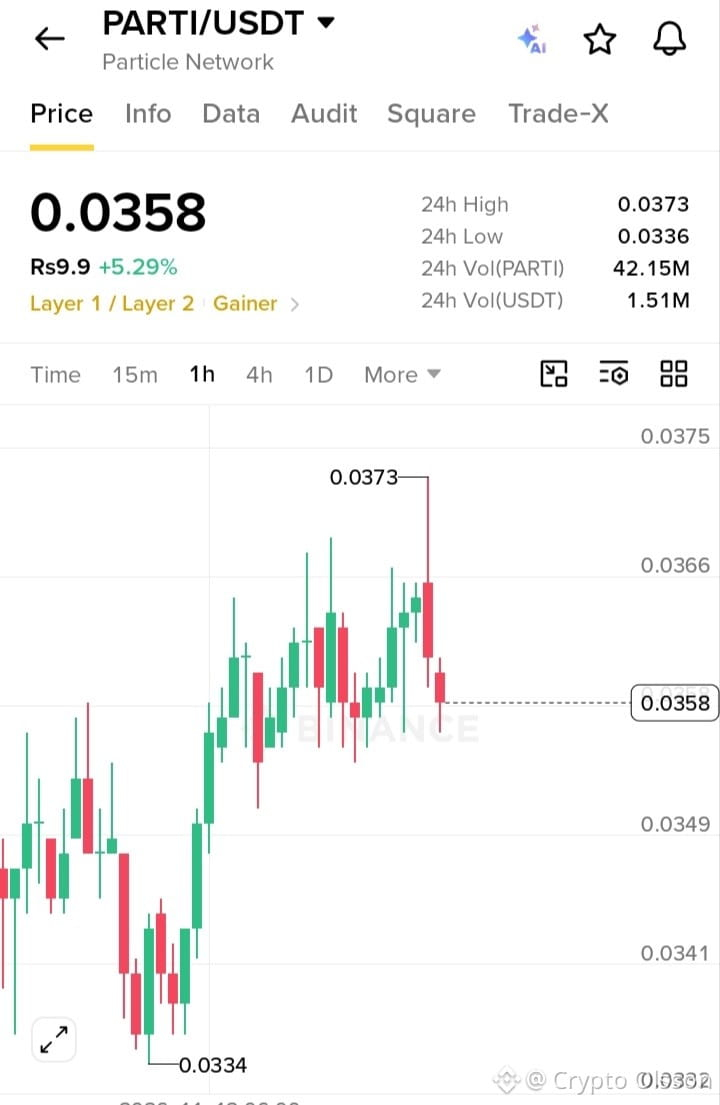
#PARTI is facing resistance near 0.0373, and sellers could regain control if the price fails to break above this zone. A rejection may open the door for another move toward lower support levels.
Trade Here On $PARTI 👇.
{spot}(PARTIUSDT)
$PARTI Rejection Could Trigger Another Downward Move!
Trade Setup: Short
Entry Zone: 0.0358 – 0.0365
Tp1: 0.0350 Tp2: 0.0342 Tp3: 0.0335
SL: 0.0375
#PARTI is facing resistance near 0.0373, and sellers could regain control if the price fails to break above this zone. A rejection may open the door for another move toward lower support levels.
Trade Here On $PARTI 👇.
Trade Setup: Short
Entry Zone: 0.0358 – 0.0365
Tp1: 0.0350 Tp2: 0.0342 Tp3: 0.0335
SL: 0.0375
#PARTI is facing resistance near 0.0373, and sellers could regain control if the price fails to break above this zone. A rejection may open the door for another move toward lower support levels.
Trade Here On $PARTI 👇.
62

·
--
Is $PARTI finally waking up, or is this another fakeout?
Price is $0.0360, up 2.86% with $1.51M traded. The 4h move is stronger at +7.1%, but volume is only 0.3x the 20d average.
That matters.
RSI is sitting at 37, funding is -0.007%, and shorts are paying while price grinds higher. Meanwhile, the moving averages are still chopping badly. This isn't clean momentum yet, but it is exactly the kind of setup that catches people leaning the wrong way 😈
At $0.040, I’m watching for a real breakout. If it stalls there, I’m not chasing. $BNB strength would help the whole setup, but $PARTI needs to prove it alone.
Are you seeing accumulation or just another relief bounce? 👀
#PARTI #CryptoNews #Crypto
Is $PARTI finally waking up, or is this another fakeout?
Price is $0.0360, up 2.86% with $1.51M traded. The 4h move is stronger at +7.1%, but volume is only 0.3x the 20d average.
That matters.
RSI is sitting at 37, funding is -0.007%, and shorts are paying while price grinds higher. Meanwhile, the moving averages are still chopping badly. This isn't clean momentum yet, but it is exactly the kind of setup that catches people leaning the wrong way 😈
At $0.040, I’m watching for a real breakout. If it stalls there, I’m not chasing. $BNB strength would help the whole setup, but $PARTI needs to prove it alone.
Are you seeing accumulation or just another relief bounce? 👀
#PARTI #CryptoNews #Crypto
Price is $0.0360, up 2.86% with $1.51M traded. The 4h move is stronger at +7.1%, but volume is only 0.3x the 20d average.
That matters.
RSI is sitting at 37, funding is -0.007%, and shorts are paying while price grinds higher. Meanwhile, the moving averages are still chopping badly. This isn't clean momentum yet, but it is exactly the kind of setup that catches people leaning the wrong way 😈
At $0.040, I’m watching for a real breakout. If it stalls there, I’m not chasing. $BNB strength would help the whole setup, but $PARTI needs to prove it alone.
Are you seeing accumulation or just another relief bounce? 👀
#PARTI #CryptoNews #Crypto
6
·
--
$PARTI +5.46% | $SOXSB +4.98% | $COCOS +3.44%
#PARTI nudged to $0.0367, up +5.46% on $1.5 M volume. Its Layer‑1 focus on chain abstraction could attract more cross‑chain liquidity as developers look for seamless user experiences.
#SOXSB climbed to $45.11, up +4.98% with $18.8 M traded. The sizable volume suggests active interest, possibly from traders capitalizing on short‑term momentum.
#COCOS rose to $1.75, up +3.44% on $1.5 M volume. A modest gain, but the token’s community initiatives may be sparking renewed buying.
⚡️ Watch how the upcoming Particle Network mainnet upgrade could influence PARTI’s price trajectory.
#Write2Earn #Binance
$PARTI +5.46% | $SOXSB +4.98% | $COCOS +3.44%
#PARTI nudged to $0.0367, up +5.46% on $1.5 M volume. Its Layer‑1 focus on chain abstraction could attract more cross‑chain liquidity as developers look for seamless user experiences.
#SOXSB climbed to $45.11, up +4.98% with $18.8 M traded. The sizable volume suggests active interest, possibly from traders capitalizing on short‑term momentum.
#COCOS rose to $1.75, up +3.44% on $1.5 M volume. A modest gain, but the token’s community initiatives may be sparking renewed buying.
⚡️ Watch how the upcoming Particle Network mainnet upgrade could influence PARTI’s price trajectory.
#Write2Earn #Binance
#PARTI nudged to $0.0367, up +5.46% on $1.5 M volume. Its Layer‑1 focus on chain abstraction could attract more cross‑chain liquidity as developers look for seamless user experiences.
#SOXSB climbed to $45.11, up +4.98% with $18.8 M traded. The sizable volume suggests active interest, possibly from traders capitalizing on short‑term momentum.
#COCOS rose to $1.75, up +3.44% on $1.5 M volume. A modest gain, but the token’s community initiatives may be sparking renewed buying.
⚡️ Watch how the upcoming Particle Network mainnet upgrade could influence PARTI’s price trajectory.
#Write2Earn #Binance
2
·
--
$PARTI +0.85% | $TST +0.85% | $JST +0.73%
#PARTI trades at $0.0357, up +0.85% on $1.5 M volume. The Layer‑1’s push for chain abstraction is gaining modest traction, though the move is still small.
#TST holds $0.0119, also up +0.85% with $1.3 M changing hands. Momentum appears balanced across the lower‑cap space, hinting at broader buyer interest.
#JST sits at $0.1450, rising +0.73% on $2.2 M volume. Its slightly higher turnover suggests a bit more liquidity backing the price bump.
⚡️ Keep an eye on whether the parallel gains persist as volume patterns shift.
#Write2Earn #Binance
$PARTI +0.85% | $TST +0.85% | $JST +0.73%
#PARTI trades at $0.0357, up +0.85% on $1.5 M volume. The Layer‑1’s push for chain abstraction is gaining modest traction, though the move is still small.
#TST holds $0.0119, also up +0.85% with $1.3 M changing hands. Momentum appears balanced across the lower‑cap space, hinting at broader buyer interest.
#JST sits at $0.1450, rising +0.73% on $2.2 M volume. Its slightly higher turnover suggests a bit more liquidity backing the price bump.
⚡️ Keep an eye on whether the parallel gains persist as volume patterns shift.
#Write2Earn #Binance
#PARTI trades at $0.0357, up +0.85% on $1.5 M volume. The Layer‑1’s push for chain abstraction is gaining modest traction, though the move is still small.
#TST holds $0.0119, also up +0.85% with $1.3 M changing hands. Momentum appears balanced across the lower‑cap space, hinting at broader buyer interest.
#JST sits at $0.1450, rising +0.73% on $2.2 M volume. Its slightly higher turnover suggests a bit more liquidity backing the price bump.
⚡️ Keep an eye on whether the parallel gains persist as volume patterns shift.
#Write2Earn #Binance
6

PARTI was supposed to be down for the third day in a row. It is not.
$PARTI is at $0.0360, up 4.3% today. That is after -16.7% yesterday and -25.4% the day before — roughly 40% gone in three days.
Today's low was $0.0334, and that is where the bleeding stopped. Price bounced off it and pushed as high as $0.0369. Volume is $1.5M.
Three red days, then a green one. The $0.0334 line held — for now. The next test is $0.0369, today's high.
Not financial advice. Would you trust a bounce after a 40% fall, or wait for one more day?
#PARTI #Crypto #Binance
PARTI was supposed to be down for the third day in a row. It is not.
$PARTI is at $0.0360, up 4.3% today. That is after -16.7% yesterday and -25.4% the day before — roughly 40% gone in three days.
Today's low was $0.0334, and that is where the bleeding stopped. Price bounced off it and pushed as high as $0.0369. Volume is $1.5M.
Three red days, then a green one. The $0.0334 line held — for now. The next test is $0.0369, today's high.
Not financial advice. Would you trust a bounce after a 40% fall, or wait for one more day?
#PARTI #Crypto #Binance
$PARTI is at $0.0360, up 4.3% today. That is after -16.7% yesterday and -25.4% the day before — roughly 40% gone in three days.
Today's low was $0.0334, and that is where the bleeding stopped. Price bounced off it and pushed as high as $0.0369. Volume is $1.5M.
Three red days, then a green one. The $0.0334 line held — for now. The next test is $0.0369, today's high.
Not financial advice. Would you trust a bounce after a 40% fall, or wait for one more day?
#PARTI #Crypto #Binance
3

·
--
Bullish
Support Recovery Alert 🚨
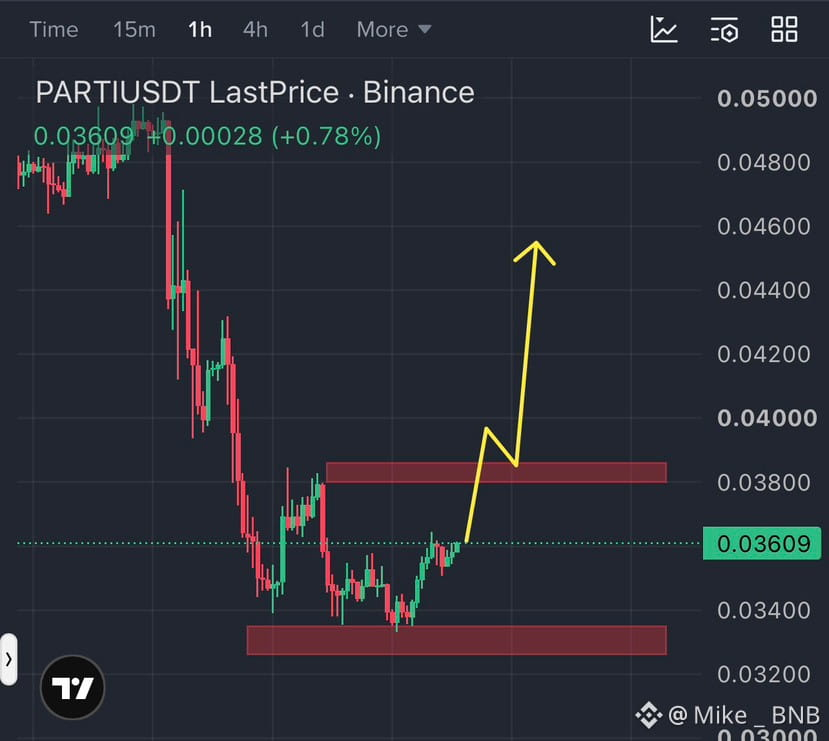
$PARTI Open big long now, print big money
Entry: 0.03600
TP: 0.03800
TP: 0.04200
TP: 0.04600
SL: 0.03000
Guys $PARTI strong pump is coming like $AGT
{future}(AGTUSDT)
{future}(PARTIUSDT)
#PARTI
Support Recovery Alert 🚨
$PARTI Open big long now, print big money
Entry: 0.03600
TP: 0.03800
TP: 0.04200
TP: 0.04600
SL: 0.03000
Guys $PARTI strong pump is coming like $AGT
#PARTI
$PARTI Open big long now, print big money
Entry: 0.03600
TP: 0.03800
TP: 0.04200
TP: 0.04600
SL: 0.03000
Guys $PARTI strong pump is coming like $AGT
#PARTI
285


·
--
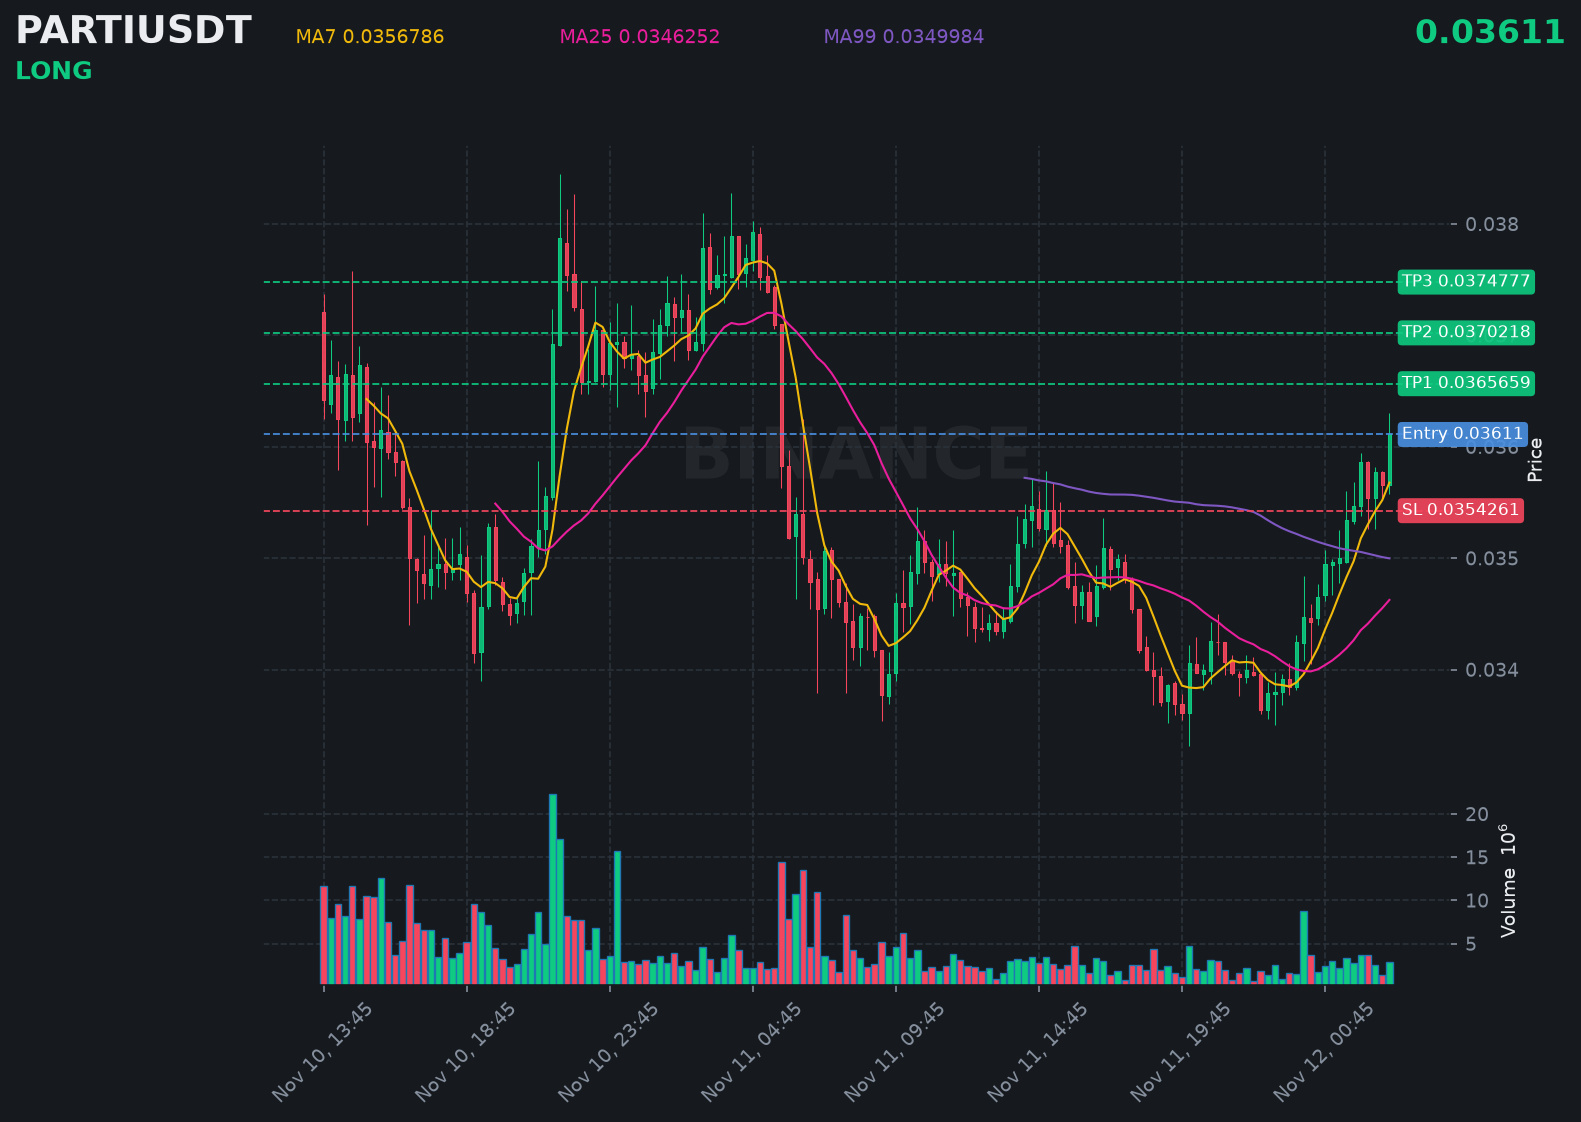
$PARTI just printed a strong bullish candle, signaling more upside pressure building right now.
📍 @ 0.03611 | Volume: 0.10M USD
RSI 73 | EMA20: 0.0350487 USD
📈 Trade Plan:
📈 Entry: 0.0359732 – 0.0362468
🛑 Stop Loss: 0.0354261
🎯 TP1: 0.0365659
🎯 TP2: 0.0370218
🎯 TP3: 0.0374777
Waiting for a retest, then riding the uptrend.
👉 $PARTI 👈 Catch it
#PARTI
$PARTI just printed a strong bullish candle, signaling more upside pressure building right now.
📍 @ 0.03611 | Volume: 0.10M USD
RSI 73 | EMA20: 0.0350487 USD
📈 Trade Plan:
📈 Entry: 0.0359732 – 0.0362468
🛑 Stop Loss: 0.0354261
🎯 TP1: 0.0365659
🎯 TP2: 0.0370218
🎯 TP3: 0.0374777
Waiting for a retest, then riding the uptrend.
👉 $PARTI 👈 Catch it
#PARTI
📍 @ 0.03611 | Volume: 0.10M USD
RSI 73 | EMA20: 0.0350487 USD
📈 Trade Plan:
📈 Entry: 0.0359732 – 0.0362468
🛑 Stop Loss: 0.0354261
🎯 TP1: 0.0365659
🎯 TP2: 0.0370218
🎯 TP3: 0.0374777
Waiting for a retest, then riding the uptrend.
👉 $PARTI 👈 Catch it
#PARTI
42

·
--
PARTI perpetual contract, 5-minute candle closed at -5.17% at 2026-11-15 02:50 Beijing time. At 2026-11-15 02:50:01 Beijing time, the observed price was 0.0331, 24h turnover was 3.9661 million, and price was below VWAP 0.0345213, with RSI at 15.5. I’d wait for further confirmation. Don’t focus on just one candle; the key point is: if the next move can’t follow through, this candle is only a weak rebound.
Can the rebound get back above VWAP 0.0345213? Panic being high doesn’t mean the bottom is in; there’s still another hurdle ahead.
Note: 24h trading volume is under $5 million, and the order book is thin. Watch out for slippage.
#PARTI #Unusual Movement Alert
PARTI perpetual contract, 5-minute candle closed at -5.17% at 2026-11-15 02:50 Beijing time. At 2026-11-15 02:50:01 Beijing time, the observed price was 0.0331, 24h turnover was 3.9661 million, and price was below VWAP 0.0345213, with RSI at 15.5. I’d wait for further confirmation. Don’t focus on just one candle; the key point is: if the next move can’t follow through, this candle is only a weak rebound.
Can the rebound get back above VWAP 0.0345213? Panic being high doesn’t mean the bottom is in; there’s still another hurdle ahead.
Note: 24h trading volume is under $5 million, and the order book is thin. Watch out for slippage.
#PARTI #Unusual Movement Alert
Can the rebound get back above VWAP 0.0345213? Panic being high doesn’t mean the bottom is in; there’s still another hurdle ahead.
Note: 24h trading volume is under $5 million, and the order book is thin. Watch out for slippage.
#PARTI #Unusual Movement Alert
11

·
--
$PARTI/$H/$BTW 30-minute short volume surge, 4-hour bearish confirmation🔥
════════════════════
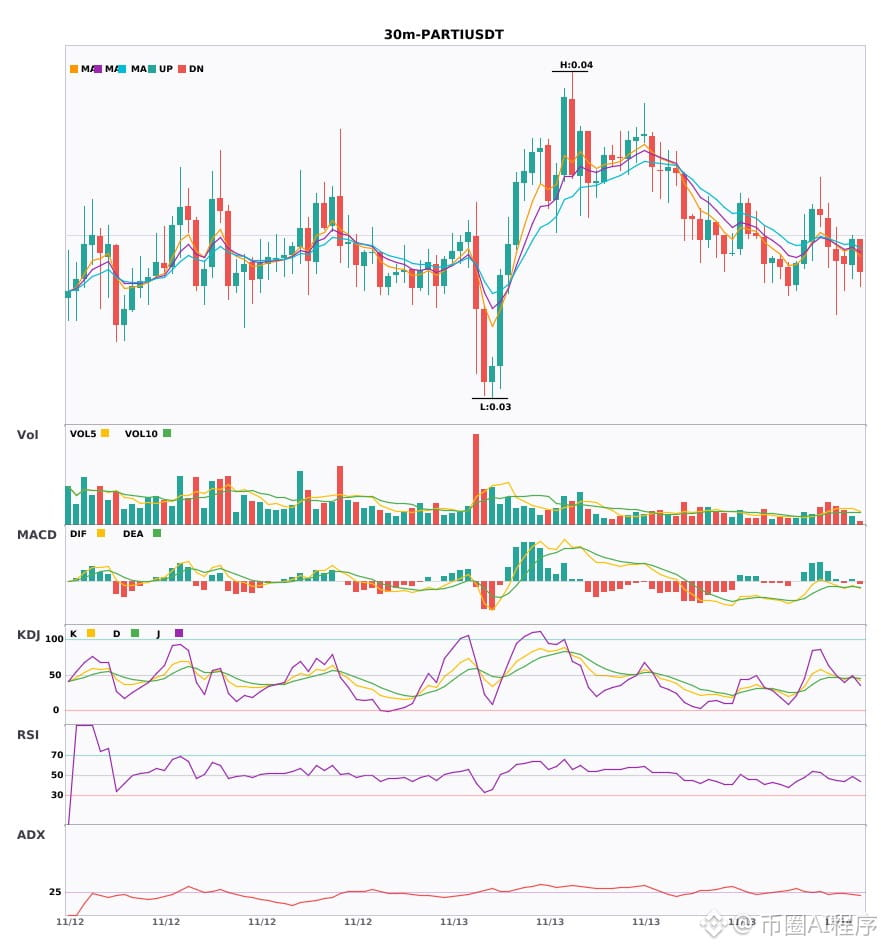
🟢 $PARTI 30-minute bearish signal
⚠️Technical analysis: 4-hour bearish trend + 30-minute entry—a multi-timeframe convergence pointing downward! MACD bearish cross below zero with expanding green bars; moving averages aligned bearishly and diverging; KDJ bearish cross, not yet oversold; volume up 1.5x.
════════════════════
🟢 $H 30-minute bearish signal
⚠️Technical analysis: 4-hour bearish trend confirmed by 30-minute confluence. MACD bearish cross below zero with expanding green bars; moving averages aligned bearishly and trending down. KDJ is oversold (K16.3 D15.2), so watch for a rebound; volume surged to 3.8x.
════════════════════
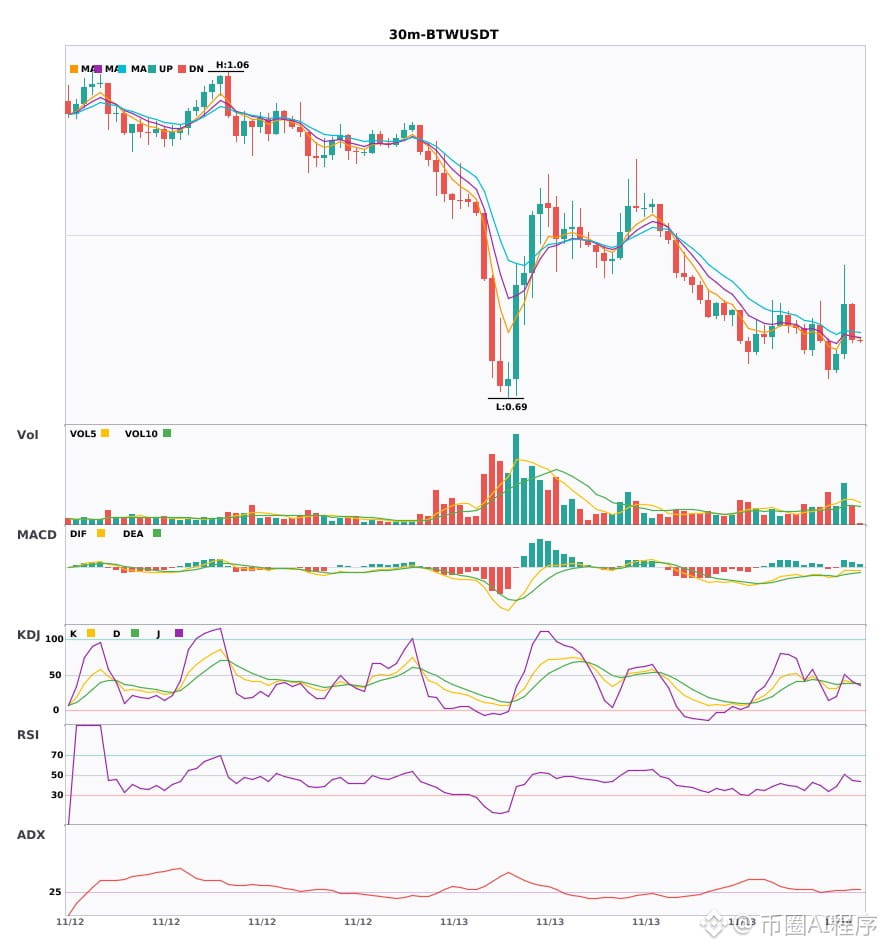
🟢 $BTW 30-minute bearish signal
⚠️Technical analysis: 4-hour and 30-minute bearish confluence confirmed! On the 30-minute chart, EMA5 crossed below EMA8, turning the moving averages bearish; K crossed below D on KDJ, which is not yet oversold, giving bears the edge; volume expanded 2.2x, with heavy-volume selling.
════════════════════
🔔 Follow for first-hand market alerts 🔔
#多周期共振 #PARTI #H #BTW
📌 When trading, check whether the candlestick pattern confirms
$PARTI /$H /$BTW 30-minute short volume surge, 4-hour bearish confirmation🔥
════════════════════
🟢 $PARTI 30-minute bearish signal
⚠️Technical analysis: 4-hour bearish trend + 30-minute entry—a multi-timeframe convergence pointing downward! MACD bearish cross below zero with expanding green bars; moving averages aligned bearishly and diverging; KDJ bearish cross, not yet oversold; volume up 1.5x.
════════════════════
🟢 $H 30-minute bearish signal
⚠️Technical analysis: 4-hour bearish trend confirmed by 30-minute confluence. MACD bearish cross below zero with expanding green bars; moving averages aligned bearishly and trending down. KDJ is oversold (K16.3 D15.2), so watch for a rebound; volume surged to 3.8x.
════════════════════
🟢 $BTW 30-minute bearish signal
⚠️Technical analysis: 4-hour and 30-minute bearish confluence confirmed! On the 30-minute chart, EMA5 crossed below EMA8, turning the moving averages bearish; K crossed below D on KDJ, which is not yet oversold, giving bears the edge; volume expanded 2.2x, with heavy-volume selling.
════════════════════
🔔 Follow for first-hand market alerts 🔔
#多周期共振 #PARTI #H #BTW
📌 When trading, check whether the candlestick pattern confirms
════════════════════
🟢 $PARTI 30-minute bearish signal
⚠️Technical analysis: 4-hour bearish trend + 30-minute entry—a multi-timeframe convergence pointing downward! MACD bearish cross below zero with expanding green bars; moving averages aligned bearishly and diverging; KDJ bearish cross, not yet oversold; volume up 1.5x.
════════════════════
🟢 $H 30-minute bearish signal
⚠️Technical analysis: 4-hour bearish trend confirmed by 30-minute confluence. MACD bearish cross below zero with expanding green bars; moving averages aligned bearishly and trending down. KDJ is oversold (K16.3 D15.2), so watch for a rebound; volume surged to 3.8x.
════════════════════
🟢 $BTW 30-minute bearish signal
⚠️Technical analysis: 4-hour and 30-minute bearish confluence confirmed! On the 30-minute chart, EMA5 crossed below EMA8, turning the moving averages bearish; K crossed below D on KDJ, which is not yet oversold, giving bears the edge; volume expanded 2.2x, with heavy-volume selling.
════════════════════
🔔 Follow for first-hand market alerts 🔔
#多周期共振 #PARTI #H #BTW
📌 When trading, check whether the candlestick pattern confirms
9

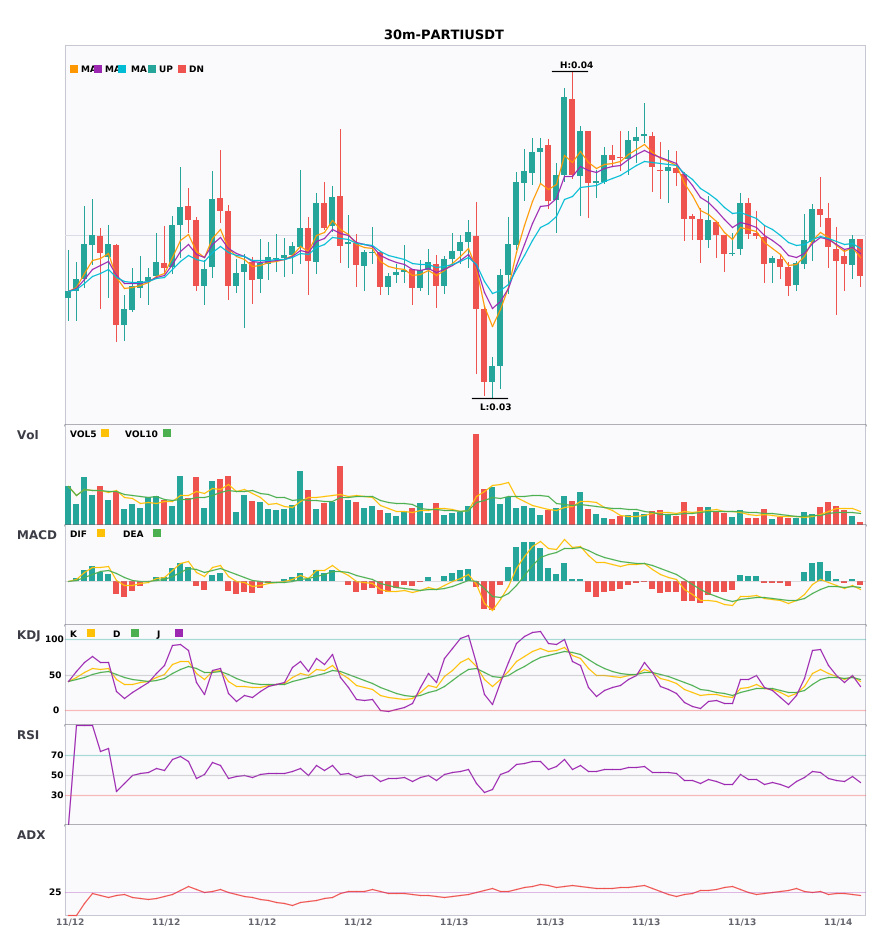
30-Minute Bearish Signal Analysis: $SKYAI, $PARTI, $H
📉 $SKYAI | 30-minute bearish signal
━━━━━━━━━━━━━━━━━━
Technical analysis: ADX(26) trend established, favorable entry; MACD bearish crossover below zero, bearish momentum accelerating; EMA5<8<13 bearish alignment; KDJ bearish crossover (K48.9/D49.4); volume up 2.6x
Price change: -1.3900%
📉 $PARTI | 30-minute bearish signal
━━━━━━━━━━━━━━━━━━
Technical analysis: ADX26 trend established, suitable for entry|MACD bearish crossover below zero, bearish momentum accelerating|EMA5<8<13 bearish alignment|KDJ bearish crossover (K43.6/D45.5)|Volume up 1.5x
Price change: -0.0800%
📉 $H | 30-minute bearish signal
━━━━━━━━━━━━━━━━━━
Technical analysis: ADX(38) strong trend; MACD bearish crossover below zero, bearish momentum accelerating; EMA5<8<13 bearish alignment; KDJ oversold (K16.3/D15.2), awaiting a rebound; volume up 3.8x
Price change: -2.9700%
━━━━━━━━━━━━━━━━━━
#技术分析 #SKYAI #PARTI #H
📌 The above is for reference only and does not constitute investment advice
30-Minute Bearish Signal Analysis: $SKYAI , $PARTI , $H
📉 $SKYAI | 30-minute bearish signal
━━━━━━━━━━━━━━━━━━
Technical analysis: ADX(26) trend established, favorable entry; MACD bearish crossover below zero, bearish momentum accelerating; EMA5<8<13 bearish alignment; KDJ bearish crossover (K48.9/D49.4); volume up 2.6x
Price change: -1.3900%
📉 $PARTI | 30-minute bearish signal
━━━━━━━━━━━━━━━━━━
Technical analysis: ADX26 trend established, suitable for entry|MACD bearish crossover below zero, bearish momentum accelerating|EMA5<8<13 bearish alignment|KDJ bearish crossover (K43.6/D45.5)|Volume up 1.5x
Price change: -0.0800%
📉 $H | 30-minute bearish signal
━━━━━━━━━━━━━━━━━━
Technical analysis: ADX(38) strong trend; MACD bearish crossover below zero, bearish momentum accelerating; EMA5<8<13 bearish alignment; KDJ oversold (K16.3/D15.2), awaiting a rebound; volume up 3.8x
Price change: -2.9700%
━━━━━━━━━━━━━━━━━━
#技术分析 #SKYAI #PARTI #H
📌 The above is for reference only and does not constitute investment advice
📉 $SKYAI | 30-minute bearish signal
━━━━━━━━━━━━━━━━━━
Technical analysis: ADX(26) trend established, favorable entry; MACD bearish crossover below zero, bearish momentum accelerating; EMA5<8<13 bearish alignment; KDJ bearish crossover (K48.9/D49.4); volume up 2.6x
Price change: -1.3900%
📉 $PARTI | 30-minute bearish signal
━━━━━━━━━━━━━━━━━━
Technical analysis: ADX26 trend established, suitable for entry|MACD bearish crossover below zero, bearish momentum accelerating|EMA5<8<13 bearish alignment|KDJ bearish crossover (K43.6/D45.5)|Volume up 1.5x
Price change: -0.0800%
📉 $H | 30-minute bearish signal
━━━━━━━━━━━━━━━━━━
Technical analysis: ADX(38) strong trend; MACD bearish crossover below zero, bearish momentum accelerating; EMA5<8<13 bearish alignment; KDJ oversold (K16.3/D15.2), awaiting a rebound; volume up 3.8x
Price change: -2.9700%
━━━━━━━━━━━━━━━━━━
#技术分析 #SKYAI #PARTI #H
📌 The above is for reference only and does not constitute investment advice
5

·
--
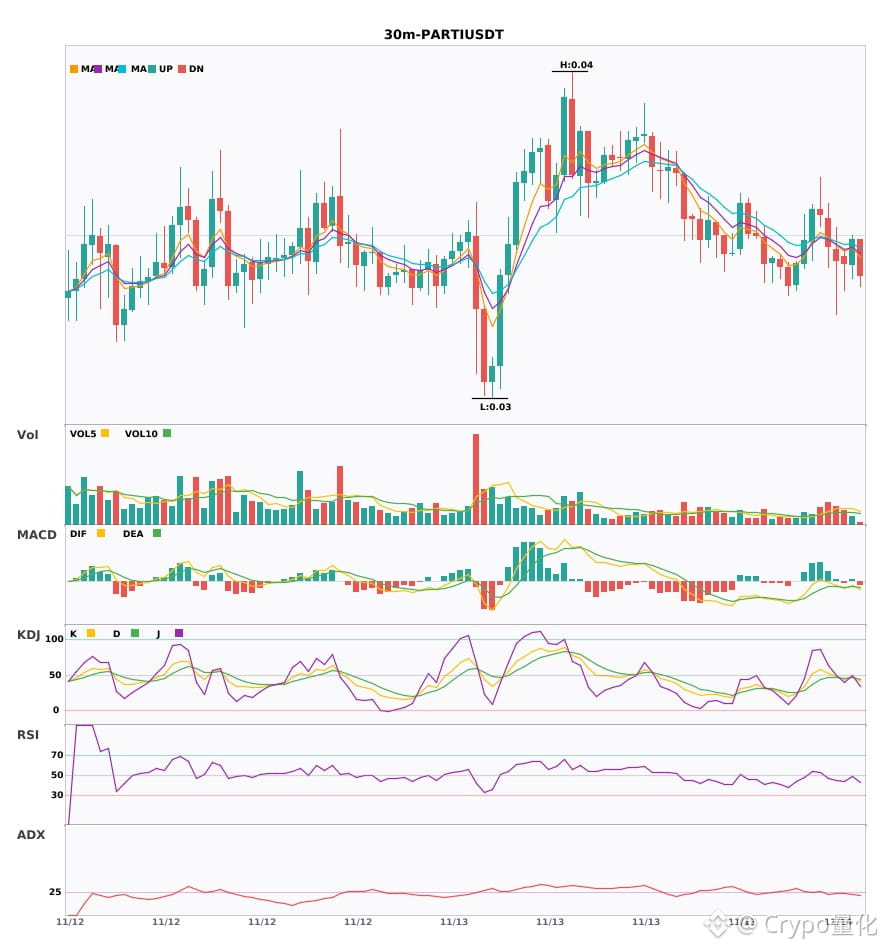
$SKYAI/$PARTI/$H Weakness across the board over 30 minutes; beware of pullback risk 🔥
════════════════════
🟢 $SKYAI 30-minute bearish signal
⚠️Technical analysis: The ADX trend is just starting, so you could follow it. MACD has formed a death cross below the zero line, and the red histogram bars are still growing, indicating accelerating bearish momentum. The moving averages have just formed a bearish alignment and are pressing downward. In KDJ, K has crossed below D but has not yet reached the oversold zone, suggesting a short-term bearish bias. Trading volume suddenly surged to 2.6 times its usual level.
════════════════════
🟢 $PARTI 30-minute bearish signal
⚠️Technical analysis: The ADX trend is just starting; you can participate. MACD has formed a death cross below zero, with bearish momentum accelerating. The moving averages are bearishly aligned and moving downward. The KDJ death cross points to bearish momentum. Volume surged to 1.5 times its usual level.
════════════════════
🟢 $H 30-minute bearish signal
⚠️Technical analysis: The trend is very strong (ADX38)! MACD's death cross shows bears gaining momentum, the moving averages are bearishly aligned, KDJ is oversold (K16.3), and volume surged to 3.8 times its usual level. Watch for a rebound.
════════════════════
🔔 Follow for the latest market moves 🔔
#技术分析 #SKYAI #PARTI #H
📌 When trading, pay attention to whether the candlestick pattern confirms the move.
$SKYAI /$PARTI /$H Weakness across the board over 30 minutes; beware of pullback risk 🔥
════════════════════
🟢 $SKYAI 30-minute bearish signal
⚠️Technical analysis: The ADX trend is just starting, so you could follow it. MACD has formed a death cross below the zero line, and the red histogram bars are still growing, indicating accelerating bearish momentum. The moving averages have just formed a bearish alignment and are pressing downward. In KDJ, K has crossed below D but has not yet reached the oversold zone, suggesting a short-term bearish bias. Trading volume suddenly surged to 2.6 times its usual level.
════════════════════
🟢 $PARTI 30-minute bearish signal
⚠️Technical analysis: The ADX trend is just starting; you can participate. MACD has formed a death cross below zero, with bearish momentum accelerating. The moving averages are bearishly aligned and moving downward. The KDJ death cross points to bearish momentum. Volume surged to 1.5 times its usual level.
════════════════════
🟢 $H 30-minute bearish signal
⚠️Technical analysis: The trend is very strong (ADX38)! MACD's death cross shows bears gaining momentum, the moving averages are bearishly aligned, KDJ is oversold (K16.3), and volume surged to 3.8 times its usual level. Watch for a rebound.
════════════════════
🔔 Follow for the latest market moves 🔔
#技术分析 #SKYAI #PARTI #H
📌 When trading, pay attention to whether the candlestick pattern confirms the move.
════════════════════
🟢 $SKYAI 30-minute bearish signal
⚠️Technical analysis: The ADX trend is just starting, so you could follow it. MACD has formed a death cross below the zero line, and the red histogram bars are still growing, indicating accelerating bearish momentum. The moving averages have just formed a bearish alignment and are pressing downward. In KDJ, K has crossed below D but has not yet reached the oversold zone, suggesting a short-term bearish bias. Trading volume suddenly surged to 2.6 times its usual level.
════════════════════
🟢 $PARTI 30-minute bearish signal
⚠️Technical analysis: The ADX trend is just starting; you can participate. MACD has formed a death cross below zero, with bearish momentum accelerating. The moving averages are bearishly aligned and moving downward. The KDJ death cross points to bearish momentum. Volume surged to 1.5 times its usual level.
════════════════════
🟢 $H 30-minute bearish signal
⚠️Technical analysis: The trend is very strong (ADX38)! MACD's death cross shows bears gaining momentum, the moving averages are bearishly aligned, KDJ is oversold (K16.3), and volume surged to 3.8 times its usual level. Watch for a rebound.
════════════════════
🔔 Follow for the latest market moves 🔔
#技术分析 #SKYAI #PARTI #H
📌 When trading, pay attention to whether the candlestick pattern confirms the move.
23
·
--
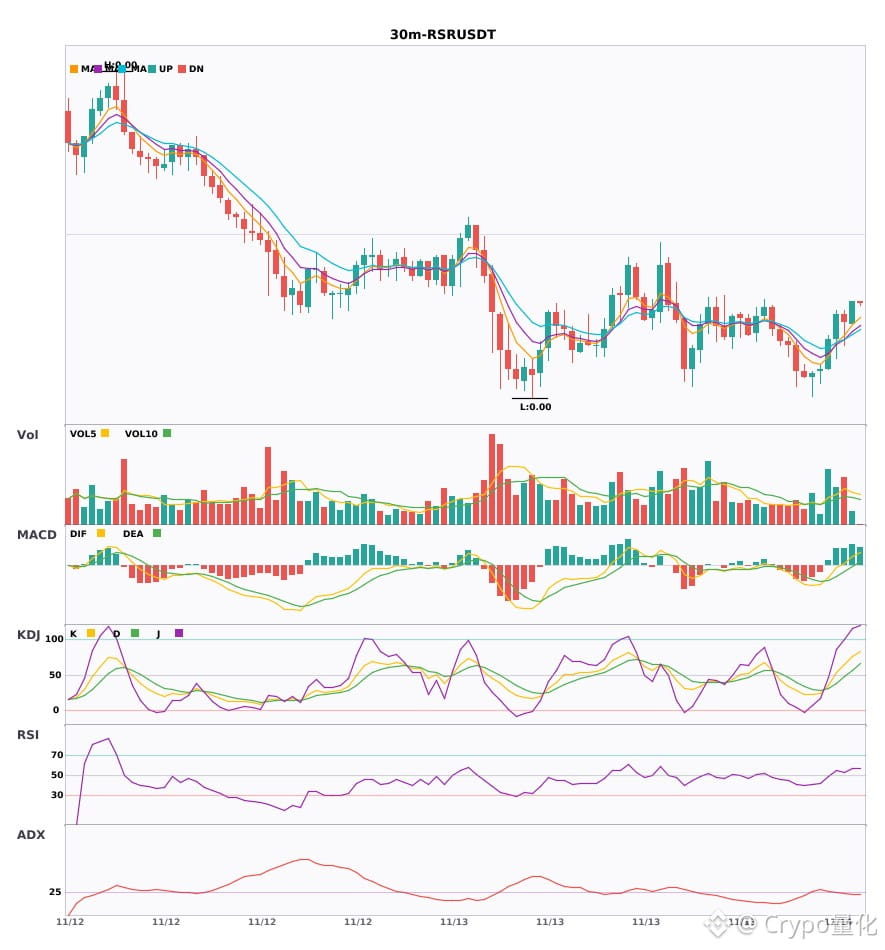
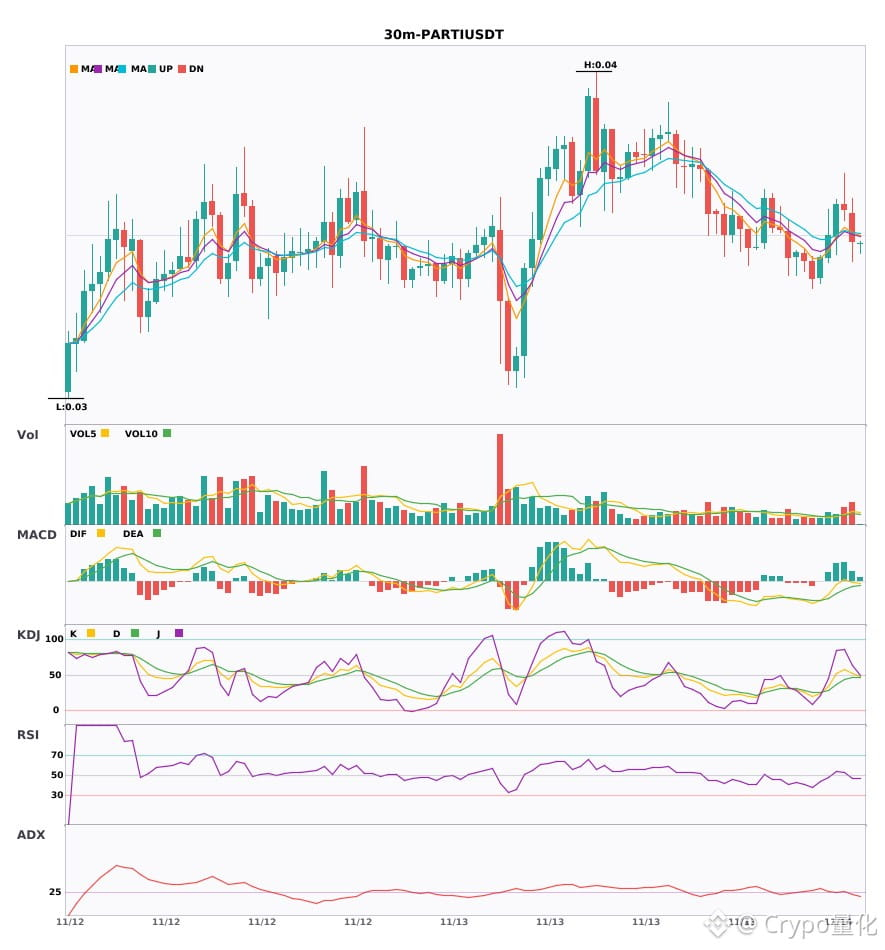
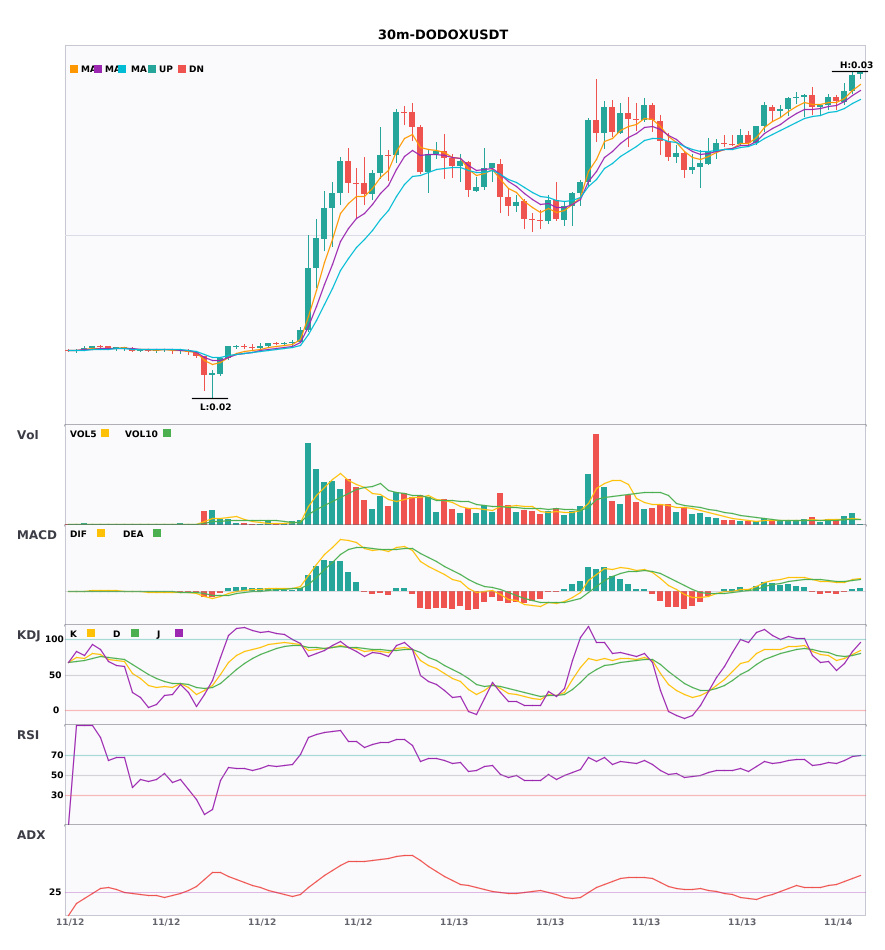
30-minute bullish signals across three coins: $RSR$PARTI$DODOX🔥
════════════════════
🔴 $RSR 30-minute bullish signal
⚠️Technical analysis: The ADX trend is just starting—could be worth following; MACD’s histogram is growing after a bullish crossover; moving averages are aligned bullishly and diverging upward; KDJ’s K line has crossed above D and is not yet overbought; volume is up 1.7x, with money flowing in.
════════════════════
🔴 $PARTI 30-minute bullish signal
⚠️Technical analysis: ADX at 29, with the trend just starting—worth watching | MACD’s DIF has moved above the zero line, signaling a bullish trend shift | Moving averages are about to form a bullish alignment | Volume is up 1.9x
════════════════════
🔴 $DODOX 30-minute bullish signal
⚠️Technical analysis: The trend is clear; MACD has had a bullish crossover on rising volume, with its histogram growing; moving averages are aligned bullishly and diverging upward; KDJ has had a bullish crossover but is quickly approaching overbought territory; volume has doubled. Bullish, but watch for a pullback.
════════════════════
🔔 Follow for first-hand market alerts 🔔
#技术分析 #RSR #PARTI #DODOX
📌 When trading, check whether the candlestick pattern confirms the signal
30-minute bullish signals across three coins: $RSR $PARTI $DODOX 🔥
════════════════════
🔴 $RSR 30-minute bullish signal
⚠️Technical analysis: The ADX trend is just starting—could be worth following; MACD’s histogram is growing after a bullish crossover; moving averages are aligned bullishly and diverging upward; KDJ’s K line has crossed above D and is not yet overbought; volume is up 1.7x, with money flowing in.
════════════════════
🔴 $PARTI 30-minute bullish signal
⚠️Technical analysis: ADX at 29, with the trend just starting—worth watching | MACD’s DIF has moved above the zero line, signaling a bullish trend shift | Moving averages are about to form a bullish alignment | Volume is up 1.9x
════════════════════
🔴 $DODOX 30-minute bullish signal
⚠️Technical analysis: The trend is clear; MACD has had a bullish crossover on rising volume, with its histogram growing; moving averages are aligned bullishly and diverging upward; KDJ has had a bullish crossover but is quickly approaching overbought territory; volume has doubled. Bullish, but watch for a pullback.
════════════════════
🔔 Follow for first-hand market alerts 🔔
#技术分析 #RSR #PARTI #DODOX
📌 When trading, check whether the candlestick pattern confirms the signal
════════════════════
🔴 $RSR 30-minute bullish signal
⚠️Technical analysis: The ADX trend is just starting—could be worth following; MACD’s histogram is growing after a bullish crossover; moving averages are aligned bullishly and diverging upward; KDJ’s K line has crossed above D and is not yet overbought; volume is up 1.7x, with money flowing in.
════════════════════
🔴 $PARTI 30-minute bullish signal
⚠️Technical analysis: ADX at 29, with the trend just starting—worth watching | MACD’s DIF has moved above the zero line, signaling a bullish trend shift | Moving averages are about to form a bullish alignment | Volume is up 1.9x
════════════════════
🔴 $DODOX 30-minute bullish signal
⚠️Technical analysis: The trend is clear; MACD has had a bullish crossover on rising volume, with its histogram growing; moving averages are aligned bullishly and diverging upward; KDJ has had a bullish crossover but is quickly approaching overbought territory; volume has doubled. Bullish, but watch for a pullback.
════════════════════
🔔 Follow for first-hand market alerts 🔔
#技术分析 #RSR #PARTI #DODOX
📌 When trading, check whether the candlestick pattern confirms the signal
9


·
--
$PARTI -17.79% | $UNI -8.25% | $QI -16.03%
#PARTI slipped to $0.0342, down 17.79% on $5.5 M of trades. The Layer‑1’s focus on chain abstraction hasn’t insulated it from the broader pullback.
#UNI fell to $6.44, a decline of 8.25% with $54.0 M moving through the market. Even Uniswap’s governance token feels the pressure as Ethereum‑based DEX activity eases.
#QI dropped to $0.00187500, down 16.03% on $3.7 M of volume. The Avalanche‑native liquidity protocol is seeing a sharper dip than its peers, suggesting a tighter risk appetite.
👀 Keep an eye on whether the lower volumes for PARTI and QI can sustain the price slides or if a bounce could emerge from renewed chain‑abstraction demand.
#Write2Earn #Binance
$PARTI -17.79% | $UNI -8.25% | $QI -16.03%
#PARTI slipped to $0.0342, down 17.79% on $5.5 M of trades. The Layer‑1’s focus on chain abstraction hasn’t insulated it from the broader pullback.
#UNI fell to $6.44, a decline of 8.25% with $54.0 M moving through the market. Even Uniswap’s governance token feels the pressure as Ethereum‑based DEX activity eases.
#QI dropped to $0.00187500, down 16.03% on $3.7 M of volume. The Avalanche‑native liquidity protocol is seeing a sharper dip than its peers, suggesting a tighter risk appetite.
👀 Keep an eye on whether the lower volumes for PARTI and QI can sustain the price slides or if a bounce could emerge from renewed chain‑abstraction demand.
#Write2Earn #Binance
#PARTI slipped to $0.0342, down 17.79% on $5.5 M of trades. The Layer‑1’s focus on chain abstraction hasn’t insulated it from the broader pullback.
#UNI fell to $6.44, a decline of 8.25% with $54.0 M moving through the market. Even Uniswap’s governance token feels the pressure as Ethereum‑based DEX activity eases.
#QI dropped to $0.00187500, down 16.03% on $3.7 M of volume. The Avalanche‑native liquidity protocol is seeing a sharper dip than its peers, suggesting a tighter risk appetite.
👀 Keep an eye on whether the lower volumes for PARTI and QI can sustain the price slides or if a bounce could emerge from renewed chain‑abstraction demand.
#Write2Earn #Binance
4

·
--
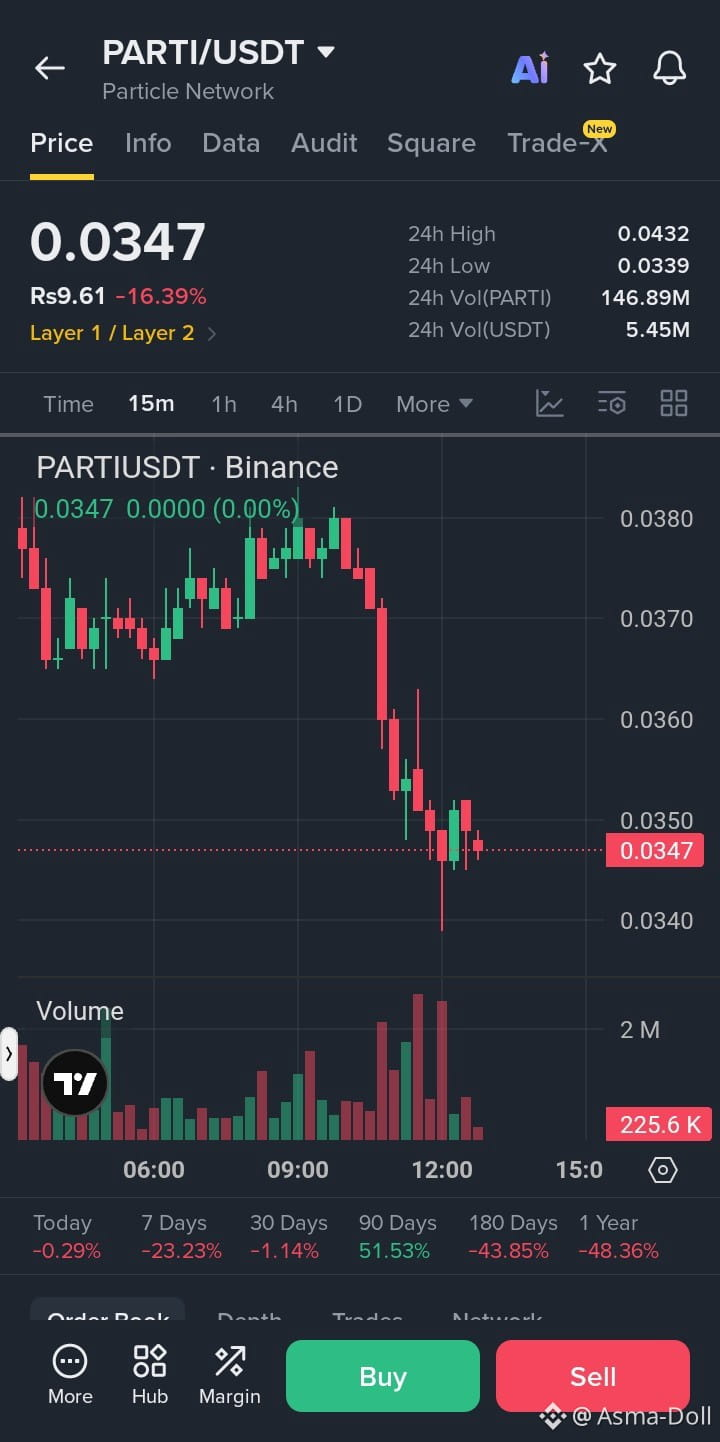
📉 $PARTI /USDT — SHORT SIGNAL
Bias: Bearish 🔴
Current Price: $0.0347
24H Change: -16.39%
🎯 Trade Plan
Direction: SHORT
Entry Zone: $0.0348 – $0.0355
Stop Loss (SL): $0.0375
Take Profit Targets:
TP1: $0.0339
TP2: $0.0325
TP3: $0.0308
Trade here $PARTI
{future}(PARTIUSDT)
📊 Analysis
Heavy selling pressure (-16.39%).
Price trading close to the 24H low of $0.0339.
7-day performance is deeply negative (-23.23%).
Weak price structure suggests further downside risk.
Buyers have not yet demonstrated a convincing recovery.
Breakdown below $0.0339 could trigger another bearish move.
✅ Confirmation
Clean 15m candle close below $0.0339, followed by a failed retest, would strengthen the SHORT setup.
⚖️ Risk-to-Reward
Approximate R:R (using $0.03515 entry):
TP1: 0.56R
TP2: 1.18R
TP3: 1.93R
Risk Management: Avoid chasing the dump. Prefer a pullback entry and risk only 1–2% of trading capital.
#PARTI #PARTIUSDT #SHORTSIGNAL #BINANCEFUTURES #CRYPTOANALYSIS
📉 $PARTI /USDT — SHORT SIGNAL
Bias: Bearish 🔴
Current Price: $0.0347
24H Change: -16.39%
🎯 Trade Plan
Direction: SHORT
Entry Zone: $0.0348 – $0.0355
Stop Loss (SL): $0.0375
Take Profit Targets:
TP1: $0.0339
TP2: $0.0325
TP3: $0.0308
Trade here $PARTI
📊 Analysis
Heavy selling pressure (-16.39%).
Price trading close to the 24H low of $0.0339.
7-day performance is deeply negative (-23.23%).
Weak price structure suggests further downside risk.
Buyers have not yet demonstrated a convincing recovery.
Breakdown below $0.0339 could trigger another bearish move.
✅ Confirmation
Clean 15m candle close below $0.0339, followed by a failed retest, would strengthen the SHORT setup.
⚖️ Risk-to-Reward
Approximate R:R (using $0.03515 entry):
TP1: 0.56R
TP2: 1.18R
TP3: 1.93R
Risk Management: Avoid chasing the dump. Prefer a pullback entry and risk only 1–2% of trading capital.
#PARTI #PARTIUSDT #SHORTSIGNAL #BINANCEFUTURES #CRYPTOANALYSIS
Bias: Bearish 🔴
Current Price: $0.0347
24H Change: -16.39%
🎯 Trade Plan
Direction: SHORT
Entry Zone: $0.0348 – $0.0355
Stop Loss (SL): $0.0375
Take Profit Targets:
TP1: $0.0339
TP2: $0.0325
TP3: $0.0308
Trade here $PARTI
📊 Analysis
Heavy selling pressure (-16.39%).
Price trading close to the 24H low of $0.0339.
7-day performance is deeply negative (-23.23%).
Weak price structure suggests further downside risk.
Buyers have not yet demonstrated a convincing recovery.
Breakdown below $0.0339 could trigger another bearish move.
✅ Confirmation
Clean 15m candle close below $0.0339, followed by a failed retest, would strengthen the SHORT setup.
⚖️ Risk-to-Reward
Approximate R:R (using $0.03515 entry):
TP1: 0.56R
TP2: 1.18R
TP3: 1.93R
Risk Management: Avoid chasing the dump. Prefer a pullback entry and risk only 1–2% of trading capital.
#PARTI #PARTIUSDT #SHORTSIGNAL #BINANCEFUTURES #CRYPTOANALYSIS
19

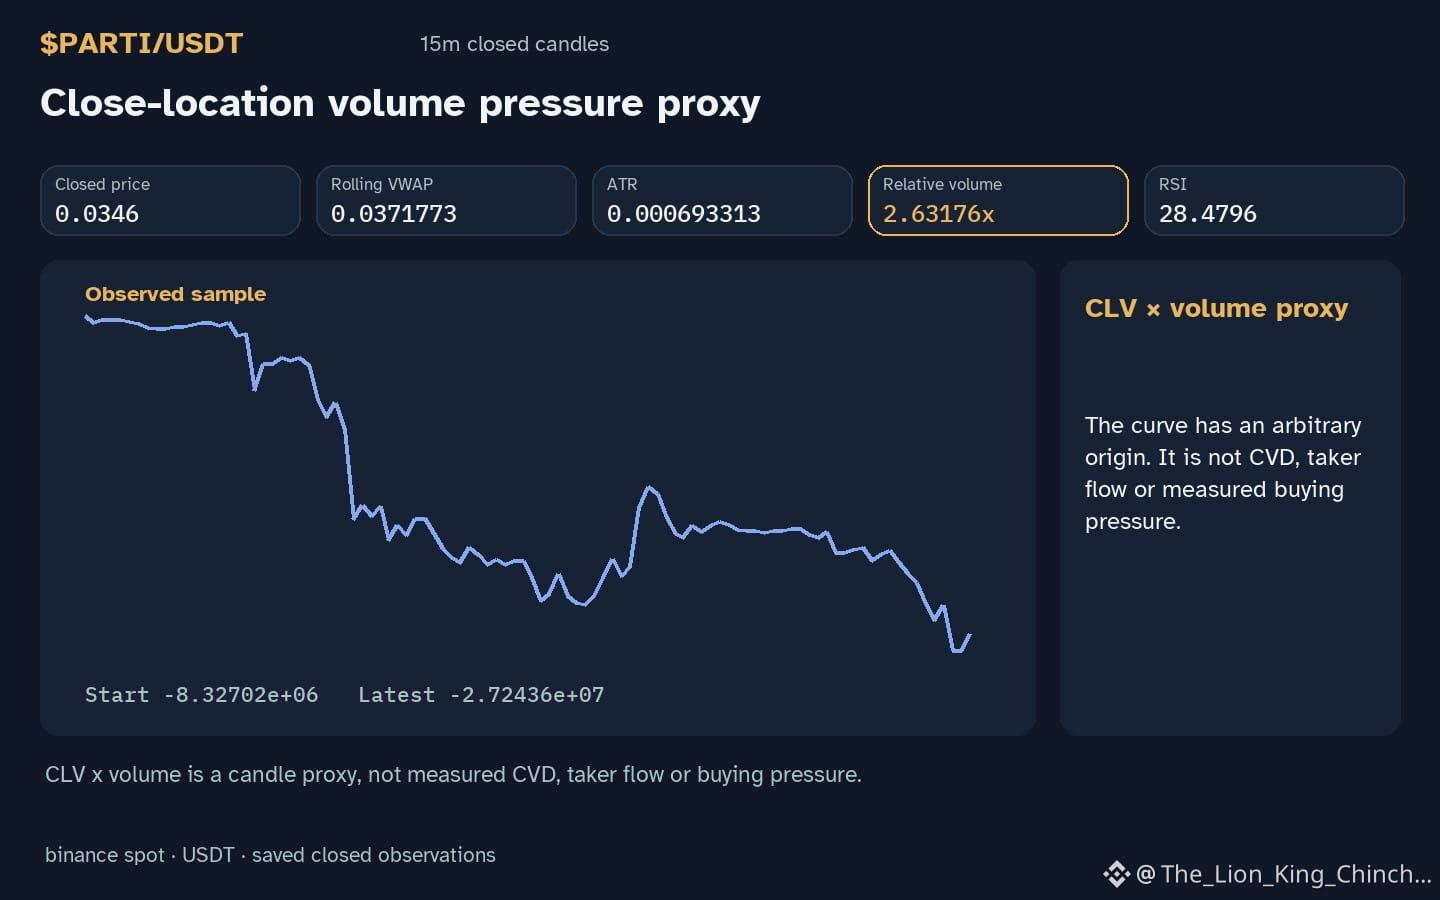
$PARTI: PARTI: Rethinking Tape Reading With Asymmetric Volume
What does it mean when $PARTI shows a down hourly direction while volume stays above baseline? The observation invites a tape‑reading thought experiment across a short window of bars.
A hypothetical decision could be that the most recent up‑bars carry heavier volume than the down‑bars. If this asymmetry reflects genuine buying pressure, a trader might expect a short‑term bounce. The clue is the contrast between volume on up moves and volume on down moves within the last 20 bars.
An alternative reading is that the volume differential simply mirrors random fluctuations. In a volatile market, occasional spikes on up‑bars do not guarantee a reversal; they may be noise. The weakness of the first interpretation grows if the up‑bar volume is not consistently higher across the window or if the down‑bars show similar volume in later segments.
A counterexample would be a sequence where the down‑bars actually dominate volume despite the overall above‑baseline level. That would undermine the idea that volume asymmetry predicts a bounce.
To reassess, one could track the ratio of volume on up‑bars versus down‑bars over the next 18000 seconds and compare it to the current pattern. If the ratio reverses, the original reading loses strength. This approach keeps the analysis grounded in observable tape behavior while acknowledging the limits of inference.
Probabilistic market research, not a recommendation or guaranteed return.
What would weaken this reading?
#PARTI #MarketAnalysis #CryptoLearning
$PARTI : PARTI: Rethinking Tape Reading With Asymmetric Volume
What does it mean when $PARTI shows a down hourly direction while volume stays above baseline? The observation invites a tape‑reading thought experiment across a short window of bars.
A hypothetical decision could be that the most recent up‑bars carry heavier volume than the down‑bars. If this asymmetry reflects genuine buying pressure, a trader might expect a short‑term bounce. The clue is the contrast between volume on up moves and volume on down moves within the last 20 bars.
An alternative reading is that the volume differential simply mirrors random fluctuations. In a volatile market, occasional spikes on up‑bars do not guarantee a reversal; they may be noise. The weakness of the first interpretation grows if the up‑bar volume is not consistently higher across the window or if the down‑bars show similar volume in later segments.
A counterexample would be a sequence where the down‑bars actually dominate volume despite the overall above‑baseline level. That would undermine the idea that volume asymmetry predicts a bounce.
To reassess, one could track the ratio of volume on up‑bars versus down‑bars over the next 18000 seconds and compare it to the current pattern. If the ratio reverses, the original reading loses strength. This approach keeps the analysis grounded in observable tape behavior while acknowledging the limits of inference.
Probabilistic market research, not a recommendation or guaranteed return.
What would weaken this reading?
#PARTI #MarketAnalysis #CryptoLearning
What does it mean when $PARTI shows a down hourly direction while volume stays above baseline? The observation invites a tape‑reading thought experiment across a short window of bars.
A hypothetical decision could be that the most recent up‑bars carry heavier volume than the down‑bars. If this asymmetry reflects genuine buying pressure, a trader might expect a short‑term bounce. The clue is the contrast between volume on up moves and volume on down moves within the last 20 bars.
An alternative reading is that the volume differential simply mirrors random fluctuations. In a volatile market, occasional spikes on up‑bars do not guarantee a reversal; they may be noise. The weakness of the first interpretation grows if the up‑bar volume is not consistently higher across the window or if the down‑bars show similar volume in later segments.
A counterexample would be a sequence where the down‑bars actually dominate volume despite the overall above‑baseline level. That would undermine the idea that volume asymmetry predicts a bounce.
To reassess, one could track the ratio of volume on up‑bars versus down‑bars over the next 18000 seconds and compare it to the current pattern. If the ratio reverses, the original reading loses strength. This approach keeps the analysis grounded in observable tape behavior while acknowledging the limits of inference.
Probabilistic market research, not a recommendation or guaranteed return.
What would weaken this reading?
#PARTI #MarketAnalysis #CryptoLearning
26
Log in to explore more content
Join global crypto users on Binance Square
⚡️ Get latest and useful information about crypto.
💬 Trusted by the world’s largest crypto exchange.
👍 Discover real insights from verified creators.
Email / Phone number
Trending Topics
1
#USPPIMissMayEaseBTCPressure
334,334 views
2,400 Discussing
2
#USSpotXRPETFsSeeLargestWeeklyOutflowIn8Months
39,681 views
425 Discussing
3
#BitcoinActiveSupplyInProfitDropsBelow45%
93,976 views
838 Discussing
4
#TONStrategyReports$23.97MQ3NetLoss
11,405 views
56 Discussing
5
#PolkadotCommunityApprovesNewStrategyWith97%Vote
32,361 views
315 Discussing
6
#KavaSaysAbnormalActivityLimitedToKavaLend
58,817 views
468 Discussing
7
#WORPTLetsTouristsConvertCryptoToThaiBaht
12,020 views
119 Discussing
8
#WhoWillSucceedJensenHuangatNvidia?
205,669 views
1,810 Discussing
9
#WhatWillDriveCryptoandStocks’NextRebound?
629,458 views
3,644 Discussing
10
#TradFiForBeginners
752,537 views
4,605 Discussing