
#longtermanalysis
longtermanalysis
229,724 views
184 Discussing
Hot
Latest

·
--

Article
ZCASH : THE NEXT BIG COMEBACK OR A WARNING SIGN?Analyzing Zcash's Fundamentals, Mining Economics, Technical Structure & What's Next for Price
The Zcash market is entering an interesting phase.
After an extraordinary recovery and a powerful rally, ZEC is now experiencing a significant correction. While short-term momentum has weakened, its longer-term fundamentals and privacy-focused technology continue to make it one of the more interesting projects to watch in the cryptocurrency market.
But is this correction creating a buying opportunity, or is another leg down coming?
Let's break down the fundamentals, mining economics, technical indicators, and potential price scenarios.
A Strong Project Facing a Critical Market Test
Zcash (ZEC) is a privacy-focused cryptocurrency designed to enable shielded transactions using zero-knowledge cryptography.
Its maximum supply is capped at 21 million coins, similar to Bitcoin's $BTC monetary supply limit.
According to the November 14 market snapshot:
Market capitalization: Approximately $15.37 billion.Fully diluted valuation: Approximately $19.02 billion.Circulating supply: 16.96 million ZEC.Maximum supply: 21 million ZEC.Reference price in our TradingView screenshot: $904.72.
Approximately 80.8% of the maximum supply is already circulating.
This limited supply structure is an important part of Zcash's long term investment thesis. However, scarcity alone does not guarantee higher prices. Demand, adoption, liquidity, and investor confidence remain essential.
Mining Revenue: A Fundamental Warning Worth Watching
One of the most interesting indicators in our analysis is Zcash mining revenue.
The TradingView fundamentals dashboard shows:
Earlier miner revenue readings around $1.7M–$1.9M.Latest miner revenue around $1.35M.Fee share of miner revenue falling to approximately 0.05%.
This suggests that miner revenue has weakened during the observed period.
Why does this matter?
Mining economics are important because miners have operating costs, including electricity, hardware, and infrastructure. If revenue declines for an extended period, some miners may face pressure on profitability.
Another important observation is the extremely small contribution from transaction fees.
At approximately 0.05%, the fee share indicates that mining revenue remains overwhelmingly dependent on block rewards.
This is something investors should monitor closely.
However, declining miner revenue does not automatically mean miners are selling their holdings. Exchange deposits and miner wallet movements would need to confirm that.
The Technology and Ecosystem Story
Zcash's long term opportunity is closely connected to financial privacy.
Privacy is an important feature of digital financial infrastructure, particularly for users and institutions that require transaction confidentiality.
Its shielded transaction technology gives Zcash a distinct identity in the cryptocurrency market.
Network improvements and better wallet experiences could help strengthen adoption.
The important question is whether technological development translates into:
More shielded transactions.Greater network activity.More active users.Improved ecosystem participation.Sustainable demand for ZEC.
These are the metrics worth watching beyond price speculation.
Technical Analysis: Is ZEC Preparing for a Recovery?
The technical picture is mixed.
Our November 14 market data snapshots indicate:
Daily RSI around 32.Weekly RSI around 51.Price trading above the referenced 200-day moving average.High volatility and significant speculative positioning.
The daily RSI suggests that selling momentum is approaching oversold territory.
But remember:
Oversold does not mean the market must immediately reverse.
A bullish reversal needs confirmation through price structure, volume, and sustained buying pressure.
Important support levels
The first important support area is:
$890 – 900
If buyers defend this region and establish a higher low on the 4-hour chart, a relief rally could develop.
If this support fails, the next areas to watch are:
$850.$823.$805.
A sustained breakdown could open the door to a deeper correction.
Important resistance levels
For bulls, the first major challenge is:
$940–956
A successful recovery above this region would improve the short-term outlook.
Additional resistance and upside targets:
$991.$1,012.$1,048.$1,104.
A daily close above $956 followed by a successful retest would provide a stronger bullish confirmation than simply seeing an intraday price spike.
{spot}(ZECUSDT)
If ZEC holds $890–900, buyers return, and price reclaims $956, the market could attempt a recovery toward:
$991 → $1,012 → $1,048 → $1,104.
This is the scenario bulls want to see.
FOR now Sideways Consolidation
ZEC could remain trapped between approximately $890 and $990.
This would suggest that the market is searching for direction while buyers and sellers establish a new balance.
A period of consolidation could create a stronger foundation for the next move.
Bearish Continuation 👇
If ZEC loses $890 and establishes a daily close below approximately $879, the bullish recovery thesis becomes weaker.
The market could then revisit:
$850 → $823 → $805.
Investors should avoid treating every dip as an automatic buying opportunity.
MY Trading Approach: Patience Over Prediction
For a spot swing trading strategy, we prefer confirmation rather than chasing volatility.
Two setups deserve attention:
Setup 1: Support Reversal
Watch the $885–910 area.
Look for:
A strong 4-hour rejection.RSI recovery.A higher low.Increasing buying volume.
Setup 2: Breakout and Retest
Watch for a confirmed move above $956.
A successful retest of $940–956 could provide a more convincing entry opportunity.
Risk management remains essential. Position sizes should be determined by the distance to invalidation, not by excitement about potential upside.
What Could Make ZEC Stronger Long Term?
We believe investors should focus on five fundamental developments:
Growth in shielded transaction adoption.Sustainable network activity.Improving miner economics.Better ecosystem development.Stronger spot-market demand.
The limited supply and privacy focused technology provide an interesting foundation, but long term value depends on actual adoption and demand.
Is Zcash Worth Watching?
Our overall assessment is cautiously bullish over the longer term, but short-term caution is necessary.
ZEC has an interesting technological proposition, a capped supply, and a history of powerful price movements.
However, declining miner revenue, weak daily momentum, and high volatility mean that investors should remain disciplined.
The $890–900 region is important for the immediate structure, while $940–956 is the first major recovery zone.
Our key takeaway:
We don't need to catch the exact bottom. We need to recognize when the market begins confirming a reversal.
Zcash remains a cryptocurrency worth watching closely. The next move could be significant, but confirmation will matter more than speculation.
Stay patient. Watch the levels. Manage the risk.
Disclaimer: This article is for educational and informational purposes only. It is not financial advice or a recommendation to buy or sell ZEC. Market prices and technical levels are time sensitive and should be independently verified before making trading decisions.
#zec #LongTermAnalysis
ZCASH : THE NEXT BIG COMEBACK OR A WARNING SIGN?
Analyzing Zcash's Fundamentals, Mining Economics, Technical Structure & What's Next for Price
The Zcash market is entering an interesting phase.
After an extraordinary recovery and a powerful rally, ZEC is now experiencing a significant correction. While short-term momentum has weakened, its longer-term fundamentals and privacy-focused technology continue to make it one of the more interesting projects to watch in the cryptocurrency market.
But is this correction creating a buying opportunity, or is another leg down coming?
Let's break down the fundamentals, mining economics, technical indicators, and potential price scenarios.
A Strong Project Facing a Critical Market Test
Zcash (ZEC) is a privacy-focused cryptocurrency designed to enable shielded transactions using zero-knowledge cryptography.
Its maximum supply is capped at 21 million coins, similar to Bitcoin's $BTC monetary supply limit.
According to the November 14 market snapshot:
Market capitalization: Approximately $15.37 billion.Fully diluted valuation: Approximately $19.02 billion.Circulating supply: 16.96 million ZEC.Maximum supply: 21 million ZEC.Reference price in our TradingView screenshot: $904.72.
Approximately 80.8% of the maximum supply is already circulating.
This limited supply structure is an important part of Zcash's long term investment thesis. However, scarcity alone does not guarantee higher prices. Demand, adoption, liquidity, and investor confidence remain essential.
Mining Revenue: A Fundamental Warning Worth Watching
One of the most interesting indicators in our analysis is Zcash mining revenue.
The TradingView fundamentals dashboard shows:
Earlier miner revenue readings around $1.7M–$1.9M.Latest miner revenue around $1.35M.Fee share of miner revenue falling to approximately 0.05%.
This suggests that miner revenue has weakened during the observed period.
Why does this matter?
Mining economics are important because miners have operating costs, including electricity, hardware, and infrastructure. If revenue declines for an extended period, some miners may face pressure on profitability.
Another important observation is the extremely small contribution from transaction fees.
At approximately 0.05%, the fee share indicates that mining revenue remains overwhelmingly dependent on block rewards.
This is something investors should monitor closely.
However, declining miner revenue does not automatically mean miners are selling their holdings. Exchange deposits and miner wallet movements would need to confirm that.
The Technology and Ecosystem Story
Zcash's long term opportunity is closely connected to financial privacy.
Privacy is an important feature of digital financial infrastructure, particularly for users and institutions that require transaction confidentiality.
Its shielded transaction technology gives Zcash a distinct identity in the cryptocurrency market.
Network improvements and better wallet experiences could help strengthen adoption.
The important question is whether technological development translates into:
More shielded transactions.Greater network activity.More active users.Improved ecosystem participation.Sustainable demand for ZEC.
These are the metrics worth watching beyond price speculation.
Technical Analysis: Is ZEC Preparing for a Recovery?
The technical picture is mixed.
Our November 14 market data snapshots indicate:
Daily RSI around 32.Weekly RSI around 51.Price trading above the referenced 200-day moving average.High volatility and significant speculative positioning.
The daily RSI suggests that selling momentum is approaching oversold territory.
But remember:
Oversold does not mean the market must immediately reverse.
A bullish reversal needs confirmation through price structure, volume, and sustained buying pressure.
Important support levels
The first important support area is:
$890 – 900
If buyers defend this region and establish a higher low on the 4-hour chart, a relief rally could develop.
If this support fails, the next areas to watch are:
$850.$823.$805.
A sustained breakdown could open the door to a deeper correction.
Important resistance levels
For bulls, the first major challenge is:
$940–956
A successful recovery above this region would improve the short-term outlook.
Additional resistance and upside targets:
$991.$1,012.$1,048.$1,104.
A daily close above $956 followed by a successful retest would provide a stronger bullish confirmation than simply seeing an intraday price spike.
If ZEC holds $890–900, buyers return, and price reclaims $956, the market could attempt a recovery toward:
$991 → $1,012 → $1,048 → $1,104.
This is the scenario bulls want to see.
FOR now Sideways Consolidation
ZEC could remain trapped between approximately $890 and $990.
This would suggest that the market is searching for direction while buyers and sellers establish a new balance.
A period of consolidation could create a stronger foundation for the next move.
Bearish Continuation 👇
If ZEC loses $890 and establishes a daily close below approximately $879, the bullish recovery thesis becomes weaker.
The market could then revisit:
$850 → $823 → $805.
Investors should avoid treating every dip as an automatic buying opportunity.
MY Trading Approach: Patience Over Prediction
For a spot swing trading strategy, we prefer confirmation rather than chasing volatility.
Two setups deserve attention:
Setup 1: Support Reversal
Watch the $885–910 area.
Look for:
A strong 4-hour rejection.RSI recovery.A higher low.Increasing buying volume.
Setup 2: Breakout and Retest
Watch for a confirmed move above $956.
A successful retest of $940–956 could provide a more convincing entry opportunity.
Risk management remains essential. Position sizes should be determined by the distance to invalidation, not by excitement about potential upside.
What Could Make ZEC Stronger Long Term?
We believe investors should focus on five fundamental developments:
Growth in shielded transaction adoption.Sustainable network activity.Improving miner economics.Better ecosystem development.Stronger spot-market demand.
The limited supply and privacy focused technology provide an interesting foundation, but long term value depends on actual adoption and demand.
Is Zcash Worth Watching?
Our overall assessment is cautiously bullish over the longer term, but short-term caution is necessary.
ZEC has an interesting technological proposition, a capped supply, and a history of powerful price movements.
However, declining miner revenue, weak daily momentum, and high volatility mean that investors should remain disciplined.
The $890–900 region is important for the immediate structure, while $940–956 is the first major recovery zone.
Our key takeaway:
We don't need to catch the exact bottom. We need to recognize when the market begins confirming a reversal.
Zcash remains a cryptocurrency worth watching closely. The next move could be significant, but confirmation will matter more than speculation.
Stay patient. Watch the levels. Manage the risk.
Disclaimer: This article is for educational and informational purposes only. It is not financial advice or a recommendation to buy or sell ZEC. Market prices and technical levels are time sensitive and should be independently verified before making trading decisions.
#zec #LongTermAnalysis
The Zcash market is entering an interesting phase.
After an extraordinary recovery and a powerful rally, ZEC is now experiencing a significant correction. While short-term momentum has weakened, its longer-term fundamentals and privacy-focused technology continue to make it one of the more interesting projects to watch in the cryptocurrency market.
But is this correction creating a buying opportunity, or is another leg down coming?
Let's break down the fundamentals, mining economics, technical indicators, and potential price scenarios.
A Strong Project Facing a Critical Market Test
Zcash (ZEC) is a privacy-focused cryptocurrency designed to enable shielded transactions using zero-knowledge cryptography.
Its maximum supply is capped at 21 million coins, similar to Bitcoin's $BTC monetary supply limit.
According to the November 14 market snapshot:
Market capitalization: Approximately $15.37 billion.Fully diluted valuation: Approximately $19.02 billion.Circulating supply: 16.96 million ZEC.Maximum supply: 21 million ZEC.Reference price in our TradingView screenshot: $904.72.
Approximately 80.8% of the maximum supply is already circulating.
This limited supply structure is an important part of Zcash's long term investment thesis. However, scarcity alone does not guarantee higher prices. Demand, adoption, liquidity, and investor confidence remain essential.
Mining Revenue: A Fundamental Warning Worth Watching
One of the most interesting indicators in our analysis is Zcash mining revenue.
The TradingView fundamentals dashboard shows:
Earlier miner revenue readings around $1.7M–$1.9M.Latest miner revenue around $1.35M.Fee share of miner revenue falling to approximately 0.05%.
This suggests that miner revenue has weakened during the observed period.
Why does this matter?
Mining economics are important because miners have operating costs, including electricity, hardware, and infrastructure. If revenue declines for an extended period, some miners may face pressure on profitability.
Another important observation is the extremely small contribution from transaction fees.
At approximately 0.05%, the fee share indicates that mining revenue remains overwhelmingly dependent on block rewards.
This is something investors should monitor closely.
However, declining miner revenue does not automatically mean miners are selling their holdings. Exchange deposits and miner wallet movements would need to confirm that.
The Technology and Ecosystem Story
Zcash's long term opportunity is closely connected to financial privacy.
Privacy is an important feature of digital financial infrastructure, particularly for users and institutions that require transaction confidentiality.
Its shielded transaction technology gives Zcash a distinct identity in the cryptocurrency market.
Network improvements and better wallet experiences could help strengthen adoption.
The important question is whether technological development translates into:
More shielded transactions.Greater network activity.More active users.Improved ecosystem participation.Sustainable demand for ZEC.
These are the metrics worth watching beyond price speculation.
Technical Analysis: Is ZEC Preparing for a Recovery?
The technical picture is mixed.
Our November 14 market data snapshots indicate:
Daily RSI around 32.Weekly RSI around 51.Price trading above the referenced 200-day moving average.High volatility and significant speculative positioning.
The daily RSI suggests that selling momentum is approaching oversold territory.
But remember:
Oversold does not mean the market must immediately reverse.
A bullish reversal needs confirmation through price structure, volume, and sustained buying pressure.
Important support levels
The first important support area is:
$890 – 900
If buyers defend this region and establish a higher low on the 4-hour chart, a relief rally could develop.
If this support fails, the next areas to watch are:
$850.$823.$805.
A sustained breakdown could open the door to a deeper correction.
Important resistance levels
For bulls, the first major challenge is:
$940–956
A successful recovery above this region would improve the short-term outlook.
Additional resistance and upside targets:
$991.$1,012.$1,048.$1,104.
A daily close above $956 followed by a successful retest would provide a stronger bullish confirmation than simply seeing an intraday price spike.
If ZEC holds $890–900, buyers return, and price reclaims $956, the market could attempt a recovery toward:
$991 → $1,012 → $1,048 → $1,104.
This is the scenario bulls want to see.
FOR now Sideways Consolidation
ZEC could remain trapped between approximately $890 and $990.
This would suggest that the market is searching for direction while buyers and sellers establish a new balance.
A period of consolidation could create a stronger foundation for the next move.
Bearish Continuation 👇
If ZEC loses $890 and establishes a daily close below approximately $879, the bullish recovery thesis becomes weaker.
The market could then revisit:
$850 → $823 → $805.
Investors should avoid treating every dip as an automatic buying opportunity.
MY Trading Approach: Patience Over Prediction
For a spot swing trading strategy, we prefer confirmation rather than chasing volatility.
Two setups deserve attention:
Setup 1: Support Reversal
Watch the $885–910 area.
Look for:
A strong 4-hour rejection.RSI recovery.A higher low.Increasing buying volume.
Setup 2: Breakout and Retest
Watch for a confirmed move above $956.
A successful retest of $940–956 could provide a more convincing entry opportunity.
Risk management remains essential. Position sizes should be determined by the distance to invalidation, not by excitement about potential upside.
What Could Make ZEC Stronger Long Term?
We believe investors should focus on five fundamental developments:
Growth in shielded transaction adoption.Sustainable network activity.Improving miner economics.Better ecosystem development.Stronger spot-market demand.
The limited supply and privacy focused technology provide an interesting foundation, but long term value depends on actual adoption and demand.
Is Zcash Worth Watching?
Our overall assessment is cautiously bullish over the longer term, but short-term caution is necessary.
ZEC has an interesting technological proposition, a capped supply, and a history of powerful price movements.
However, declining miner revenue, weak daily momentum, and high volatility mean that investors should remain disciplined.
The $890–900 region is important for the immediate structure, while $940–956 is the first major recovery zone.
Our key takeaway:
We don't need to catch the exact bottom. We need to recognize when the market begins confirming a reversal.
Zcash remains a cryptocurrency worth watching closely. The next move could be significant, but confirmation will matter more than speculation.
Stay patient. Watch the levels. Manage the risk.
Disclaimer: This article is for educational and informational purposes only. It is not financial advice or a recommendation to buy or sell ZEC. Market prices and technical levels are time sensitive and should be independently verified before making trading decisions.
#zec #LongTermAnalysis
390

·
--
Bearish
🚨🚨GOLD $XAU : Is A MAJOR REVERSAL COMING ?🚨🚨
My target: $3,460 | Time horizon: November 2026 – January 2027
Gold($XAUT ) has maintained its bullish trend on the higher timeframes, but I'm beginning to see warning signs that could point towards a deeper correction.
The higher timeframes 🚨
🔎 1. The 3-Month Chart: Rejection at Higher Levels
The quarterly timeframe remains bullish, but price is showing rejection around levels associated with the previous six months.
This raises the possibility of a deeper pullback before buyers can regain control.
📉 2. The Monthly Chart: Bullish Momentum Is Weakening
Gold remains bullish on the monthly timeframe, but bearish candles are becoming more frequent.
This could indicate increasing selling pressure and a potential shift in market sentiment.
For now, I'm treating this as a warning sign rather than confirmation of a reversal.
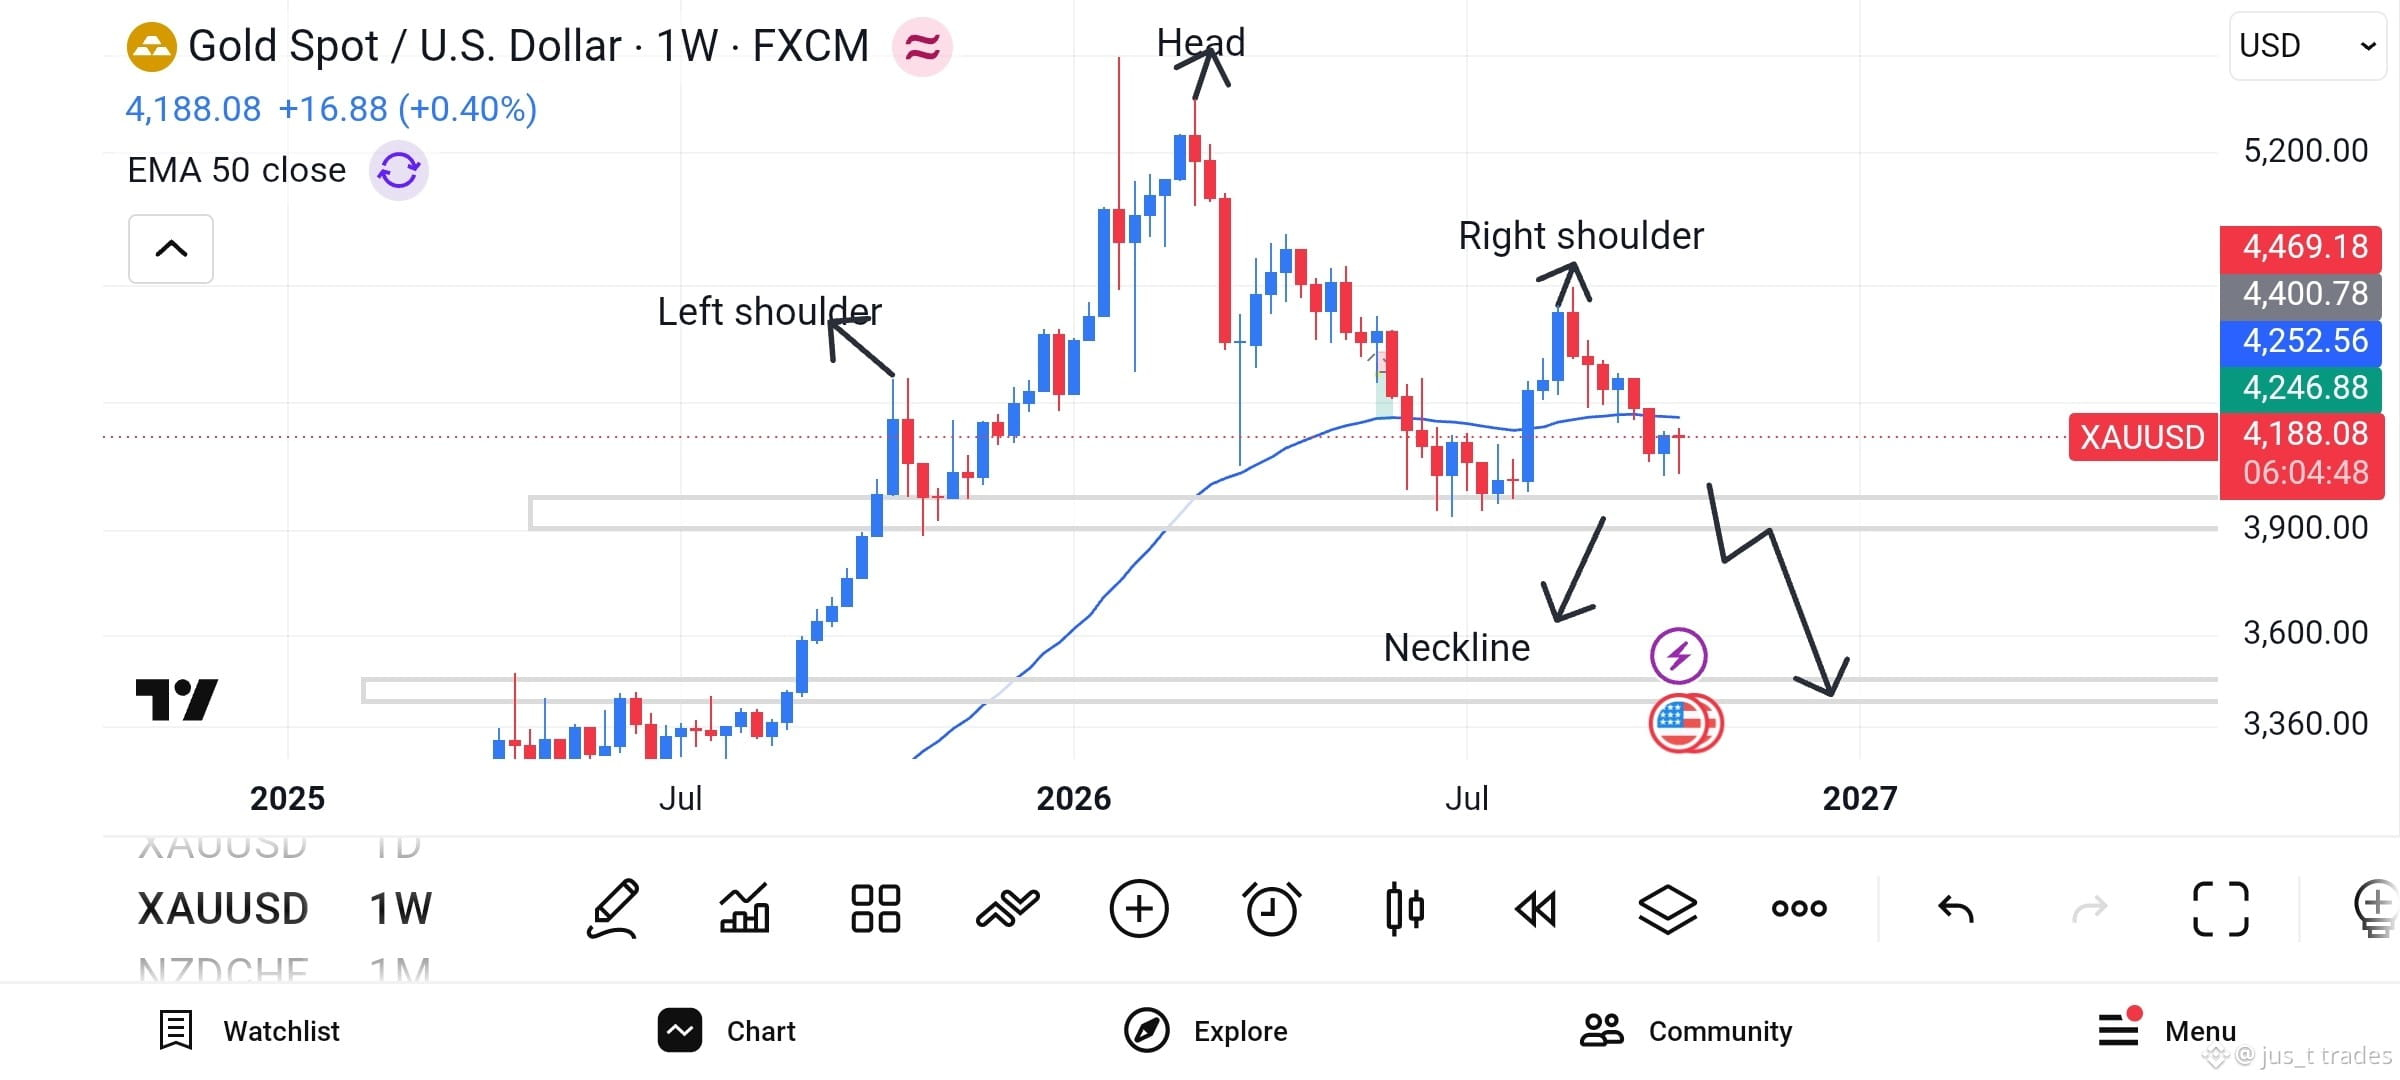
⚠️ 3. The Weekly Chart: A Potential Head and Shoulders Pattern
This is where my attention is focused.
Gold appears to be developing a Head and Shoulders pattern, with the neckline sitting around $4,000.
Over the last seven weeks, five candles have been bearish and only two bullish.
Combined with the weekly price trading below the 50 EMA, this supports my bearish outlook.
However, the neckline has not yet broken, meaning the reversal remains unconfirmed.
🎯 My Prediction: $3,460
Here's the scenario I'm watching:
1️⃣ Gold breaks below the $4,000 neckline.
2️⃣ Price pulls back to retest the broken neckline.
3️⃣ Sellers regain control, potentially driving gold towards the $3,460 major support zone.
My projected window for this move is November 2026 to January 2027.
This is a scenario, not a guaranteed outcome. If gold fails to break the neckline, the bearish setup could weaken or fail entirely.
I'm watching the structure develop rather than assuming the reversal has already happened.
💬 What's your view on gold?
Are we preparing for a deeper correction, or will the bulls defend the trend?$XAUT #Follow4more #LongTermAnalysis #TrendingPrediction
{spot}(XAUTUSDT)
🚨🚨GOLD $XAU : Is A MAJOR REVERSAL COMING ?🚨🚨
My target: $3,460 | Time horizon: November 2026 – January 2027
Gold($XAUT ) has maintained its bullish trend on the higher timeframes, but I'm beginning to see warning signs that could point towards a deeper correction.
The higher timeframes 🚨
🔎 1. The 3-Month Chart: Rejection at Higher Levels
The quarterly timeframe remains bullish, but price is showing rejection around levels associated with the previous six months.
This raises the possibility of a deeper pullback before buyers can regain control.
📉 2. The Monthly Chart: Bullish Momentum Is Weakening
Gold remains bullish on the monthly timeframe, but bearish candles are becoming more frequent.
This could indicate increasing selling pressure and a potential shift in market sentiment.
For now, I'm treating this as a warning sign rather than confirmation of a reversal.
⚠️ 3. The Weekly Chart: A Potential Head and Shoulders Pattern
This is where my attention is focused.
Gold appears to be developing a Head and Shoulders pattern, with the neckline sitting around $4,000.
Over the last seven weeks, five candles have been bearish and only two bullish.
Combined with the weekly price trading below the 50 EMA, this supports my bearish outlook.
However, the neckline has not yet broken, meaning the reversal remains unconfirmed.
🎯 My Prediction: $3,460
Here's the scenario I'm watching:
1️⃣ Gold breaks below the $4,000 neckline.
2️⃣ Price pulls back to retest the broken neckline.
3️⃣ Sellers regain control, potentially driving gold towards the $3,460 major support zone.
My projected window for this move is November 2026 to January 2027.
This is a scenario, not a guaranteed outcome. If gold fails to break the neckline, the bearish setup could weaken or fail entirely.
I'm watching the structure develop rather than assuming the reversal has already happened.
💬 What's your view on gold?
Are we preparing for a deeper correction, or will the bulls defend the trend?$XAUT #Follow4more #LongTermAnalysis #TrendingPrediction
My target: $3,460 | Time horizon: November 2026 – January 2027
Gold($XAUT ) has maintained its bullish trend on the higher timeframes, but I'm beginning to see warning signs that could point towards a deeper correction.
The higher timeframes 🚨
🔎 1. The 3-Month Chart: Rejection at Higher Levels
The quarterly timeframe remains bullish, but price is showing rejection around levels associated with the previous six months.
This raises the possibility of a deeper pullback before buyers can regain control.
📉 2. The Monthly Chart: Bullish Momentum Is Weakening
Gold remains bullish on the monthly timeframe, but bearish candles are becoming more frequent.
This could indicate increasing selling pressure and a potential shift in market sentiment.
For now, I'm treating this as a warning sign rather than confirmation of a reversal.
⚠️ 3. The Weekly Chart: A Potential Head and Shoulders Pattern
This is where my attention is focused.
Gold appears to be developing a Head and Shoulders pattern, with the neckline sitting around $4,000.
Over the last seven weeks, five candles have been bearish and only two bullish.
Combined with the weekly price trading below the 50 EMA, this supports my bearish outlook.
However, the neckline has not yet broken, meaning the reversal remains unconfirmed.
🎯 My Prediction: $3,460
Here's the scenario I'm watching:
1️⃣ Gold breaks below the $4,000 neckline.
2️⃣ Price pulls back to retest the broken neckline.
3️⃣ Sellers regain control, potentially driving gold towards the $3,460 major support zone.
My projected window for this move is November 2026 to January 2027.
This is a scenario, not a guaranteed outcome. If gold fails to break the neckline, the bearish setup could weaken or fail entirely.
I'm watching the structure develop rather than assuming the reversal has already happened.
💬 What's your view on gold?
Are we preparing for a deeper correction, or will the bulls defend the trend?$XAUT #Follow4more #LongTermAnalysis #TrendingPrediction
1
197

$SOL Long Term Analysis — Realistic Targets for 2026 📊👀
A lot of people on Crypto Twitter are calling for $400-$500 SOL in 2026. Here is my honest take. 🧐
Current market structure:
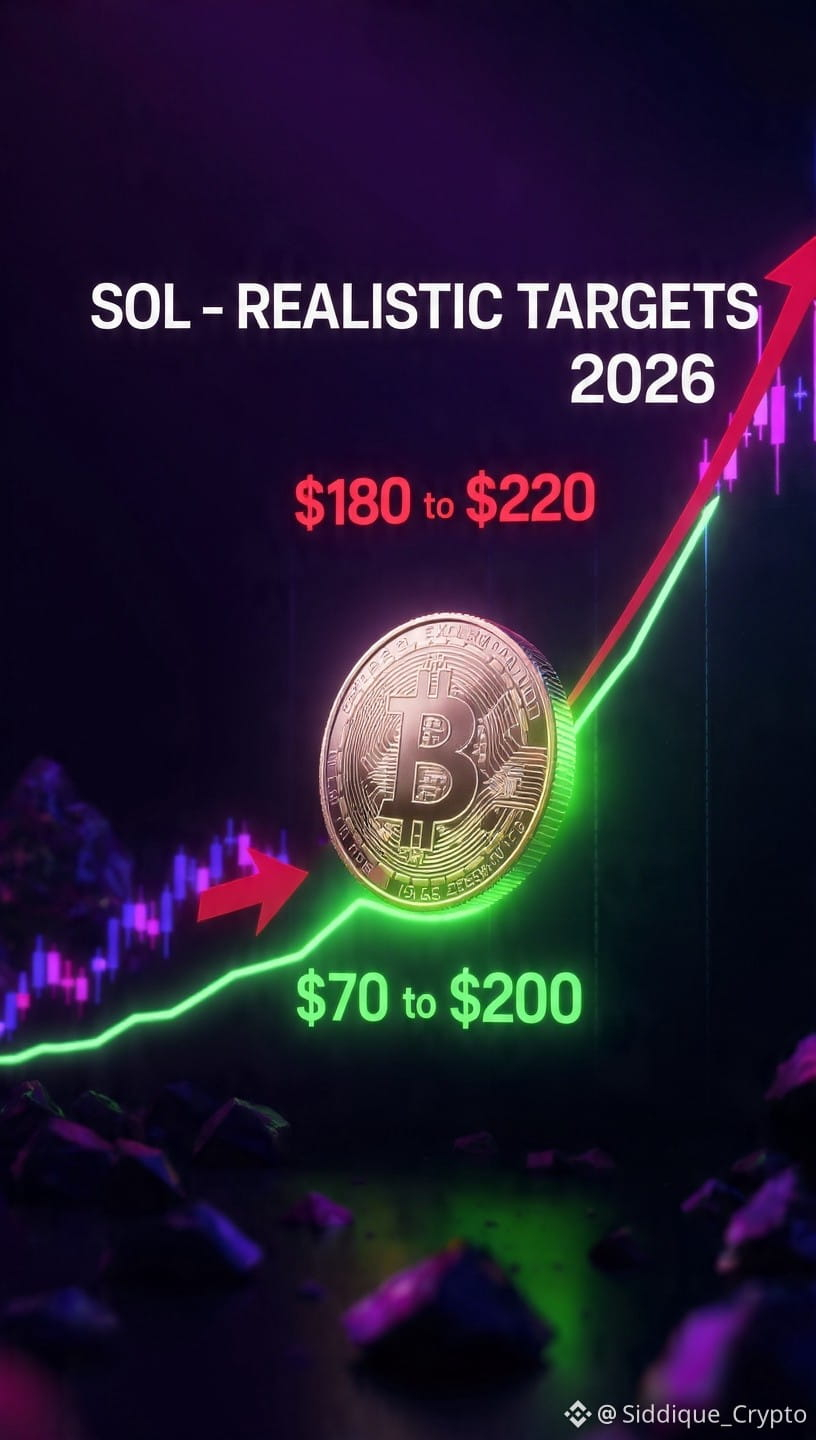
📊 SOL has been trading inside a massive long-term channel since 2025
⚠️ Some more downside still possible before a clear bottom forms
👀 Patience is key right now
The main resistance problem:
🔴 Upper trendline resistance sits around $180-$220
🔴 This area has been a historically major rejection zone
⚠️ Breaking above this cleanly requires serious momentum
What is realistic in 2026:
🎯 $170-$200 = realistic range if market stays bullish
📈 Short term move toward $170-$200 definitely possible
Why $400-$500 this year is unlikely:
For SOL to reach $400-$500 it would need:
✔️ Massive altseason momentum
✔️ Extremely strong BTC continuation
✔️ Fresh retail liquidity entering market
✔️ Complete breakout from multi-year channel
Important context:
Previous cycles had lower market caps and far more aggressive retail FOMO. This cycle feels more range-based and liquidity-focused. 📊
Bottom line:
Realistic expectations plus proper risk management will always beat blind hopium. 📈
DYOR — Not financial advice! 🙏
#solanAnalysis #SOL #CryptoAnalysisUpdate #LongTermAnalysis #dyor
$SOL Long Term Analysis — Realistic Targets for 2026 📊👀
A lot of people on Crypto Twitter are calling for $400-$500 SOL in 2026. Here is my honest take. 🧐
Current market structure:
📊 SOL has been trading inside a massive long-term channel since 2025
⚠️ Some more downside still possible before a clear bottom forms
👀 Patience is key right now
The main resistance problem:
🔴 Upper trendline resistance sits around $180-$220
🔴 This area has been a historically major rejection zone
⚠️ Breaking above this cleanly requires serious momentum
What is realistic in 2026:
🎯 $170-$200 = realistic range if market stays bullish
📈 Short term move toward $170-$200 definitely possible
Why $400-$500 this year is unlikely:
For SOL to reach $400-$500 it would need:
✔️ Massive altseason momentum
✔️ Extremely strong BTC continuation
✔️ Fresh retail liquidity entering market
✔️ Complete breakout from multi-year channel
Important context:
Previous cycles had lower market caps and far more aggressive retail FOMO. This cycle feels more range-based and liquidity-focused. 📊
Bottom line:
Realistic expectations plus proper risk management will always beat blind hopium. 📈
DYOR — Not financial advice! 🙏
#solanAnalysis #SOL #CryptoAnalysisUpdate #LongTermAnalysis #dyor
A lot of people on Crypto Twitter are calling for $400-$500 SOL in 2026. Here is my honest take. 🧐
Current market structure:
📊 SOL has been trading inside a massive long-term channel since 2025
⚠️ Some more downside still possible before a clear bottom forms
👀 Patience is key right now
The main resistance problem:
🔴 Upper trendline resistance sits around $180-$220
🔴 This area has been a historically major rejection zone
⚠️ Breaking above this cleanly requires serious momentum
What is realistic in 2026:
🎯 $170-$200 = realistic range if market stays bullish
📈 Short term move toward $170-$200 definitely possible
Why $400-$500 this year is unlikely:
For SOL to reach $400-$500 it would need:
✔️ Massive altseason momentum
✔️ Extremely strong BTC continuation
✔️ Fresh retail liquidity entering market
✔️ Complete breakout from multi-year channel
Important context:
Previous cycles had lower market caps and far more aggressive retail FOMO. This cycle feels more range-based and liquidity-focused. 📊
Bottom line:
Realistic expectations plus proper risk management will always beat blind hopium. 📈
DYOR — Not financial advice! 🙏
#solanAnalysis #SOL #CryptoAnalysisUpdate #LongTermAnalysis #dyor
129

·
--
#BTC
#LongTermAnalysis
BTC now trading around $59000, more than 50% down from its peak.
Time to invest in selective coins for the next cycle .
Buy now 25% of your fund.
at every $5000 dip in $BTC deploy 20%-25% more till $40000 and forget
Next cycle target $250000 $BTC (2029)
Apply same strategy for $ETH , $SOL, $BNB
#BTC
#LongTermAnalysis
BTC now trading around $59000, more than 50% down from its peak.
Time to invest in selective coins for the next cycle .
Buy now 25% of your fund.
at every $5000 dip in $BTC deploy 20%-25% more till $40000 and forget
Next cycle target $250000 $BTC (2029)
Apply same strategy for $ETH , $SOL, $BNB
#LongTermAnalysis
BTC now trading around $59000, more than 50% down from its peak.
Time to invest in selective coins for the next cycle .
Buy now 25% of your fund.
at every $5000 dip in $BTC deploy 20%-25% more till $40000 and forget
Next cycle target $250000 $BTC (2029)
Apply same strategy for $ETH , $SOL, $BNB
104

·
--
$SOL Long-Term Forecasts;
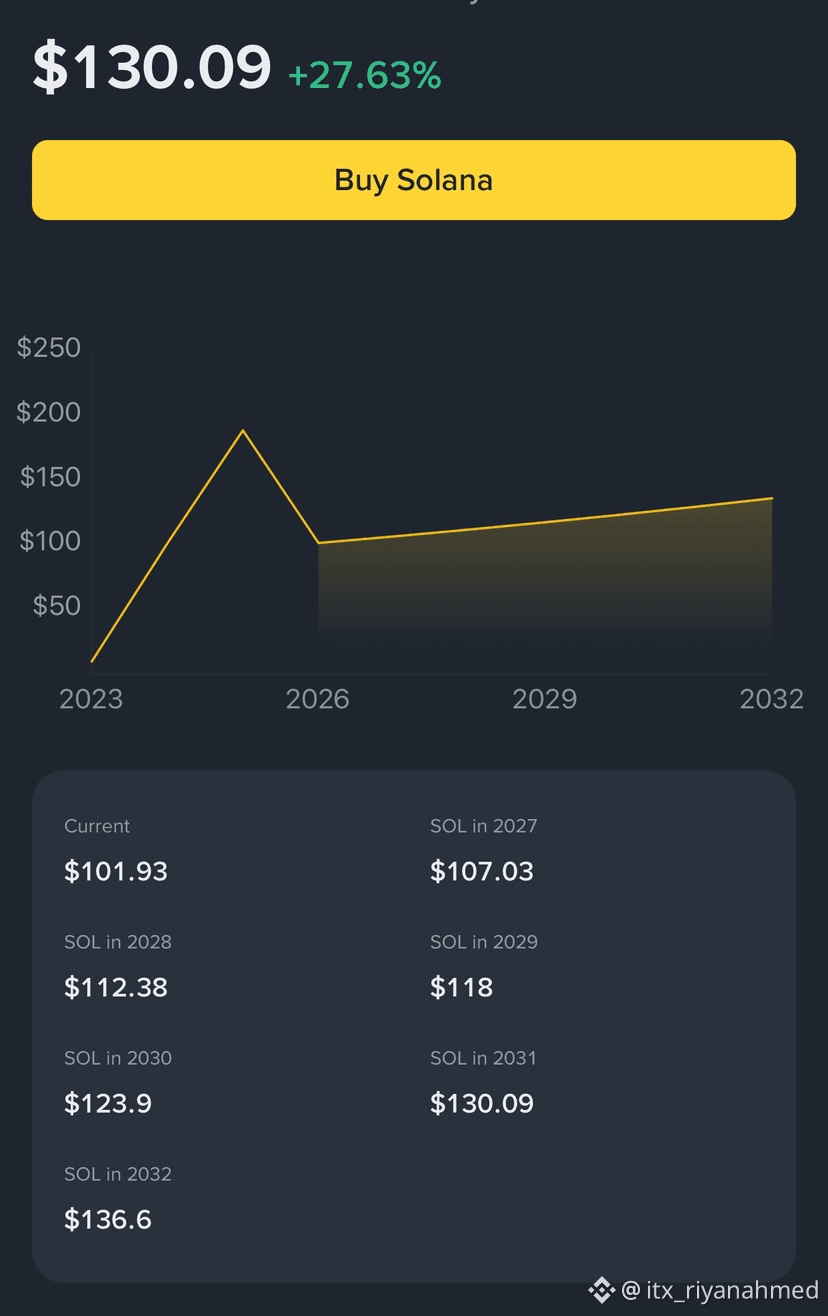
Bullish View: Major institutions like Standard Chartered project $SOL could climb toward $500 to $2,000 by 2030. This relies on widespread adoption of tokenized real-world assets (RWAs) and micro-payments.
Base View: Conservative estimates from platforms like VanEck place the 2030 target closer to $330–$350 if network activity remains high.
Bearish Risk: If macro conditions worsen or adoption stalls, prices could drop back toward critical support levels below $50.
#solana #FutureTradingSignals #LongTermAnalysis #LongTermGain
{spot}(SOLUSDT)
$SOL Long-Term Forecasts;
Bullish View: Major institutions like Standard Chartered project $SOL could climb toward $500 to $2,000 by 2030. This relies on widespread adoption of tokenized real-world assets (RWAs) and micro-payments.
Base View: Conservative estimates from platforms like VanEck place the 2030 target closer to $330–$350 if network activity remains high.
Bearish Risk: If macro conditions worsen or adoption stalls, prices could drop back toward critical support levels below $50.
#solana #FutureTradingSignals #LongTermAnalysis #LongTermGain
Bullish View: Major institutions like Standard Chartered project $SOL could climb toward $500 to $2,000 by 2030. This relies on widespread adoption of tokenized real-world assets (RWAs) and micro-payments.
Base View: Conservative estimates from platforms like VanEck place the 2030 target closer to $330–$350 if network activity remains high.
Bearish Risk: If macro conditions worsen or adoption stalls, prices could drop back toward critical support levels below $50.
#solana #FutureTradingSignals #LongTermAnalysis #LongTermGain
1
44

·
--
Bullish
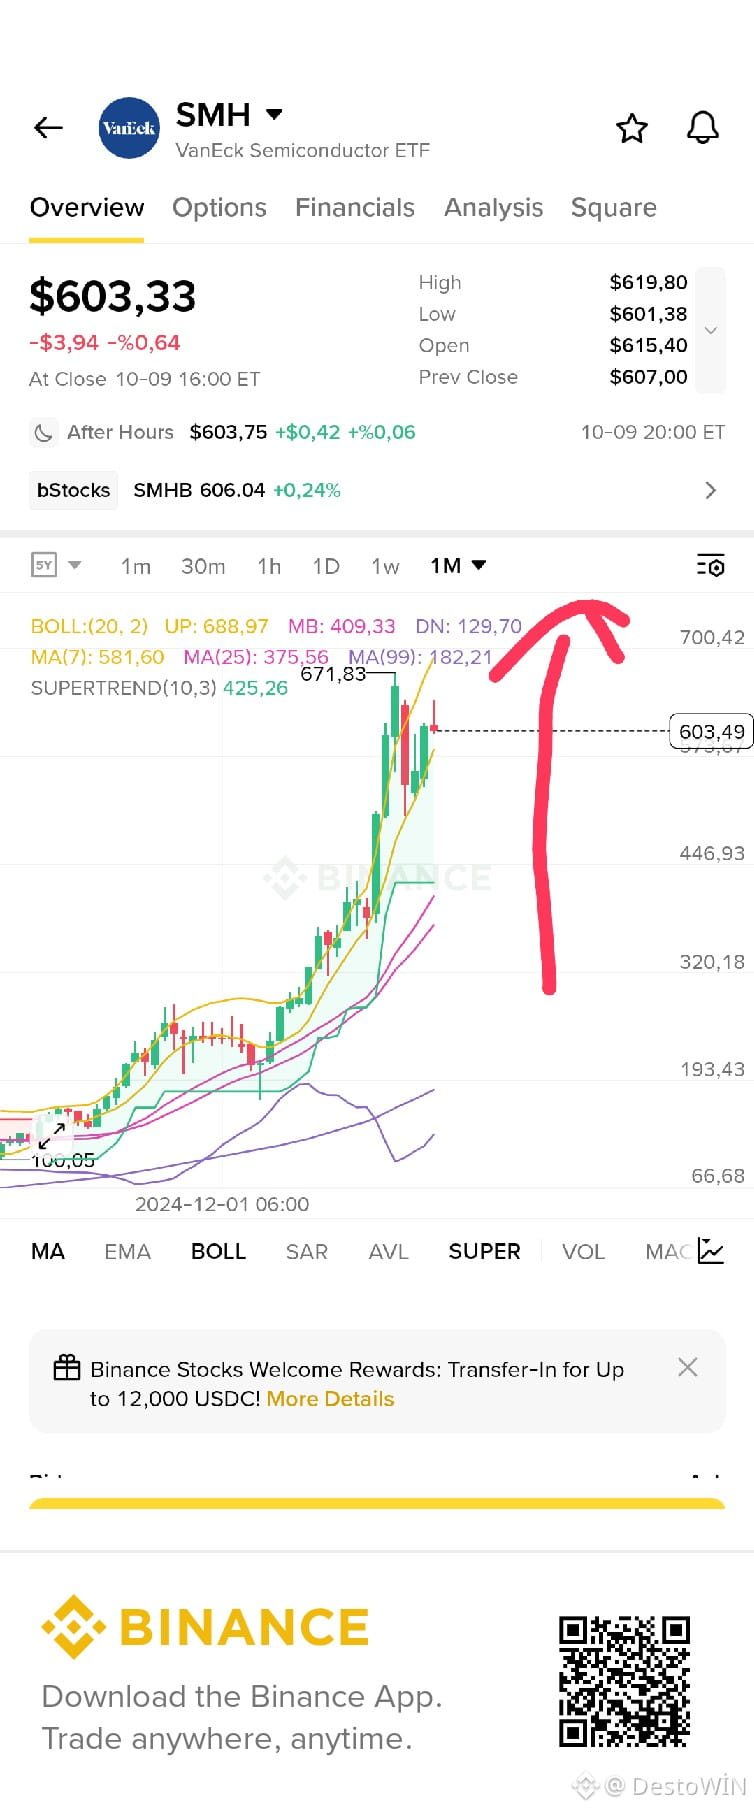
$SMH Don't take unnecessary risks—just buy the $SMH fund and relax. Rest assured, it’s set to generate around 80% annual returns. It’s an ETF packed with the biggest AI companies, perfect if you're playing the long game. Don't forget to follow my channel! #ai #LongTermHolders #LongTermAnalysis is #WİN #relax $SMH
$SMH Don't take unnecessary risks—just buy the $SMH fund and relax. Rest assured, it’s set to generate around 80% annual returns. It’s an ETF packed with the biggest AI companies, perfect if you're playing the long game. Don't forget to follow my channel! #ai #LongTermHolders #LongTermAnalysis is #WİN #relax $SMH
1
81


·
--
Bullish
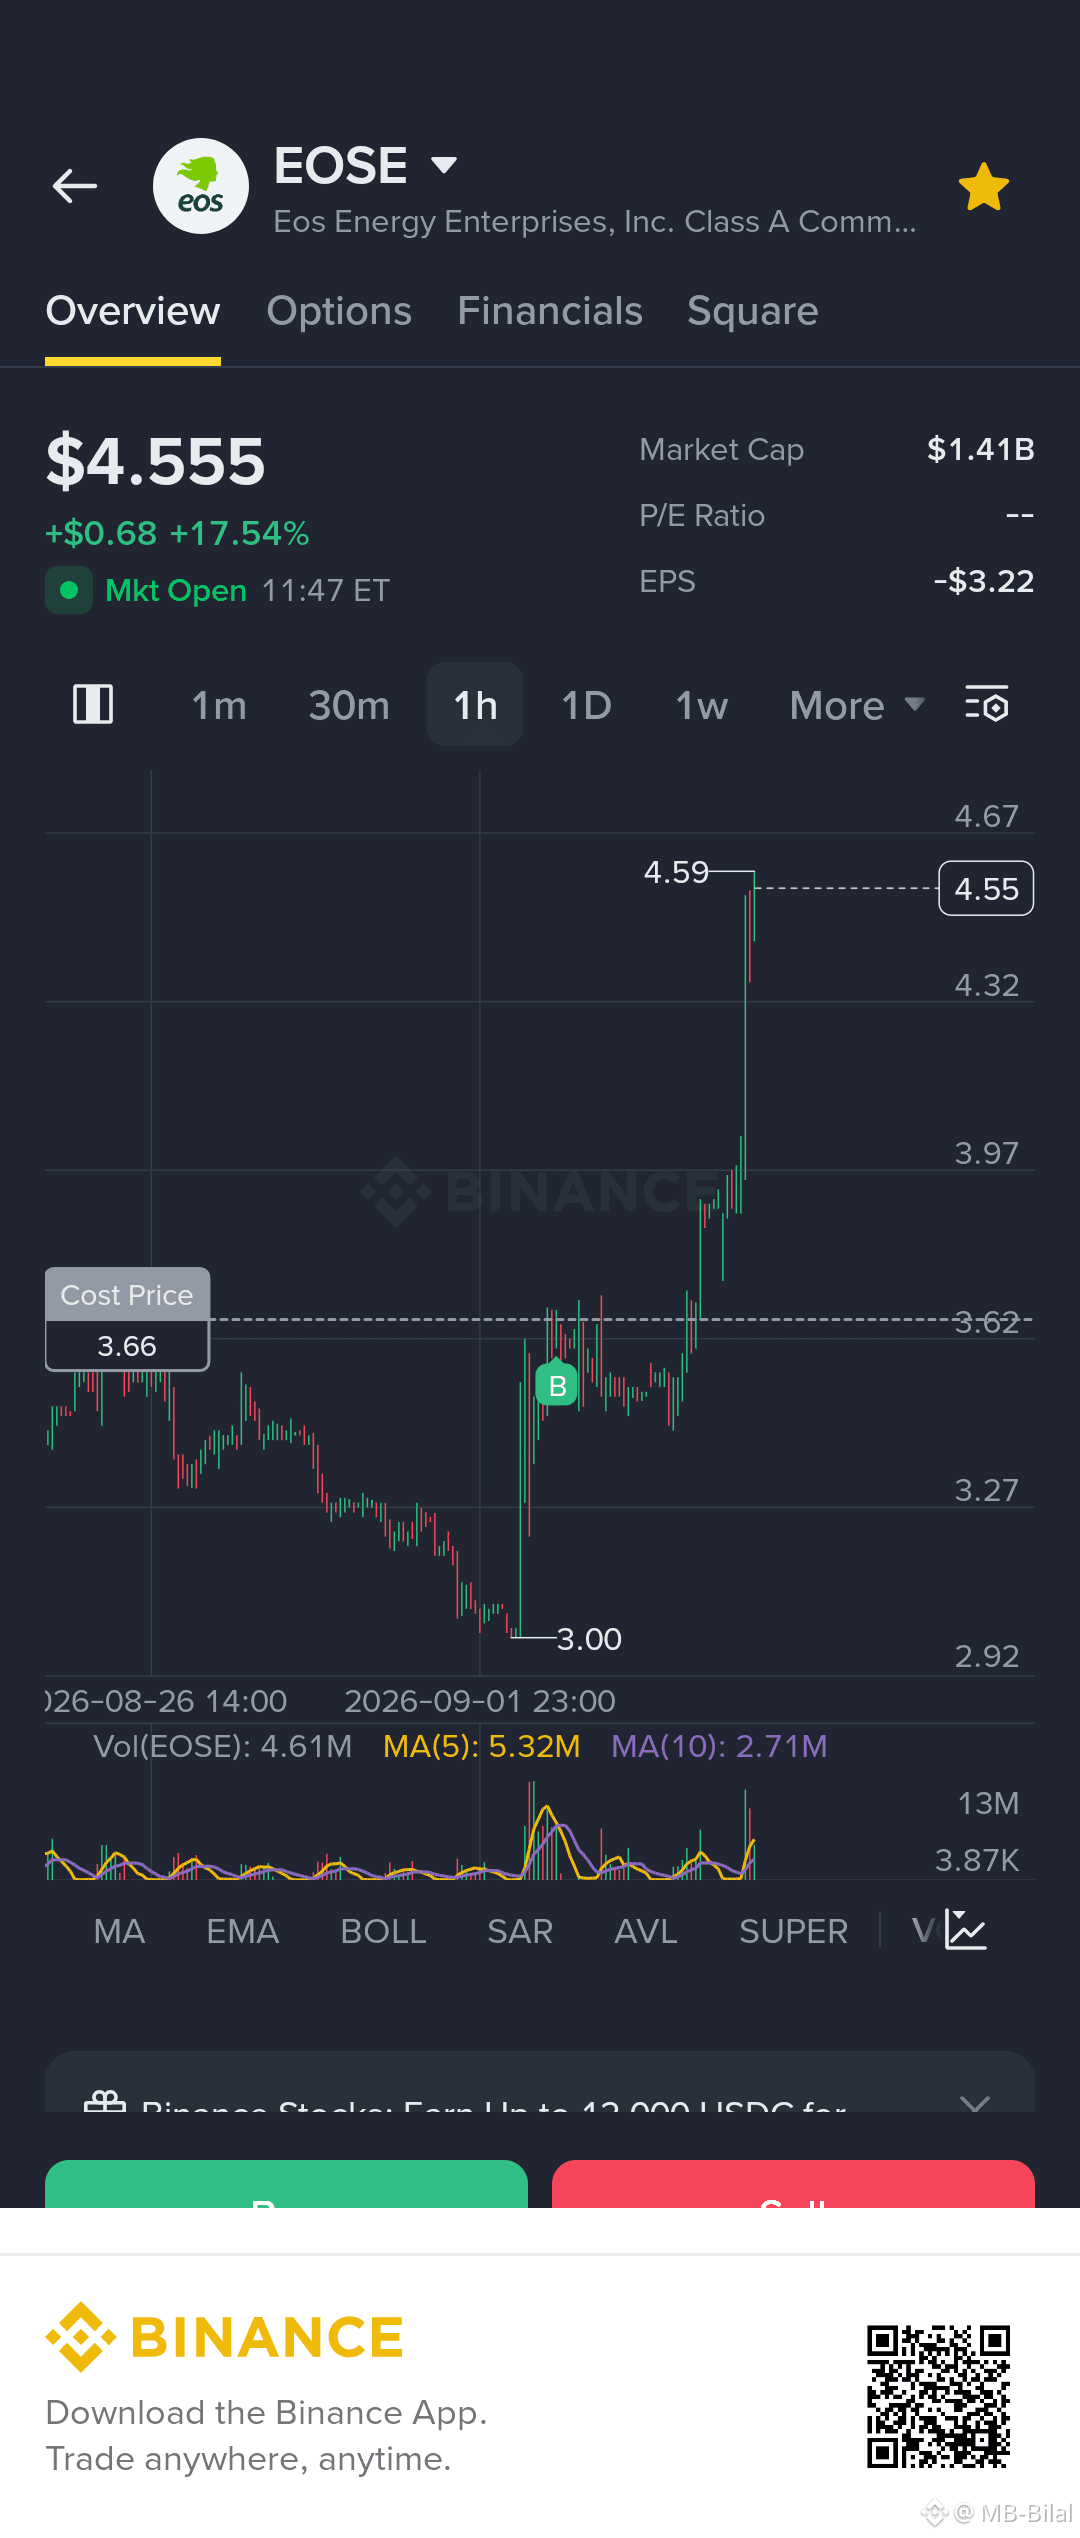
$STABLE
#LongTermAnalysis
Entry: 0.02775 (mid of your 0.027 – 0.02850 zone)
Stop loss: 10% from entry → ≈ 0.024975
Tap 1 : 0.033 -
Tap 2 : 0.0377
Tap 3 : 0.044
Tap 4 : 0.05
How to use separate taps:
• Recommended scaling: 30-40% at TP1, 30% at TP2, 20% at TP3, rest at TP4 or trail.
• With 5x, your actual returns are multiplied (as shown above), but so is the risk — liquidation around -20% move from entry.
Current status: Price is testing near entry zone after today’s pump. Holding above 0.025 support is key for continuation.
$STABLE
#LongTermAnalysis
Entry: 0.02775 (mid of your 0.027 – 0.02850 zone)
Stop loss: 10% from entry → ≈ 0.024975
Tap 1 : 0.033 -
Tap 2 : 0.0377
Tap 3 : 0.044
Tap 4 : 0.05
How to use separate taps:
• Recommended scaling: 30-40% at TP1, 30% at TP2, 20% at TP3, rest at TP4 or trail.
• With 5x, your actual returns are multiplied (as shown above), but so is the risk — liquidation around -20% move from entry.
Current status: Price is testing near entry zone after today’s pump. Holding above 0.025 support is key for continuation.
#LongTermAnalysis
Entry: 0.02775 (mid of your 0.027 – 0.02850 zone)
Stop loss: 10% from entry → ≈ 0.024975
Tap 1 : 0.033 -
Tap 2 : 0.0377
Tap 3 : 0.044
Tap 4 : 0.05
How to use separate taps:
• Recommended scaling: 30-40% at TP1, 30% at TP2, 20% at TP3, rest at TP4 or trail.
• With 5x, your actual returns are multiplied (as shown above), but so is the risk — liquidation around -20% move from entry.
Current status: Price is testing near entry zone after today’s pump. Holding above 0.025 support is key for continuation.
211



·
--
Article
Gold’s Sudden Drop Highlights Liquidity Fragility and Excessive Derivative Leverage{future}(BTCUSDT)
{future}(XAUUSDT)
{future}(BNBUSDT)
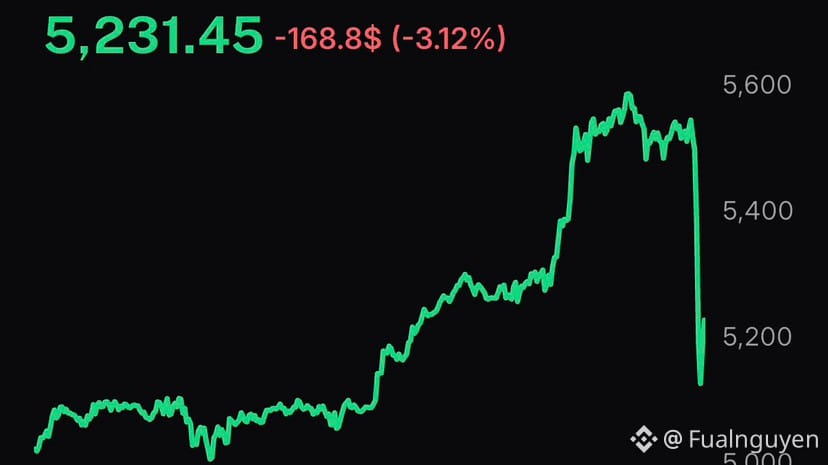
Gold prices experienced a sharp, sudden decline today, falling by over 4% after hitting record highs earlier in the session, as investors locked in profits amid heightened volatility. This abrupt move occurred despite limited new macroeconomic developments, underscoring deeper structural dynamics in the market.
At the core of this sell-off is the fragility caused by thinning real liquidity in the spot market. When physical buying interest is not sufficiently deep, prices become increasingly sensitive to short-term capital flows and speculative positioning, rather than traditional supply and demand fundamentals.
In such an environment, the role of the derivatives market becomes disproportionately influential. With open interest in gold futures and options elevated to multi-year highs, large leveraged positions accumulated over recent months have made the market highly susceptible to forced liquidations and cascading margin calls.
Once selling pressure is triggered, limited bid-side liquidity fails to absorb the supply, causing prices to gap lower through multiple technical support levels. Today’s sell-off, which saw prices retreat sharply from session highs, is a textbook example of how leveraged positions and liquidity gaps can amplify price swings in a seemingly orderly market.
Notably, this type of price action unfolded without any obvious macro shock — no major interest rate announcement or geopolitical event directly explains the magnitude of the drop. Instead, it reflects a market where structure and positioning matter more than ever for short-term price behavior.
Even traditionally “safe haven” assets like gold are not immune when liquidity is thin and leverage is high. In these conditions, volatility becomes decoupled from macro fundamentals, and sharp moves can occur even in the absence of new economic data.
Today’s price action serves as a stark reminder that in a market dominated by derivative leverage and fragile liquidity, risk can surface abruptly and severely. For investors and risk managers alike, understanding the interplay between liquidity, leverage, and market structure is now essential to navigating precious metals markets.
#Fualnguyen #LongTermInvestment #LongTermAnalysis
Gold’s Sudden Drop Highlights Liquidity Fragility and Excessive Derivative Leverage
Gold prices experienced a sharp, sudden decline today, falling by over 4% after hitting record highs earlier in the session, as investors locked in profits amid heightened volatility. This abrupt move occurred despite limited new macroeconomic developments, underscoring deeper structural dynamics in the market.
At the core of this sell-off is the fragility caused by thinning real liquidity in the spot market. When physical buying interest is not sufficiently deep, prices become increasingly sensitive to short-term capital flows and speculative positioning, rather than traditional supply and demand fundamentals.
In such an environment, the role of the derivatives market becomes disproportionately influential. With open interest in gold futures and options elevated to multi-year highs, large leveraged positions accumulated over recent months have made the market highly susceptible to forced liquidations and cascading margin calls.
Once selling pressure is triggered, limited bid-side liquidity fails to absorb the supply, causing prices to gap lower through multiple technical support levels. Today’s sell-off, which saw prices retreat sharply from session highs, is a textbook example of how leveraged positions and liquidity gaps can amplify price swings in a seemingly orderly market.
Notably, this type of price action unfolded without any obvious macro shock — no major interest rate announcement or geopolitical event directly explains the magnitude of the drop. Instead, it reflects a market where structure and positioning matter more than ever for short-term price behavior.
Even traditionally “safe haven” assets like gold are not immune when liquidity is thin and leverage is high. In these conditions, volatility becomes decoupled from macro fundamentals, and sharp moves can occur even in the absence of new economic data.
Today’s price action serves as a stark reminder that in a market dominated by derivative leverage and fragile liquidity, risk can surface abruptly and severely. For investors and risk managers alike, understanding the interplay between liquidity, leverage, and market structure is now essential to navigating precious metals markets.
#Fualnguyen #LongTermInvestment #LongTermAnalysis
At the core of this sell-off is the fragility caused by thinning real liquidity in the spot market. When physical buying interest is not sufficiently deep, prices become increasingly sensitive to short-term capital flows and speculative positioning, rather than traditional supply and demand fundamentals.
In such an environment, the role of the derivatives market becomes disproportionately influential. With open interest in gold futures and options elevated to multi-year highs, large leveraged positions accumulated over recent months have made the market highly susceptible to forced liquidations and cascading margin calls.
Once selling pressure is triggered, limited bid-side liquidity fails to absorb the supply, causing prices to gap lower through multiple technical support levels. Today’s sell-off, which saw prices retreat sharply from session highs, is a textbook example of how leveraged positions and liquidity gaps can amplify price swings in a seemingly orderly market.
Notably, this type of price action unfolded without any obvious macro shock — no major interest rate announcement or geopolitical event directly explains the magnitude of the drop. Instead, it reflects a market where structure and positioning matter more than ever for short-term price behavior.
Even traditionally “safe haven” assets like gold are not immune when liquidity is thin and leverage is high. In these conditions, volatility becomes decoupled from macro fundamentals, and sharp moves can occur even in the absence of new economic data.
Today’s price action serves as a stark reminder that in a market dominated by derivative leverage and fragile liquidity, risk can surface abruptly and severely. For investors and risk managers alike, understanding the interplay between liquidity, leverage, and market structure is now essential to navigating precious metals markets.
#Fualnguyen #LongTermInvestment #LongTermAnalysis
5
1
8
4k

$XRP AT $20 WOULD REQUIRE A TRILLION DOLLAR MARKET CAP 🔥
Target: 20 🚀
XRP currently trades near $1.08. A move to $20 implies a 1,750% gain and a market capitalization of about $1.21 trillion — a valuation comparable to Bitcoin's strongest cycles. History shows XRP peaked at $3.84 in 2018, so this target would surpass all previous highs by a wide margin. Achieving it would need not just a bullish cycle, but institutional payment adoption, widespread tokenization on XRPL, and a crypto market exceeding $10 trillion.
The gap between current liquidity and that valuation is enormous. Do you see enough catalyst stacking to close it?
Not financial advice. Always manage your risk.
#XRP #LongTermAnalysis #InstitutionalAdoption #Tokenization #Crypto
🔥
$XRP AT $20 WOULD REQUIRE A TRILLION DOLLAR MARKET CAP 🔥
Target: 20 🚀
XRP currently trades near $1.08. A move to $20 implies a 1,750% gain and a market capitalization of about $1.21 trillion — a valuation comparable to Bitcoin's strongest cycles. History shows XRP peaked at $3.84 in 2018, so this target would surpass all previous highs by a wide margin. Achieving it would need not just a bullish cycle, but institutional payment adoption, widespread tokenization on XRPL, and a crypto market exceeding $10 trillion.
The gap between current liquidity and that valuation is enormous. Do you see enough catalyst stacking to close it?
Not financial advice. Always manage your risk.
#XRP #LongTermAnalysis #InstitutionalAdoption #Tokenization #Crypto
🔥
Target: 20 🚀
XRP currently trades near $1.08. A move to $20 implies a 1,750% gain and a market capitalization of about $1.21 trillion — a valuation comparable to Bitcoin's strongest cycles. History shows XRP peaked at $3.84 in 2018, so this target would surpass all previous highs by a wide margin. Achieving it would need not just a bullish cycle, but institutional payment adoption, widespread tokenization on XRPL, and a crypto market exceeding $10 trillion.
The gap between current liquidity and that valuation is enormous. Do you see enough catalyst stacking to close it?
Not financial advice. Always manage your risk.
#XRP #LongTermAnalysis #InstitutionalAdoption #Tokenization #Crypto
🔥
54
·
--
$ADA Short-Term Outlook.
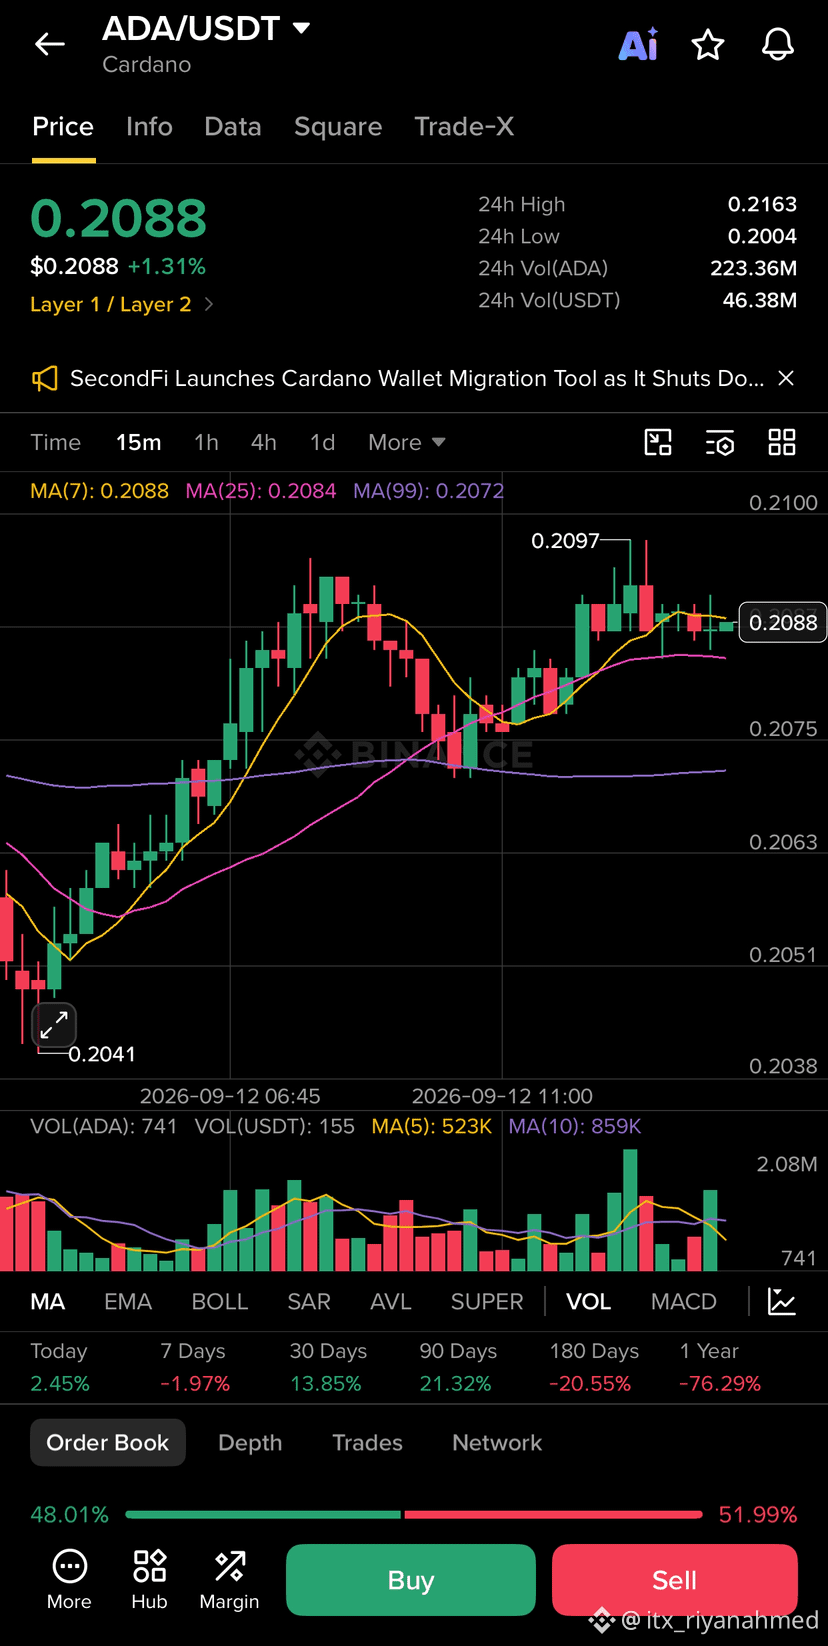
Current Support: $ADA faces a critical support test near the $0.20 level.
Conservative Views: Some algorithmic trackers like Changelly estimate lower average trading ranges around $0.11 to $0.13 if market corrections deepen.
Bullish Targets: Optimistic forecasts suggest a potential push toward $0.53 or higher if broader market momentum improves.
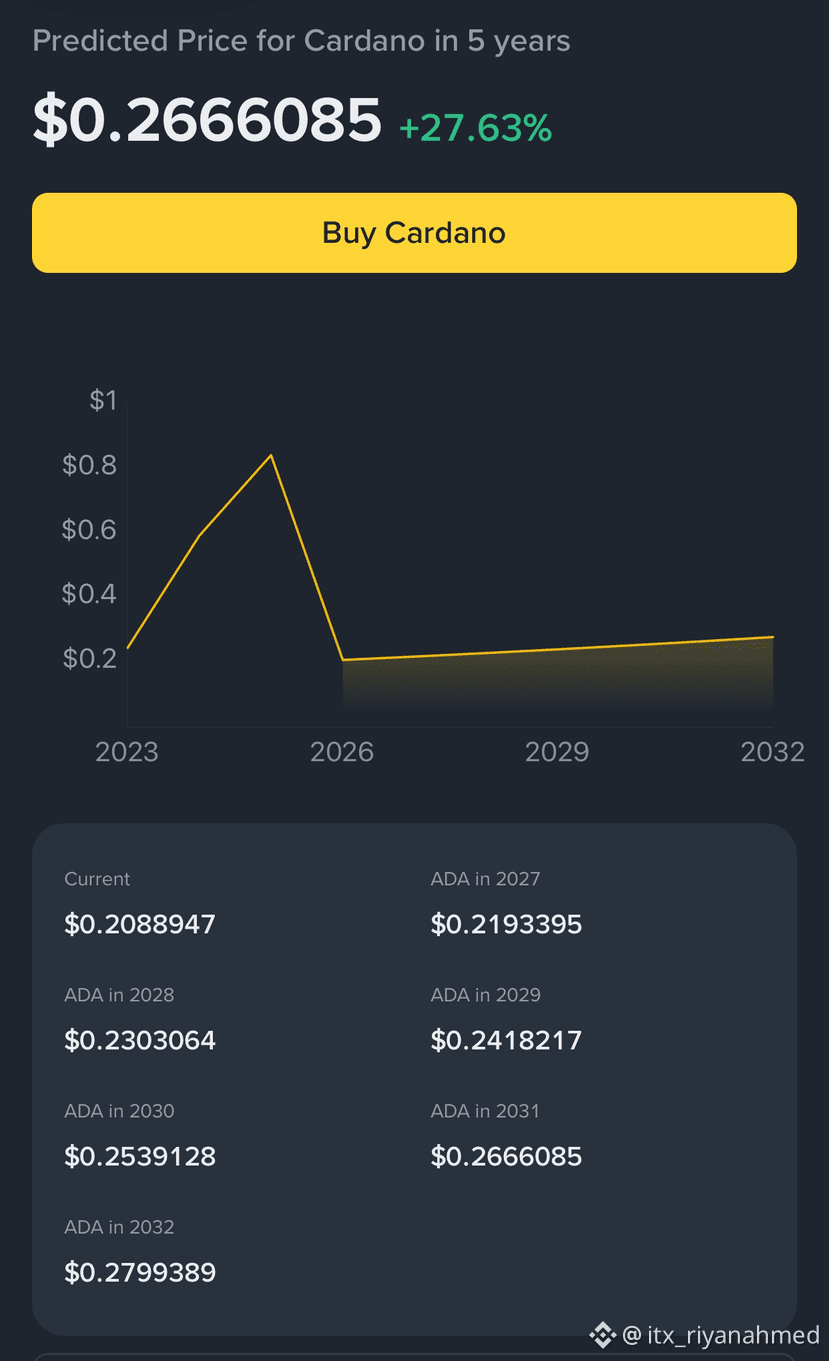
$ADA Long-Term Projections: Most algorithmic platforms project a slow recovery band, keeping values broadly consolidated between $0.21 and $0.23.
2030 and Beyond: Long-term estimates remain highly speculative, with some models pointing toward $0.25 while multi-year bullish cases target higher milestones depending on ecosystem adoption.
#ADA #FutureTradingSignals #LongTermGain #LongTermAnalysis
{spot}(ADAUSDT)
$ADA Short-Term Outlook.
Current Support: $ADA faces a critical support test near the $0.20 level.
Conservative Views: Some algorithmic trackers like Changelly estimate lower average trading ranges around $0.11 to $0.13 if market corrections deepen.
Bullish Targets: Optimistic forecasts suggest a potential push toward $0.53 or higher if broader market momentum improves.
$ADA Long-Term Projections: Most algorithmic platforms project a slow recovery band, keeping values broadly consolidated between $0.21 and $0.23.
2030 and Beyond: Long-term estimates remain highly speculative, with some models pointing toward $0.25 while multi-year bullish cases target higher milestones depending on ecosystem adoption.
#ADA #FutureTradingSignals #LongTermGain #LongTermAnalysis
Current Support: $ADA faces a critical support test near the $0.20 level.
Conservative Views: Some algorithmic trackers like Changelly estimate lower average trading ranges around $0.11 to $0.13 if market corrections deepen.
Bullish Targets: Optimistic forecasts suggest a potential push toward $0.53 or higher if broader market momentum improves.
$ADA Long-Term Projections: Most algorithmic platforms project a slow recovery band, keeping values broadly consolidated between $0.21 and $0.23.
2030 and Beyond: Long-term estimates remain highly speculative, with some models pointing toward $0.25 while multi-year bullish cases target higher milestones depending on ecosystem adoption.
#ADA #FutureTradingSignals #LongTermGain #LongTermAnalysis
1
93
·
--

Article
BINANCE AND A STATEMENT OF STRENGTH AMID MARKET VOLATILITYDespite recent market drawdowns, liquidity has not exited the crypto ecosystem but is instead being actively repositioned. Over the past seven days, Binance has overwhelmingly led exchange inflows with $949 million, far surpassing Deribit and Gemini, each recording around $214 million. In contrast, OKX, Gate, and Crypto.com have seen combined outflows of approximately $149 million, clearly indicating a rotation of capital toward the market’s largest liquidity hub. A net positive inflow suggests that traders and institutions remain engaged, moving capital onto exchanges to prepare for action rather than exiting, placing the market in a sensitive zone ahead of a potential major move.
More importantly, Binance is not merely a destination for inflows => it has become a direct buyer of Bitcoin itself. As part of its plan to convert the SAFU insurance fund from stablecoins into Bitcoin, Binance executed its first BTC purchase of 1,315 BTC, worth roughly $100.7 million. Shortly after, according to Bitcoin Magazine, Binance added another 1,350 BTC, valued at around $102 million, directly into the SAFU Fund. In a short period of time, more than 2,600 BTC have been accumulated, steadily advancing Binance’s plan to convert $1 billion of SAFU reserves into Bitcoin. At a time when the market is correcting, choosing to increase exposure to Bitcoin rather than retreat into stablecoins sends a clear strategic message.
Alongside these moves, BNB has demonstrated standout performance among platform tokens. While Bitcoin is down roughly 21% over the past 30 days and both ETH and SOL have fallen more than 30%, with many Layer 1 and Layer 2 platforms underperforming the broader market, BNB has declined by only about 19%. This makes BNB the best-performing major platform token during the period, reflecting capital preference for ecosystems with real cash flows, confidence in Binance as the financial backbone of crypto, and BNB’s role as a proxy for the overall health of the Binance ecosystem. It is no coincidence that Binance leads inflows, SAFU is anchored in Bitcoin, and BNB exhibits superior resilience relative to its peers.
Taken together, capital remains within the market, Binance continues to function as the core liquidity hub, SAFU evolves into a Bitcoin-backed shield, and BNB mirrors the strength and confidence in the ecosystem. In times of uncertainty, the strongest players do not stand aside ==> they act.
And today, Binance is demonstrating exactly why it remains a pillar of the global crypto market.
Reference: CoinMarketCap, BeinCrypto
{spot}(TSTUSDT)
{spot}(BNBUSDT)
BINANCE AND A STATEMENT OF STRENGTH AMID MARKET VOLATILITY
Despite recent market drawdowns, liquidity has not exited the crypto ecosystem but is instead being actively repositioned. Over the past seven days, Binance has overwhelmingly led exchange inflows with $949 million, far surpassing Deribit and Gemini, each recording around $214 million. In contrast, OKX, Gate, and Crypto.com have seen combined outflows of approximately $149 million, clearly indicating a rotation of capital toward the market’s largest liquidity hub. A net positive inflow suggests that traders and institutions remain engaged, moving capital onto exchanges to prepare for action rather than exiting, placing the market in a sensitive zone ahead of a potential major move.
More importantly, Binance is not merely a destination for inflows => it has become a direct buyer of Bitcoin itself. As part of its plan to convert the SAFU insurance fund from stablecoins into Bitcoin, Binance executed its first BTC purchase of 1,315 BTC, worth roughly $100.7 million. Shortly after, according to Bitcoin Magazine, Binance added another 1,350 BTC, valued at around $102 million, directly into the SAFU Fund. In a short period of time, more than 2,600 BTC have been accumulated, steadily advancing Binance’s plan to convert $1 billion of SAFU reserves into Bitcoin. At a time when the market is correcting, choosing to increase exposure to Bitcoin rather than retreat into stablecoins sends a clear strategic message.
Alongside these moves, BNB has demonstrated standout performance among platform tokens. While Bitcoin is down roughly 21% over the past 30 days and both ETH and SOL have fallen more than 30%, with many Layer 1 and Layer 2 platforms underperforming the broader market, BNB has declined by only about 19%. This makes BNB the best-performing major platform token during the period, reflecting capital preference for ecosystems with real cash flows, confidence in Binance as the financial backbone of crypto, and BNB’s role as a proxy for the overall health of the Binance ecosystem. It is no coincidence that Binance leads inflows, SAFU is anchored in Bitcoin, and BNB exhibits superior resilience relative to its peers.
Taken together, capital remains within the market, Binance continues to function as the core liquidity hub, SAFU evolves into a Bitcoin-backed shield, and BNB mirrors the strength and confidence in the ecosystem. In times of uncertainty, the strongest players do not stand aside ==> they act.
And today, Binance is demonstrating exactly why it remains a pillar of the global crypto market.
Reference: CoinMarketCap, BeinCrypto
More importantly, Binance is not merely a destination for inflows => it has become a direct buyer of Bitcoin itself. As part of its plan to convert the SAFU insurance fund from stablecoins into Bitcoin, Binance executed its first BTC purchase of 1,315 BTC, worth roughly $100.7 million. Shortly after, according to Bitcoin Magazine, Binance added another 1,350 BTC, valued at around $102 million, directly into the SAFU Fund. In a short period of time, more than 2,600 BTC have been accumulated, steadily advancing Binance’s plan to convert $1 billion of SAFU reserves into Bitcoin. At a time when the market is correcting, choosing to increase exposure to Bitcoin rather than retreat into stablecoins sends a clear strategic message.
Alongside these moves, BNB has demonstrated standout performance among platform tokens. While Bitcoin is down roughly 21% over the past 30 days and both ETH and SOL have fallen more than 30%, with many Layer 1 and Layer 2 platforms underperforming the broader market, BNB has declined by only about 19%. This makes BNB the best-performing major platform token during the period, reflecting capital preference for ecosystems with real cash flows, confidence in Binance as the financial backbone of crypto, and BNB’s role as a proxy for the overall health of the Binance ecosystem. It is no coincidence that Binance leads inflows, SAFU is anchored in Bitcoin, and BNB exhibits superior resilience relative to its peers.
Taken together, capital remains within the market, Binance continues to function as the core liquidity hub, SAFU evolves into a Bitcoin-backed shield, and BNB mirrors the strength and confidence in the ecosystem. In times of uncertainty, the strongest players do not stand aside ==> they act.
And today, Binance is demonstrating exactly why it remains a pillar of the global crypto market.
Reference: CoinMarketCap, BeinCrypto
14
1
15
4.5k

·
--
Bullish
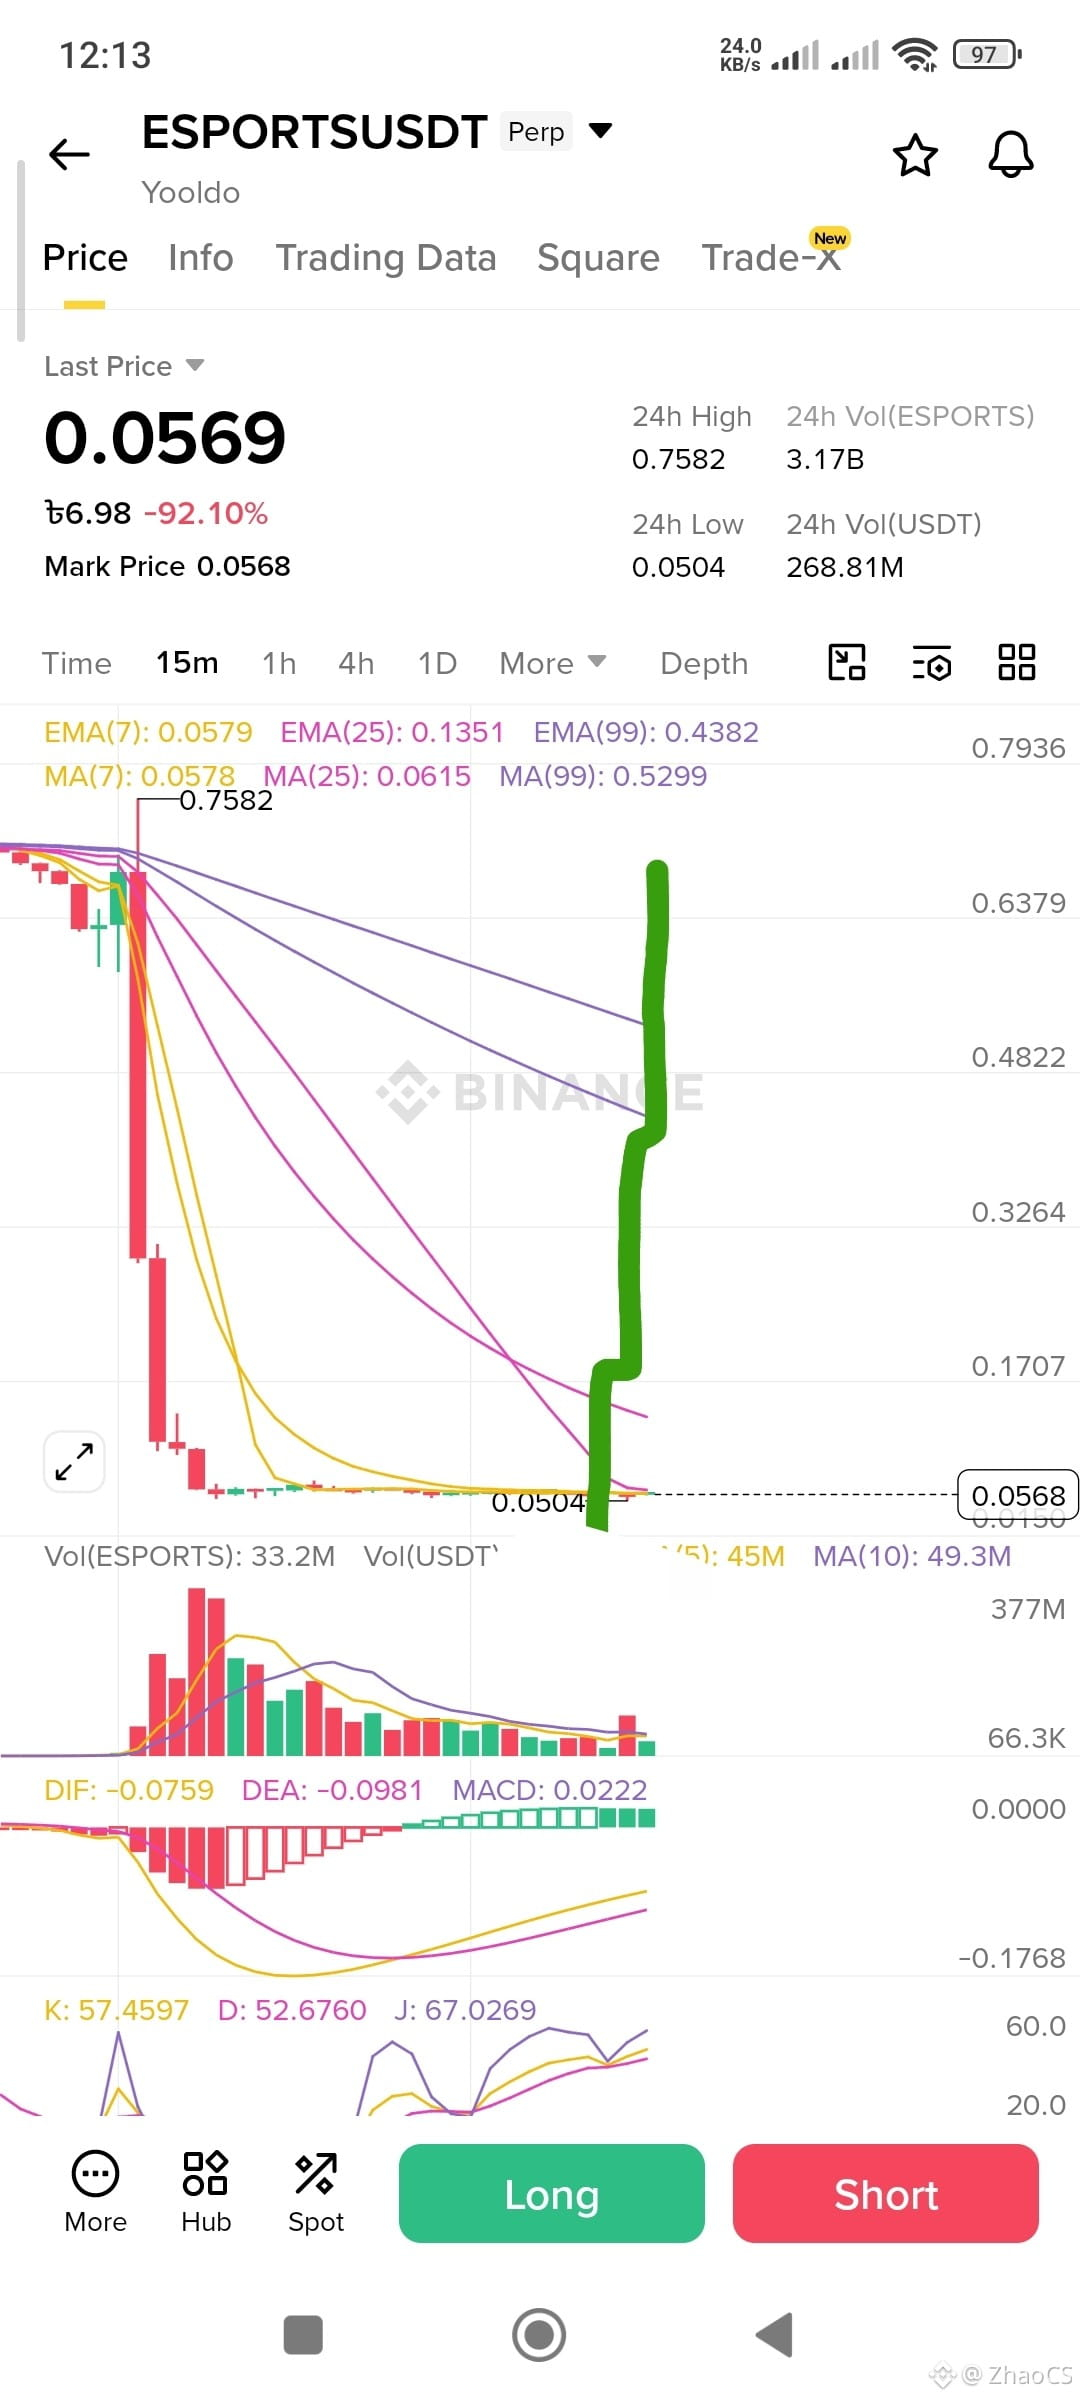
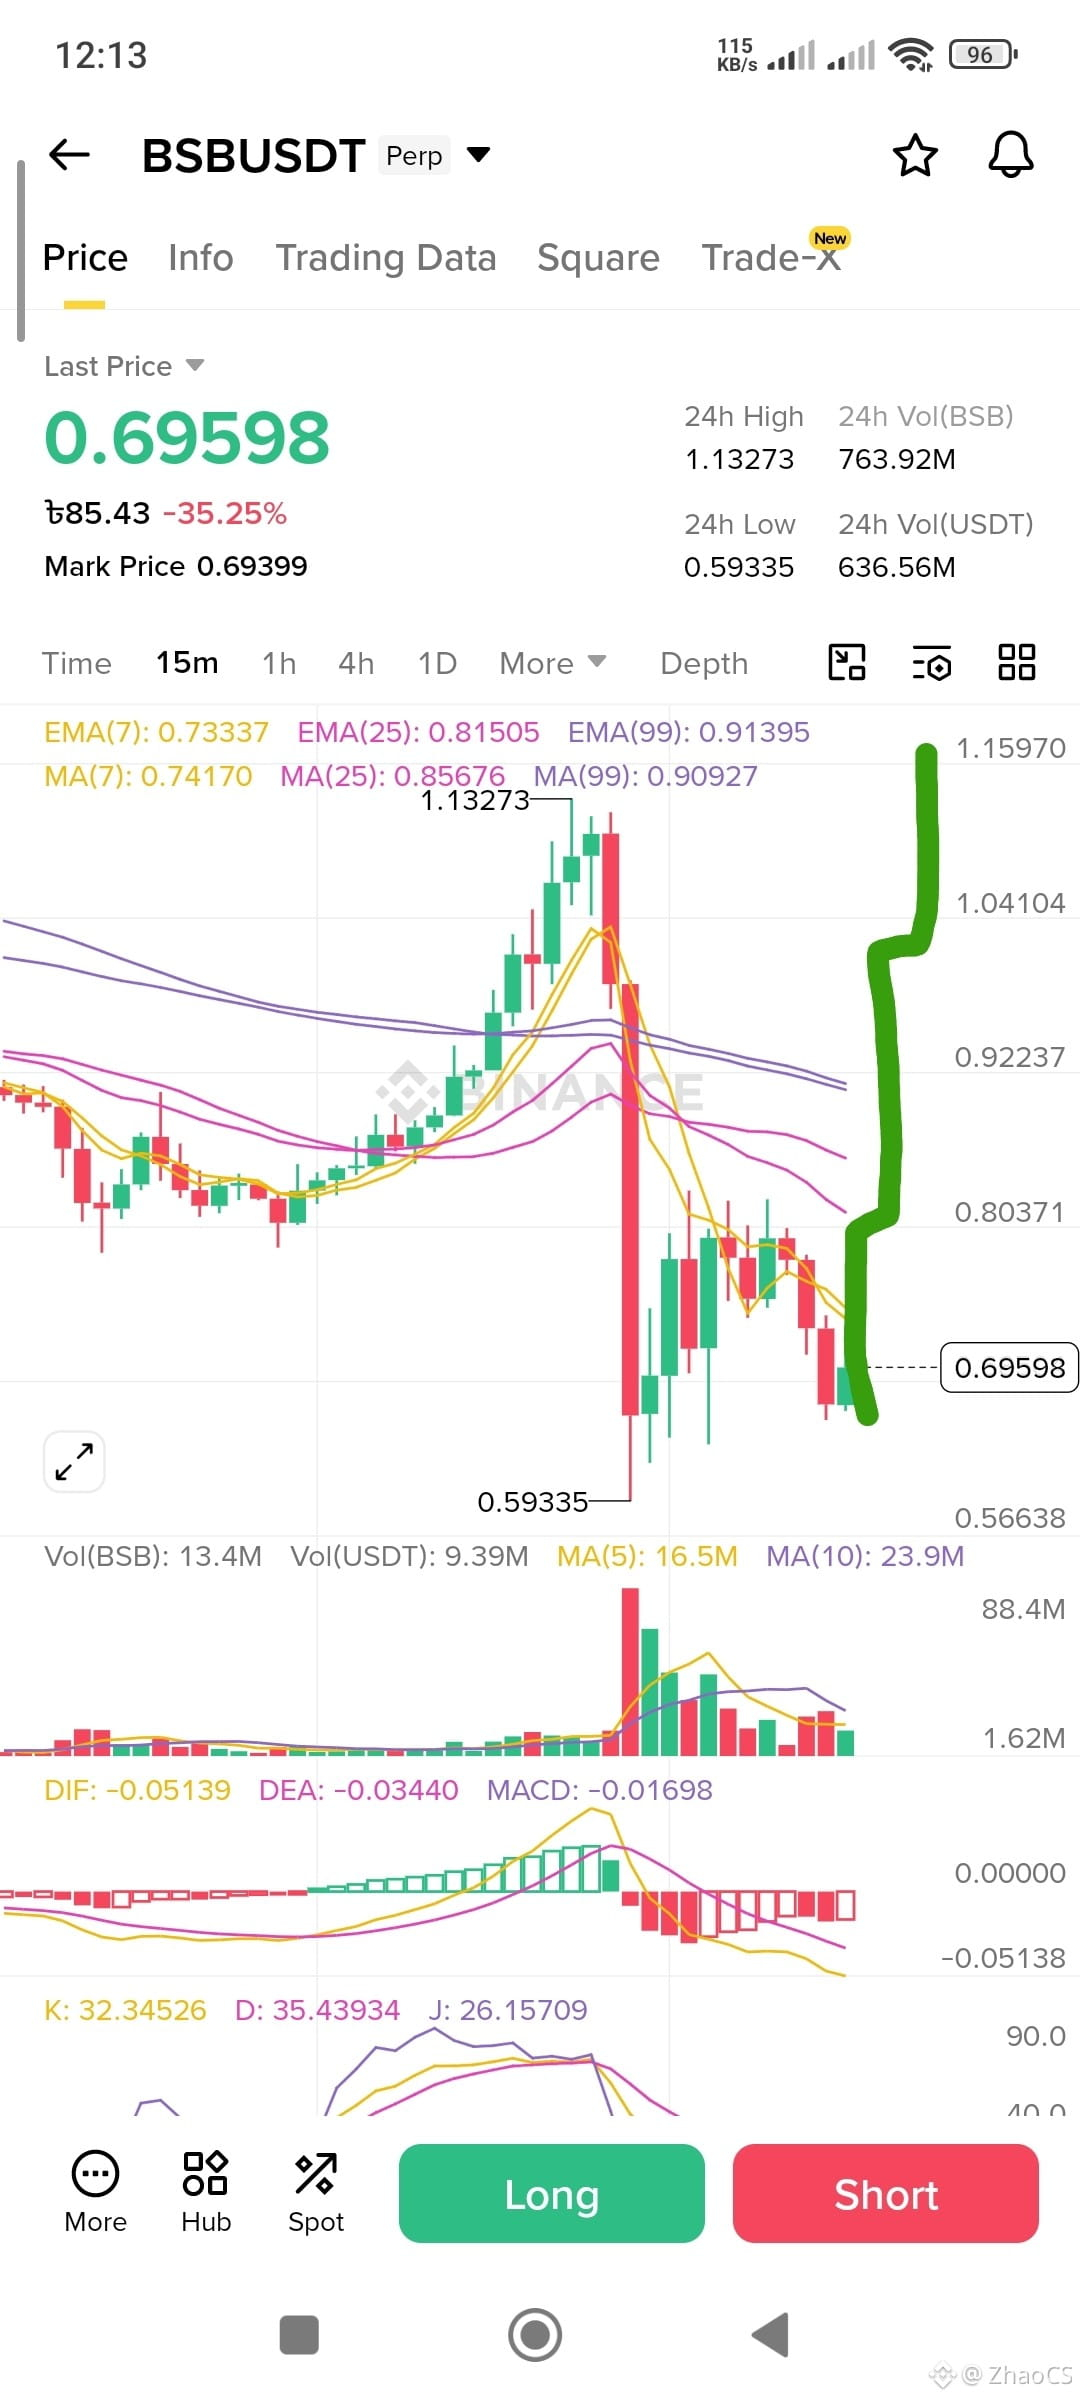
🚨 No risk but profit 💰📈 💯
1: $ESPORTS 50%🚀
2: $BSB 30%🚀🚀
I’ve taken a long position in the top 2 coins and holding them 🔥💎
While everyone is only focused on the upside 👀📊
I’m also keeping an eye on the downside in a different way 😈📉
In this market, smart moves are the real game changer ⚡🐋
Patience + strategy = profit 💰🚀
#Crypto #TradingSignals #LongTermAnalysis #ALTCOİNS
🚨 No risk but profit 💰📈 💯
1: $ESPORTS 50%🚀
2: $BSB 30%🚀🚀
I’ve taken a long position in the top 2 coins and holding them 🔥💎
While everyone is only focused on the upside 👀📊
I’m also keeping an eye on the downside in a different way 😈📉
In this market, smart moves are the real game changer ⚡🐋
Patience + strategy = profit 💰🚀
#Crypto #TradingSignals #LongTermAnalysis #ALTCOİNS
1: $ESPORTS 50%🚀
2: $BSB 30%🚀🚀
I’ve taken a long position in the top 2 coins and holding them 🔥💎
While everyone is only focused on the upside 👀📊
I’m also keeping an eye on the downside in a different way 😈📉
In this market, smart moves are the real game changer ⚡🐋
Patience + strategy = profit 💰🚀
#Crypto #TradingSignals #LongTermAnalysis #ALTCOİNS
800
Log in to explore more content
Join global crypto users on Binance Square
⚡️ Get latest and useful information about crypto.
💬 Trusted by the world’s largest crypto exchange.
👍 Discover real insights from verified creators.
Email / Phone number
Trending Topics
1
#WhoWillSucceedJensenHuangatNvidia?
93,555 views
1,205 Discussing
2
#WhatWillDriveCryptoandStocks’NextRebound?
454,693 views
3,094 Discussing
3
#BitcoinActiveSupplyInProfitDropsBelow45%
31,735 views
410 Discussing
4
#KavaSaysAbnormalActivityLimitedToKavaLend
12,712 views
209 Discussing
5
#USSpotXRPETFsSeeLargestWeeklyOutflowIn8Months
11,524 views
191 Discussing
6
#USPPIMissMayEaseBTCPressure
220,169 views
2,089 Discussing
7
#WORPTLetsTouristsConvertCryptoToThaiBaht
3,174 views
57 Discussing
8
#TONStrategyReports$23.97MQ3NetLoss
4,254 views
41 Discussing
9
#PolkadotCommunityApprovesNewStrategyWith97%Vote
20,264 views
252 Discussing
10
#dYdXPlansV9.9UpgradeToShiftUSDCToInjective
13,217 views
204 Discussing