
The Crypto Basic
7.9k Posts

The Crypto Basic
 Square Verified+
Report
Block User
Your Ultimate Crypto News Source
0 Following
36.5K+ Followers
166.0K+ Liked
Posts
Article
"XRP Now Close to Retesting the Ascending Trendline That Led to the 2021 and 2025 Rallies"#XRP is getting closer to a long-term ascending trendline on its monthly chart that has previously marked major price bottoms and preceded significant rallies.
As the asset continues to lose value alongside the broader market, this support level could become important if the decline continues.
Interestingly, XRP has tested this trendline twice before, in 2020 and 2024, and both tests came before major price recoveries. If the same support holds again, another rally could follow.
XRP Declines as It Moves Closer to Long-Term Support
XRP has continued to fall alongside the broader crypto market, losing 16% in November after recording a 16.07% decline in October.
The token has also fallen deeper than much of the market as selling pressure continues to increase. However, its monthly chart shows that XRP is approaching a long-term ascending trendline that has triggered previous market recoveries.
This trendline first began forming in May 2017, during XRP’s major price surge that year. After the price pulled back to test the support in May, buyers pushed the price higher, eventually driving it to $3.31 in January 2018. This marked the peak of the rally, after which XRP entered a prolonged bear market that lasted several years.
Previous Trendline Tests Came Before Major Rallies
During that bear market, XRP continued to decline until it reached $0.1103 in March 2020. Notably, this low coincided with the ascending trendline that had formed in May 2017. The support held, and the price level eventually marked the bottom of the downtrend.
XRP then began recovering and continued to climb until it reached $1.96 in April 2021, marking the peak of that market cycle. From the March 2020 low of $0.1103, the $1.96 peak marked a 1,676% increase. This was the first major example of a trendline retest leading to a substantial recovery.
After reaching $1.96 in April 2021, XRP began falling as the next bear market took hold. The decline eventually pushed the price to $0.2910 in June 2022, following the collapse of the Terra ecosystem. However, unlike the March 2020 bottom, the June 2022 low did not coincide with a test of the ascending trendline.
XRP did not return to the trendline until July 2024, when it dropped to $0.3834. Three months later, the asset began another major rally in November 2024, following Donald Trump’s victory in the U.S. presidential election.
The recovery continued over the following months, eventually taking XRP to its all-time high of $3.66 in July 2025. This represented an 854% increase from the $0.3834 low recorded in July 2024.
XRP Could Fall Another 22%-33% Before Testing the Trendline
Since reaching $3.66 in July 2025, XRP has entered another prolonged decline as bearish conditions continue to affect the market. The asset now trades around $1.05, bringing it closer to the ascending trendline, although it has yet to reach the support.
On the monthly chart, the trendline currently sits between $0.70 and $0.82. This means XRP would need to fall another 22% to 33% from its current price of $1.05 to reach the support area. Further losses remain possible as selling pressure continues to weigh on the market.
However, previous price movements suggest that this area could provide an opportunity for a recovery. Both the March 2020 test at $0.1103 and the July 2024 test at $0.3834 came before major rallies.
If the ascending trendline holds again, XRP could experience another rebound similar to the recoveries that followed those earlier tests.
Historical Pattern Suggests XRP Could Reach $3.56
The size of XRP’s previous rallies following trendline retests also presents an interesting possibility. Historical data shows that each successive rally has been roughly half the size of the previous one.
Specifically, XRP gained 1,676% between March 2020 and April 2021, while its rally from July 2024 to July 2025 produced an 854% increase.
If this pattern continues after another trendline retest, XRP could record a rally of approximately 435%. Such a move would put its price around $3.56, which would bring it close to the all-time high of $3.66 recorded in July 2025.
However, this remains a possibility, not a confirmed outcome. XRP must first reach the ascending trendline, and buyers must defend the support to create the conditions for another recovery. Whether the $0.70 to $0.82 area can hold against the current selling pressure remains to be seen.
#CryptoNewss
"XRP Now Close to Retesting the Ascending Trendline That Led to the 2021 and 2025 Rallies"
#XRP is getting closer to a long-term ascending trendline on its monthly chart that has previously marked major price bottoms and preceded significant rallies.
As the asset continues to lose value alongside the broader market, this support level could become important if the decline continues.
Interestingly, XRP has tested this trendline twice before, in 2020 and 2024, and both tests came before major price recoveries. If the same support holds again, another rally could follow.
XRP Declines as It Moves Closer to Long-Term Support
XRP has continued to fall alongside the broader crypto market, losing 16% in November after recording a 16.07% decline in October.
The token has also fallen deeper than much of the market as selling pressure continues to increase. However, its monthly chart shows that XRP is approaching a long-term ascending trendline that has triggered previous market recoveries.
This trendline first began forming in May 2017, during XRP’s major price surge that year. After the price pulled back to test the support in May, buyers pushed the price higher, eventually driving it to $3.31 in January 2018. This marked the peak of the rally, after which XRP entered a prolonged bear market that lasted several years.
Previous Trendline Tests Came Before Major Rallies
During that bear market, XRP continued to decline until it reached $0.1103 in March 2020. Notably, this low coincided with the ascending trendline that had formed in May 2017. The support held, and the price level eventually marked the bottom of the downtrend.
XRP then began recovering and continued to climb until it reached $1.96 in April 2021, marking the peak of that market cycle. From the March 2020 low of $0.1103, the $1.96 peak marked a 1,676% increase. This was the first major example of a trendline retest leading to a substantial recovery.
After reaching $1.96 in April 2021, XRP began falling as the next bear market took hold. The decline eventually pushed the price to $0.2910 in June 2022, following the collapse of the Terra ecosystem. However, unlike the March 2020 bottom, the June 2022 low did not coincide with a test of the ascending trendline.
XRP did not return to the trendline until July 2024, when it dropped to $0.3834. Three months later, the asset began another major rally in November 2024, following Donald Trump’s victory in the U.S. presidential election.
The recovery continued over the following months, eventually taking XRP to its all-time high of $3.66 in July 2025. This represented an 854% increase from the $0.3834 low recorded in July 2024.
XRP Could Fall Another 22%-33% Before Testing the Trendline
Since reaching $3.66 in July 2025, XRP has entered another prolonged decline as bearish conditions continue to affect the market. The asset now trades around $1.05, bringing it closer to the ascending trendline, although it has yet to reach the support.
On the monthly chart, the trendline currently sits between $0.70 and $0.82. This means XRP would need to fall another 22% to 33% from its current price of $1.05 to reach the support area. Further losses remain possible as selling pressure continues to weigh on the market.
However, previous price movements suggest that this area could provide an opportunity for a recovery. Both the March 2020 test at $0.1103 and the July 2024 test at $0.3834 came before major rallies.
If the ascending trendline holds again, XRP could experience another rebound similar to the recoveries that followed those earlier tests.
Historical Pattern Suggests XRP Could Reach $3.56
The size of XRP’s previous rallies following trendline retests also presents an interesting possibility. Historical data shows that each successive rally has been roughly half the size of the previous one.
Specifically, XRP gained 1,676% between March 2020 and April 2021, while its rally from July 2024 to July 2025 produced an 854% increase.
If this pattern continues after another trendline retest, XRP could record a rally of approximately 435%. Such a move would put its price around $3.56, which would bring it close to the all-time high of $3.66 recorded in July 2025.
However, this remains a possibility, not a confirmed outcome. XRP must first reach the ascending trendline, and buyers must defend the support to create the conditions for another recovery. Whether the $0.70 to $0.82 area can hold against the current selling pressure remains to be seen.
#CryptoNewss
As the asset continues to lose value alongside the broader market, this support level could become important if the decline continues.
Interestingly, XRP has tested this trendline twice before, in 2020 and 2024, and both tests came before major price recoveries. If the same support holds again, another rally could follow.
XRP Declines as It Moves Closer to Long-Term Support
XRP has continued to fall alongside the broader crypto market, losing 16% in November after recording a 16.07% decline in October.
The token has also fallen deeper than much of the market as selling pressure continues to increase. However, its monthly chart shows that XRP is approaching a long-term ascending trendline that has triggered previous market recoveries.
This trendline first began forming in May 2017, during XRP’s major price surge that year. After the price pulled back to test the support in May, buyers pushed the price higher, eventually driving it to $3.31 in January 2018. This marked the peak of the rally, after which XRP entered a prolonged bear market that lasted several years.
Previous Trendline Tests Came Before Major Rallies
During that bear market, XRP continued to decline until it reached $0.1103 in March 2020. Notably, this low coincided with the ascending trendline that had formed in May 2017. The support held, and the price level eventually marked the bottom of the downtrend.
XRP then began recovering and continued to climb until it reached $1.96 in April 2021, marking the peak of that market cycle. From the March 2020 low of $0.1103, the $1.96 peak marked a 1,676% increase. This was the first major example of a trendline retest leading to a substantial recovery.
After reaching $1.96 in April 2021, XRP began falling as the next bear market took hold. The decline eventually pushed the price to $0.2910 in June 2022, following the collapse of the Terra ecosystem. However, unlike the March 2020 bottom, the June 2022 low did not coincide with a test of the ascending trendline.
XRP did not return to the trendline until July 2024, when it dropped to $0.3834. Three months later, the asset began another major rally in November 2024, following Donald Trump’s victory in the U.S. presidential election.
The recovery continued over the following months, eventually taking XRP to its all-time high of $3.66 in July 2025. This represented an 854% increase from the $0.3834 low recorded in July 2024.
XRP Could Fall Another 22%-33% Before Testing the Trendline
Since reaching $3.66 in July 2025, XRP has entered another prolonged decline as bearish conditions continue to affect the market. The asset now trades around $1.05, bringing it closer to the ascending trendline, although it has yet to reach the support.
On the monthly chart, the trendline currently sits between $0.70 and $0.82. This means XRP would need to fall another 22% to 33% from its current price of $1.05 to reach the support area. Further losses remain possible as selling pressure continues to weigh on the market.
However, previous price movements suggest that this area could provide an opportunity for a recovery. Both the March 2020 test at $0.1103 and the July 2024 test at $0.3834 came before major rallies.
If the ascending trendline holds again, XRP could experience another rebound similar to the recoveries that followed those earlier tests.
Historical Pattern Suggests XRP Could Reach $3.56
The size of XRP’s previous rallies following trendline retests also presents an interesting possibility. Historical data shows that each successive rally has been roughly half the size of the previous one.
Specifically, XRP gained 1,676% between March 2020 and April 2021, while its rally from July 2024 to July 2025 produced an 854% increase.
If this pattern continues after another trendline retest, XRP could record a rally of approximately 435%. Such a move would put its price around $3.56, which would bring it close to the all-time high of $3.66 recorded in July 2025.
However, this remains a possibility, not a confirmed outcome. XRP must first reach the ascending trendline, and buyers must defend the support to create the conditions for another recovery. Whether the $0.70 to $0.82 area can hold against the current selling pressure remains to be seen.
#CryptoNewss
464
What Happened in Crypto on November 13, 2026.
Kraken Parent Reports Quarterly Recovery as Annual Earnings Fall.
Three Central Banks Publish Results of Blockchain Settlement Trial.
Twenty One Capital Explores Businesses Beyond Holding Bitcoin.
Hyperliquid Report Shows Stronger Trading Activity in Q3.
ADI Foundation and The Vault Plan Custody Integration.
AlfaR and Asseto Aim to Put Fund Ownership Records on Blockchain.
PDAX Details Access to Philippine Government Dollar Bonds.
Bithumb Sets Exit Dates for MANTRA and RECALL.
Upbit Suspends OSMO Transfers Following Network Disruption.
KuCoin Announces Five More Stock-Linked Perpetual Markets.
#Crypto
What Happened in Crypto on November 13, 2026.
Kraken Parent Reports Quarterly Recovery as Annual Earnings Fall.
Three Central Banks Publish Results of Blockchain Settlement Trial.
Twenty One Capital Explores Businesses Beyond Holding Bitcoin.
Hyperliquid Report Shows Stronger Trading Activity in Q3.
ADI Foundation and The Vault Plan Custody Integration.
AlfaR and Asseto Aim to Put Fund Ownership Records on Blockchain.
PDAX Details Access to Philippine Government Dollar Bonds.
Bithumb Sets Exit Dates for MANTRA and RECALL.
Upbit Suspends OSMO Transfers Following Network Disruption.
KuCoin Announces Five More Stock-Linked Perpetual Markets.
#Crypto
Kraken Parent Reports Quarterly Recovery as Annual Earnings Fall.
Three Central Banks Publish Results of Blockchain Settlement Trial.
Twenty One Capital Explores Businesses Beyond Holding Bitcoin.
Hyperliquid Report Shows Stronger Trading Activity in Q3.
ADI Foundation and The Vault Plan Custody Integration.
AlfaR and Asseto Aim to Put Fund Ownership Records on Blockchain.
PDAX Details Access to Philippine Government Dollar Bonds.
Bithumb Sets Exit Dates for MANTRA and RECALL.
Upbit Suspends OSMO Transfers Following Network Disruption.
KuCoin Announces Five More Stock-Linked Perpetual Markets.
#Crypto
463
#XRP is testing a critical recovery zone.
Holding $1–$0.9855 could preserve the current wave setup; a deeper move toward $0.90 may require a reset.
Hourly RSI divergence is developing, but $1.65 remains the broader confirmation level.
#CryptoNewss
#XRP is testing a critical recovery zone.
Holding $1–$0.9855 could preserve the current wave setup; a deeper move toward $0.90 may require a reset.
Hourly RSI divergence is developing, but $1.65 remains the broader confirmation level.
#CryptoNewss
Holding $1–$0.9855 could preserve the current wave setup; a deeper move toward $0.90 may require a reset.
Hourly RSI divergence is developing, but $1.65 remains the broader confirmation level.
#CryptoNewss
253
Article
"Crypto Price Analysis, BTC, XRP, SUI, LINK and ZEC, Nov. 13: Bitcoin Slides 6.7% as XRP Tests $1"Bitcoin falls 6.7% as XRP tests $1, while SUI, Chainlink and Zcash extend declines. Key Nov. 13 support, resistance and technical signals to watch now.
Bitcoin volatility expands as price breaks the 60-day low intraday
Bitcoin closed November 12 at $71,370.70, down 3.46%, after trading between $71,022.70 and $74,115.60. That low was the weakest in 60 completed daily sessions. The latest price of $68,848 was 6.64% below the $73,740 recorded in Thursday’s Bitcoin analysis.
The 14-day Average True Range, calculated with Wilder smoothing, rose to $2,324.36 from $2,265.25. ATR measures the size of recent price ranges rather than direction. The increase shows that daily volatility expanded as support gave way. Thursday’s ATR equaled 3.26% of the close.
The latest completed four-hour candle fell to $68,500 and closed at $68,890, confirming a shorter-term break below the completed daily low. Friday’s daily candle was still open, however, so a daily breakdown below $71,022.70 was not confirmed.
A daily close back above $71,370.70 would recover Thursday’s close and weaken the immediate breakdown. A close below $71,022.70 would confirm the extension, with $68,500 as the first nearby reference and the August 16 low at $62,660 as the next major support.
XRP holds near $1 as daily MACD remains bearish
XRP closed Thursday at $1.04003, down 1.05%, after a $1.01516–$1.05972 session. The $1.01516 low was the weakest in 60 completed daily sessions. The latest price was 5.20% below the $1.058 recorded in the November 11 report.
Daily MACD, using 12- and 26-period exponential moving averages with a nine-period signal EMA, remained bearish on the completed candle. The MACD line stood at −0.07482 against a −0.05666 signal.
The histogram improved slightly to −0.01816 from −0.01832, but this small change did not produce a bullish crossover. The bearish line-signal relationship has remained in place since the confirmed November 5 crossover.
The latest completed four-hour candle touched $0.99672 and closed at $1.00541. Its MACD line remained narrowly above the signal, but the move has not established a daily close below $1.
A daily reclaim of $1.01516 would repair the first broken level, while a close above $1.04003 would provide stronger recovery confirmation. A daily close below $1 would expose the August 17 low at $0.98764. Recovering $1.04003 would invalidate the immediate breakdown attempt.
Sui RSI weakens but remains above oversold on the daily chart
Sui closed November 12 at $0.8045, down 2.13%, after falling to $0.7814. The latest $0.772222 price was 10.98% below the $0.867481 recorded in the November 3 Sui analysis.
The 14-day Relative Strength Index, calculated with Wilder smoothing, fell to 36.12 from 37.91. The reading confirms weak momentum but remains above the conventional oversold threshold of 30.
The latest completed four-hour RSI was lower at 31.57 after the candle closed at $0.7739. This placed short-term momentum closer to oversold without confirming a reversal.
A daily close below $0.7814 would confirm a break of Thursday’s low. The four-hour low at $0.765 is the immediate support, followed by the September 15 low at $0.673.
A daily recovery above $0.8045 would invalidate the immediate breakdown and bring Thursday’s $0.8262 high back into focus. RSI alone does not establish a floor, so price confirmation remains necessary.
Chainlink stays below falling 20-day and 50-day averages
Chainlink closed Thursday at $10.13784, down 0.47%, after trading as low as $9.76260. The latest $9.69 price was 9.78% below the $10.74 recorded in the November 4 Chainlink analysis.
LINK/USD remains below falling 20-day and 50-day EMAs as early Friday trading tests $9.62049.
The 20-day exponential moving average fell to $11.00734, while the 50-day EMA declined to $11.57144. Price remains below both averages, and the faster average remains below the slower one. This extends an established bearish alignment rather than marking a new crossover.
The latest completed four-hour close at $9.72773 was also below its 20- and 50-period EMAs of $10.23351 and $10.54870.
A daily close below $9.76260 would confirm another 60-session low, with $9.62049 and the August 15 low at $8.96209 forming the next supports.
A rebound above $10.13784 would recover Thursday’s close, but a more durable repair would require a daily close above the falling 20-day EMA. Recovering that average would invalidate the immediate bearish continuation setup.
Zcash sets a 60-day low without above-average pair volume
Zcash closed November 12 at $956.97, down 0.55%, after trading from $928.18 to $1,005.47. The close followed Wednesday’s sharp decline and confirmed $928.18 as the weakest low in 60 completed sessions.
The latest price was 9.85% below the $1,031.73 recorded in the November 11 report.
Kraken spot volume totaled 24,611.88 ZEC on Thursday, equal to 0.92 times the preceding 20-session average. The new low therefore did not occur with above-average turnover on this USD pair. This exchange-volume reading is separate from the $788.30 million market-wide 24-hour volume in the table.
The latest completed four-hour candle fell to $920.63 and closed at $929.01. A daily close below $928.18 would confirm a further breakdown, with $920.63 as the immediate support.
A recovery above $956.97 would repair the first lost level, while a daily close above $1,005.47 would invalidate the immediate lower-low setup. Until either closing condition is met, Zcash remains volatile near support rather than in a confirmed reversal.
#CryptoNewsCommunity
"Crypto Price Analysis, BTC, XRP, SUI, LINK and ZEC, Nov. 13: Bitcoin Slides 6.7% as XRP Tests $1"
Bitcoin falls 6.7% as XRP tests $1, while SUI, Chainlink and Zcash extend declines. Key Nov. 13 support, resistance and technical signals to watch now.
Bitcoin volatility expands as price breaks the 60-day low intraday
Bitcoin closed November 12 at $71,370.70, down 3.46%, after trading between $71,022.70 and $74,115.60. That low was the weakest in 60 completed daily sessions. The latest price of $68,848 was 6.64% below the $73,740 recorded in Thursday’s Bitcoin analysis.
The 14-day Average True Range, calculated with Wilder smoothing, rose to $2,324.36 from $2,265.25. ATR measures the size of recent price ranges rather than direction. The increase shows that daily volatility expanded as support gave way. Thursday’s ATR equaled 3.26% of the close.
The latest completed four-hour candle fell to $68,500 and closed at $68,890, confirming a shorter-term break below the completed daily low. Friday’s daily candle was still open, however, so a daily breakdown below $71,022.70 was not confirmed.
A daily close back above $71,370.70 would recover Thursday’s close and weaken the immediate breakdown. A close below $71,022.70 would confirm the extension, with $68,500 as the first nearby reference and the August 16 low at $62,660 as the next major support.
XRP holds near $1 as daily MACD remains bearish
XRP closed Thursday at $1.04003, down 1.05%, after a $1.01516–$1.05972 session. The $1.01516 low was the weakest in 60 completed daily sessions. The latest price was 5.20% below the $1.058 recorded in the November 11 report.
Daily MACD, using 12- and 26-period exponential moving averages with a nine-period signal EMA, remained bearish on the completed candle. The MACD line stood at −0.07482 against a −0.05666 signal.
The histogram improved slightly to −0.01816 from −0.01832, but this small change did not produce a bullish crossover. The bearish line-signal relationship has remained in place since the confirmed November 5 crossover.
The latest completed four-hour candle touched $0.99672 and closed at $1.00541. Its MACD line remained narrowly above the signal, but the move has not established a daily close below $1.
A daily reclaim of $1.01516 would repair the first broken level, while a close above $1.04003 would provide stronger recovery confirmation. A daily close below $1 would expose the August 17 low at $0.98764. Recovering $1.04003 would invalidate the immediate breakdown attempt.
Sui RSI weakens but remains above oversold on the daily chart
Sui closed November 12 at $0.8045, down 2.13%, after falling to $0.7814. The latest $0.772222 price was 10.98% below the $0.867481 recorded in the November 3 Sui analysis.
The 14-day Relative Strength Index, calculated with Wilder smoothing, fell to 36.12 from 37.91. The reading confirms weak momentum but remains above the conventional oversold threshold of 30.
The latest completed four-hour RSI was lower at 31.57 after the candle closed at $0.7739. This placed short-term momentum closer to oversold without confirming a reversal.
A daily close below $0.7814 would confirm a break of Thursday’s low. The four-hour low at $0.765 is the immediate support, followed by the September 15 low at $0.673.
A daily recovery above $0.8045 would invalidate the immediate breakdown and bring Thursday’s $0.8262 high back into focus. RSI alone does not establish a floor, so price confirmation remains necessary.
Chainlink stays below falling 20-day and 50-day averages
Chainlink closed Thursday at $10.13784, down 0.47%, after trading as low as $9.76260. The latest $9.69 price was 9.78% below the $10.74 recorded in the November 4 Chainlink analysis.
LINK/USD remains below falling 20-day and 50-day EMAs as early Friday trading tests $9.62049.
The 20-day exponential moving average fell to $11.00734, while the 50-day EMA declined to $11.57144. Price remains below both averages, and the faster average remains below the slower one. This extends an established bearish alignment rather than marking a new crossover.
The latest completed four-hour close at $9.72773 was also below its 20- and 50-period EMAs of $10.23351 and $10.54870.
A daily close below $9.76260 would confirm another 60-session low, with $9.62049 and the August 15 low at $8.96209 forming the next supports.
A rebound above $10.13784 would recover Thursday’s close, but a more durable repair would require a daily close above the falling 20-day EMA. Recovering that average would invalidate the immediate bearish continuation setup.
Zcash sets a 60-day low without above-average pair volume
Zcash closed November 12 at $956.97, down 0.55%, after trading from $928.18 to $1,005.47. The close followed Wednesday’s sharp decline and confirmed $928.18 as the weakest low in 60 completed sessions.
The latest price was 9.85% below the $1,031.73 recorded in the November 11 report.
Kraken spot volume totaled 24,611.88 ZEC on Thursday, equal to 0.92 times the preceding 20-session average. The new low therefore did not occur with above-average turnover on this USD pair. This exchange-volume reading is separate from the $788.30 million market-wide 24-hour volume in the table.
The latest completed four-hour candle fell to $920.63 and closed at $929.01. A daily close below $928.18 would confirm a further breakdown, with $920.63 as the immediate support.
A recovery above $956.97 would repair the first lost level, while a daily close above $1,005.47 would invalidate the immediate lower-low setup. Until either closing condition is met, Zcash remains volatile near support rather than in a confirmed reversal.
#CryptoNewsCommunity
Bitcoin volatility expands as price breaks the 60-day low intraday
Bitcoin closed November 12 at $71,370.70, down 3.46%, after trading between $71,022.70 and $74,115.60. That low was the weakest in 60 completed daily sessions. The latest price of $68,848 was 6.64% below the $73,740 recorded in Thursday’s Bitcoin analysis.
The 14-day Average True Range, calculated with Wilder smoothing, rose to $2,324.36 from $2,265.25. ATR measures the size of recent price ranges rather than direction. The increase shows that daily volatility expanded as support gave way. Thursday’s ATR equaled 3.26% of the close.
The latest completed four-hour candle fell to $68,500 and closed at $68,890, confirming a shorter-term break below the completed daily low. Friday’s daily candle was still open, however, so a daily breakdown below $71,022.70 was not confirmed.
A daily close back above $71,370.70 would recover Thursday’s close and weaken the immediate breakdown. A close below $71,022.70 would confirm the extension, with $68,500 as the first nearby reference and the August 16 low at $62,660 as the next major support.
XRP holds near $1 as daily MACD remains bearish
XRP closed Thursday at $1.04003, down 1.05%, after a $1.01516–$1.05972 session. The $1.01516 low was the weakest in 60 completed daily sessions. The latest price was 5.20% below the $1.058 recorded in the November 11 report.
Daily MACD, using 12- and 26-period exponential moving averages with a nine-period signal EMA, remained bearish on the completed candle. The MACD line stood at −0.07482 against a −0.05666 signal.
The histogram improved slightly to −0.01816 from −0.01832, but this small change did not produce a bullish crossover. The bearish line-signal relationship has remained in place since the confirmed November 5 crossover.
The latest completed four-hour candle touched $0.99672 and closed at $1.00541. Its MACD line remained narrowly above the signal, but the move has not established a daily close below $1.
A daily reclaim of $1.01516 would repair the first broken level, while a close above $1.04003 would provide stronger recovery confirmation. A daily close below $1 would expose the August 17 low at $0.98764. Recovering $1.04003 would invalidate the immediate breakdown attempt.
Sui RSI weakens but remains above oversold on the daily chart
Sui closed November 12 at $0.8045, down 2.13%, after falling to $0.7814. The latest $0.772222 price was 10.98% below the $0.867481 recorded in the November 3 Sui analysis.
The 14-day Relative Strength Index, calculated with Wilder smoothing, fell to 36.12 from 37.91. The reading confirms weak momentum but remains above the conventional oversold threshold of 30.
The latest completed four-hour RSI was lower at 31.57 after the candle closed at $0.7739. This placed short-term momentum closer to oversold without confirming a reversal.
A daily close below $0.7814 would confirm a break of Thursday’s low. The four-hour low at $0.765 is the immediate support, followed by the September 15 low at $0.673.
A daily recovery above $0.8045 would invalidate the immediate breakdown and bring Thursday’s $0.8262 high back into focus. RSI alone does not establish a floor, so price confirmation remains necessary.
Chainlink stays below falling 20-day and 50-day averages
Chainlink closed Thursday at $10.13784, down 0.47%, after trading as low as $9.76260. The latest $9.69 price was 9.78% below the $10.74 recorded in the November 4 Chainlink analysis.
LINK/USD remains below falling 20-day and 50-day EMAs as early Friday trading tests $9.62049.
The 20-day exponential moving average fell to $11.00734, while the 50-day EMA declined to $11.57144. Price remains below both averages, and the faster average remains below the slower one. This extends an established bearish alignment rather than marking a new crossover.
The latest completed four-hour close at $9.72773 was also below its 20- and 50-period EMAs of $10.23351 and $10.54870.
A daily close below $9.76260 would confirm another 60-session low, with $9.62049 and the August 15 low at $8.96209 forming the next supports.
A rebound above $10.13784 would recover Thursday’s close, but a more durable repair would require a daily close above the falling 20-day EMA. Recovering that average would invalidate the immediate bearish continuation setup.
Zcash sets a 60-day low without above-average pair volume
Zcash closed November 12 at $956.97, down 0.55%, after trading from $928.18 to $1,005.47. The close followed Wednesday’s sharp decline and confirmed $928.18 as the weakest low in 60 completed sessions.
The latest price was 9.85% below the $1,031.73 recorded in the November 11 report.
Kraken spot volume totaled 24,611.88 ZEC on Thursday, equal to 0.92 times the preceding 20-session average. The new low therefore did not occur with above-average turnover on this USD pair. This exchange-volume reading is separate from the $788.30 million market-wide 24-hour volume in the table.
The latest completed four-hour candle fell to $920.63 and closed at $929.01. A daily close below $928.18 would confirm a further breakdown, with $920.63 as the immediate support.
A recovery above $956.97 would repair the first lost level, while a daily close above $1,005.47 would invalidate the immediate lower-low setup. Until either closing condition is met, Zcash remains volatile near support rather than in a confirmed reversal.
#CryptoNewsCommunity
1
468
Microsoft Corporation (NASDAQ: MSFT) shares fell more than 2% to $511.29 in pre-market trading on Friday as a global Microsoft 365 outage continued to disrupt business services despite progress on recovery efforts.
In its latest Friday update, Microsoft reported incremental improvements across several affected services as recovery efforts progressed. A patch targeting an upstream authentication and routing component had improved server stability, but overall service capacity had not returned to normal. The company continued to manage network traffic and process delayed emails, extending the email timeout window to 48 hours to preserve messages. It had not announced a timeline for full restoration.
The outage began Thursday with Exchange Online connectivity problems before affecting other Microsoft 365 services worldwide, disrupting businesses and government agencies. At its peak, Downdetector recorded approximately 130,000 reports of Outlook problems in the United States. The figure represents user-submitted reports, not a confirmed count of affected users.
Microsoft said a process responsible for establishing secure connections had become overloaded, causing affected servers to stop processing requests. Some servers also became unresponsive when traffic resumed following a restart.
The company began reversing a recent network configuration change that coincided with the start of the outage, but had not determined whether the change triggered the failures. Microsoft said it had found no indication of malicious activity and planned to publish a detailed report after resolving the incident.
#CryptoNewss
Microsoft Corporation (NASDAQ: MSFT) shares fell more than 2% to $511.29 in pre-market trading on Friday as a global Microsoft 365 outage continued to disrupt business services despite progress on recovery efforts.
In its latest Friday update, Microsoft reported incremental improvements across several affected services as recovery efforts progressed. A patch targeting an upstream authentication and routing component had improved server stability, but overall service capacity had not returned to normal. The company continued to manage network traffic and process delayed emails, extending the email timeout window to 48 hours to preserve messages. It had not announced a timeline for full restoration.
The outage began Thursday with Exchange Online connectivity problems before affecting other Microsoft 365 services worldwide, disrupting businesses and government agencies. At its peak, Downdetector recorded approximately 130,000 reports of Outlook problems in the United States. The figure represents user-submitted reports, not a confirmed count of affected users.
Microsoft said a process responsible for establishing secure connections had become overloaded, causing affected servers to stop processing requests. Some servers also became unresponsive when traffic resumed following a restart.
The company began reversing a recent network configuration change that coincided with the start of the outage, but had not determined whether the change triggered the failures. Microsoft said it had found no indication of malicious activity and planned to publish a detailed report after resolving the incident.
#CryptoNewss
In its latest Friday update, Microsoft reported incremental improvements across several affected services as recovery efforts progressed. A patch targeting an upstream authentication and routing component had improved server stability, but overall service capacity had not returned to normal. The company continued to manage network traffic and process delayed emails, extending the email timeout window to 48 hours to preserve messages. It had not announced a timeline for full restoration.
The outage began Thursday with Exchange Online connectivity problems before affecting other Microsoft 365 services worldwide, disrupting businesses and government agencies. At its peak, Downdetector recorded approximately 130,000 reports of Outlook problems in the United States. The figure represents user-submitted reports, not a confirmed count of affected users.
Microsoft said a process responsible for establishing secure connections had become overloaded, causing affected servers to stop processing requests. Some servers also became unresponsive when traffic resumed following a restart.
The company began reversing a recent network configuration change that coincided with the start of the outage, but had not determined whether the change triggered the failures. Microsoft said it had found no indication of malicious activity and planned to publish a detailed report after resolving the incident.
#CryptoNewss
187
$XRP Shark Wallets Rise 5.15% to 343,500 in 9 Months Despite Price Drop to $1.05.
The number of XRP wallets holding at least 10,000 tokens has increased by 16,815 over the past nine months, reaching 343,500, according to Santiment.
This growth comes as XRP has fallen nearly 30% in seven weeks, suggesting larger holders may be buying at lower prices.
XRP is now testing the $1.00 support level. If it holds, the price could recover toward $1.10–$1.15. However, a break below $1.00 could trigger further selling pressure.
#Crypto
$XRP Shark Wallets Rise 5.15% to 343,500 in 9 Months Despite Price Drop to $1.05.
The number of XRP wallets holding at least 10,000 tokens has increased by 16,815 over the past nine months, reaching 343,500, according to Santiment.
This growth comes as XRP has fallen nearly 30% in seven weeks, suggesting larger holders may be buying at lower prices.
XRP is now testing the $1.00 support level. If it holds, the price could recover toward $1.10–$1.15. However, a break below $1.00 could trigger further selling pressure.
#Crypto
The number of XRP wallets holding at least 10,000 tokens has increased by 16,815 over the past nine months, reaching 343,500, according to Santiment.
This growth comes as XRP has fallen nearly 30% in seven weeks, suggesting larger holders may be buying at lower prices.
XRP is now testing the $1.00 support level. If it holds, the price could recover toward $1.10–$1.15. However, a break below $1.00 could trigger further selling pressure.
#Crypto
247
Article
"How banks can turn digital asset demand into new revenue streams"Demand for stablecoins gives banks a starting point for product development, but commercial returns depend on pricing and delivery costs. In a 2025 EY survey of 100 financial institutions and 250 corporates, 56% of corporate respondents preferred stablecoin access through APIs in existing treasury systems. Around 70% said ERP integration would increase their willingness to adopt stablecoins.
For banks serving these clients, compatibility with established workflows is part of the product specification. A blockchain infrastructure provider can supply transaction technology, while the bank sets commercial terms and manages the customer relationship.
Offer stablecoin settlement through existing payment workflows
Merchants receiving stablecoins may need a bank-managed route to fiat settlement and familiar transaction reports. Corporate payables teams may want to transfer supported stablecoins using their established approval process. A bank can package payment acceptance, screening, conversion, and settlement as a defined service.
Processing charges, settlement fees, and conversion spreads are potential sources of income. Pricing needs to account for network fees, liquidity costs, issuer-specific redemption terms, and transaction-processing expenses. High-volume merchant receipts and less frequent treasury transfers require different forecasts.
Provide digital asset accounts with conversion access
Some fintechs, corporate clients, and professional customers may want wallets linked to the bank’s existing channels. The service can let authorized users hold supported digital assets, transfer them to approved counterparties, and convert them into fiat currencies.
Account fees, transaction charges, and conversion income can support the product. Delivery requires wallet provisioning, secure key management, permissions, screening, and accurate customer records. Client agreements and reporting must distinguish wallet-held or custodied assets from conventional bank deposits. Their legal and accounting treatment depends on the service structure and applicable rules.
Extend cross-border treasury services
Corporate groups managing funds across subsidiaries may need liquidity transfers beyond local banking cut-off times. A bank can incorporate blockchain-based movement into its cash-management offering, allowing authorized treasury staff to initiate and monitor transactions through existing channels or APIs.
Citi Token Services provides an institutional example: Citi described near-real-time cross-border payments and 24/7 liquidity transfers among participating branches. Comparable offerings may support premium treasury pricing, transfer charges, and conversion income where applicable. Finance teams also need visibility into liquidity, entity-level permissions, and consistent reporting across locations.
Model the product economics before launch
A commercial assessment should separate expected demand from the full cost of servicing it:
Customer demand: Estimate the eligible client segment, paying users, and transaction frequencyRevenue design: Separate fixed service charges, transfer fees, and conversion incomeDirect costs: Include network fees, liquidity, external software, screening, and transaction operationsRegulatory readiness: Confirm licensing, asset coverage, safeguarding duties, and internal approvalsUnit contribution: Estimate margin after variable processing, exception-handling, and support costs
Existing banking relationships offer a distribution route. A company already using a bank for accounts, FX, and treasury may prefer a supported stablecoin workflow in the same operating environment. That preference still has to translate into paid usage.
Test demand with a bounded commercial pilot
The bank doesn’t have to build a full blockchain stack to test a single product. Coinspaid Enterprise is an example of software for branded digital asset payments and exchange, with merchant management, settlement, reconciliation, liquidity, compliance, and transaction monitoring.
A bank assessing a ready-to-launch platform for financial institutions should verify workflow coverage against its intended product, licenses, and internal controls. The pilot can then compare forecasts with observed fee income after direct costs, paying clients, support time per transaction, and reconciliation exceptions.
If transaction fees cover processing costs but exceptions absorb too much staff time, the bank may need a narrower asset or network scope before expanding distribution.
#CryptoNews🚀🔥V
"How banks can turn digital asset demand into new revenue streams"
Demand for stablecoins gives banks a starting point for product development, but commercial returns depend on pricing and delivery costs. In a 2025 EY survey of 100 financial institutions and 250 corporates, 56% of corporate respondents preferred stablecoin access through APIs in existing treasury systems. Around 70% said ERP integration would increase their willingness to adopt stablecoins.
For banks serving these clients, compatibility with established workflows is part of the product specification. A blockchain infrastructure provider can supply transaction technology, while the bank sets commercial terms and manages the customer relationship.
Offer stablecoin settlement through existing payment workflows
Merchants receiving stablecoins may need a bank-managed route to fiat settlement and familiar transaction reports. Corporate payables teams may want to transfer supported stablecoins using their established approval process. A bank can package payment acceptance, screening, conversion, and settlement as a defined service.
Processing charges, settlement fees, and conversion spreads are potential sources of income. Pricing needs to account for network fees, liquidity costs, issuer-specific redemption terms, and transaction-processing expenses. High-volume merchant receipts and less frequent treasury transfers require different forecasts.
Provide digital asset accounts with conversion access
Some fintechs, corporate clients, and professional customers may want wallets linked to the bank’s existing channels. The service can let authorized users hold supported digital assets, transfer them to approved counterparties, and convert them into fiat currencies.
Account fees, transaction charges, and conversion income can support the product. Delivery requires wallet provisioning, secure key management, permissions, screening, and accurate customer records. Client agreements and reporting must distinguish wallet-held or custodied assets from conventional bank deposits. Their legal and accounting treatment depends on the service structure and applicable rules.
Extend cross-border treasury services
Corporate groups managing funds across subsidiaries may need liquidity transfers beyond local banking cut-off times. A bank can incorporate blockchain-based movement into its cash-management offering, allowing authorized treasury staff to initiate and monitor transactions through existing channels or APIs.
Citi Token Services provides an institutional example: Citi described near-real-time cross-border payments and 24/7 liquidity transfers among participating branches. Comparable offerings may support premium treasury pricing, transfer charges, and conversion income where applicable. Finance teams also need visibility into liquidity, entity-level permissions, and consistent reporting across locations.
Model the product economics before launch
A commercial assessment should separate expected demand from the full cost of servicing it:
Customer demand: Estimate the eligible client segment, paying users, and transaction frequencyRevenue design: Separate fixed service charges, transfer fees, and conversion incomeDirect costs: Include network fees, liquidity, external software, screening, and transaction operationsRegulatory readiness: Confirm licensing, asset coverage, safeguarding duties, and internal approvalsUnit contribution: Estimate margin after variable processing, exception-handling, and support costs
Existing banking relationships offer a distribution route. A company already using a bank for accounts, FX, and treasury may prefer a supported stablecoin workflow in the same operating environment. That preference still has to translate into paid usage.
Test demand with a bounded commercial pilot
The bank doesn’t have to build a full blockchain stack to test a single product. Coinspaid Enterprise is an example of software for branded digital asset payments and exchange, with merchant management, settlement, reconciliation, liquidity, compliance, and transaction monitoring.
A bank assessing a ready-to-launch platform for financial institutions should verify workflow coverage against its intended product, licenses, and internal controls. The pilot can then compare forecasts with observed fee income after direct costs, paying clients, support time per transaction, and reconciliation exceptions.
If transaction fees cover processing costs but exceptions absorb too much staff time, the bank may need a narrower asset or network scope before expanding distribution.
#CryptoNews🚀🔥V
For banks serving these clients, compatibility with established workflows is part of the product specification. A blockchain infrastructure provider can supply transaction technology, while the bank sets commercial terms and manages the customer relationship.
Offer stablecoin settlement through existing payment workflows
Merchants receiving stablecoins may need a bank-managed route to fiat settlement and familiar transaction reports. Corporate payables teams may want to transfer supported stablecoins using their established approval process. A bank can package payment acceptance, screening, conversion, and settlement as a defined service.
Processing charges, settlement fees, and conversion spreads are potential sources of income. Pricing needs to account for network fees, liquidity costs, issuer-specific redemption terms, and transaction-processing expenses. High-volume merchant receipts and less frequent treasury transfers require different forecasts.
Provide digital asset accounts with conversion access
Some fintechs, corporate clients, and professional customers may want wallets linked to the bank’s existing channels. The service can let authorized users hold supported digital assets, transfer them to approved counterparties, and convert them into fiat currencies.
Account fees, transaction charges, and conversion income can support the product. Delivery requires wallet provisioning, secure key management, permissions, screening, and accurate customer records. Client agreements and reporting must distinguish wallet-held or custodied assets from conventional bank deposits. Their legal and accounting treatment depends on the service structure and applicable rules.
Extend cross-border treasury services
Corporate groups managing funds across subsidiaries may need liquidity transfers beyond local banking cut-off times. A bank can incorporate blockchain-based movement into its cash-management offering, allowing authorized treasury staff to initiate and monitor transactions through existing channels or APIs.
Citi Token Services provides an institutional example: Citi described near-real-time cross-border payments and 24/7 liquidity transfers among participating branches. Comparable offerings may support premium treasury pricing, transfer charges, and conversion income where applicable. Finance teams also need visibility into liquidity, entity-level permissions, and consistent reporting across locations.
Model the product economics before launch
A commercial assessment should separate expected demand from the full cost of servicing it:
Customer demand: Estimate the eligible client segment, paying users, and transaction frequencyRevenue design: Separate fixed service charges, transfer fees, and conversion incomeDirect costs: Include network fees, liquidity, external software, screening, and transaction operationsRegulatory readiness: Confirm licensing, asset coverage, safeguarding duties, and internal approvalsUnit contribution: Estimate margin after variable processing, exception-handling, and support costs
Existing banking relationships offer a distribution route. A company already using a bank for accounts, FX, and treasury may prefer a supported stablecoin workflow in the same operating environment. That preference still has to translate into paid usage.
Test demand with a bounded commercial pilot
The bank doesn’t have to build a full blockchain stack to test a single product. Coinspaid Enterprise is an example of software for branded digital asset payments and exchange, with merchant management, settlement, reconciliation, liquidity, compliance, and transaction monitoring.
A bank assessing a ready-to-launch platform for financial institutions should verify workflow coverage against its intended product, licenses, and internal controls. The pilot can then compare forecasts with observed fee income after direct costs, paying clients, support time per transaction, and reconciliation exceptions.
If transaction fees cover processing costs but exceptions absorb too much staff time, the bank may need a narrower asset or network scope before expanding distribution.
#CryptoNews🚀🔥V
351
Article
"Cardano ETF AUM Is Just 0.8% of ADA Market Cap, Leaving More Than 99% Outside Funds"#Cardano remains significantly underrepresented in crypto exchange-traded funds compared with Bitcoin and Ethereum, with ADA ETF assets accounting for only around 0.8% of its circulating market capitalization.
Blockworks data shows a major gap in ETF penetration among the three assets. In the latest weekly snapshot, Bitcoin ETF AUM represented approximately 7.2% of BTC’s market cap, while Ethereum stood around 5.7%. Cardano was much lower at approximately 0.8%.
This means roughly 99.2% of Cardano’s circulating market value remains outside ADA-focused spot exchange-traded products, potentially leaving substantial room for additional institutional investment vehicles if demand develops.
Blockworks’ continuously updated dashboard currently puts ADA’s AUM-to-market-cap ratio at 0.84%, with approximately $62.6 million in AUM across 11 tracked Cardano-linked products. The same live dataset currently places Bitcoin at 7.68% and Ethereum at 6.4%, showing that the large relative gap remains despite weekly changes in prices and fund assets.
ADA ETF Penetration Trails Bitcoin and Ethereum by a Wide Margin
The difference becomes clearer when comparing the ratios directly.
At the 0.8% level in the Blockworks snapshot, Cardano’s ETF penetration would need to increase approximately 7.1 times to equal Ethereum’s 5.7% ratio.
Matching Bitcoin’s 7.2% ratio would require ETF AUM relative to ADA’s market capitalization to expand roughly ninefold.
This does not mean those multiples of capital will necessarily enter ADA ETFs. Bitcoin and Ethereum have much deeper institutional markets, more established ETF infrastructures and longer histories of regulated U.S. spot products.
However, the comparison shows how little of Cardano’s existing valuation is currently represented inside exchange-traded investment vehicles.
Notably, Blockworks currently reports that 98.36% of ADA-linked fund AUM comes from spot products, while only 4.21% of the total AUM is associated with U.S.-listed products.
That geographic imbalance could become important if additional U.S. investment vehicles eventually enter the market.
Cardano Already Attracted More Than $44M in Previous ETF Flows
Cardano-linked investment products have already shown signs of demand despite their relatively small footprint.
The Crypto Basic reported in July that more than $44 million had flowed into ADA investment products, including $37.2 million during 2025 and another $6.9 million during the first part of 2026.
ADA has also gained exposure through diversified institutional products. Cardano joined the Hashdex Nasdaq crypto index fund and was subsequently added to T. Rowe Price’s active crypto ETF.
However, Cardano suffered a setback in August when Grayscale withdrew its planned standalone spot ADA ETF. Grayscale said it no longer intended to proceed with the offering, which had never become effective.
This leaves Cardano with far less dedicated institutional distribution than Bitcoin and Ethereum.
Low ETF Share Could Represent Opportunity, Not Guaranteed Inflows
ADA currently trades around $0.175, with a circulating market capitalization of approximately $6.45 billion, according to CoinMarketCap.
The low ETF penetration comes as Cardano’s price remains under significant pressure. ADA recently failed to recover its former $0.19 range support, keeping the short-term technical structure bearish.
That creates an interesting contrast.
ADA’s price is near multi-year lows while regulated investment products control only a small fraction of its market value. Additional spot products—particularly products with broader U.S. distribution—could create another channel through which traditional investors gain exposure without directly holding ADA.
Still, 99% of ADA sitting outside ETFs should not be interpreted as 99% of supply waiting to enter ETFs. Most cryptocurrency market capitalization naturally remains outside funds, and a higher ETF-to-market-cap ratio depends on investor demand rather than product availability alone.
For Cardano, however, the comparison with Bitcoin and Ethereum highlights how early its institutional fund penetration remains. If new ADA products attract meaningful capital, there is substantially more room for the ETF share of Cardano’s market value to expand from today’s sub-1% level.
#CryptoNewsCommunity
"Cardano ETF AUM Is Just 0.8% of ADA Market Cap, Leaving More Than 99% Outside Funds"
#Cardano remains significantly underrepresented in crypto exchange-traded funds compared with Bitcoin and Ethereum, with ADA ETF assets accounting for only around 0.8% of its circulating market capitalization.
Blockworks data shows a major gap in ETF penetration among the three assets. In the latest weekly snapshot, Bitcoin ETF AUM represented approximately 7.2% of BTC’s market cap, while Ethereum stood around 5.7%. Cardano was much lower at approximately 0.8%.
This means roughly 99.2% of Cardano’s circulating market value remains outside ADA-focused spot exchange-traded products, potentially leaving substantial room for additional institutional investment vehicles if demand develops.
Blockworks’ continuously updated dashboard currently puts ADA’s AUM-to-market-cap ratio at 0.84%, with approximately $62.6 million in AUM across 11 tracked Cardano-linked products. The same live dataset currently places Bitcoin at 7.68% and Ethereum at 6.4%, showing that the large relative gap remains despite weekly changes in prices and fund assets.
ADA ETF Penetration Trails Bitcoin and Ethereum by a Wide Margin
The difference becomes clearer when comparing the ratios directly.
At the 0.8% level in the Blockworks snapshot, Cardano’s ETF penetration would need to increase approximately 7.1 times to equal Ethereum’s 5.7% ratio.
Matching Bitcoin’s 7.2% ratio would require ETF AUM relative to ADA’s market capitalization to expand roughly ninefold.
This does not mean those multiples of capital will necessarily enter ADA ETFs. Bitcoin and Ethereum have much deeper institutional markets, more established ETF infrastructures and longer histories of regulated U.S. spot products.
However, the comparison shows how little of Cardano’s existing valuation is currently represented inside exchange-traded investment vehicles.
Notably, Blockworks currently reports that 98.36% of ADA-linked fund AUM comes from spot products, while only 4.21% of the total AUM is associated with U.S.-listed products.
That geographic imbalance could become important if additional U.S. investment vehicles eventually enter the market.
Cardano Already Attracted More Than $44M in Previous ETF Flows
Cardano-linked investment products have already shown signs of demand despite their relatively small footprint.
The Crypto Basic reported in July that more than $44 million had flowed into ADA investment products, including $37.2 million during 2025 and another $6.9 million during the first part of 2026.
ADA has also gained exposure through diversified institutional products. Cardano joined the Hashdex Nasdaq crypto index fund and was subsequently added to T. Rowe Price’s active crypto ETF.
However, Cardano suffered a setback in August when Grayscale withdrew its planned standalone spot ADA ETF. Grayscale said it no longer intended to proceed with the offering, which had never become effective.
This leaves Cardano with far less dedicated institutional distribution than Bitcoin and Ethereum.
Low ETF Share Could Represent Opportunity, Not Guaranteed Inflows
ADA currently trades around $0.175, with a circulating market capitalization of approximately $6.45 billion, according to CoinMarketCap.
The low ETF penetration comes as Cardano’s price remains under significant pressure. ADA recently failed to recover its former $0.19 range support, keeping the short-term technical structure bearish.
That creates an interesting contrast.
ADA’s price is near multi-year lows while regulated investment products control only a small fraction of its market value. Additional spot products—particularly products with broader U.S. distribution—could create another channel through which traditional investors gain exposure without directly holding ADA.
Still, 99% of ADA sitting outside ETFs should not be interpreted as 99% of supply waiting to enter ETFs. Most cryptocurrency market capitalization naturally remains outside funds, and a higher ETF-to-market-cap ratio depends on investor demand rather than product availability alone.
For Cardano, however, the comparison with Bitcoin and Ethereum highlights how early its institutional fund penetration remains. If new ADA products attract meaningful capital, there is substantially more room for the ETF share of Cardano’s market value to expand from today’s sub-1% level.
#CryptoNewsCommunity
Blockworks data shows a major gap in ETF penetration among the three assets. In the latest weekly snapshot, Bitcoin ETF AUM represented approximately 7.2% of BTC’s market cap, while Ethereum stood around 5.7%. Cardano was much lower at approximately 0.8%.
This means roughly 99.2% of Cardano’s circulating market value remains outside ADA-focused spot exchange-traded products, potentially leaving substantial room for additional institutional investment vehicles if demand develops.
Blockworks’ continuously updated dashboard currently puts ADA’s AUM-to-market-cap ratio at 0.84%, with approximately $62.6 million in AUM across 11 tracked Cardano-linked products. The same live dataset currently places Bitcoin at 7.68% and Ethereum at 6.4%, showing that the large relative gap remains despite weekly changes in prices and fund assets.
ADA ETF Penetration Trails Bitcoin and Ethereum by a Wide Margin
The difference becomes clearer when comparing the ratios directly.
At the 0.8% level in the Blockworks snapshot, Cardano’s ETF penetration would need to increase approximately 7.1 times to equal Ethereum’s 5.7% ratio.
Matching Bitcoin’s 7.2% ratio would require ETF AUM relative to ADA’s market capitalization to expand roughly ninefold.
This does not mean those multiples of capital will necessarily enter ADA ETFs. Bitcoin and Ethereum have much deeper institutional markets, more established ETF infrastructures and longer histories of regulated U.S. spot products.
However, the comparison shows how little of Cardano’s existing valuation is currently represented inside exchange-traded investment vehicles.
Notably, Blockworks currently reports that 98.36% of ADA-linked fund AUM comes from spot products, while only 4.21% of the total AUM is associated with U.S.-listed products.
That geographic imbalance could become important if additional U.S. investment vehicles eventually enter the market.
Cardano Already Attracted More Than $44M in Previous ETF Flows
Cardano-linked investment products have already shown signs of demand despite their relatively small footprint.
The Crypto Basic reported in July that more than $44 million had flowed into ADA investment products, including $37.2 million during 2025 and another $6.9 million during the first part of 2026.
ADA has also gained exposure through diversified institutional products. Cardano joined the Hashdex Nasdaq crypto index fund and was subsequently added to T. Rowe Price’s active crypto ETF.
However, Cardano suffered a setback in August when Grayscale withdrew its planned standalone spot ADA ETF. Grayscale said it no longer intended to proceed with the offering, which had never become effective.
This leaves Cardano with far less dedicated institutional distribution than Bitcoin and Ethereum.
Low ETF Share Could Represent Opportunity, Not Guaranteed Inflows
ADA currently trades around $0.175, with a circulating market capitalization of approximately $6.45 billion, according to CoinMarketCap.
The low ETF penetration comes as Cardano’s price remains under significant pressure. ADA recently failed to recover its former $0.19 range support, keeping the short-term technical structure bearish.
That creates an interesting contrast.
ADA’s price is near multi-year lows while regulated investment products control only a small fraction of its market value. Additional spot products—particularly products with broader U.S. distribution—could create another channel through which traditional investors gain exposure without directly holding ADA.
Still, 99% of ADA sitting outside ETFs should not be interpreted as 99% of supply waiting to enter ETFs. Most cryptocurrency market capitalization naturally remains outside funds, and a higher ETF-to-market-cap ratio depends on investor demand rather than product availability alone.
For Cardano, however, the comparison with Bitcoin and Ethereum highlights how early its institutional fund penetration remains. If new ADA products attract meaningful capital, there is substantially more room for the ETF share of Cardano’s market value to expand from today’s sub-1% level.
#CryptoNewsCommunity
452
Verified
Article
"XRPL Validator Says The Only XRP Reset That’s Coming” Is for Testnet and Devnet"#XRP Ledger validator Vet has pushed back against broader “reset” narratives surrounding XRP, stressing that the only confirmed reset ahead concerns XRPL’s Testnet and Devnet—not the live XRP Ledger Mainnet.
“The only reset that’s coming is the one for the XRP Ledger Testnet and Devnet,” Vet said.
The comment comes as Ripple prepares to reset both developer networks later this month. Official XRP Ledger documentation confirms that Testnet and Devnet will be reset on Nov. 25, 2026 to improve full-history server stability.
Crucially, the reset has no effect on XRP held on Mainnet, Mainnet transactions, or the live XRP Ledger.
“Great Financial Reset”
Vet’s comment appears to be a direct jab at recurring “Great Financial Reset” narratives within parts of the XRP community, where some holders speculate that a future restructuring of the global financial system could send XRP to prices in the hundreds or even thousands of dollars.
Those theories often connect XRP with central-bank settlement, tokenized assets, debt restructuring or a major shift away from the existing monetary system. However, there is no confirmed XRPL mechanism, Ripple announcement or official financial policy showing that such a reset would automatically reprice XRP to extreme levels.
By saying the “only reset” coming is the Testnet and Devnet reset, Vet is effectively separating a real, scheduled XRPL infrastructure event from the much broader speculative “Great Financial Reset” narrative circulating among XRP holders.
XRP Ledger Mainnet Is Not Being Reset
Vet further clarified in a response that the operation “has nothing to do with XRP or the main net,” explaining that it is being carried out to recover from an infrastructure problem involving a full-history server.
XRPL documentation confirms this distinction.
The scheduled operation affects only Testnet and Devnet. XRP Ledger Mainnet, Xahau and the Hooks Testnet will continue operating normally.
Testnet is designed to resemble Mainnet closely enough for developers to test applications without putting real funds at risk. Devnet serves a different purpose, providing an environment where developers can experiment with proposed or upcoming features.
Test XRP on these networks is also entirely separate from real XRP on Mainnet and is intended solely for development purposes.
Accordingly, regular XRP holders do not need to move tokens, generate new wallets or take any action because of the upcoming reset.
Why XRPL Testnet Needs a Reset
The reset became necessary after the single full-history server supporting Testnet crashed and could not be recovered without clearing the network.
Developers are increasing server storage capacity as part of the work, which is intended to improve stability and reduce how frequently Testnet requires future resets.
The maintenance is scheduled for Nov. 25 between 5 p.m. and 6 p.m. Pacific time, equivalent to 01:00–02:00 UTC on Nov. 26.
This is infrastructure maintenance rather than a change to XRP’s supply, transaction history or Mainnet consensus.
The distinction is particularly important following heightened attention around XRP Ledger infrastructure. The Crypto Basic recently reported that the XRPL Foundation is taking a larger role in distributing software and strengthening network infrastructure.
Test Accounts, Balances and Transactions Will Be Wiped
While Mainnet remains unaffected, developers using the two test environments will see a complete reset of their existing data.
The operation will erase:
Testnet and Devnet accountsTransaction historiesTest XRP balancesAccount settingsOffersAutomated market makersEscrowsOther ledger objects
Testnet’s amendment status will then be restored to match Mainnet.
Developers who need to continue testing afterward must obtain new test XRP from the faucet and recreate the required accounts and ledger objects.
Certain infrastructure details will remain unchanged, including important network URLs, network IDs and validator configurations.
Developers running their own xrpld servers connected to Testnet or Devnet will also need to clear their local database data and restart their servers following the reset.
Development Continues Around Major XRPL Features
The reset arrives while several major XRP Ledger features remain under development or validator review.
The native XRP Ledger Lending Protocol recently gained additional validator support, while other upgrades continue expanding XRPL beyond its traditional payments functionality.
Development environments such as Testnet and Devnet are important because they allow those features and integrations to be tested before exposure to real assets.
XRPL developers have also shown a willingness to intervene when technical risks are discovered. In October, a critical XRPL payment-engine vulnerability was patched before any evidence of Mainnet exploitation emerged.
The Nov. 25 reset represents a much more routine infrastructure matter.
For XRP holders, the central point is simple: the live XRP Ledger is not being reset, and real XRP balances will not be affected.
#CryptoNewsCommunity
"XRPL Validator Says The Only XRP Reset That’s Coming” Is for Testnet and Devnet"
#XRP Ledger validator Vet has pushed back against broader “reset” narratives surrounding XRP, stressing that the only confirmed reset ahead concerns XRPL’s Testnet and Devnet—not the live XRP Ledger Mainnet.
“The only reset that’s coming is the one for the XRP Ledger Testnet and Devnet,” Vet said.
The comment comes as Ripple prepares to reset both developer networks later this month. Official XRP Ledger documentation confirms that Testnet and Devnet will be reset on Nov. 25, 2026 to improve full-history server stability.
Crucially, the reset has no effect on XRP held on Mainnet, Mainnet transactions, or the live XRP Ledger.
“Great Financial Reset”
Vet’s comment appears to be a direct jab at recurring “Great Financial Reset” narratives within parts of the XRP community, where some holders speculate that a future restructuring of the global financial system could send XRP to prices in the hundreds or even thousands of dollars.
Those theories often connect XRP with central-bank settlement, tokenized assets, debt restructuring or a major shift away from the existing monetary system. However, there is no confirmed XRPL mechanism, Ripple announcement or official financial policy showing that such a reset would automatically reprice XRP to extreme levels.
By saying the “only reset” coming is the Testnet and Devnet reset, Vet is effectively separating a real, scheduled XRPL infrastructure event from the much broader speculative “Great Financial Reset” narrative circulating among XRP holders.
XRP Ledger Mainnet Is Not Being Reset
Vet further clarified in a response that the operation “has nothing to do with XRP or the main net,” explaining that it is being carried out to recover from an infrastructure problem involving a full-history server.
XRPL documentation confirms this distinction.
The scheduled operation affects only Testnet and Devnet. XRP Ledger Mainnet, Xahau and the Hooks Testnet will continue operating normally.
Testnet is designed to resemble Mainnet closely enough for developers to test applications without putting real funds at risk. Devnet serves a different purpose, providing an environment where developers can experiment with proposed or upcoming features.
Test XRP on these networks is also entirely separate from real XRP on Mainnet and is intended solely for development purposes.
Accordingly, regular XRP holders do not need to move tokens, generate new wallets or take any action because of the upcoming reset.
Why XRPL Testnet Needs a Reset
The reset became necessary after the single full-history server supporting Testnet crashed and could not be recovered without clearing the network.
Developers are increasing server storage capacity as part of the work, which is intended to improve stability and reduce how frequently Testnet requires future resets.
The maintenance is scheduled for Nov. 25 between 5 p.m. and 6 p.m. Pacific time, equivalent to 01:00–02:00 UTC on Nov. 26.
This is infrastructure maintenance rather than a change to XRP’s supply, transaction history or Mainnet consensus.
The distinction is particularly important following heightened attention around XRP Ledger infrastructure. The Crypto Basic recently reported that the XRPL Foundation is taking a larger role in distributing software and strengthening network infrastructure.
Test Accounts, Balances and Transactions Will Be Wiped
While Mainnet remains unaffected, developers using the two test environments will see a complete reset of their existing data.
The operation will erase:
Testnet and Devnet accountsTransaction historiesTest XRP balancesAccount settingsOffersAutomated market makersEscrowsOther ledger objects
Testnet’s amendment status will then be restored to match Mainnet.
Developers who need to continue testing afterward must obtain new test XRP from the faucet and recreate the required accounts and ledger objects.
Certain infrastructure details will remain unchanged, including important network URLs, network IDs and validator configurations.
Developers running their own xrpld servers connected to Testnet or Devnet will also need to clear their local database data and restart their servers following the reset.
Development Continues Around Major XRPL Features
The reset arrives while several major XRP Ledger features remain under development or validator review.
The native XRP Ledger Lending Protocol recently gained additional validator support, while other upgrades continue expanding XRPL beyond its traditional payments functionality.
Development environments such as Testnet and Devnet are important because they allow those features and integrations to be tested before exposure to real assets.
XRPL developers have also shown a willingness to intervene when technical risks are discovered. In October, a critical XRPL payment-engine vulnerability was patched before any evidence of Mainnet exploitation emerged.
The Nov. 25 reset represents a much more routine infrastructure matter.
For XRP holders, the central point is simple: the live XRP Ledger is not being reset, and real XRP balances will not be affected.
#CryptoNewsCommunity
“The only reset that’s coming is the one for the XRP Ledger Testnet and Devnet,” Vet said.
The comment comes as Ripple prepares to reset both developer networks later this month. Official XRP Ledger documentation confirms that Testnet and Devnet will be reset on Nov. 25, 2026 to improve full-history server stability.
Crucially, the reset has no effect on XRP held on Mainnet, Mainnet transactions, or the live XRP Ledger.
“Great Financial Reset”
Vet’s comment appears to be a direct jab at recurring “Great Financial Reset” narratives within parts of the XRP community, where some holders speculate that a future restructuring of the global financial system could send XRP to prices in the hundreds or even thousands of dollars.
Those theories often connect XRP with central-bank settlement, tokenized assets, debt restructuring or a major shift away from the existing monetary system. However, there is no confirmed XRPL mechanism, Ripple announcement or official financial policy showing that such a reset would automatically reprice XRP to extreme levels.
By saying the “only reset” coming is the Testnet and Devnet reset, Vet is effectively separating a real, scheduled XRPL infrastructure event from the much broader speculative “Great Financial Reset” narrative circulating among XRP holders.
XRP Ledger Mainnet Is Not Being Reset
Vet further clarified in a response that the operation “has nothing to do with XRP or the main net,” explaining that it is being carried out to recover from an infrastructure problem involving a full-history server.
XRPL documentation confirms this distinction.
The scheduled operation affects only Testnet and Devnet. XRP Ledger Mainnet, Xahau and the Hooks Testnet will continue operating normally.
Testnet is designed to resemble Mainnet closely enough for developers to test applications without putting real funds at risk. Devnet serves a different purpose, providing an environment where developers can experiment with proposed or upcoming features.
Test XRP on these networks is also entirely separate from real XRP on Mainnet and is intended solely for development purposes.
Accordingly, regular XRP holders do not need to move tokens, generate new wallets or take any action because of the upcoming reset.
Why XRPL Testnet Needs a Reset
The reset became necessary after the single full-history server supporting Testnet crashed and could not be recovered without clearing the network.
Developers are increasing server storage capacity as part of the work, which is intended to improve stability and reduce how frequently Testnet requires future resets.
The maintenance is scheduled for Nov. 25 between 5 p.m. and 6 p.m. Pacific time, equivalent to 01:00–02:00 UTC on Nov. 26.
This is infrastructure maintenance rather than a change to XRP’s supply, transaction history or Mainnet consensus.
The distinction is particularly important following heightened attention around XRP Ledger infrastructure. The Crypto Basic recently reported that the XRPL Foundation is taking a larger role in distributing software and strengthening network infrastructure.
Test Accounts, Balances and Transactions Will Be Wiped
While Mainnet remains unaffected, developers using the two test environments will see a complete reset of their existing data.
The operation will erase:
Testnet and Devnet accountsTransaction historiesTest XRP balancesAccount settingsOffersAutomated market makersEscrowsOther ledger objects
Testnet’s amendment status will then be restored to match Mainnet.
Developers who need to continue testing afterward must obtain new test XRP from the faucet and recreate the required accounts and ledger objects.
Certain infrastructure details will remain unchanged, including important network URLs, network IDs and validator configurations.
Developers running their own xrpld servers connected to Testnet or Devnet will also need to clear their local database data and restart their servers following the reset.
Development Continues Around Major XRPL Features
The reset arrives while several major XRP Ledger features remain under development or validator review.
The native XRP Ledger Lending Protocol recently gained additional validator support, while other upgrades continue expanding XRPL beyond its traditional payments functionality.
Development environments such as Testnet and Devnet are important because they allow those features and integrations to be tested before exposure to real assets.
XRPL developers have also shown a willingness to intervene when technical risks are discovered. In October, a critical XRPL payment-engine vulnerability was patched before any evidence of Mainnet exploitation emerged.
The Nov. 25 reset represents a much more routine infrastructure matter.
For XRP holders, the central point is simple: the live XRP Ledger is not being reset, and real XRP balances will not be affected.
#CryptoNewsCommunity
1
1.1k
Nvidia (NASDAQ: $NVDA) Shares Plunge 10% as Jensen Huang Faces Possible Removal.
Nvidia shares fell more than 10% to $155.57 in Thursday’s premarket trading after reports that the board was considering removing CEO Jensen Huang amid allegations involving two extramarital relationships.
The reports came days after the board publicly backed Huang and launched an independent investigation. Nvidia has not announced any leadership changes.
#CryptoNews
Nvidia (NASDAQ: $NVDA) Shares Plunge 10% as Jensen Huang Faces Possible Removal.
Nvidia shares fell more than 10% to $155.57 in Thursday’s premarket trading after reports that the board was considering removing CEO Jensen Huang amid allegations involving two extramarital relationships.
The reports came days after the board publicly backed Huang and launched an independent investigation. Nvidia has not announced any leadership changes.
#CryptoNews
Nvidia shares fell more than 10% to $155.57 in Thursday’s premarket trading after reports that the board was considering removing CEO Jensen Huang amid allegations involving two extramarital relationships.
The reports came days after the board publicly backed Huang and launched an independent investigation. Nvidia has not announced any leadership changes.
#CryptoNews
131
Article
"Manipulation to Shake Out Weak Hands? Why XRP Has Dropped 23.4% Since Nov. 4"#XRP has suffered a substantially deeper selloff than Bitcoin, Ethereum and Solana since Nov. 4, falling 23.4% over the measured period as price breaks through successive support levels toward $1.
The comparison tracked the four assets from Nov. 4 through the Nov. 10 market snapshot. XRP recorded the largest decline at 23.4%, followed by Ethereum at 18.2%, Solana at 17.0%, and Bitcoin at 10.4%.
That means XRP underperformed Bitcoin by roughly 13 percentage points, Ethereum by 5.2 points, and Solana by 6.4 points.
EGRAG Crypto highlighted three possible explanations for the outsized XRP decline: a leverage flush, selling by long-term holders, or deliberate liquidity hunting.
He assigned subjective weights of 30%, 20%, and 50%, respectively, while stressing that the estimates are personal assessments rather than established probabilities.
XRP Falls Harder Than the Other Majors
The four-market comparison shows a clear difference in severity.
Bitcoin declined from roughly the low-$81,000 region toward $73,000 during the measured move. Ethereum fell from approximately $2,475 toward $2,025, while Solana dropped from around $99 to $82.
XRP’s decline was steeper, moving from roughly $1.36 to $1.04.
The difference matters because XRP entered the selloff with a fragile technical structure. Price had already lost the $1.24-$1.26 region and was carrying heavy leveraged-long exposure below spot.
The Crypto Basic previously reported that XRP had roughly 5.6 times more modeled long-liquidation exposure below spot than short exposure above. That positioning provided a mechanism through which falling prices could force additional longs out of the market.
This gives the leverage-flush explanation some observable support, although it cannot by itself explain the entire 23.4% decline.
Long-Term Holder Selling Remains Unproven
EGRAG’s second scenario involves early XRP holders taking profits or rotating into other assets.
The price comparison alone cannot establish that. A decline in price can result from many different combinations of spot selling, derivatives liquidations, reduced bids and broader risk-off positioning.
Without wallet-level evidence linking specific long-term holders to exchange deposits and sales, claims that “OGs” are driving the decline remain speculative.
In fact, recent on-chain activity has also shown some large holders accumulating during weakness, complicating the idea that whales are uniformly selling.
Manipulation Cannot Be Established From Price Action Alone
EGRAG assigned the largest subjective weight—50%—to a deliberate liquidity hunt designed to shake weaker holders out of XRP.
That interpretation cannot be confirmed from the price action alone.
Large, rapid declines can resemble stop hunts because leveraged positions cluster around obvious support levels. Once those levels fail, forced liquidations and stop orders can accelerate the move without requiring coordinated manipulation.
The recent sequence illustrates that dynamic. XRP first lost $1.19, then $1.14 and $1.10 as the market moved through successive downside liquidity zones. The $1.10 region had already been identified as a major target after XRP lost $1.26.
$1.00-$1.04 Becomes the Critical XRP Zone
XRP now trades around $1.05, leaving the $1.00-$1.04 region as the immediate area buyers need to defend. CoinMarketCap currently shows XRP down roughly 17% over seven days.
This overlaps with the major fair value gap extending toward $1 and follows the loss of the $1.07 support zone.
On the upside, XRP would first need to reclaim approximately $1.15, followed by $1.20-$1.25, before the short-term structure begins materially improving.
For now, the clearest confirmed explanation is that XRP entered the broader selloff with weaker market structure and substantial leveraged-long exposure. Whether longer-term holder selling or intentional liquidity hunting contributed meaningfully remains unproven.
#CryptoNewsCommunity
"Manipulation to Shake Out Weak Hands? Why XRP Has Dropped 23.4% Since Nov. 4"
#XRP has suffered a substantially deeper selloff than Bitcoin, Ethereum and Solana since Nov. 4, falling 23.4% over the measured period as price breaks through successive support levels toward $1.
The comparison tracked the four assets from Nov. 4 through the Nov. 10 market snapshot. XRP recorded the largest decline at 23.4%, followed by Ethereum at 18.2%, Solana at 17.0%, and Bitcoin at 10.4%.
That means XRP underperformed Bitcoin by roughly 13 percentage points, Ethereum by 5.2 points, and Solana by 6.4 points.
EGRAG Crypto highlighted three possible explanations for the outsized XRP decline: a leverage flush, selling by long-term holders, or deliberate liquidity hunting.
He assigned subjective weights of 30%, 20%, and 50%, respectively, while stressing that the estimates are personal assessments rather than established probabilities.
XRP Falls Harder Than the Other Majors
The four-market comparison shows a clear difference in severity.
Bitcoin declined from roughly the low-$81,000 region toward $73,000 during the measured move. Ethereum fell from approximately $2,475 toward $2,025, while Solana dropped from around $99 to $82.
XRP’s decline was steeper, moving from roughly $1.36 to $1.04.
The difference matters because XRP entered the selloff with a fragile technical structure. Price had already lost the $1.24-$1.26 region and was carrying heavy leveraged-long exposure below spot.
The Crypto Basic previously reported that XRP had roughly 5.6 times more modeled long-liquidation exposure below spot than short exposure above. That positioning provided a mechanism through which falling prices could force additional longs out of the market.
This gives the leverage-flush explanation some observable support, although it cannot by itself explain the entire 23.4% decline.
Long-Term Holder Selling Remains Unproven
EGRAG’s second scenario involves early XRP holders taking profits or rotating into other assets.
The price comparison alone cannot establish that. A decline in price can result from many different combinations of spot selling, derivatives liquidations, reduced bids and broader risk-off positioning.
Without wallet-level evidence linking specific long-term holders to exchange deposits and sales, claims that “OGs” are driving the decline remain speculative.
In fact, recent on-chain activity has also shown some large holders accumulating during weakness, complicating the idea that whales are uniformly selling.
Manipulation Cannot Be Established From Price Action Alone
EGRAG assigned the largest subjective weight—50%—to a deliberate liquidity hunt designed to shake weaker holders out of XRP.
That interpretation cannot be confirmed from the price action alone.
Large, rapid declines can resemble stop hunts because leveraged positions cluster around obvious support levels. Once those levels fail, forced liquidations and stop orders can accelerate the move without requiring coordinated manipulation.
The recent sequence illustrates that dynamic. XRP first lost $1.19, then $1.14 and $1.10 as the market moved through successive downside liquidity zones. The $1.10 region had already been identified as a major target after XRP lost $1.26.
$1.00-$1.04 Becomes the Critical XRP Zone
XRP now trades around $1.05, leaving the $1.00-$1.04 region as the immediate area buyers need to defend. CoinMarketCap currently shows XRP down roughly 17% over seven days.
This overlaps with the major fair value gap extending toward $1 and follows the loss of the $1.07 support zone.
On the upside, XRP would first need to reclaim approximately $1.15, followed by $1.20-$1.25, before the short-term structure begins materially improving.
For now, the clearest confirmed explanation is that XRP entered the broader selloff with weaker market structure and substantial leveraged-long exposure. Whether longer-term holder selling or intentional liquidity hunting contributed meaningfully remains unproven.
#CryptoNewsCommunity
The comparison tracked the four assets from Nov. 4 through the Nov. 10 market snapshot. XRP recorded the largest decline at 23.4%, followed by Ethereum at 18.2%, Solana at 17.0%, and Bitcoin at 10.4%.
That means XRP underperformed Bitcoin by roughly 13 percentage points, Ethereum by 5.2 points, and Solana by 6.4 points.
EGRAG Crypto highlighted three possible explanations for the outsized XRP decline: a leverage flush, selling by long-term holders, or deliberate liquidity hunting.
He assigned subjective weights of 30%, 20%, and 50%, respectively, while stressing that the estimates are personal assessments rather than established probabilities.
XRP Falls Harder Than the Other Majors
The four-market comparison shows a clear difference in severity.
Bitcoin declined from roughly the low-$81,000 region toward $73,000 during the measured move. Ethereum fell from approximately $2,475 toward $2,025, while Solana dropped from around $99 to $82.
XRP’s decline was steeper, moving from roughly $1.36 to $1.04.
The difference matters because XRP entered the selloff with a fragile technical structure. Price had already lost the $1.24-$1.26 region and was carrying heavy leveraged-long exposure below spot.
The Crypto Basic previously reported that XRP had roughly 5.6 times more modeled long-liquidation exposure below spot than short exposure above. That positioning provided a mechanism through which falling prices could force additional longs out of the market.
This gives the leverage-flush explanation some observable support, although it cannot by itself explain the entire 23.4% decline.
Long-Term Holder Selling Remains Unproven
EGRAG’s second scenario involves early XRP holders taking profits or rotating into other assets.
The price comparison alone cannot establish that. A decline in price can result from many different combinations of spot selling, derivatives liquidations, reduced bids and broader risk-off positioning.
Without wallet-level evidence linking specific long-term holders to exchange deposits and sales, claims that “OGs” are driving the decline remain speculative.
In fact, recent on-chain activity has also shown some large holders accumulating during weakness, complicating the idea that whales are uniformly selling.
Manipulation Cannot Be Established From Price Action Alone
EGRAG assigned the largest subjective weight—50%—to a deliberate liquidity hunt designed to shake weaker holders out of XRP.
That interpretation cannot be confirmed from the price action alone.
Large, rapid declines can resemble stop hunts because leveraged positions cluster around obvious support levels. Once those levels fail, forced liquidations and stop orders can accelerate the move without requiring coordinated manipulation.
The recent sequence illustrates that dynamic. XRP first lost $1.19, then $1.14 and $1.10 as the market moved through successive downside liquidity zones. The $1.10 region had already been identified as a major target after XRP lost $1.26.
$1.00-$1.04 Becomes the Critical XRP Zone
XRP now trades around $1.05, leaving the $1.00-$1.04 region as the immediate area buyers need to defend. CoinMarketCap currently shows XRP down roughly 17% over seven days.
This overlaps with the major fair value gap extending toward $1 and follows the loss of the $1.07 support zone.
On the upside, XRP would first need to reclaim approximately $1.15, followed by $1.20-$1.25, before the short-term structure begins materially improving.
For now, the clearest confirmed explanation is that XRP entered the broader selloff with weaker market structure and substantial leveraged-long exposure. Whether longer-term holder selling or intentional liquidity hunting contributed meaningfully remains unproven.
#CryptoNewsCommunity
325
#Bitcoin is still making lower highs and lower lows.
Key $BTC levels:
$76,400 — former major support, now resistance
$79,500 — next structural resistance
$83,500 — major recovery hurdle
$72,700-$73,000 — recent lows that bulls need to defend
BTC is currently around $74K.
Lose the recent lows and another lower low becomes possible.
Reclaim $76,400 and the short-term picture finally starts to improve.
Until then, the structure remains bearish.
#Bitcoin is still making lower highs and lower lows.
Key $BTC levels:
$76,400 — former major support, now resistance
$79,500 — next structural resistance
$83,500 — major recovery hurdle
$72,700-$73,000 — recent lows that bulls need to defend
BTC is currently around $74K.
Lose the recent lows and another lower low becomes possible.
Reclaim $76,400 and the short-term picture finally starts to improve.
Until then, the structure remains bearish.
Key $BTC levels:
$76,400 — former major support, now resistance
$79,500 — next structural resistance
$83,500 — major recovery hurdle
$72,700-$73,000 — recent lows that bulls need to defend
BTC is currently around $74K.
Lose the recent lows and another lower low becomes possible.
Reclaim $76,400 and the short-term picture finally starts to improve.
Until then, the structure remains bearish.
88
Verified
Charles Hoskinson says #Cardano is a “far better store of value” than #Bitcoin .
He points to:
• A 45B $ADA maximum supply
• Extended UTXO architecture
• Ability to upgrade against future threats
• On-chain governance
• Leios scaling approaching rollout
Hoskinson also says Cardano’s core technology is “basically done,” arguing the priority now is building successful projects such as RealFi, Midnight and Pogun that could bring millions of users into the ecosystem.
“Nothing shows success like success.”
Charles Hoskinson says #Cardano is a “far better store of value” than #Bitcoin .
He points to:
• A 45B $ADA maximum supply
• Extended UTXO architecture
• Ability to upgrade against future threats
• On-chain governance
• Leios scaling approaching rollout
Hoskinson also says Cardano’s core technology is “basically done,” arguing the priority now is building successful projects such as RealFi, Midnight and Pogun that could bring millions of users into the ecosystem.
“Nothing shows success like success.”
He points to:
• A 45B $ADA maximum supply
• Extended UTXO architecture
• Ability to upgrade against future threats
• On-chain governance
• Leios scaling approaching rollout
Hoskinson also says Cardano’s core technology is “basically done,” arguing the priority now is building successful projects such as RealFi, Midnight and Pogun that could bring millions of users into the ecosystem.
“Nothing shows success like success.”
5
664
Strategy Inc. (NASDAQ: $MSTR) Stock Drops 7% After MSCI Confirms Removal From Major Indexes.
Strategy shares fell about 7% to $114 on Thursday after MSCI confirmed that it will remove the Bitcoin treasury company from several major stock indexes starting December 1.
This means funds that track these indexes may have to sell their MSTR shares. Strategy estimates that these funds currently hold about 13 million shares, worth roughly $1.59 billion at Wednesday’s closing price.
MSCI’s decision follows new rules that restrict companies whose assets are mainly held in investments rather than used in traditional business operations.
#Crypto
Strategy Inc. (NASDAQ: $MSTR) Stock Drops 7% After MSCI Confirms Removal From Major Indexes.
Strategy shares fell about 7% to $114 on Thursday after MSCI confirmed that it will remove the Bitcoin treasury company from several major stock indexes starting December 1.
This means funds that track these indexes may have to sell their MSTR shares. Strategy estimates that these funds currently hold about 13 million shares, worth roughly $1.59 billion at Wednesday’s closing price.
MSCI’s decision follows new rules that restrict companies whose assets are mainly held in investments rather than used in traditional business operations.
#Crypto
Strategy shares fell about 7% to $114 on Thursday after MSCI confirmed that it will remove the Bitcoin treasury company from several major stock indexes starting December 1.
This means funds that track these indexes may have to sell their MSTR shares. Strategy estimates that these funds currently hold about 13 million shares, worth roughly $1.59 billion at Wednesday’s closing price.
MSCI’s decision follows new rules that restrict companies whose assets are mainly held in investments rather than used in traditional business operations.
#Crypto
244
Article
"Where is Cardano Heading as ADA Fails to Reclaim $0.19 Range Low"Cardano remains trapped in a bearish market structure after failing to reclaim the $0.19 range low, leaving ADA vulnerable to further downside until buyers break the sequence of lower highs.
ADA currently trades around $0.175, down roughly 2% over the past 24 hours and nearly 31% over the past month. The latest weakness leaves price well beneath the former range floor that previously supported the market.
The immediate technical problem is straightforward: ADA has bounced from the lower-$0.17 region, but the recovery has not been strong enough to reclaim lost structure.
ADA Remains Below the Former $0.19 Range Low
The Binance 12-hour structure developed a broad trading range with support near $0.19 and resistance around $0.258-$0.26.
ADA initially spent weeks oscillating inside this range before the structure deteriorated through October and early November.
Once $0.19 failed, sellers pushed ADA toward roughly $0.17, establishing another lower low.
At $0.175, ADA remains approximately 8% below the former $0.19 support, based on our calculation. That means the latest bounce has yet to turn the breakdown into a failed move.
The Crypto Basic recently highlighted how ADA’s loss of $0.1762 shifted attention toward $0.1705 and $0.1658. Price has since continued trading close to that lower support region.
$0.20-$0.202 Is the More Important Bullish Test
Reclaiming $0.19 would improve the immediate structure, but it would not be enough by itself to establish a bullish trend.
ADA still faces a lower high around $0.20-$0.202. This is the level buyers need to break to interrupt the sequence of lower highs that has defined the decline.
From $0.175, a move to $0.202 would require an advance of approximately 15.4%.
A sustained break above that area would provide the first stronger evidence that sellers are losing control and could open the way toward the middle of the previous range.
Until then, a rebound into $0.19-$0.20 could simply become another lower high within the downtrend. This is consistent with previous analysis showing that ADA needed to clear resistance around $0.195-$0.204 before a stronger recovery could develop.
Range High Near $0.26 Only Matters After Structure Changes
The larger upside level remains around $0.258-$0.26, which formed the previous range high. From $0.175, a return to $0.26 would represent nearly 49% upside. However, that target remains distant while ADA continues trading below $0.19 and the last lower high.
The more immediate sequence is:
$0.19: reclaim the former range low.
$0.20-$0.202: break the latest lower high.
$0.24-$0.26: broader recovery area if market structure turns bullish.
On the downside, the $0.17 region remains the first area buyers need to defend. Previous The Crypto Basic analysis has also identified a deeper bearish path toward approximately $0.15 if ADA fails to stabilize.
For now, Cardano remains in a downtrend. The first meaningful improvement would come from reclaiming $0.19, but stronger confirmation requires ADA to break the $0.20-$0.202 lower high.
#CryptoNewss
"Where is Cardano Heading as ADA Fails to Reclaim $0.19 Range Low"
Cardano remains trapped in a bearish market structure after failing to reclaim the $0.19 range low, leaving ADA vulnerable to further downside until buyers break the sequence of lower highs.
ADA currently trades around $0.175, down roughly 2% over the past 24 hours and nearly 31% over the past month. The latest weakness leaves price well beneath the former range floor that previously supported the market.
The immediate technical problem is straightforward: ADA has bounced from the lower-$0.17 region, but the recovery has not been strong enough to reclaim lost structure.
ADA Remains Below the Former $0.19 Range Low
The Binance 12-hour structure developed a broad trading range with support near $0.19 and resistance around $0.258-$0.26.
ADA initially spent weeks oscillating inside this range before the structure deteriorated through October and early November.
Once $0.19 failed, sellers pushed ADA toward roughly $0.17, establishing another lower low.
At $0.175, ADA remains approximately 8% below the former $0.19 support, based on our calculation. That means the latest bounce has yet to turn the breakdown into a failed move.
The Crypto Basic recently highlighted how ADA’s loss of $0.1762 shifted attention toward $0.1705 and $0.1658. Price has since continued trading close to that lower support region.
$0.20-$0.202 Is the More Important Bullish Test
Reclaiming $0.19 would improve the immediate structure, but it would not be enough by itself to establish a bullish trend.
ADA still faces a lower high around $0.20-$0.202. This is the level buyers need to break to interrupt the sequence of lower highs that has defined the decline.
From $0.175, a move to $0.202 would require an advance of approximately 15.4%.
A sustained break above that area would provide the first stronger evidence that sellers are losing control and could open the way toward the middle of the previous range.
Until then, a rebound into $0.19-$0.20 could simply become another lower high within the downtrend. This is consistent with previous analysis showing that ADA needed to clear resistance around $0.195-$0.204 before a stronger recovery could develop.
Range High Near $0.26 Only Matters After Structure Changes
The larger upside level remains around $0.258-$0.26, which formed the previous range high. From $0.175, a return to $0.26 would represent nearly 49% upside. However, that target remains distant while ADA continues trading below $0.19 and the last lower high.
The more immediate sequence is:
$0.19: reclaim the former range low.
$0.20-$0.202: break the latest lower high.
$0.24-$0.26: broader recovery area if market structure turns bullish.
On the downside, the $0.17 region remains the first area buyers need to defend. Previous The Crypto Basic analysis has also identified a deeper bearish path toward approximately $0.15 if ADA fails to stabilize.
For now, Cardano remains in a downtrend. The first meaningful improvement would come from reclaiming $0.19, but stronger confirmation requires ADA to break the $0.20-$0.202 lower high.
#CryptoNewss
ADA currently trades around $0.175, down roughly 2% over the past 24 hours and nearly 31% over the past month. The latest weakness leaves price well beneath the former range floor that previously supported the market.
The immediate technical problem is straightforward: ADA has bounced from the lower-$0.17 region, but the recovery has not been strong enough to reclaim lost structure.
ADA Remains Below the Former $0.19 Range Low
The Binance 12-hour structure developed a broad trading range with support near $0.19 and resistance around $0.258-$0.26.
ADA initially spent weeks oscillating inside this range before the structure deteriorated through October and early November.
Once $0.19 failed, sellers pushed ADA toward roughly $0.17, establishing another lower low.
At $0.175, ADA remains approximately 8% below the former $0.19 support, based on our calculation. That means the latest bounce has yet to turn the breakdown into a failed move.
The Crypto Basic recently highlighted how ADA’s loss of $0.1762 shifted attention toward $0.1705 and $0.1658. Price has since continued trading close to that lower support region.
$0.20-$0.202 Is the More Important Bullish Test
Reclaiming $0.19 would improve the immediate structure, but it would not be enough by itself to establish a bullish trend.
ADA still faces a lower high around $0.20-$0.202. This is the level buyers need to break to interrupt the sequence of lower highs that has defined the decline.
From $0.175, a move to $0.202 would require an advance of approximately 15.4%.
A sustained break above that area would provide the first stronger evidence that sellers are losing control and could open the way toward the middle of the previous range.
Until then, a rebound into $0.19-$0.20 could simply become another lower high within the downtrend. This is consistent with previous analysis showing that ADA needed to clear resistance around $0.195-$0.204 before a stronger recovery could develop.
Range High Near $0.26 Only Matters After Structure Changes
The larger upside level remains around $0.258-$0.26, which formed the previous range high. From $0.175, a return to $0.26 would represent nearly 49% upside. However, that target remains distant while ADA continues trading below $0.19 and the last lower high.
The more immediate sequence is:
$0.19: reclaim the former range low.
$0.20-$0.202: break the latest lower high.
$0.24-$0.26: broader recovery area if market structure turns bullish.
On the downside, the $0.17 region remains the first area buyers need to defend. Previous The Crypto Basic analysis has also identified a deeper bearish path toward approximately $0.15 if ADA fails to stabilize.
For now, Cardano remains in a downtrend. The first meaningful improvement would come from reclaiming $0.19, but stronger confirmation requires ADA to break the $0.20-$0.202 lower high.
#CryptoNewss
267
CoreWeave (NASDAQ: CRWV) shares surged about 15% to $55.47 in Wednesday’s premarket trading after the AI cloud provider reported stronger-than-expected third-quarter results and raised its 2026 financial forecasts. Management also outlined plans to fund the company’s infrastructure expansion through customer payments and borrowing backed by infrastructure and customer contracts.
The company reported third-quarter revenue of $3.66 billion, up 168% from $1.37 billion a year earlier and above the $3.56 billion Wall Street estimate cited by Bloomberg. Its reported loss of $1.27 per share was also narrower than Bloomberg’s consensus estimate of $1.46 per share.
CoreWeave generated $379 million in adjusted operating income during the quarter, exceeding its earlier guidance of $200 million to $260 million. Its adjusted operating margin improved to 10% from 5% in the second quarter.
CoreWeave raised its full-year revenue guidance to $13 billion to $13.3 billion, up from its previous forecast of $12.4 billion to $13.2 billion, and increased its adjusted operating income forecast to $1.275 billion to $1.375 billion. The midpoint of the new operating income forecast is 26% higher than the midpoint of its previous guidance.
The company also raised its year-end annualized revenue run-rate forecast to $20 billion to $21 billion. The figure annualizes projected December 2026 revenue and does not represent the company’s expected full-year revenue.
Revenue backlog reached $132.5 billion at the end of September, compared with $104 billion three months earlier. The backlog includes expected revenue from committed customer contracts, subject to infrastructure delivery and service availability requirements.
CoreWeave’s premarket advance followed an approximately 11% decline in its shares over November’s first seven trading sessions.
Separately, CoreWeave Tokenized bStocks (CRWVB) traded at $55.46, gaining 17% over the past 24 hours.
CoreWeave (NASDAQ: CRWV) shares surged about 15% to $55.47 in Wednesday’s premarket trading after the AI cloud provider reported stronger-than-expected third-quarter results and raised its 2026 financial forecasts. Management also outlined plans to fund the company’s infrastructure expansion through customer payments and borrowing backed by infrastructure and customer contracts.
The company reported third-quarter revenue of $3.66 billion, up 168% from $1.37 billion a year earlier and above the $3.56 billion Wall Street estimate cited by Bloomberg. Its reported loss of $1.27 per share was also narrower than Bloomberg’s consensus estimate of $1.46 per share.
CoreWeave generated $379 million in adjusted operating income during the quarter, exceeding its earlier guidance of $200 million to $260 million. Its adjusted operating margin improved to 10% from 5% in the second quarter.
CoreWeave raised its full-year revenue guidance to $13 billion to $13.3 billion, up from its previous forecast of $12.4 billion to $13.2 billion, and increased its adjusted operating income forecast to $1.275 billion to $1.375 billion. The midpoint of the new operating income forecast is 26% higher than the midpoint of its previous guidance.
The company also raised its year-end annualized revenue run-rate forecast to $20 billion to $21 billion. The figure annualizes projected December 2026 revenue and does not represent the company’s expected full-year revenue.
Revenue backlog reached $132.5 billion at the end of September, compared with $104 billion three months earlier. The backlog includes expected revenue from committed customer contracts, subject to infrastructure delivery and service availability requirements.
CoreWeave’s premarket advance followed an approximately 11% decline in its shares over November’s first seven trading sessions.
Separately, CoreWeave Tokenized bStocks (CRWVB) traded at $55.46, gaining 17% over the past 24 hours.
The company reported third-quarter revenue of $3.66 billion, up 168% from $1.37 billion a year earlier and above the $3.56 billion Wall Street estimate cited by Bloomberg. Its reported loss of $1.27 per share was also narrower than Bloomberg’s consensus estimate of $1.46 per share.
CoreWeave generated $379 million in adjusted operating income during the quarter, exceeding its earlier guidance of $200 million to $260 million. Its adjusted operating margin improved to 10% from 5% in the second quarter.
CoreWeave raised its full-year revenue guidance to $13 billion to $13.3 billion, up from its previous forecast of $12.4 billion to $13.2 billion, and increased its adjusted operating income forecast to $1.275 billion to $1.375 billion. The midpoint of the new operating income forecast is 26% higher than the midpoint of its previous guidance.
The company also raised its year-end annualized revenue run-rate forecast to $20 billion to $21 billion. The figure annualizes projected December 2026 revenue and does not represent the company’s expected full-year revenue.
Revenue backlog reached $132.5 billion at the end of September, compared with $104 billion three months earlier. The backlog includes expected revenue from committed customer contracts, subject to infrastructure delivery and service availability requirements.
CoreWeave’s premarket advance followed an approximately 11% decline in its shares over November’s first seven trading sessions.
Separately, CoreWeave Tokenized bStocks (CRWVB) traded at $55.46, gaining 17% over the past 24 hours.
62
Article
"Upcoming Anthropic IPO Could Be One Reason Bitcoin Is Falling"Benjamin Cowen says Anthropic’s massive upcoming IPO could be contributing to Bitcoin’s decline as BTC begins tracking its pre-SpaceX IPO pattern.
Bitcoin’s latest decline may have an unusual source of pressure: investors raising cash ahead of Anthropic’s potentially massive initial public offering.
Into The Cryptoverse founder Benjamin Cowen raised the possibility as Bitcoin trades around $73,500, saying major IPOs can encourage investors to free up capital that would otherwise remain deployed across assets such as Bitcoin. CoinMarketCap currently places BTC near $73,503.
He pointed to Bitcoin’s performance surrounding the SpaceX IPO earlier this year, adding that investors “will often try to free up capital for major IPOs.”
Bitcoin Fell About 20% Into the SpaceX IPO
Bitcoin’s performance around the SpaceX listing provides the basis for the comparison.
Using the BTC price 30 days before each IPO as the 0% starting point, Bitcoin initially remained close to flat before beginning a sustained decline ahead of SpaceX’s debut.
By the time SpaceX went public on June 12, 2026, Bitcoin’s normalized return had fallen to roughly -20% from the 30-day starting point.
SpaceX officially began trading on Nasdaq under the ticker SPCX on June 12, after pricing its IPO at $135 per share. The base offering involved 555.56 million shares, equivalent to approximately $75 billion before the underwriters’ additional allocation.
Bitcoin closed that day near $63,543, according to historical CoinMarketCap data.
The decline did not immediately end when the IPO arrived. Bitcoin briefly recovered after the listing before its normalized return deteriorated toward approximately -26% around 18 days after the IPO. It subsequently recovered part of those losses and finished the 30-day post-IPO window around 19% below the original baseline.
Anthropic Setup Is Starting to Resemble the Same Pattern
The Anthropic comparison currently begins 30 days ahead of an assumed Nov. 19 listing date.
That date is now more than a hypothetical reference. Anthropic officially launched its IPO roadshow on Nov. 10, offering 825 million Class A shares at an expected price of $70 to $78 per share. The company has applied to trade on Nasdaq under the ticker ANT.
Reuters reports that trading is expected to begin on Nov. 19, with the offering potentially raising as much as $64.4 billion and valuing Anthropic at up to roughly $1.4 trillion on a fully diluted basis.
Bitcoin is currently roughly 11% below the normalized level from 30 days before the expected Anthropic listing.
The decline is therefore heading in the same broad direction as the SpaceX period, although Bitcoin had already fallen considerably more at a comparable stage of the SpaceX setup.
Why a Massive IPO Could Pressure Bitcoin
The mechanism Cowen is highlighting is capital competition.
Large institutional and wealthy investors typically operate with finite capital. Ahead of an unusually large IPO, some may increase cash balances, reduce other holdings or rebalance portfolios to participate in the offering.
Anthropic’s proposed deal is large enough for that possibility to matter. At the upper end of its price range, the Claude developer could raise tens of billions of dollars from public-market investors.
Selling liquid assets such as stocks or Bitcoin is one way investors could create that liquidity.
However, there is currently no evidence establishing that Anthropic’s IPO is the primary cause of Bitcoin’s decline. Bitcoin is simultaneously dealing with bearish technical momentum, broader risk-asset weakness and the loss of several important support levels.
The Crypto Basic recently noted that Bitcoin remains below its falling 20-day and 50-day exponential moving averages, while another analysis identified $73,000 as a key support region before a possible deeper decline toward $60,000.
Cowen has also maintained throughout 2026 that Bitcoin is operating within a bear-market structure.
Nov. 19 Becomes an Interesting Bitcoin Test
The comparison now creates a clear date to watch.
If Bitcoin continues weakening into Anthropic’s expected Nov. 19 debut and subsequently stabilizes once the IPO is completed, the capital-rotation argument would gain additional circumstantial support.
A continued decline well beyond the IPO, however, would strengthen the case that broader crypto and macro conditions—not a single stock offering—remain the dominant forces.
For now, Bitcoin’s pre-Anthropic trajectory is moving in the same direction as its pre-SpaceX performance, but with a smaller normalized loss.
#CryptoNewsFlash
"Upcoming Anthropic IPO Could Be One Reason Bitcoin Is Falling"
Benjamin Cowen says Anthropic’s massive upcoming IPO could be contributing to Bitcoin’s decline as BTC begins tracking its pre-SpaceX IPO pattern.
Bitcoin’s latest decline may have an unusual source of pressure: investors raising cash ahead of Anthropic’s potentially massive initial public offering.
Into The Cryptoverse founder Benjamin Cowen raised the possibility as Bitcoin trades around $73,500, saying major IPOs can encourage investors to free up capital that would otherwise remain deployed across assets such as Bitcoin. CoinMarketCap currently places BTC near $73,503.
He pointed to Bitcoin’s performance surrounding the SpaceX IPO earlier this year, adding that investors “will often try to free up capital for major IPOs.”
Bitcoin Fell About 20% Into the SpaceX IPO
Bitcoin’s performance around the SpaceX listing provides the basis for the comparison.
Using the BTC price 30 days before each IPO as the 0% starting point, Bitcoin initially remained close to flat before beginning a sustained decline ahead of SpaceX’s debut.
By the time SpaceX went public on June 12, 2026, Bitcoin’s normalized return had fallen to roughly -20% from the 30-day starting point.
SpaceX officially began trading on Nasdaq under the ticker SPCX on June 12, after pricing its IPO at $135 per share. The base offering involved 555.56 million shares, equivalent to approximately $75 billion before the underwriters’ additional allocation.
Bitcoin closed that day near $63,543, according to historical CoinMarketCap data.
The decline did not immediately end when the IPO arrived. Bitcoin briefly recovered after the listing before its normalized return deteriorated toward approximately -26% around 18 days after the IPO. It subsequently recovered part of those losses and finished the 30-day post-IPO window around 19% below the original baseline.
Anthropic Setup Is Starting to Resemble the Same Pattern
The Anthropic comparison currently begins 30 days ahead of an assumed Nov. 19 listing date.
That date is now more than a hypothetical reference. Anthropic officially launched its IPO roadshow on Nov. 10, offering 825 million Class A shares at an expected price of $70 to $78 per share. The company has applied to trade on Nasdaq under the ticker ANT.
Reuters reports that trading is expected to begin on Nov. 19, with the offering potentially raising as much as $64.4 billion and valuing Anthropic at up to roughly $1.4 trillion on a fully diluted basis.
Bitcoin is currently roughly 11% below the normalized level from 30 days before the expected Anthropic listing.
The decline is therefore heading in the same broad direction as the SpaceX period, although Bitcoin had already fallen considerably more at a comparable stage of the SpaceX setup.
Why a Massive IPO Could Pressure Bitcoin
The mechanism Cowen is highlighting is capital competition.
Large institutional and wealthy investors typically operate with finite capital. Ahead of an unusually large IPO, some may increase cash balances, reduce other holdings or rebalance portfolios to participate in the offering.
Anthropic’s proposed deal is large enough for that possibility to matter. At the upper end of its price range, the Claude developer could raise tens of billions of dollars from public-market investors.
Selling liquid assets such as stocks or Bitcoin is one way investors could create that liquidity.
However, there is currently no evidence establishing that Anthropic’s IPO is the primary cause of Bitcoin’s decline. Bitcoin is simultaneously dealing with bearish technical momentum, broader risk-asset weakness and the loss of several important support levels.
The Crypto Basic recently noted that Bitcoin remains below its falling 20-day and 50-day exponential moving averages, while another analysis identified $73,000 as a key support region before a possible deeper decline toward $60,000.
Cowen has also maintained throughout 2026 that Bitcoin is operating within a bear-market structure.
Nov. 19 Becomes an Interesting Bitcoin Test
The comparison now creates a clear date to watch.
If Bitcoin continues weakening into Anthropic’s expected Nov. 19 debut and subsequently stabilizes once the IPO is completed, the capital-rotation argument would gain additional circumstantial support.
A continued decline well beyond the IPO, however, would strengthen the case that broader crypto and macro conditions—not a single stock offering—remain the dominant forces.
For now, Bitcoin’s pre-Anthropic trajectory is moving in the same direction as its pre-SpaceX performance, but with a smaller normalized loss.
#CryptoNewsFlash
Bitcoin’s latest decline may have an unusual source of pressure: investors raising cash ahead of Anthropic’s potentially massive initial public offering.
Into The Cryptoverse founder Benjamin Cowen raised the possibility as Bitcoin trades around $73,500, saying major IPOs can encourage investors to free up capital that would otherwise remain deployed across assets such as Bitcoin. CoinMarketCap currently places BTC near $73,503.
He pointed to Bitcoin’s performance surrounding the SpaceX IPO earlier this year, adding that investors “will often try to free up capital for major IPOs.”
Bitcoin Fell About 20% Into the SpaceX IPO
Bitcoin’s performance around the SpaceX listing provides the basis for the comparison.
Using the BTC price 30 days before each IPO as the 0% starting point, Bitcoin initially remained close to flat before beginning a sustained decline ahead of SpaceX’s debut.
By the time SpaceX went public on June 12, 2026, Bitcoin’s normalized return had fallen to roughly -20% from the 30-day starting point.
SpaceX officially began trading on Nasdaq under the ticker SPCX on June 12, after pricing its IPO at $135 per share. The base offering involved 555.56 million shares, equivalent to approximately $75 billion before the underwriters’ additional allocation.
Bitcoin closed that day near $63,543, according to historical CoinMarketCap data.
The decline did not immediately end when the IPO arrived. Bitcoin briefly recovered after the listing before its normalized return deteriorated toward approximately -26% around 18 days after the IPO. It subsequently recovered part of those losses and finished the 30-day post-IPO window around 19% below the original baseline.
Anthropic Setup Is Starting to Resemble the Same Pattern
The Anthropic comparison currently begins 30 days ahead of an assumed Nov. 19 listing date.
That date is now more than a hypothetical reference. Anthropic officially launched its IPO roadshow on Nov. 10, offering 825 million Class A shares at an expected price of $70 to $78 per share. The company has applied to trade on Nasdaq under the ticker ANT.
Reuters reports that trading is expected to begin on Nov. 19, with the offering potentially raising as much as $64.4 billion and valuing Anthropic at up to roughly $1.4 trillion on a fully diluted basis.
Bitcoin is currently roughly 11% below the normalized level from 30 days before the expected Anthropic listing.
The decline is therefore heading in the same broad direction as the SpaceX period, although Bitcoin had already fallen considerably more at a comparable stage of the SpaceX setup.
Why a Massive IPO Could Pressure Bitcoin
The mechanism Cowen is highlighting is capital competition.
Large institutional and wealthy investors typically operate with finite capital. Ahead of an unusually large IPO, some may increase cash balances, reduce other holdings or rebalance portfolios to participate in the offering.
Anthropic’s proposed deal is large enough for that possibility to matter. At the upper end of its price range, the Claude developer could raise tens of billions of dollars from public-market investors.
Selling liquid assets such as stocks or Bitcoin is one way investors could create that liquidity.
However, there is currently no evidence establishing that Anthropic’s IPO is the primary cause of Bitcoin’s decline. Bitcoin is simultaneously dealing with bearish technical momentum, broader risk-asset weakness and the loss of several important support levels.
The Crypto Basic recently noted that Bitcoin remains below its falling 20-day and 50-day exponential moving averages, while another analysis identified $73,000 as a key support region before a possible deeper decline toward $60,000.
Cowen has also maintained throughout 2026 that Bitcoin is operating within a bear-market structure.
Nov. 19 Becomes an Interesting Bitcoin Test
The comparison now creates a clear date to watch.
If Bitcoin continues weakening into Anthropic’s expected Nov. 19 debut and subsequently stabilizes once the IPO is completed, the capital-rotation argument would gain additional circumstantial support.
A continued decline well beyond the IPO, however, would strengthen the case that broader crypto and macro conditions—not a single stock offering—remain the dominant forces.
For now, Bitcoin’s pre-Anthropic trajectory is moving in the same direction as its pre-SpaceX performance, but with a smaller normalized loss.
#CryptoNewsFlash
76
XRP’s largest holders have increased their balances by approximately 65.32 million XRP over four days, even as price continues falling toward the psychological $1 level.
The accumulated tokens were worth nearly $72 million at prices prevailing during the accumulation period, according to Santiment-derived data.
Large-holder balances initially declined before reversing sharply over the final days of the period and returning to around the 4 billion XRP region. The 65.32 million XRP increase has also been independently reported from the Santiment data.
The accumulation has yet to translate into a price recovery. CoinMarketCap currently places XRP around $1.05, down 3.74% over 24 hours, with price trading between approximately $1.04 and $1.10. At the current price, the 65.32 million XRP accumulated would be worth roughly $68.6 million.
XRP Whales Buy Into the Decline
The latest increase extends a broader period of accumulation among large XRP holders.
Earlier this month, large XRP holders added 770 million tokens following the Binance hack, while the number of wallets holding at least 1 million XRP climbed to a 2026 high of 2,147.
A separate large transfer also saw a new whale wallet receive more than 140 million XRP as price declined.
Together, the figures show that some large holders have continued increasing exposure during the selloff rather than waiting for a confirmed market recovery.
However, rising whale balances do not prove that XRP has established a bottom. Wallet-level data can show an increase in holdings but does not establish the identity, motivation or future behavior of those entities.
#CryptoNewsCommunity
XRP’s largest holders have increased their balances by approximately 65.32 million XRP over four days, even as price continues falling toward the psychological $1 level.
The accumulated tokens were worth nearly $72 million at prices prevailing during the accumulation period, according to Santiment-derived data.
Large-holder balances initially declined before reversing sharply over the final days of the period and returning to around the 4 billion XRP region. The 65.32 million XRP increase has also been independently reported from the Santiment data.
The accumulation has yet to translate into a price recovery. CoinMarketCap currently places XRP around $1.05, down 3.74% over 24 hours, with price trading between approximately $1.04 and $1.10. At the current price, the 65.32 million XRP accumulated would be worth roughly $68.6 million.
XRP Whales Buy Into the Decline
The latest increase extends a broader period of accumulation among large XRP holders.
Earlier this month, large XRP holders added 770 million tokens following the Binance hack, while the number of wallets holding at least 1 million XRP climbed to a 2026 high of 2,147.
A separate large transfer also saw a new whale wallet receive more than 140 million XRP as price declined.
Together, the figures show that some large holders have continued increasing exposure during the selloff rather than waiting for a confirmed market recovery.
However, rising whale balances do not prove that XRP has established a bottom. Wallet-level data can show an increase in holdings but does not establish the identity, motivation or future behavior of those entities.
#CryptoNewsCommunity
The accumulated tokens were worth nearly $72 million at prices prevailing during the accumulation period, according to Santiment-derived data.
Large-holder balances initially declined before reversing sharply over the final days of the period and returning to around the 4 billion XRP region. The 65.32 million XRP increase has also been independently reported from the Santiment data.
The accumulation has yet to translate into a price recovery. CoinMarketCap currently places XRP around $1.05, down 3.74% over 24 hours, with price trading between approximately $1.04 and $1.10. At the current price, the 65.32 million XRP accumulated would be worth roughly $68.6 million.
XRP Whales Buy Into the Decline
The latest increase extends a broader period of accumulation among large XRP holders.
Earlier this month, large XRP holders added 770 million tokens following the Binance hack, while the number of wallets holding at least 1 million XRP climbed to a 2026 high of 2,147.
A separate large transfer also saw a new whale wallet receive more than 140 million XRP as price declined.
Together, the figures show that some large holders have continued increasing exposure during the selloff rather than waiting for a confirmed market recovery.
However, rising whale balances do not prove that XRP has established a bottom. Wallet-level data can show an increase in holdings but does not establish the identity, motivation or future behavior of those entities.
#CryptoNewsCommunity
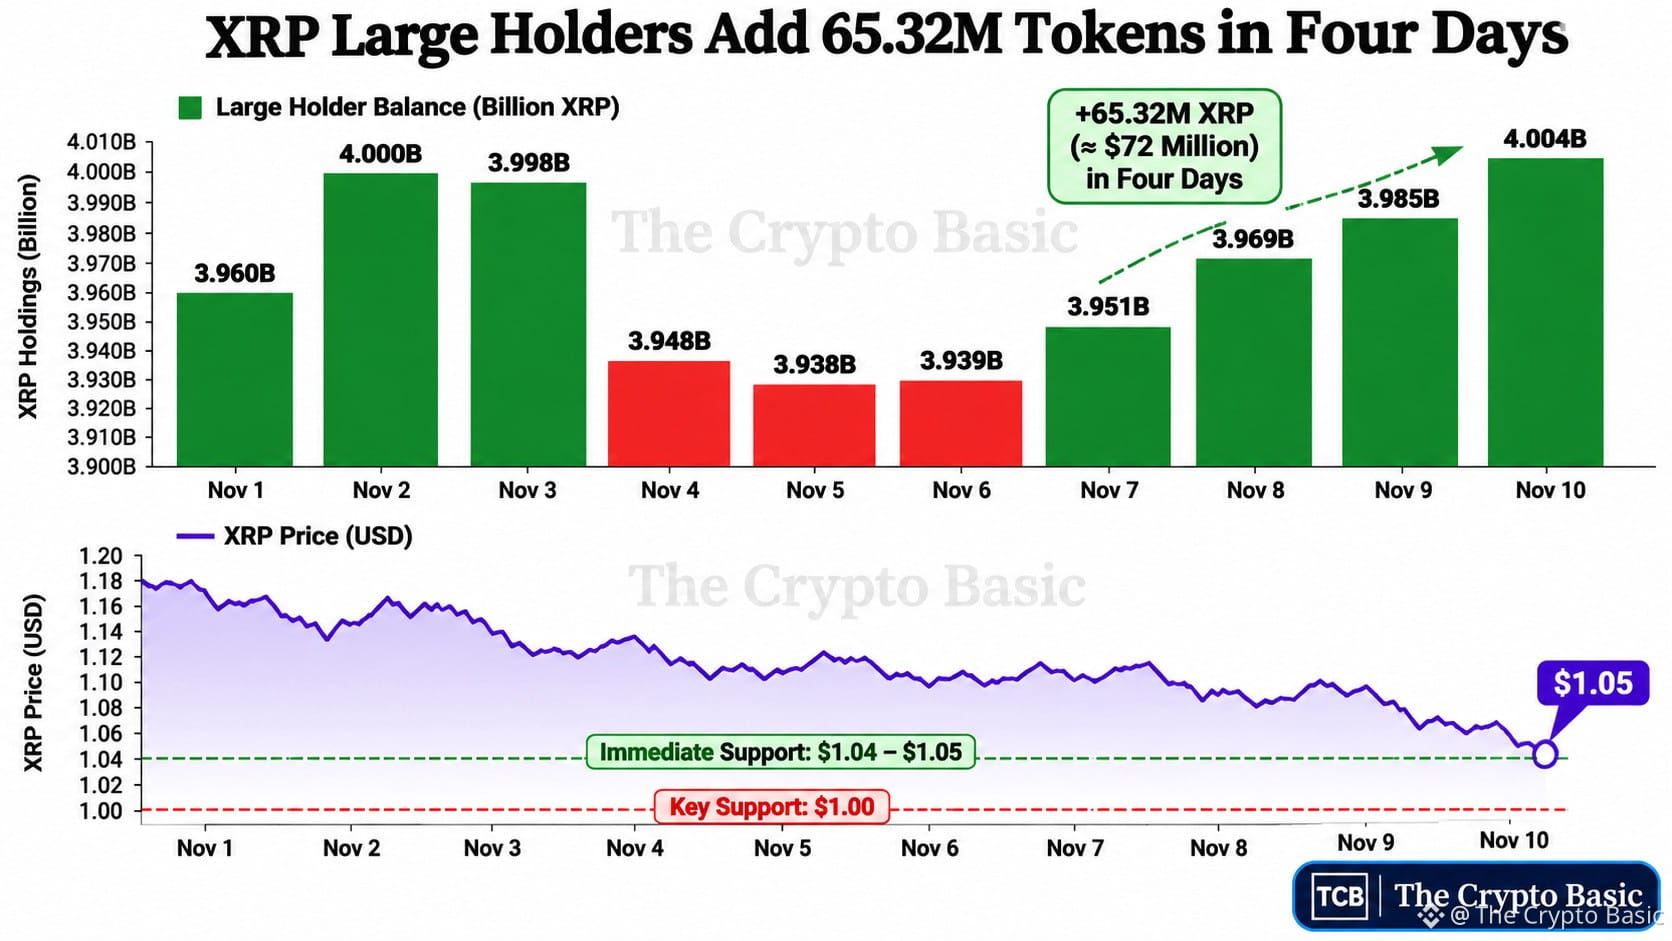
1
397
David Schwartz: “I haven't bought $XRP
in a long time.”
The former #Ripple CTO says he:
• Sold ~2.5M XRP in 2025
• Paid ~$1.7M in capital gains tax
• Uses XRP sales plans set at least 30 days in advance
• Has cut holdings from ~26M XRP to ~3M
• Still owns “quite a bit” of Ripple stock
Schwartz says the strategy reflects his strong aversion to risk—not just his view of XRP.
#CryptoNewss
David Schwartz: “I haven't bought $XRP
in a long time.”
The former #Ripple CTO says he:
• Sold ~2.5M XRP in 2025
• Paid ~$1.7M in capital gains tax
• Uses XRP sales plans set at least 30 days in advance
• Has cut holdings from ~26M XRP to ~3M
• Still owns “quite a bit” of Ripple stock
Schwartz says the strategy reflects his strong aversion to risk—not just his view of XRP.
#CryptoNewss
in a long time.”
The former #Ripple CTO says he:
• Sold ~2.5M XRP in 2025
• Paid ~$1.7M in capital gains tax
• Uses XRP sales plans set at least 30 days in advance
• Has cut holdings from ~26M XRP to ~3M
• Still owns “quite a bit” of Ripple stock
Schwartz says the strategy reflects his strong aversion to risk—not just his view of XRP.
#CryptoNewss
200
Article
"Three Possible Reasons XRP Is Falling Deeper Than the Rest of the Market"The crypto market has faced weeks of selling pressure, but #XRP appears to have taken a much bigger hit than most major assets.
While Bitcoin (BTC), Ethereum (ETH), and Solana (SOL) have also recorded heavy losses, XRP has fallen much further, and this has led to questions about why it is struggling more than the rest of the market.
XRP Falling Deeper Than the Market
In a recent analysis, market expert EGRAG Crypto highlighted this trend. According to him, since Nov. 4, XRP has lost 23.4%, while Ethereum has declined by 18.2%, Solana by 17%, and Bitcoin by 10.4%.
At the time of reporting, XRP had fallen to around $1.06, bringing its weekly losses to 15.4% and its monthly decline to nearly 25%.
The continued selling has also pushed XRP below three major moving averages. The asset now trades below its 20-day moving average at $1.25, its 50-day moving average at $1.36, and its 200-day moving average at $1.27.
To explain why XRP is falling harder than other major cryptocurrencies, EGRAG presented three possible reasons, including leverage flush, selling from early holders, and market manipulation.
Leverage Flush (30%)
EGRAG gives the derivatives market a 30% chance of being behind XRP’s deeper losses. He mentioned forced closures of leveraged long positions and weak buying demand as factors that may be making the decline worse.
According to CoinGlass, exchanges liquidated nearly $39 million in leveraged XRP long positions on Nov. 8 alone. By comparison, short liquidations amounted to just $366,000. This means exchanges closed almost 33 times more long positions than short positions during the period.
When traders use borrowed funds to bet on higher prices, a sudden move in the opposite direction can leave them unable to meet their margin requirements. Exchanges then automatically close their positions, adding more sell orders to an already falling market. This pushes prices lower and triggers further liquidations.
However, the Nov. 8 liquidations may not have removed all the risk from the derivatives market. Considerable modeled long exposure remains below XRP’s current price, and this suggests that more leveraged positions could still face liquidation if the decline continues.
Early Holders Cashing Out (20%)
The second possible reason is selling by early XRP holders, which EGRAG assigns a 20% probability.
These investors bought XRP at much lower prices and may still be sitting on substantial gains despite the recent decline. Some could now be taking profits and moving their money into other assets.
Unlike forced liquidations, which can cause sudden price drops, selling by long-term holders may happen gradually. Investors with large holdings could distribute their tokens over time without attracting much attention. However, their continued selling still adds pressure to the market.
Manipulation (50%)
EGRAG gives market manipulation the highest probability at 50%, and this makes it his leading explanation for XRP’s underperformance.
He believes large market participants could be targeting liquidity to force smaller investors out of their positions before the price finds a bottom.
Data from CryptoQuant shows that large whale transactions in XRP’s spot and futures markets currently lean toward selling. This indicates growing selling pressure among major market participants and adds to the concerns surrounding XRP’s current market position.
On-chain analysts have also flagged unusual whale activity linked to sharp changes in liquidity across major exchanges. Large holders have reportedly moved billions of XRP, potentially influencing price movements and taking advantage of areas where market liquidity is weak during important trading sessions.
EGRAG believes these moves could be part of an attempt to scare retail investors into selling their holdings at lower prices before larger players begin accumulating.
If large holders are absorbing the available supply, it could point to a possible stabilization or price reversal. But if they are selling alongside other market participants, XRP could face further losses.
XRP Price Levels to Watch
EGRAG mentioned the $1.00-$1.04 range as an important area where XRP needs to find support. Buyers must defend this zone to prevent a deeper decline. If the price begins to recover, bulls will first need to push XRP above $1.15 before attempting to reclaim $1.25.
If selling continues, the next major support level sits near $0.99. This is particularly important because it represents XRP’s lowest closing price in more than a year.
Institutional demand could also play a role in determining whether XRP recovers. A return of inflows into spot XRP ETFs may provide additional buying support.
#CryptoNews🚀🔥V
"Three Possible Reasons XRP Is Falling Deeper Than the Rest of the Market"
The crypto market has faced weeks of selling pressure, but #XRP appears to have taken a much bigger hit than most major assets.
While Bitcoin (BTC), Ethereum (ETH), and Solana (SOL) have also recorded heavy losses, XRP has fallen much further, and this has led to questions about why it is struggling more than the rest of the market.
XRP Falling Deeper Than the Market
In a recent analysis, market expert EGRAG Crypto highlighted this trend. According to him, since Nov. 4, XRP has lost 23.4%, while Ethereum has declined by 18.2%, Solana by 17%, and Bitcoin by 10.4%.
At the time of reporting, XRP had fallen to around $1.06, bringing its weekly losses to 15.4% and its monthly decline to nearly 25%.
The continued selling has also pushed XRP below three major moving averages. The asset now trades below its 20-day moving average at $1.25, its 50-day moving average at $1.36, and its 200-day moving average at $1.27.
To explain why XRP is falling harder than other major cryptocurrencies, EGRAG presented three possible reasons, including leverage flush, selling from early holders, and market manipulation.
Leverage Flush (30%)
EGRAG gives the derivatives market a 30% chance of being behind XRP’s deeper losses. He mentioned forced closures of leveraged long positions and weak buying demand as factors that may be making the decline worse.
According to CoinGlass, exchanges liquidated nearly $39 million in leveraged XRP long positions on Nov. 8 alone. By comparison, short liquidations amounted to just $366,000. This means exchanges closed almost 33 times more long positions than short positions during the period.
When traders use borrowed funds to bet on higher prices, a sudden move in the opposite direction can leave them unable to meet their margin requirements. Exchanges then automatically close their positions, adding more sell orders to an already falling market. This pushes prices lower and triggers further liquidations.
However, the Nov. 8 liquidations may not have removed all the risk from the derivatives market. Considerable modeled long exposure remains below XRP’s current price, and this suggests that more leveraged positions could still face liquidation if the decline continues.
Early Holders Cashing Out (20%)
The second possible reason is selling by early XRP holders, which EGRAG assigns a 20% probability.
These investors bought XRP at much lower prices and may still be sitting on substantial gains despite the recent decline. Some could now be taking profits and moving their money into other assets.
Unlike forced liquidations, which can cause sudden price drops, selling by long-term holders may happen gradually. Investors with large holdings could distribute their tokens over time without attracting much attention. However, their continued selling still adds pressure to the market.
Manipulation (50%)
EGRAG gives market manipulation the highest probability at 50%, and this makes it his leading explanation for XRP’s underperformance.
He believes large market participants could be targeting liquidity to force smaller investors out of their positions before the price finds a bottom.
Data from CryptoQuant shows that large whale transactions in XRP’s spot and futures markets currently lean toward selling. This indicates growing selling pressure among major market participants and adds to the concerns surrounding XRP’s current market position.
On-chain analysts have also flagged unusual whale activity linked to sharp changes in liquidity across major exchanges. Large holders have reportedly moved billions of XRP, potentially influencing price movements and taking advantage of areas where market liquidity is weak during important trading sessions.
EGRAG believes these moves could be part of an attempt to scare retail investors into selling their holdings at lower prices before larger players begin accumulating.
If large holders are absorbing the available supply, it could point to a possible stabilization or price reversal. But if they are selling alongside other market participants, XRP could face further losses.
XRP Price Levels to Watch
EGRAG mentioned the $1.00-$1.04 range as an important area where XRP needs to find support. Buyers must defend this zone to prevent a deeper decline. If the price begins to recover, bulls will first need to push XRP above $1.15 before attempting to reclaim $1.25.
If selling continues, the next major support level sits near $0.99. This is particularly important because it represents XRP’s lowest closing price in more than a year.
Institutional demand could also play a role in determining whether XRP recovers. A return of inflows into spot XRP ETFs may provide additional buying support.
#CryptoNews🚀🔥V
While Bitcoin (BTC), Ethereum (ETH), and Solana (SOL) have also recorded heavy losses, XRP has fallen much further, and this has led to questions about why it is struggling more than the rest of the market.
XRP Falling Deeper Than the Market
In a recent analysis, market expert EGRAG Crypto highlighted this trend. According to him, since Nov. 4, XRP has lost 23.4%, while Ethereum has declined by 18.2%, Solana by 17%, and Bitcoin by 10.4%.
At the time of reporting, XRP had fallen to around $1.06, bringing its weekly losses to 15.4% and its monthly decline to nearly 25%.
The continued selling has also pushed XRP below three major moving averages. The asset now trades below its 20-day moving average at $1.25, its 50-day moving average at $1.36, and its 200-day moving average at $1.27.
To explain why XRP is falling harder than other major cryptocurrencies, EGRAG presented three possible reasons, including leverage flush, selling from early holders, and market manipulation.
Leverage Flush (30%)
EGRAG gives the derivatives market a 30% chance of being behind XRP’s deeper losses. He mentioned forced closures of leveraged long positions and weak buying demand as factors that may be making the decline worse.
According to CoinGlass, exchanges liquidated nearly $39 million in leveraged XRP long positions on Nov. 8 alone. By comparison, short liquidations amounted to just $366,000. This means exchanges closed almost 33 times more long positions than short positions during the period.
When traders use borrowed funds to bet on higher prices, a sudden move in the opposite direction can leave them unable to meet their margin requirements. Exchanges then automatically close their positions, adding more sell orders to an already falling market. This pushes prices lower and triggers further liquidations.
However, the Nov. 8 liquidations may not have removed all the risk from the derivatives market. Considerable modeled long exposure remains below XRP’s current price, and this suggests that more leveraged positions could still face liquidation if the decline continues.
Early Holders Cashing Out (20%)
The second possible reason is selling by early XRP holders, which EGRAG assigns a 20% probability.
These investors bought XRP at much lower prices and may still be sitting on substantial gains despite the recent decline. Some could now be taking profits and moving their money into other assets.
Unlike forced liquidations, which can cause sudden price drops, selling by long-term holders may happen gradually. Investors with large holdings could distribute their tokens over time without attracting much attention. However, their continued selling still adds pressure to the market.
Manipulation (50%)
EGRAG gives market manipulation the highest probability at 50%, and this makes it his leading explanation for XRP’s underperformance.
He believes large market participants could be targeting liquidity to force smaller investors out of their positions before the price finds a bottom.
Data from CryptoQuant shows that large whale transactions in XRP’s spot and futures markets currently lean toward selling. This indicates growing selling pressure among major market participants and adds to the concerns surrounding XRP’s current market position.
On-chain analysts have also flagged unusual whale activity linked to sharp changes in liquidity across major exchanges. Large holders have reportedly moved billions of XRP, potentially influencing price movements and taking advantage of areas where market liquidity is weak during important trading sessions.
EGRAG believes these moves could be part of an attempt to scare retail investors into selling their holdings at lower prices before larger players begin accumulating.
If large holders are absorbing the available supply, it could point to a possible stabilization or price reversal. But if they are selling alongside other market participants, XRP could face further losses.
XRP Price Levels to Watch
EGRAG mentioned the $1.00-$1.04 range as an important area where XRP needs to find support. Buyers must defend this zone to prevent a deeper decline. If the price begins to recover, bulls will first need to push XRP above $1.15 before attempting to reclaim $1.25.
If selling continues, the next major support level sits near $0.99. This is particularly important because it represents XRP’s lowest closing price in more than a year.
Institutional demand could also play a role in determining whether XRP recovers. A return of inflows into spot XRP ETFs may provide additional buying support.
#CryptoNews🚀🔥V
364
Log in to explore more content
Join global crypto users on Binance Square
⚡️ Get latest and useful information about crypto.
💬 Trusted by the world’s largest crypto exchange.
👍 Discover real insights from verified creators.
Email / Phone number
Trending Topics
WhoWillSucceedJensenHuangatNvidia?
81,433 views
1,115 Discussing
Nvidia Says No CEO Talks Underway as "Stand With Jensen" Petition Tops 77,900 Signatures
Binance News
·27 Likes
·35.6k views
WhatWillDriveCryptoandStocks’NextRebound?
431,655 views
3,015 Discussing
BitcoinActiveSupplyInProfitDropsBelow45%
21,738 views
336 Discussing