
Crypto Cap1ain
399 Posts

Crypto Cap1ain
Report
Block User
Let's put a smile on your face.

GRAM Holder
Frequent Trader
5.1 Years
5 Following
1.6K+ Followers
1.8K+ Liked
Posts
All
Quotes
Videos
·
--
Bearish
$BTC
{spot}(BTCUSDT)
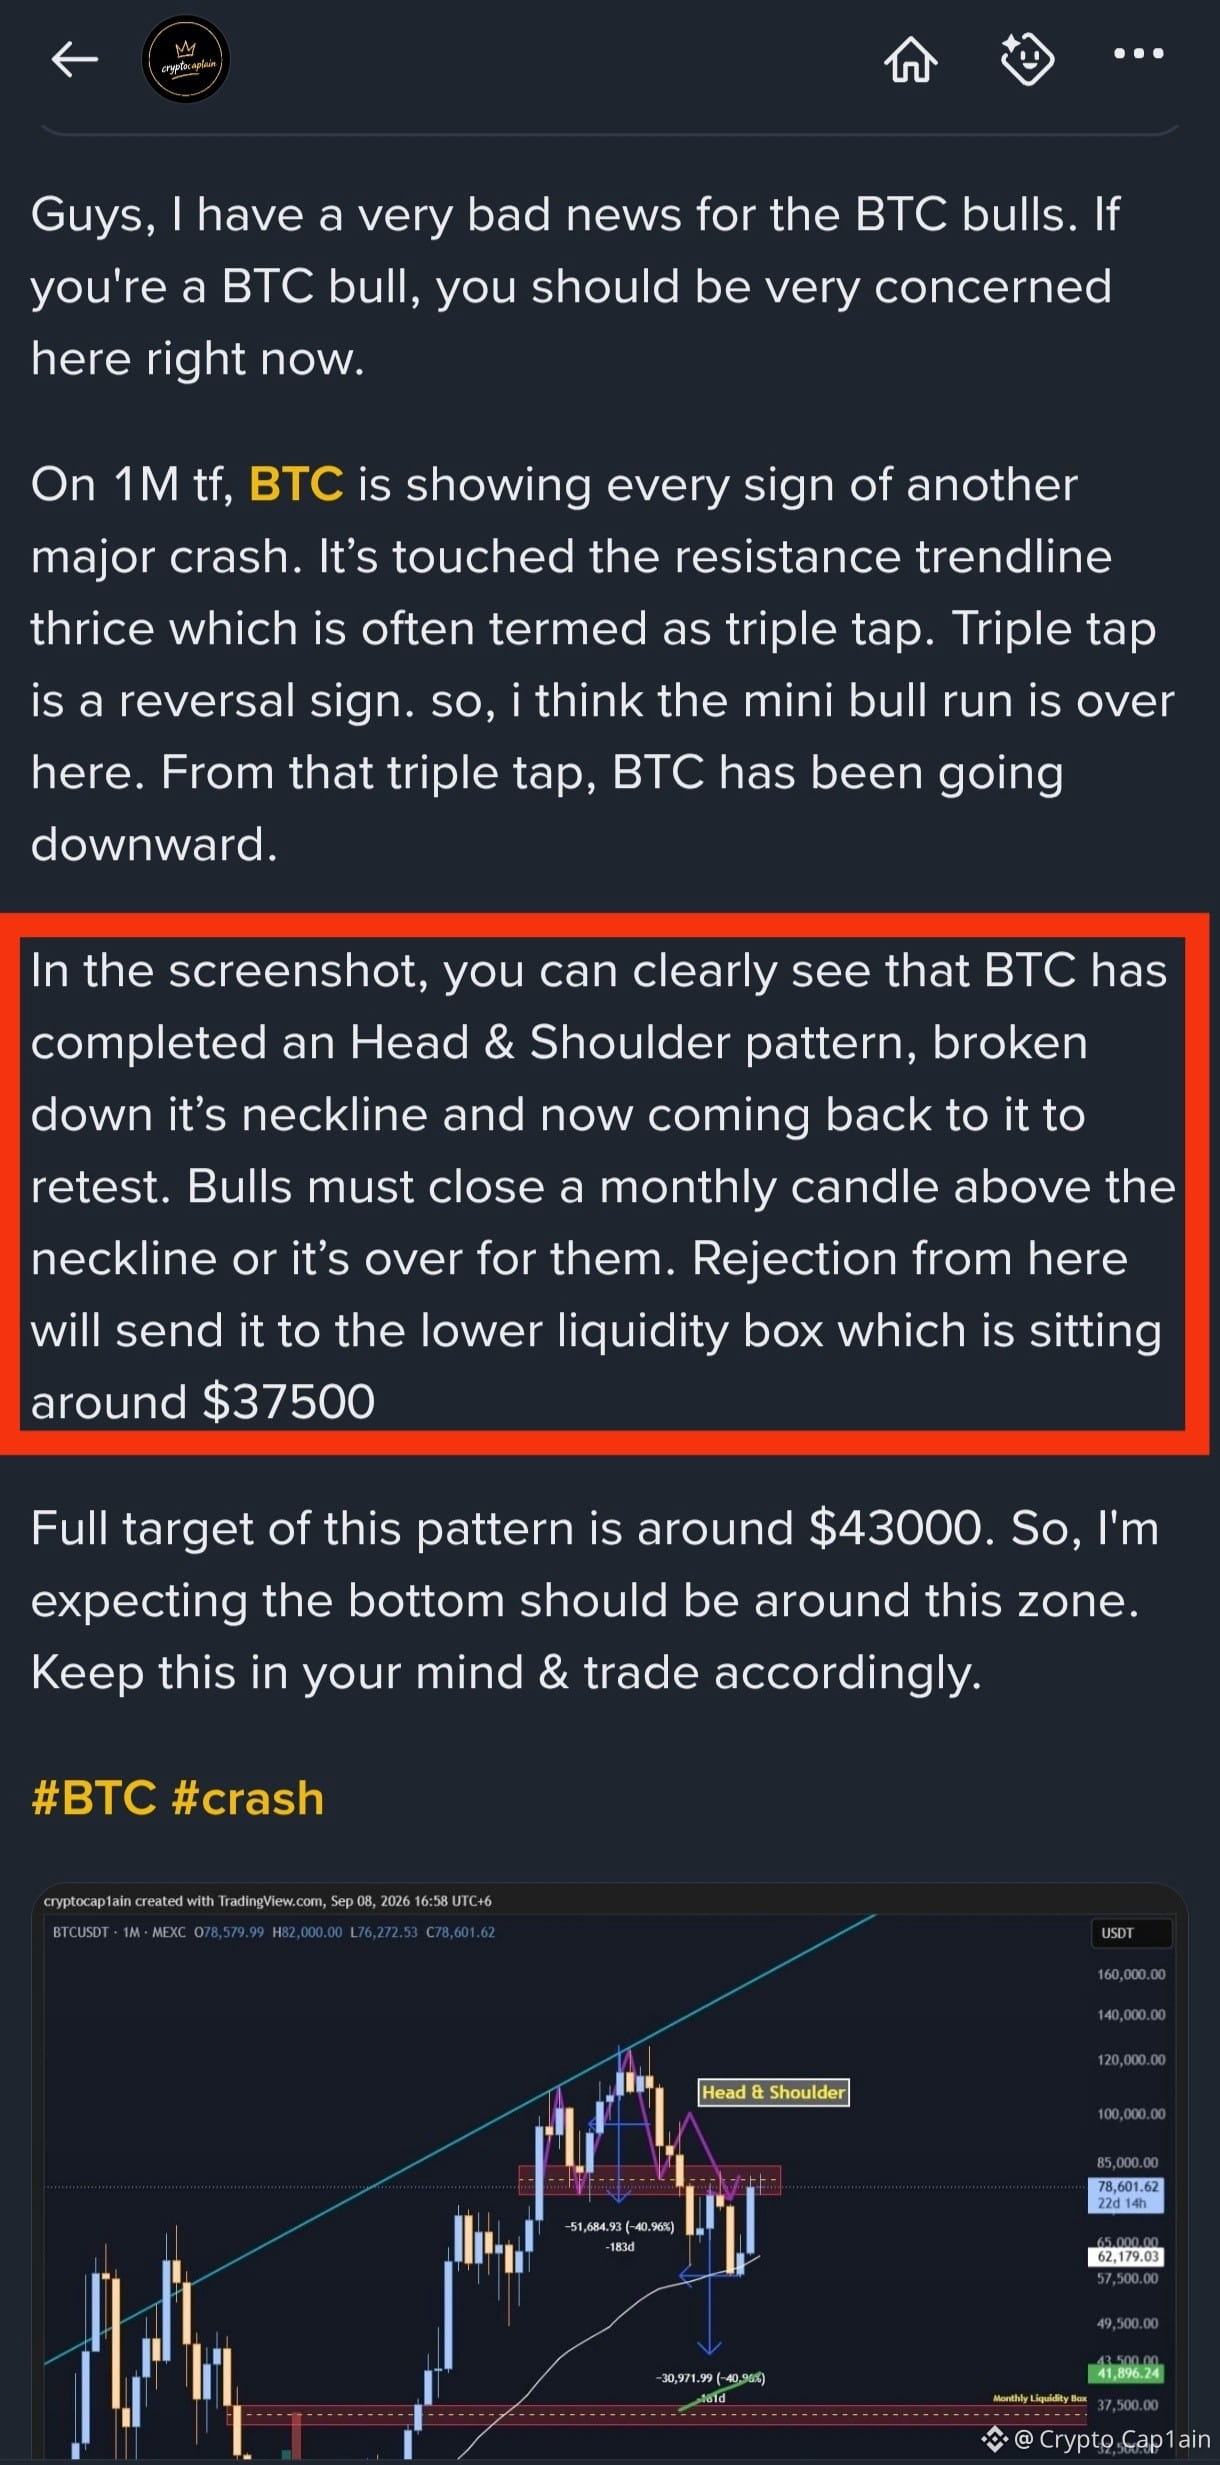
On 8th September, I posted BTC chart (check 1st screenshot) showing you guys that it is on the bearish retest of the Head and Shoulder pattern. Fast forward 2months later, BTC is rejected badly and is now down 20%. What’s next?
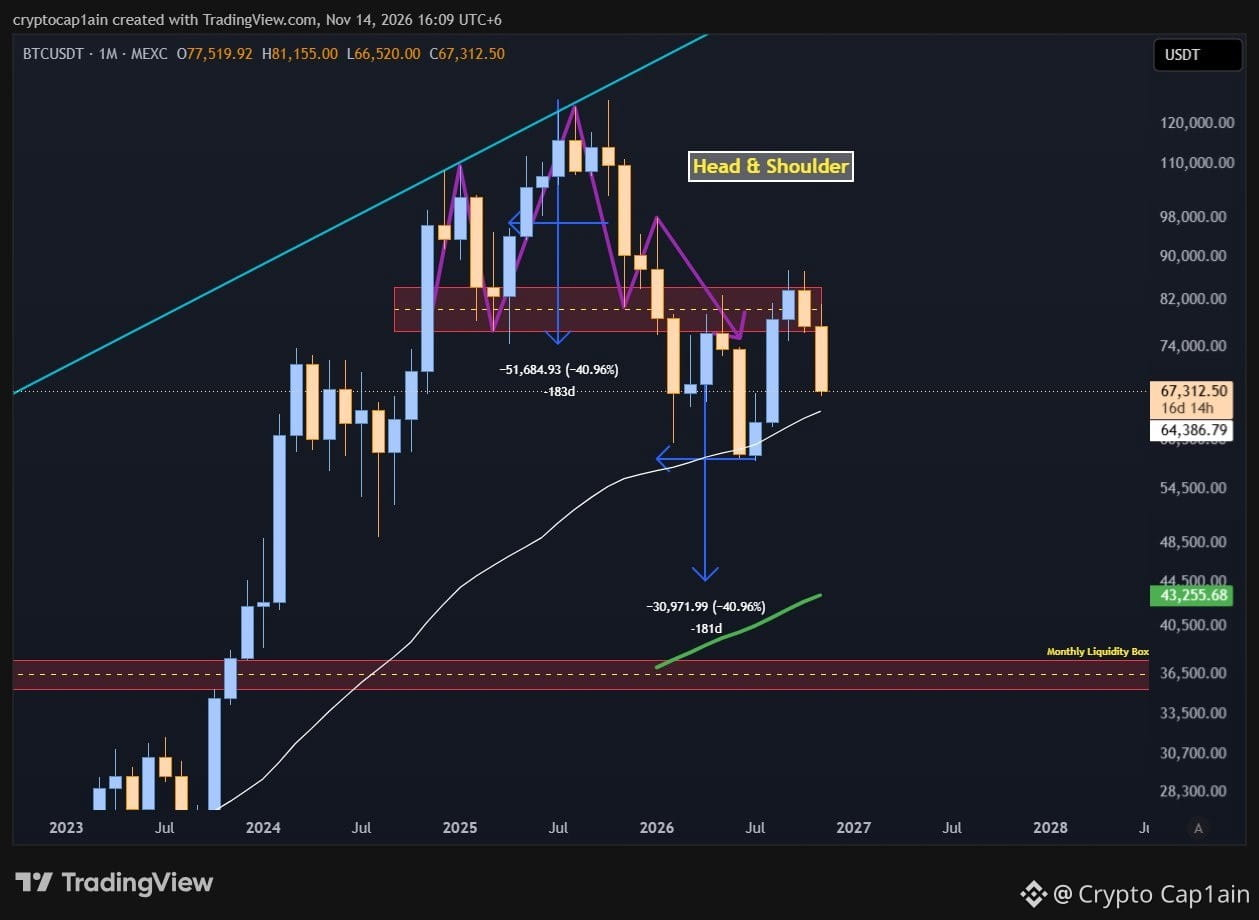
On 1M tf, BTC is close to test the 1M 50MA (check 2nd screenshot) as a support for the second time. Take this as a support and bounce. Otherwise, we are doomed.
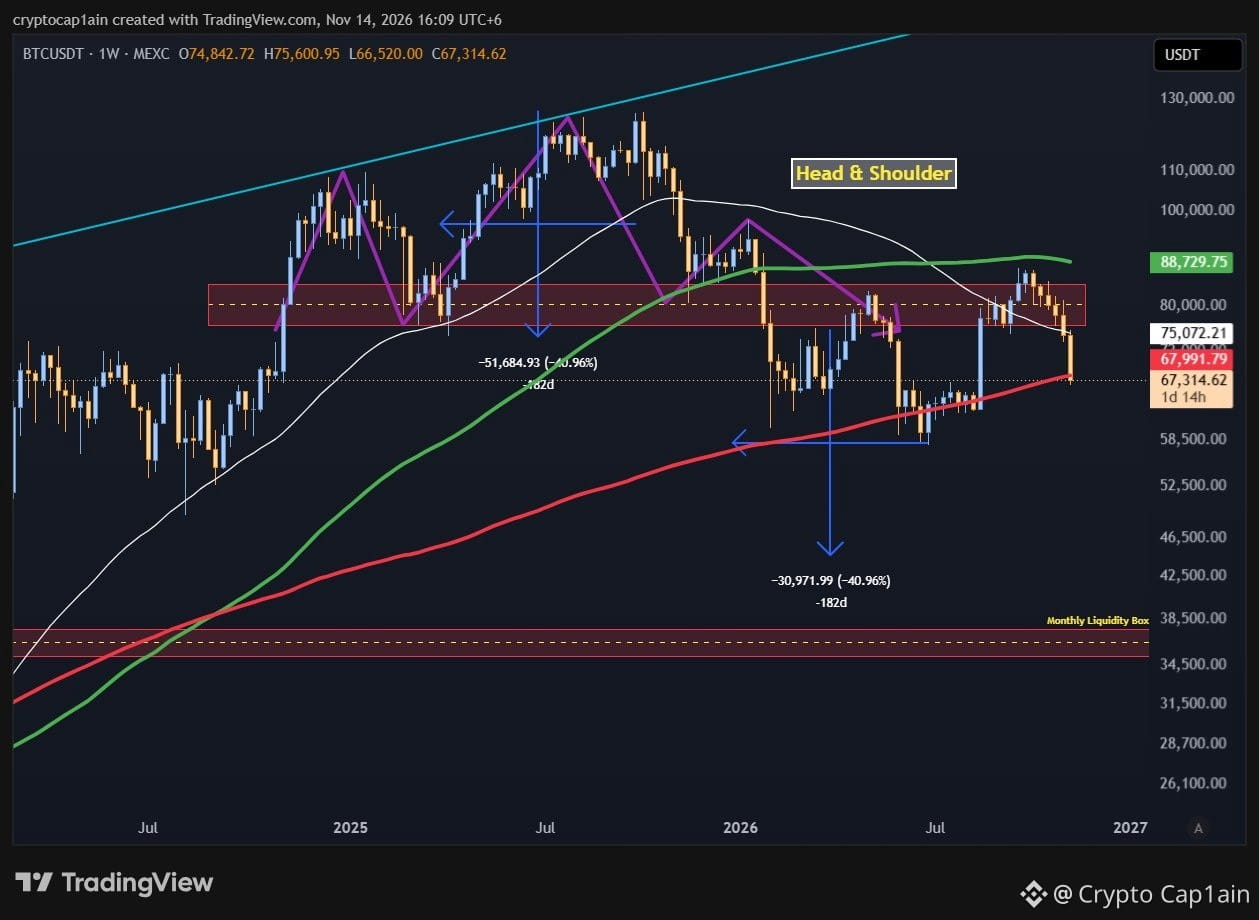
On 1W tf, BTC rejected badly from the 1W 100MA (check 3rd screenshot) and is now broken the 1W 200MA. Weekly closing below this candle will be bearish until proven otherwise.
The neckline retest of the Head and Shoulder is completed. Any bounce from here will be a sell signal. BTC is highly bearish here. Below $45k is coming for BTC.
#BTC #bearish
$BTC
On 8th September, I posted BTC chart (check 1st screenshot) showing you guys that it is on the bearish retest of the Head and Shoulder pattern. Fast forward 2months later, BTC is rejected badly and is now down 20%. What’s next?
On 1M tf, BTC is close to test the 1M 50MA (check 2nd screenshot) as a support for the second time. Take this as a support and bounce. Otherwise, we are doomed.
On 1W tf, BTC rejected badly from the 1W 100MA (check 3rd screenshot) and is now broken the 1W 200MA. Weekly closing below this candle will be bearish until proven otherwise.
The neckline retest of the Head and Shoulder is completed. Any bounce from here will be a sell signal. BTC is highly bearish here. Below $45k is coming for BTC.
#BTC #bearish
On 8th September, I posted BTC chart (check 1st screenshot) showing you guys that it is on the bearish retest of the Head and Shoulder pattern. Fast forward 2months later, BTC is rejected badly and is now down 20%. What’s next?
On 1M tf, BTC is close to test the 1M 50MA (check 2nd screenshot) as a support for the second time. Take this as a support and bounce. Otherwise, we are doomed.
On 1W tf, BTC rejected badly from the 1W 100MA (check 3rd screenshot) and is now broken the 1W 200MA. Weekly closing below this candle will be bearish until proven otherwise.
The neckline retest of the Head and Shoulder is completed. Any bounce from here will be a sell signal. BTC is highly bearish here. Below $45k is coming for BTC.
#BTC #bearish
1
258
$BTCDOM
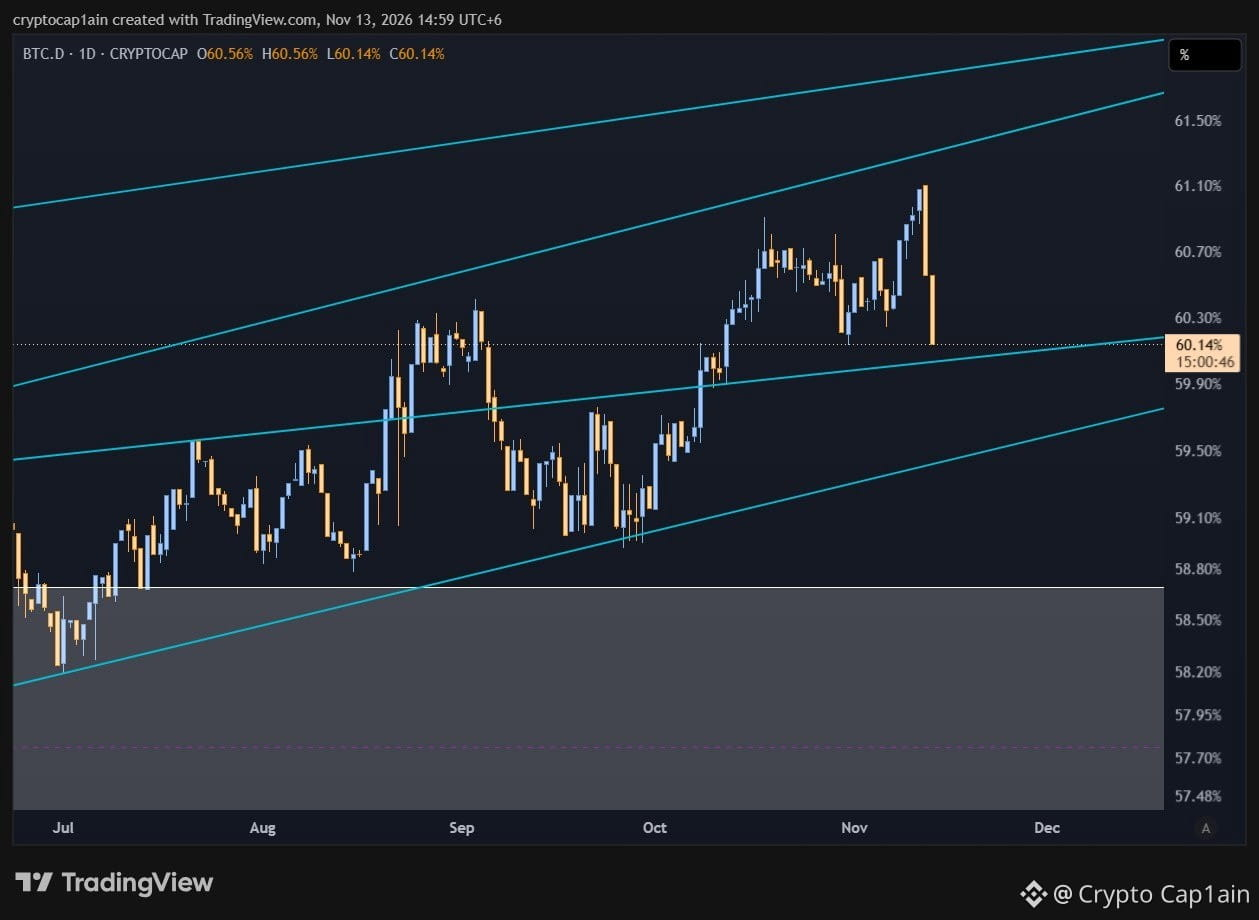
BTC is down 20% in a week but alts are not that much down comparing to BTC. It is because of this chart known as BTC Dominance.
BTC Dominance has hit the resistance trendline and got rejected badly from it. It is now in a trendline support. Bounce from it and that will be bad for the alts. Break this support and alts will show strength against BTC.
Let us see what happens next.
#BTC #dominance
$BTCDOM
BTC is down 20% in a week but alts are not that much down comparing to BTC. It is because of this chart known as BTC Dominance.
BTC Dominance has hit the resistance trendline and got rejected badly from it. It is now in a trendline support. Bounce from it and that will be bad for the alts. Break this support and alts will show strength against BTC.
Let us see what happens next.
#BTC #dominance
BTC is down 20% in a week but alts are not that much down comparing to BTC. It is because of this chart known as BTC Dominance.
BTC Dominance has hit the resistance trendline and got rejected badly from it. It is now in a trendline support. Bounce from it and that will be bad for the alts. Break this support and alts will show strength against BTC.
Let us see what happens next.
#BTC #dominance
1
520
$XRP
{spot}(XRPUSDT)
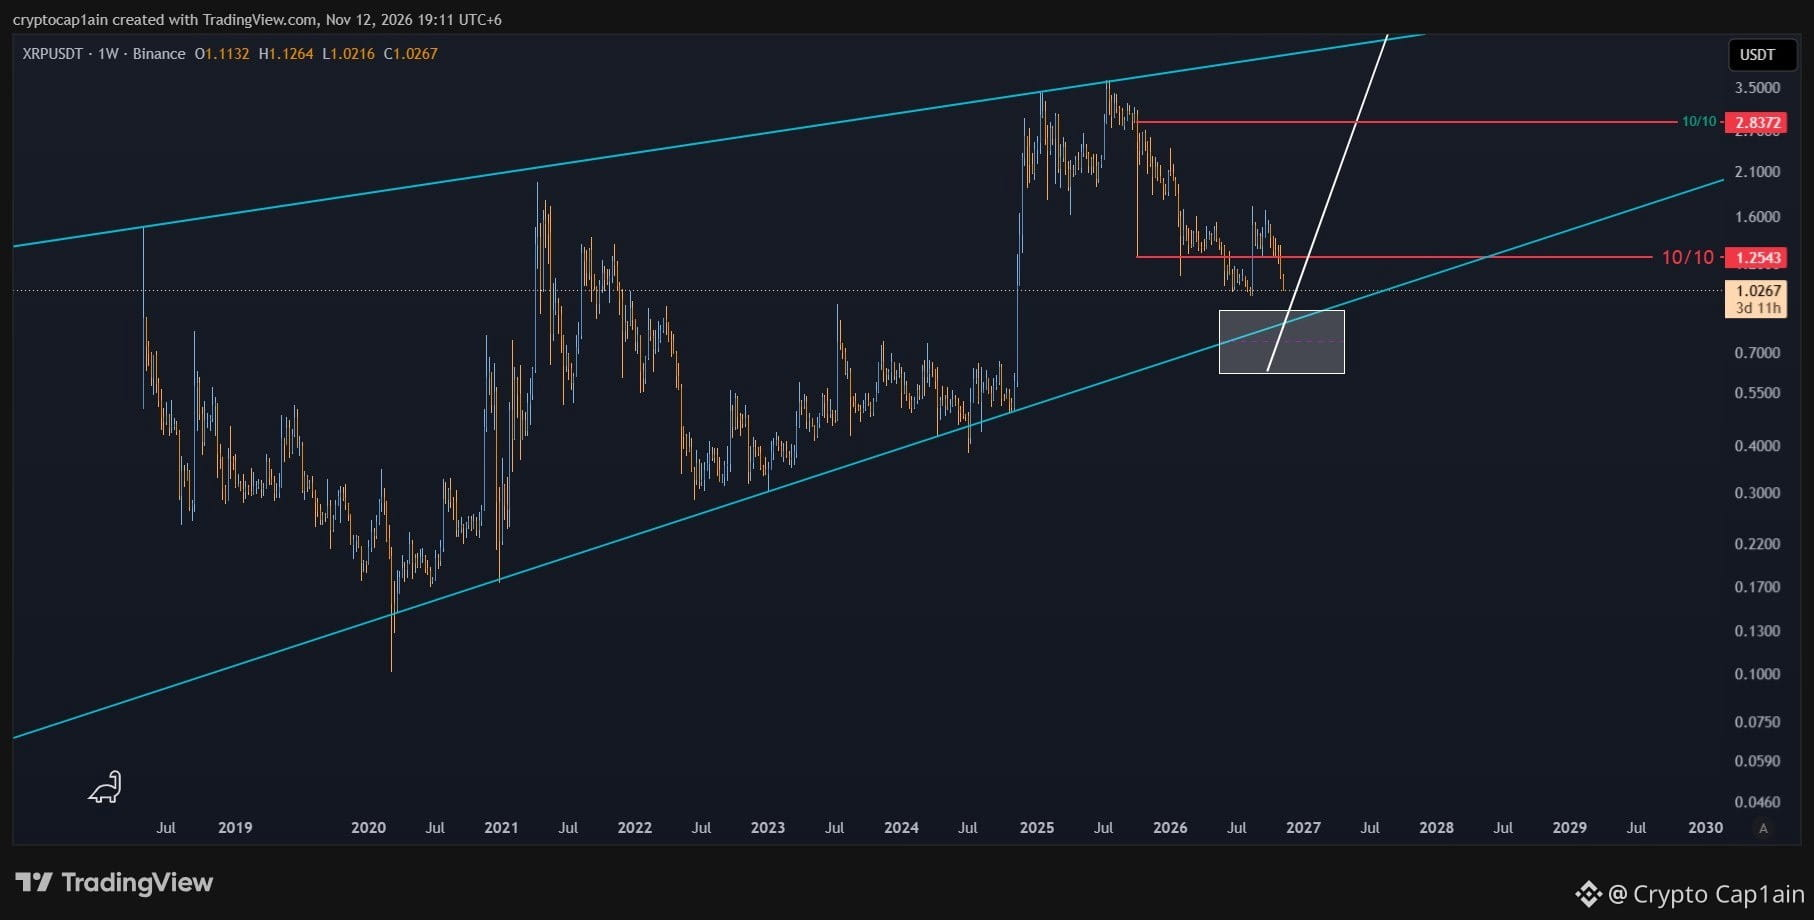
XRP has been trading inside a big falling wedge pattern.
This year it made a double top pattern hitting the resistance of this pattern. It's been in a bear market since then. I think the bear market for XRP is finally coming to an end. I have put fibonacci tool and drawn the white box for you all. That box should be your accumulation zone. Target will be the top of the pattern.
The strategy is simple. Buy inside the white box and sell in the top of the trendline.
#xrp #Ripple
$XRP
XRP has been trading inside a big falling wedge pattern.
This year it made a double top pattern hitting the resistance of this pattern. It's been in a bear market since then. I think the bear market for XRP is finally coming to an end. I have put fibonacci tool and drawn the white box for you all. That box should be your accumulation zone. Target will be the top of the pattern.
The strategy is simple. Buy inside the white box and sell in the top of the trendline.
#xrp #Ripple
XRP has been trading inside a big falling wedge pattern.
This year it made a double top pattern hitting the resistance of this pattern. It's been in a bear market since then. I think the bear market for XRP is finally coming to an end. I have put fibonacci tool and drawn the white box for you all. That box should be your accumulation zone. Target will be the top of the pattern.
The strategy is simple. Buy inside the white box and sell in the top of the trendline.
#xrp #Ripple
5
2.3k
·
--
Bearish
$ZEC
{spot}(ZECUSDT)
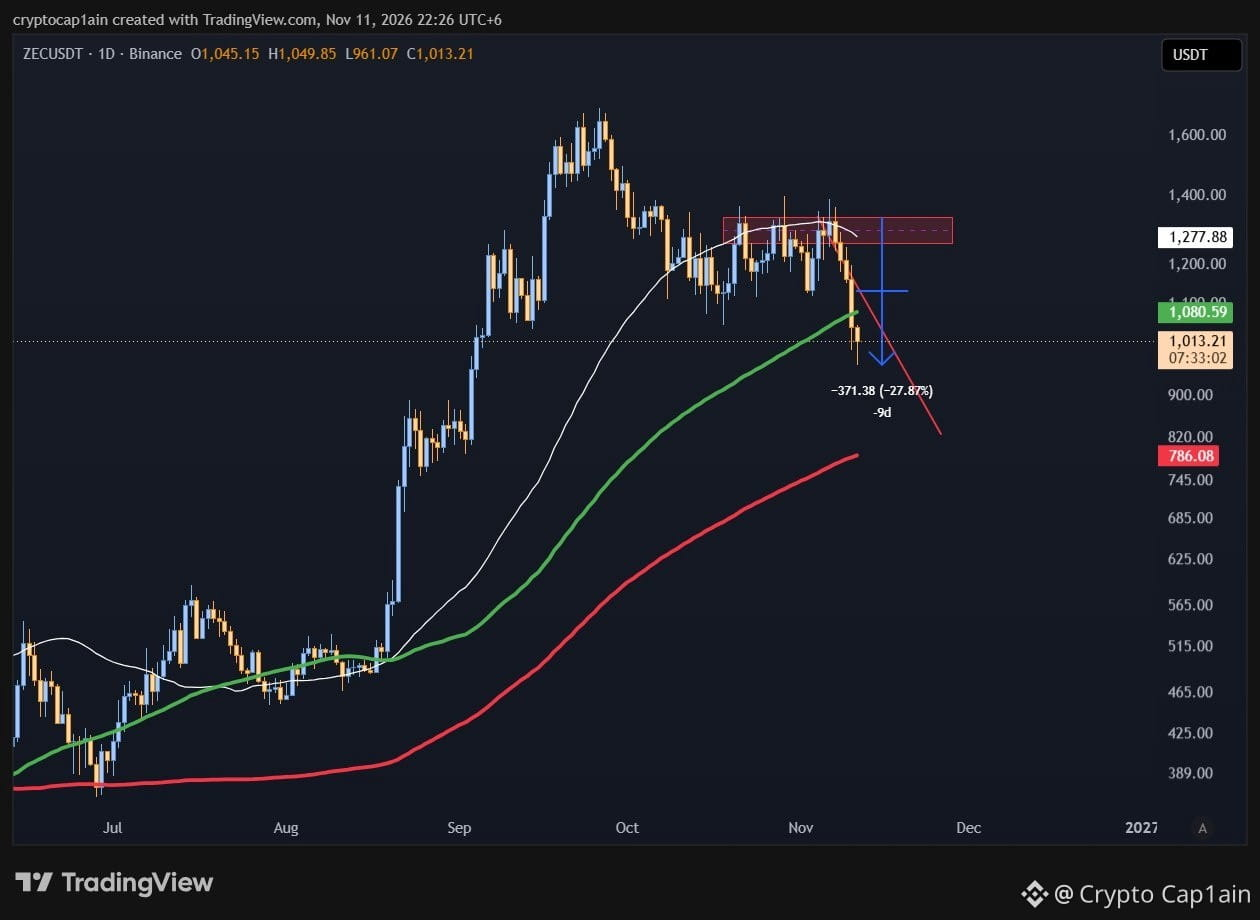
Guys, did I give you warning or not? I clearly told you that a massive crash is incoming on ZEC and look what happened. ZEC is down 27% since then.
ZEC has completely broken the bullish structure here and now is bearish until proven otherwise. I think bear market has started for ZEC and the privacy coins. So, please stay away from them.
ZEC has smashed down the 1D 100MA and is now trading below it. Any bounce from here will be considered as a dead cat bounce and should be treated as a sell signal. Next target will be 1D 200MA. Final target of the Fibonacci Resistance is below $800. Don't buy this coin here.
YOU HAVE BEEN WARNED!
#zec #bearish
$ZEC
Guys, did I give you warning or not? I clearly told you that a massive crash is incoming on ZEC and look what happened. ZEC is down 27% since then.
ZEC has completely broken the bullish structure here and now is bearish until proven otherwise. I think bear market has started for ZEC and the privacy coins. So, please stay away from them.
ZEC has smashed down the 1D 100MA and is now trading below it. Any bounce from here will be considered as a dead cat bounce and should be treated as a sell signal. Next target will be 1D 200MA. Final target of the Fibonacci Resistance is below $800. Don't buy this coin here.
YOU HAVE BEEN WARNED!
#zec #bearish
Guys, did I give you warning or not? I clearly told you that a massive crash is incoming on ZEC and look what happened. ZEC is down 27% since then.
ZEC has completely broken the bullish structure here and now is bearish until proven otherwise. I think bear market has started for ZEC and the privacy coins. So, please stay away from them.
ZEC has smashed down the 1D 100MA and is now trading below it. Any bounce from here will be considered as a dead cat bounce and should be treated as a sell signal. Next target will be 1D 200MA. Final target of the Fibonacci Resistance is below $800. Don't buy this coin here.
YOU HAVE BEEN WARNED!
#zec #bearish
1
3
1.5k
·
--
Bullish
TOTAL3
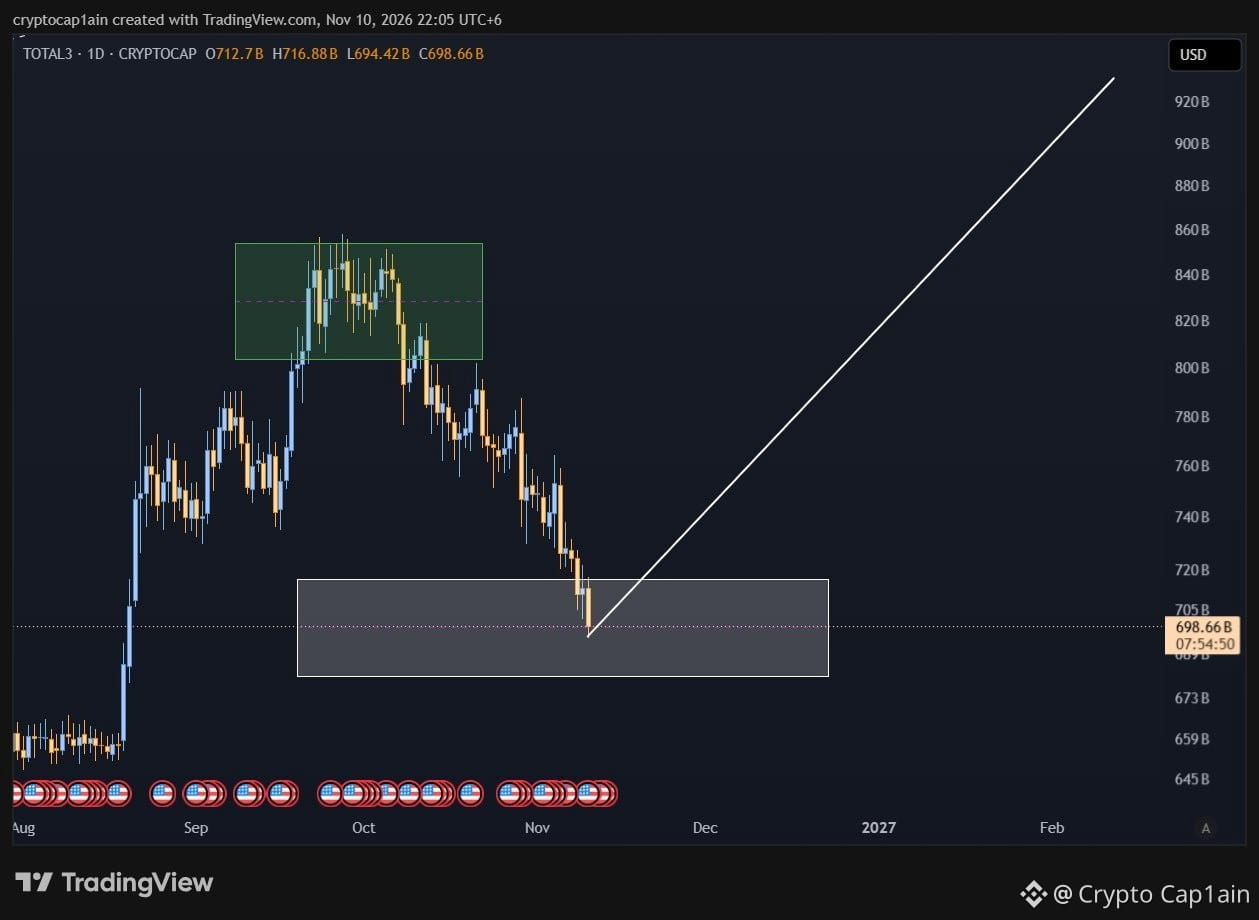
TOTAL3 has rejected from my green box. First, it has invalidated the yellow box and now has come to my white box. This is meant to be a consolidation box. So, consolidating here is good for the alts.
Have patience here. Good days will come for the alts. If you're a four year cycle believer, then you must know that bottom occurs in November. So, bottom is here or very near.
#AltSeasonComing #Bullrun
TOTAL3
TOTAL3 has rejected from my green box. First, it has invalidated the yellow box and now has come to my white box. This is meant to be a consolidation box. So, consolidating here is good for the alts.
Have patience here. Good days will come for the alts. If you're a four year cycle believer, then you must know that bottom occurs in November. So, bottom is here or very near.
#AltSeasonComing #Bullrun
TOTAL3 has rejected from my green box. First, it has invalidated the yellow box and now has come to my white box. This is meant to be a consolidation box. So, consolidating here is good for the alts.
Have patience here. Good days will come for the alts. If you're a four year cycle believer, then you must know that bottom occurs in November. So, bottom is here or very near.
#AltSeasonComing #Bullrun
3
818
·
--
Bearish
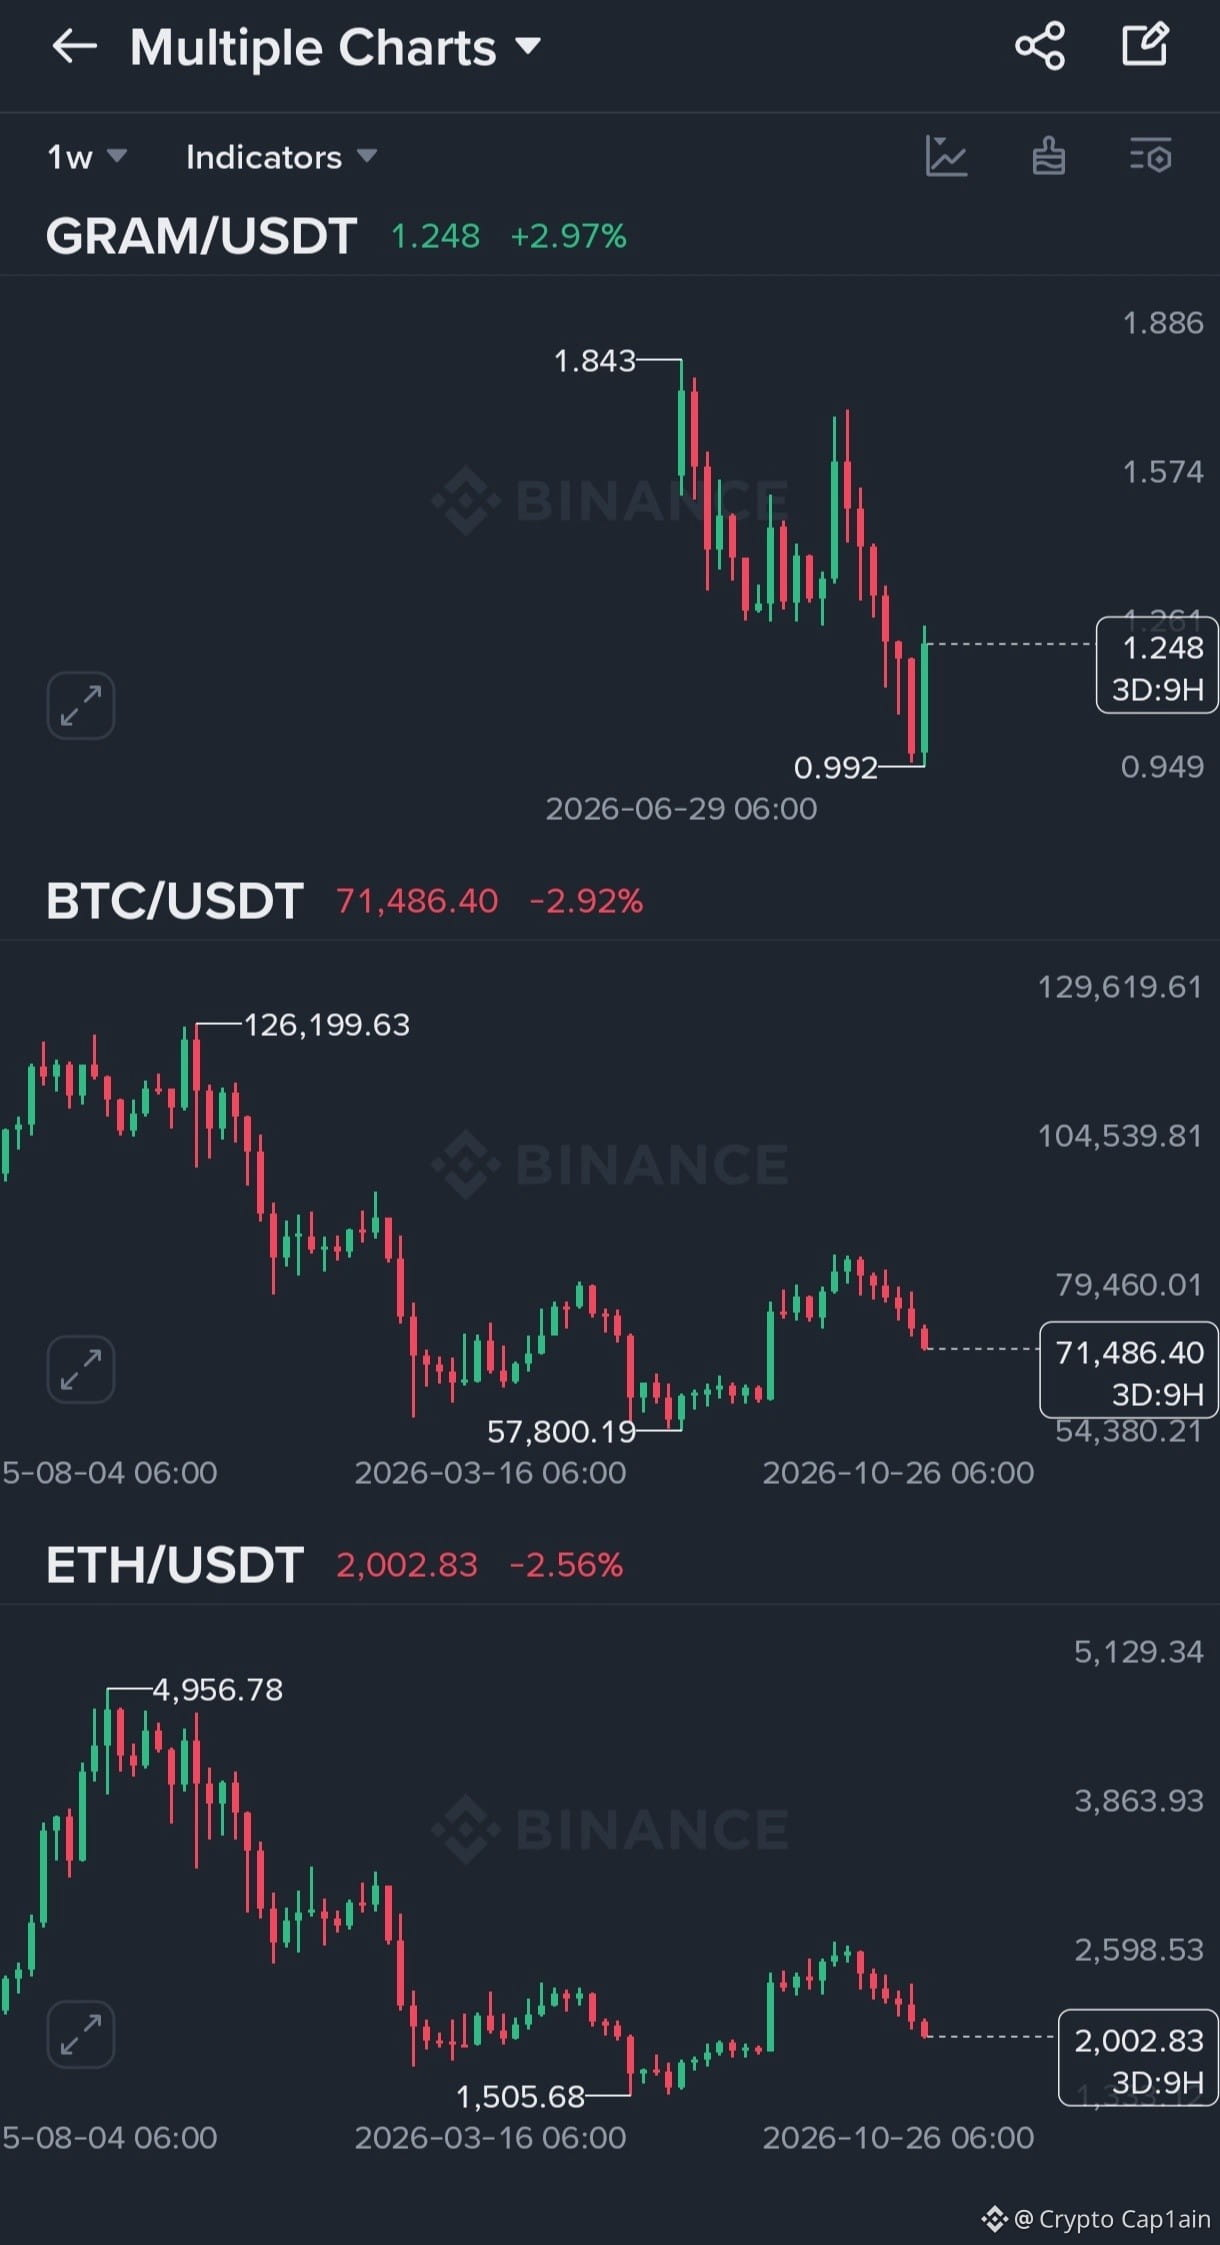
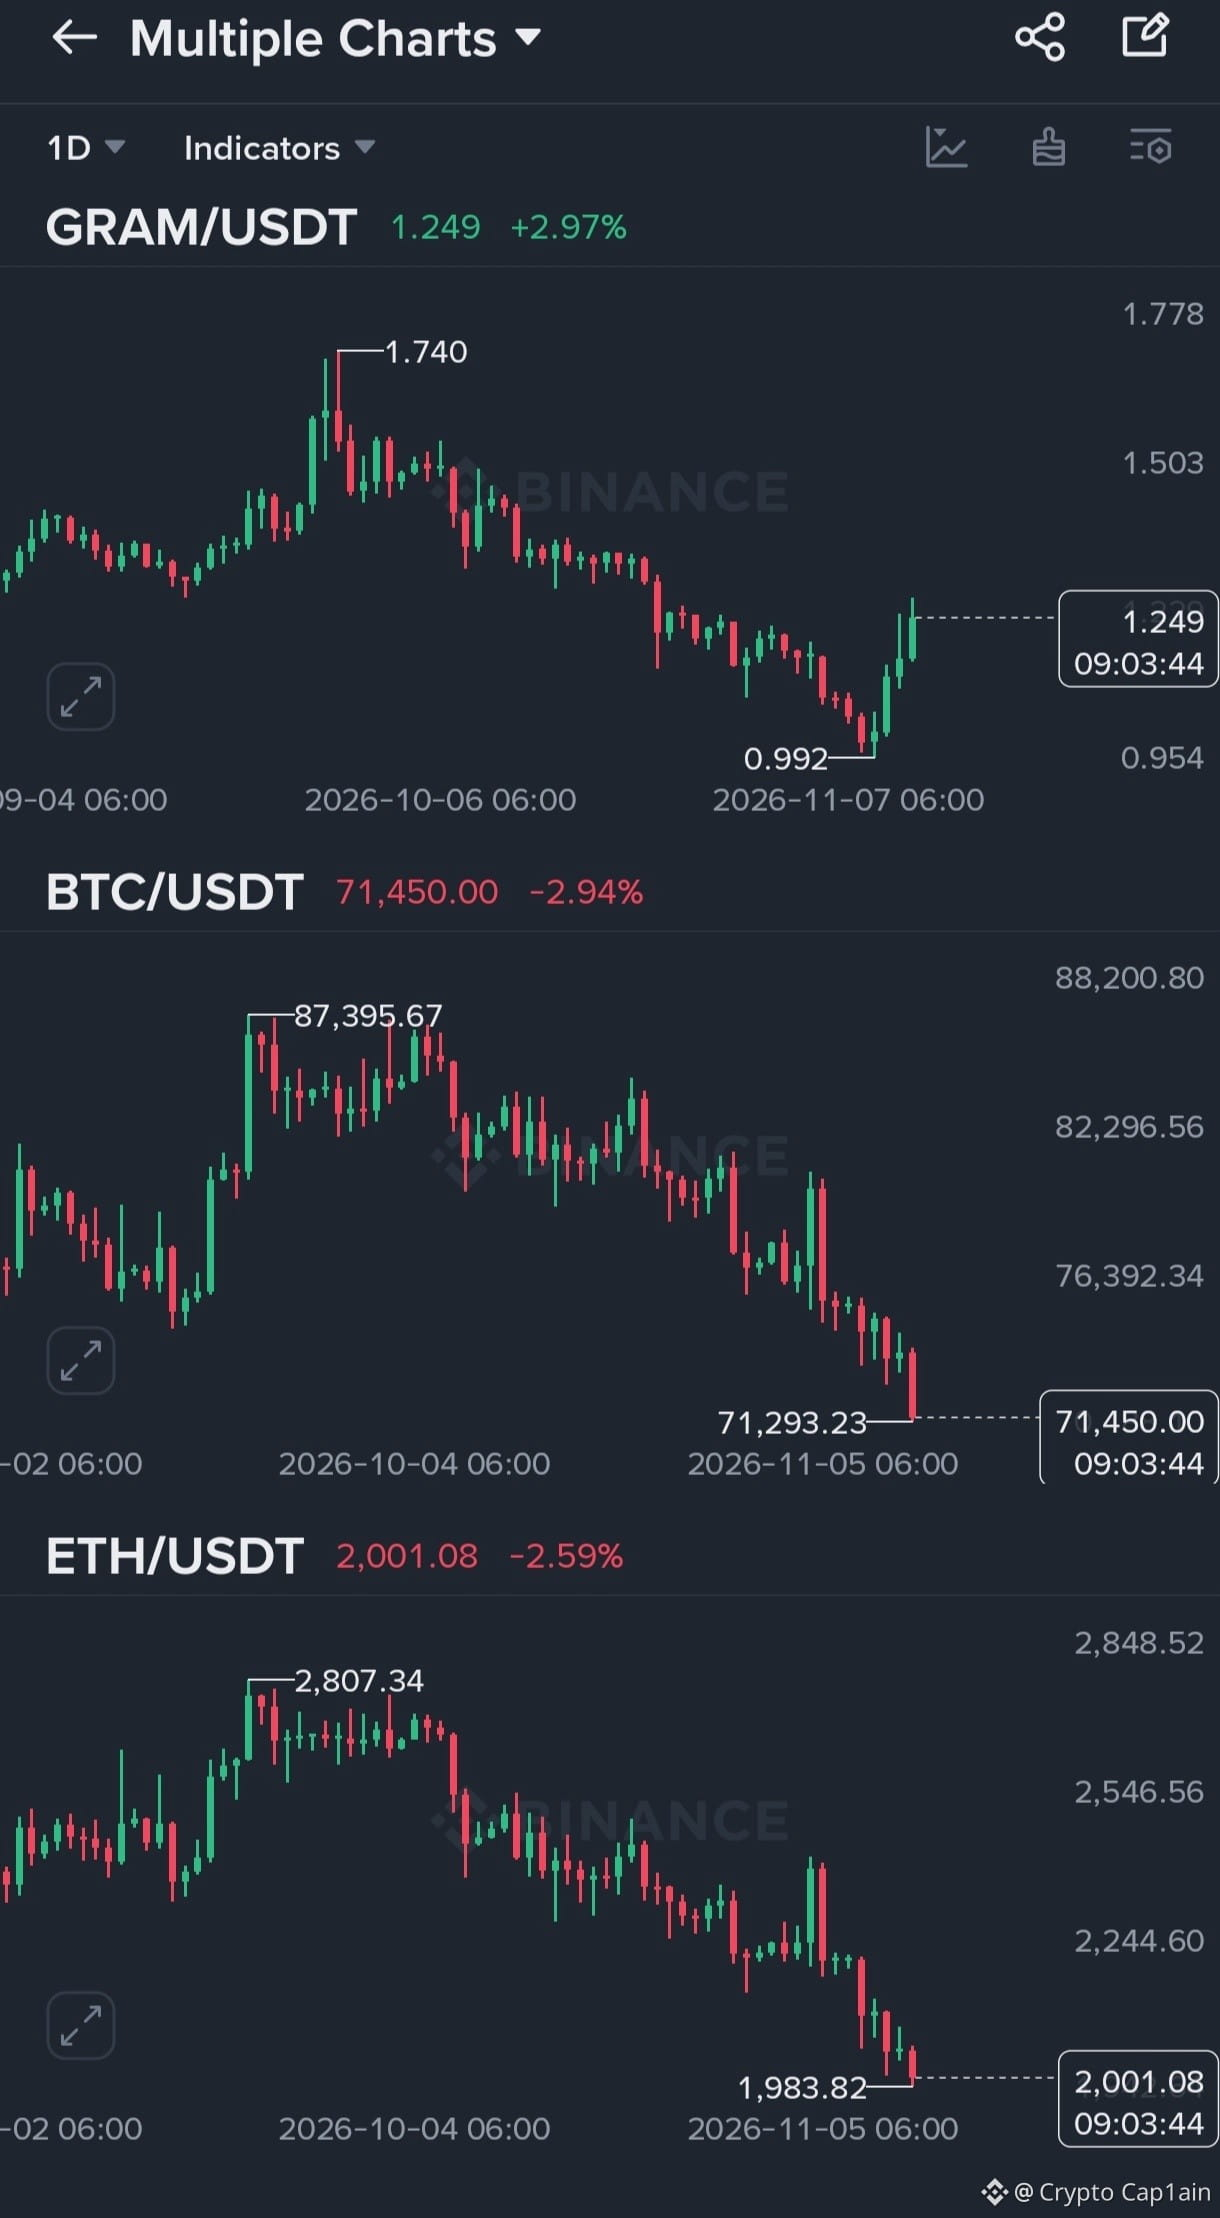
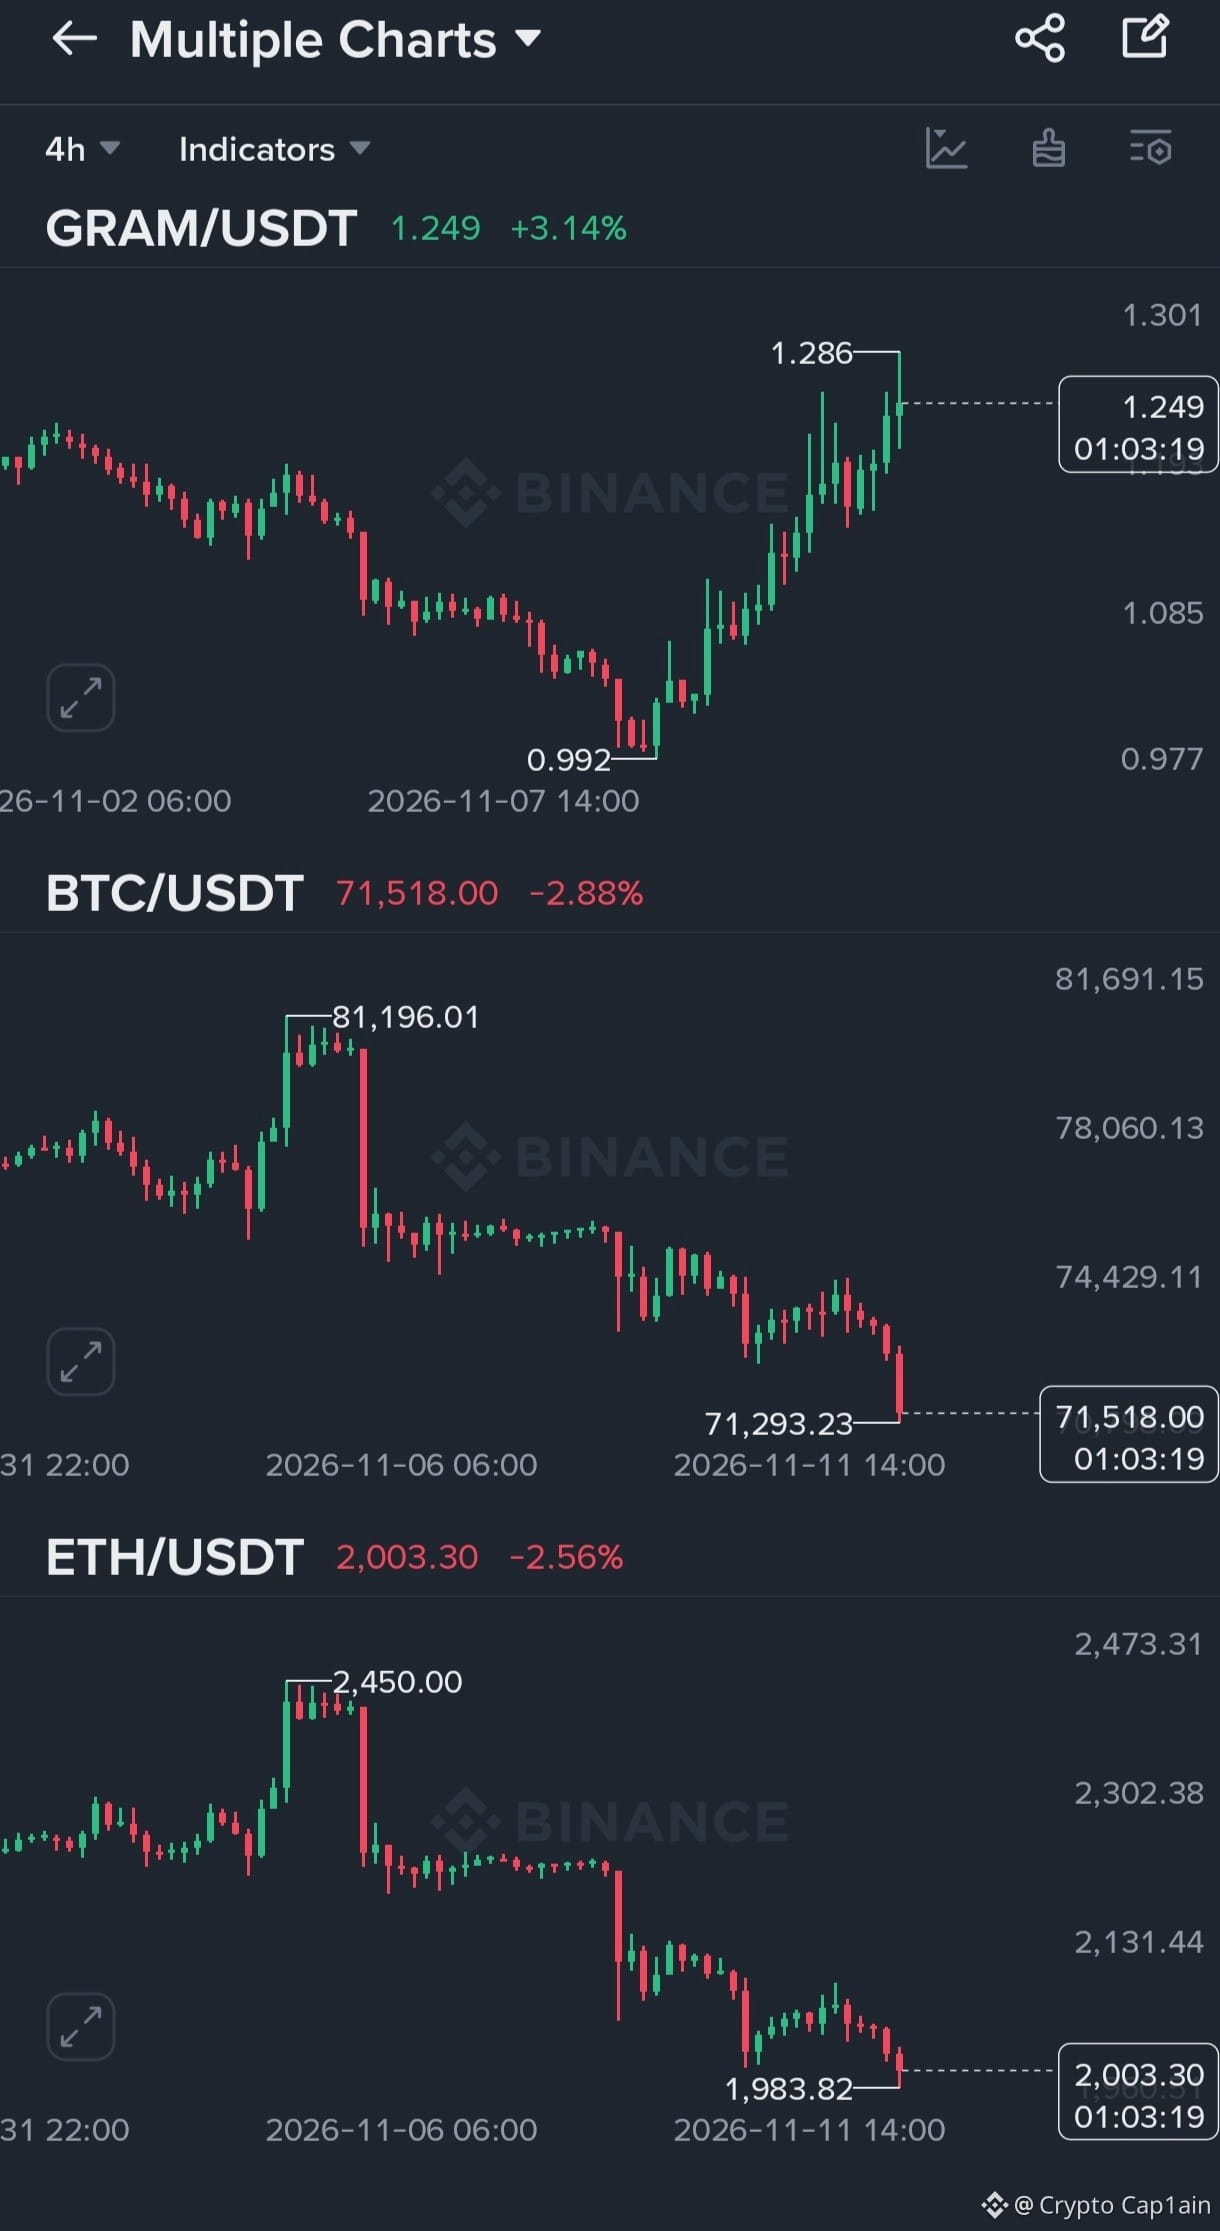
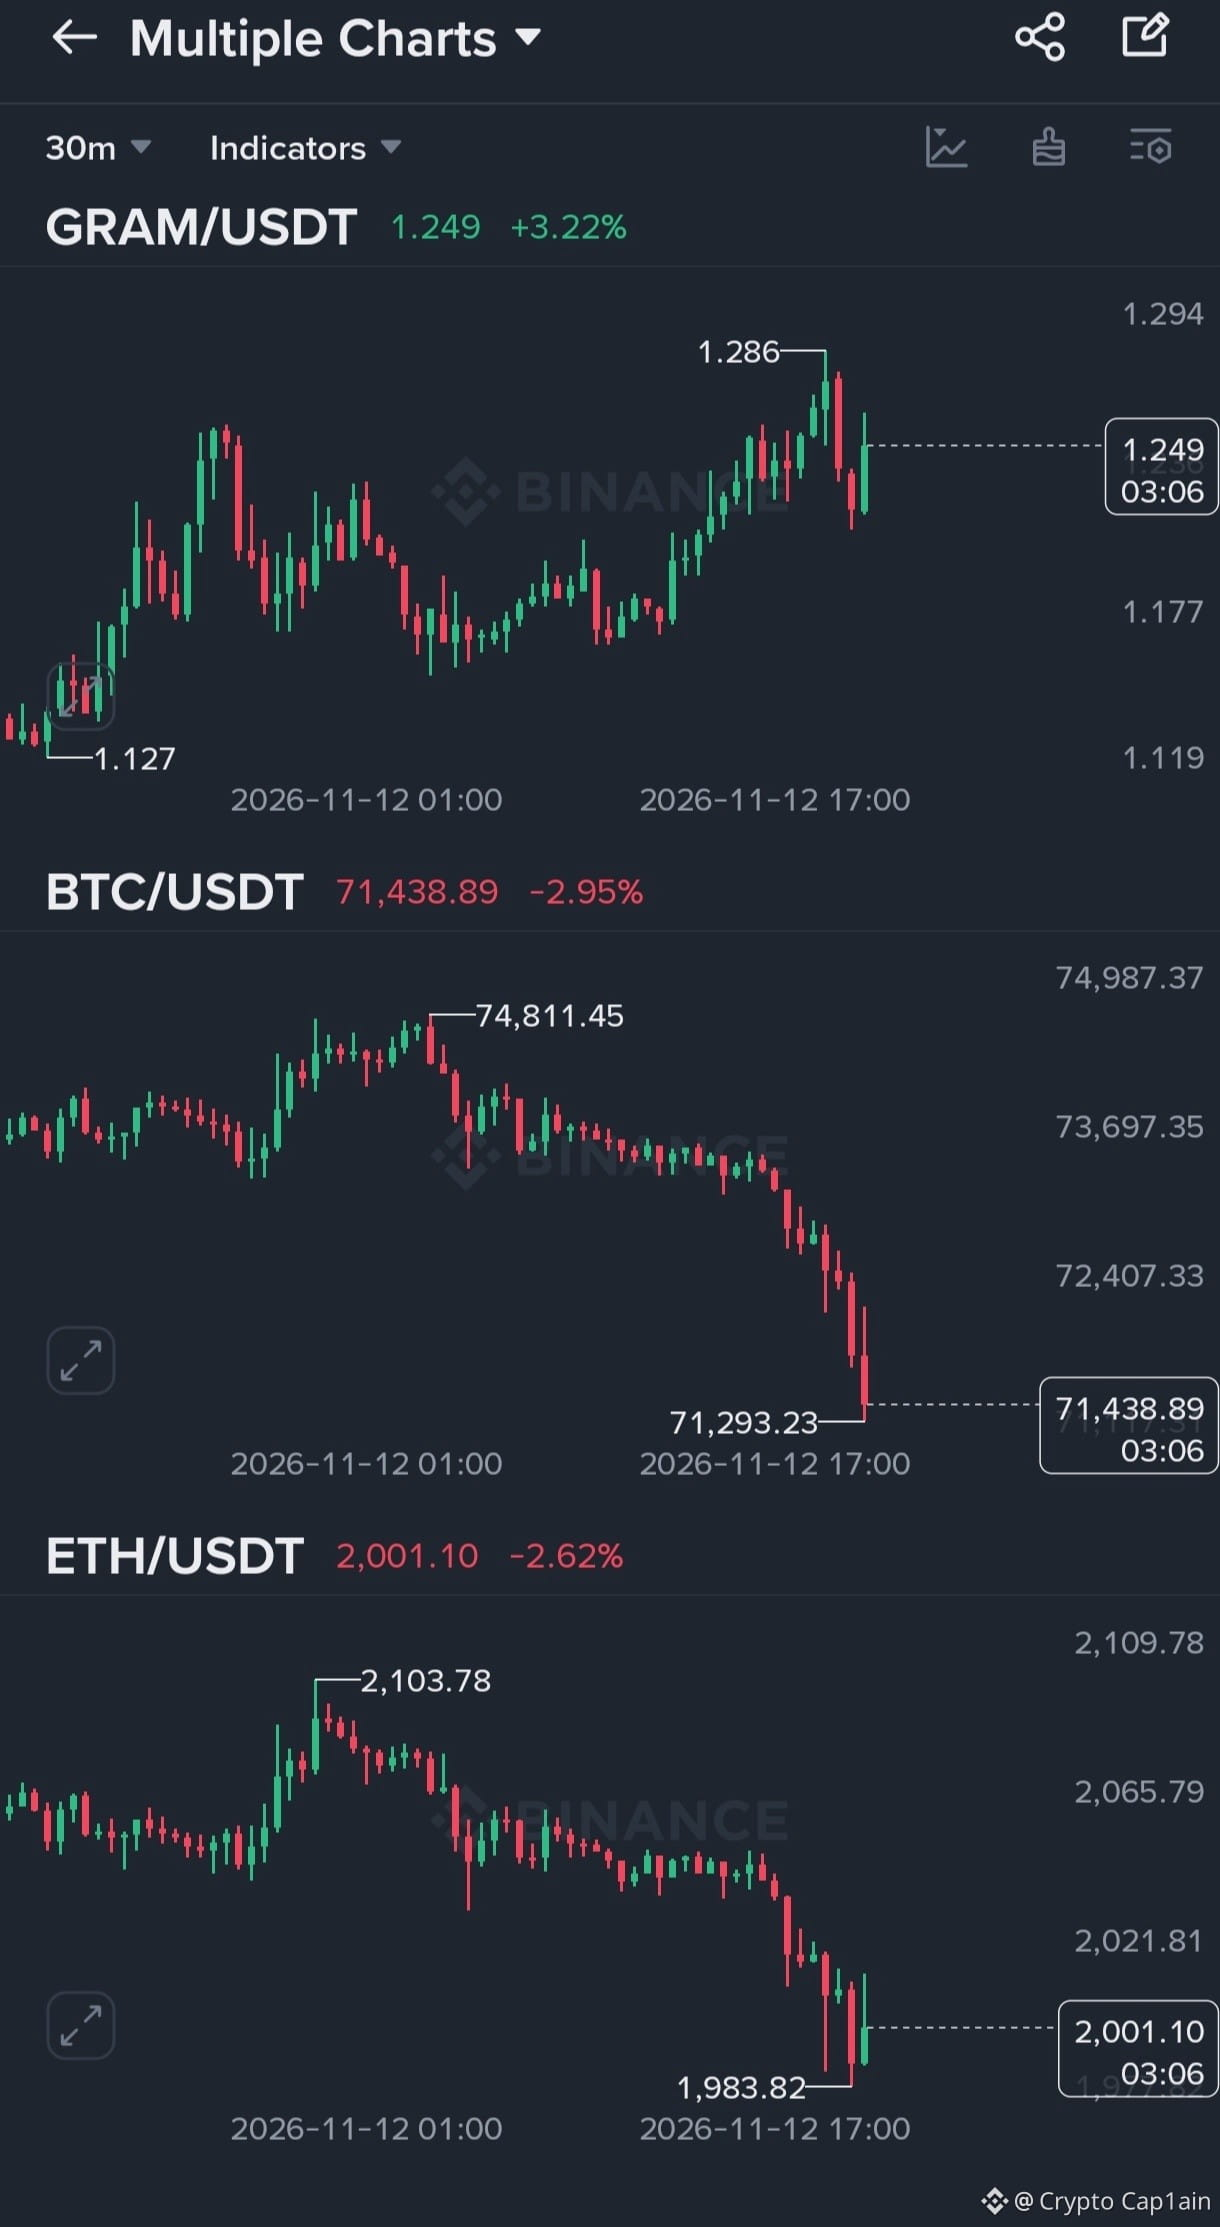
$GRAM
{spot}(GRAMUSDT)
Follower Request
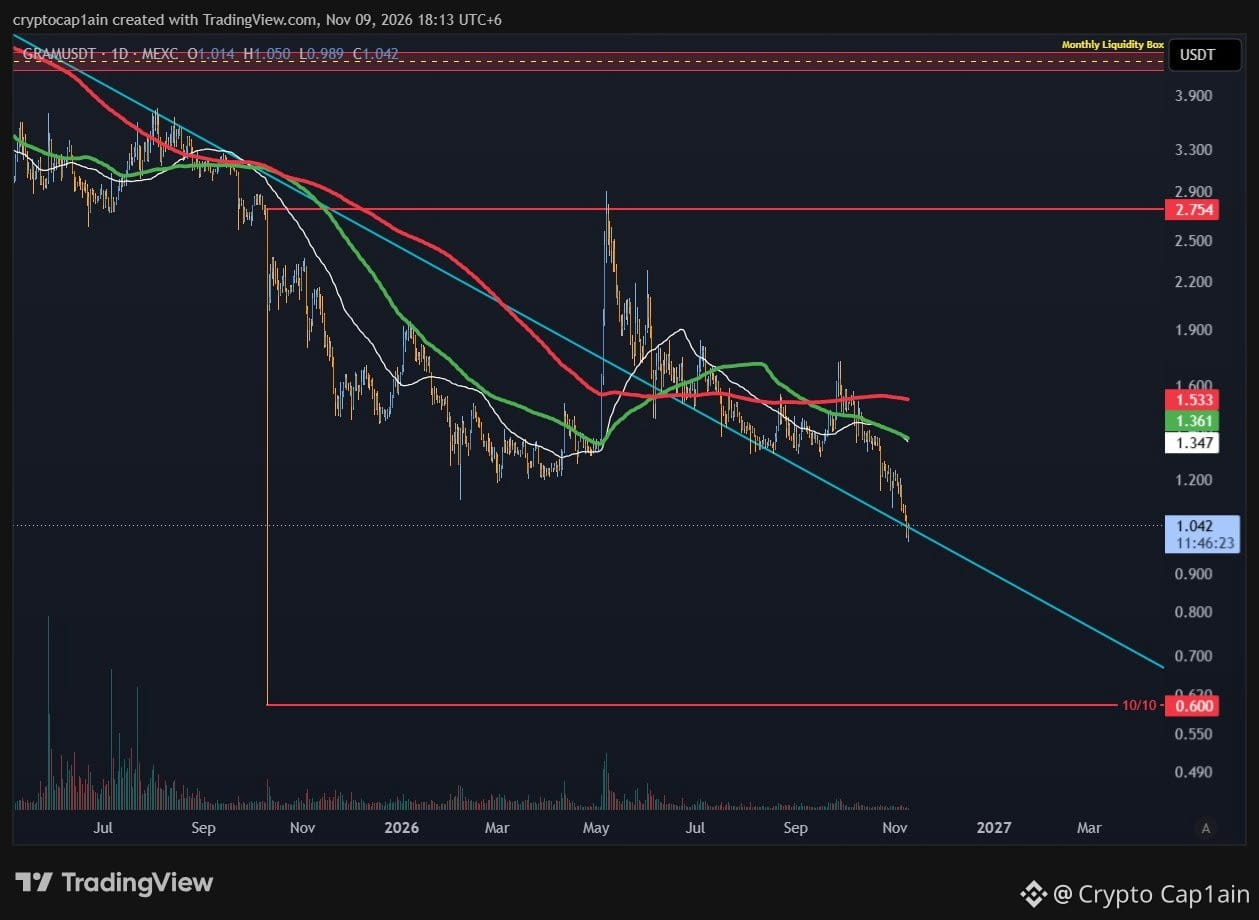
I was vocally bullish on GRAM. But, it’s not giving me the price action as I expected. However, since I have been accumulating this coin for long term return, I am not concerned on the price action it’s ongoing currently.
Just like FIL, it has taken out the 10th October high and then made a deviation to go lower and lower. It has lost 1D 50MA, 1D 100MA, 1D 200MA. So, it’s bearish till proven otherwise.
GRAM has also lost the trendline support and until it’s reclaimed, we can expect that GRAM is going to hit the 10th October low. So, buy in parts and hodl. Best of luck 🫡
#GRAM #TON
$GRAM
Follower Request
I was vocally bullish on GRAM. But, it’s not giving me the price action as I expected. However, since I have been accumulating this coin for long term return, I am not concerned on the price action it’s ongoing currently.
Just like FIL, it has taken out the 10th October high and then made a deviation to go lower and lower. It has lost 1D 50MA, 1D 100MA, 1D 200MA. So, it’s bearish till proven otherwise.
GRAM has also lost the trendline support and until it’s reclaimed, we can expect that GRAM is going to hit the 10th October low. So, buy in parts and hodl. Best of luck 🫡
#GRAM #TON
Follower Request
I was vocally bullish on GRAM. But, it’s not giving me the price action as I expected. However, since I have been accumulating this coin for long term return, I am not concerned on the price action it’s ongoing currently.
Just like FIL, it has taken out the 10th October high and then made a deviation to go lower and lower. It has lost 1D 50MA, 1D 100MA, 1D 200MA. So, it’s bearish till proven otherwise.
GRAM has also lost the trendline support and until it’s reclaimed, we can expect that GRAM is going to hit the 10th October low. So, buy in parts and hodl. Best of luck 🫡
#GRAM #TON
3
2.4k
·
--
Bearish
$FIL
{spot}(FILUSDT)
Follower Request
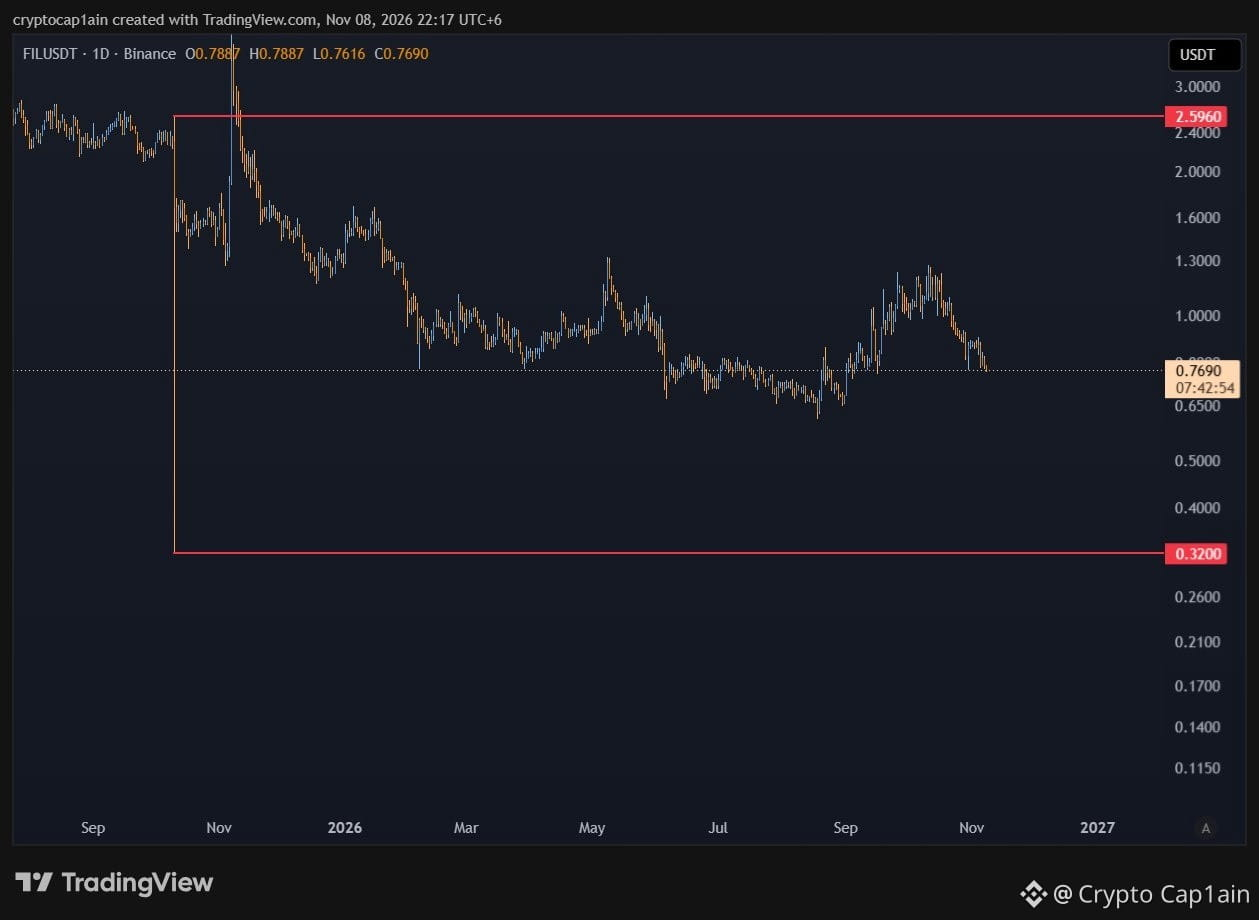
The plan is simple. Put one horizontal line on 10th October high and another on 10th October low.
Then, wait for one to be taken out and then to be reclaimed. After that, target would be the remaining one.
FIL has taken out the 10th October high and then made a deviation. After that, it’s only going down and down. Currently, FIL has come to a crucial zone. As long as it holds, nothing to worry about. But I doubt it would hold. I will be expecting FIL to take out that 10th October low.
So, no trade for me on FIL.
#fil #bearish
$FIL
Follower Request
The plan is simple. Put one horizontal line on 10th October high and another on 10th October low.
Then, wait for one to be taken out and then to be reclaimed. After that, target would be the remaining one.
FIL has taken out the 10th October high and then made a deviation. After that, it’s only going down and down. Currently, FIL has come to a crucial zone. As long as it holds, nothing to worry about. But I doubt it would hold. I will be expecting FIL to take out that 10th October low.
So, no trade for me on FIL.
#fil #bearish
Follower Request
The plan is simple. Put one horizontal line on 10th October high and another on 10th October low.
Then, wait for one to be taken out and then to be reclaimed. After that, target would be the remaining one.
FIL has taken out the 10th October high and then made a deviation. After that, it’s only going down and down. Currently, FIL has come to a crucial zone. As long as it holds, nothing to worry about. But I doubt it would hold. I will be expecting FIL to take out that 10th October low.
So, no trade for me on FIL.
#fil #bearish
3
1k
·
--
Bearish
$ZEC
{spot}(ZECUSDT)
Follower Request
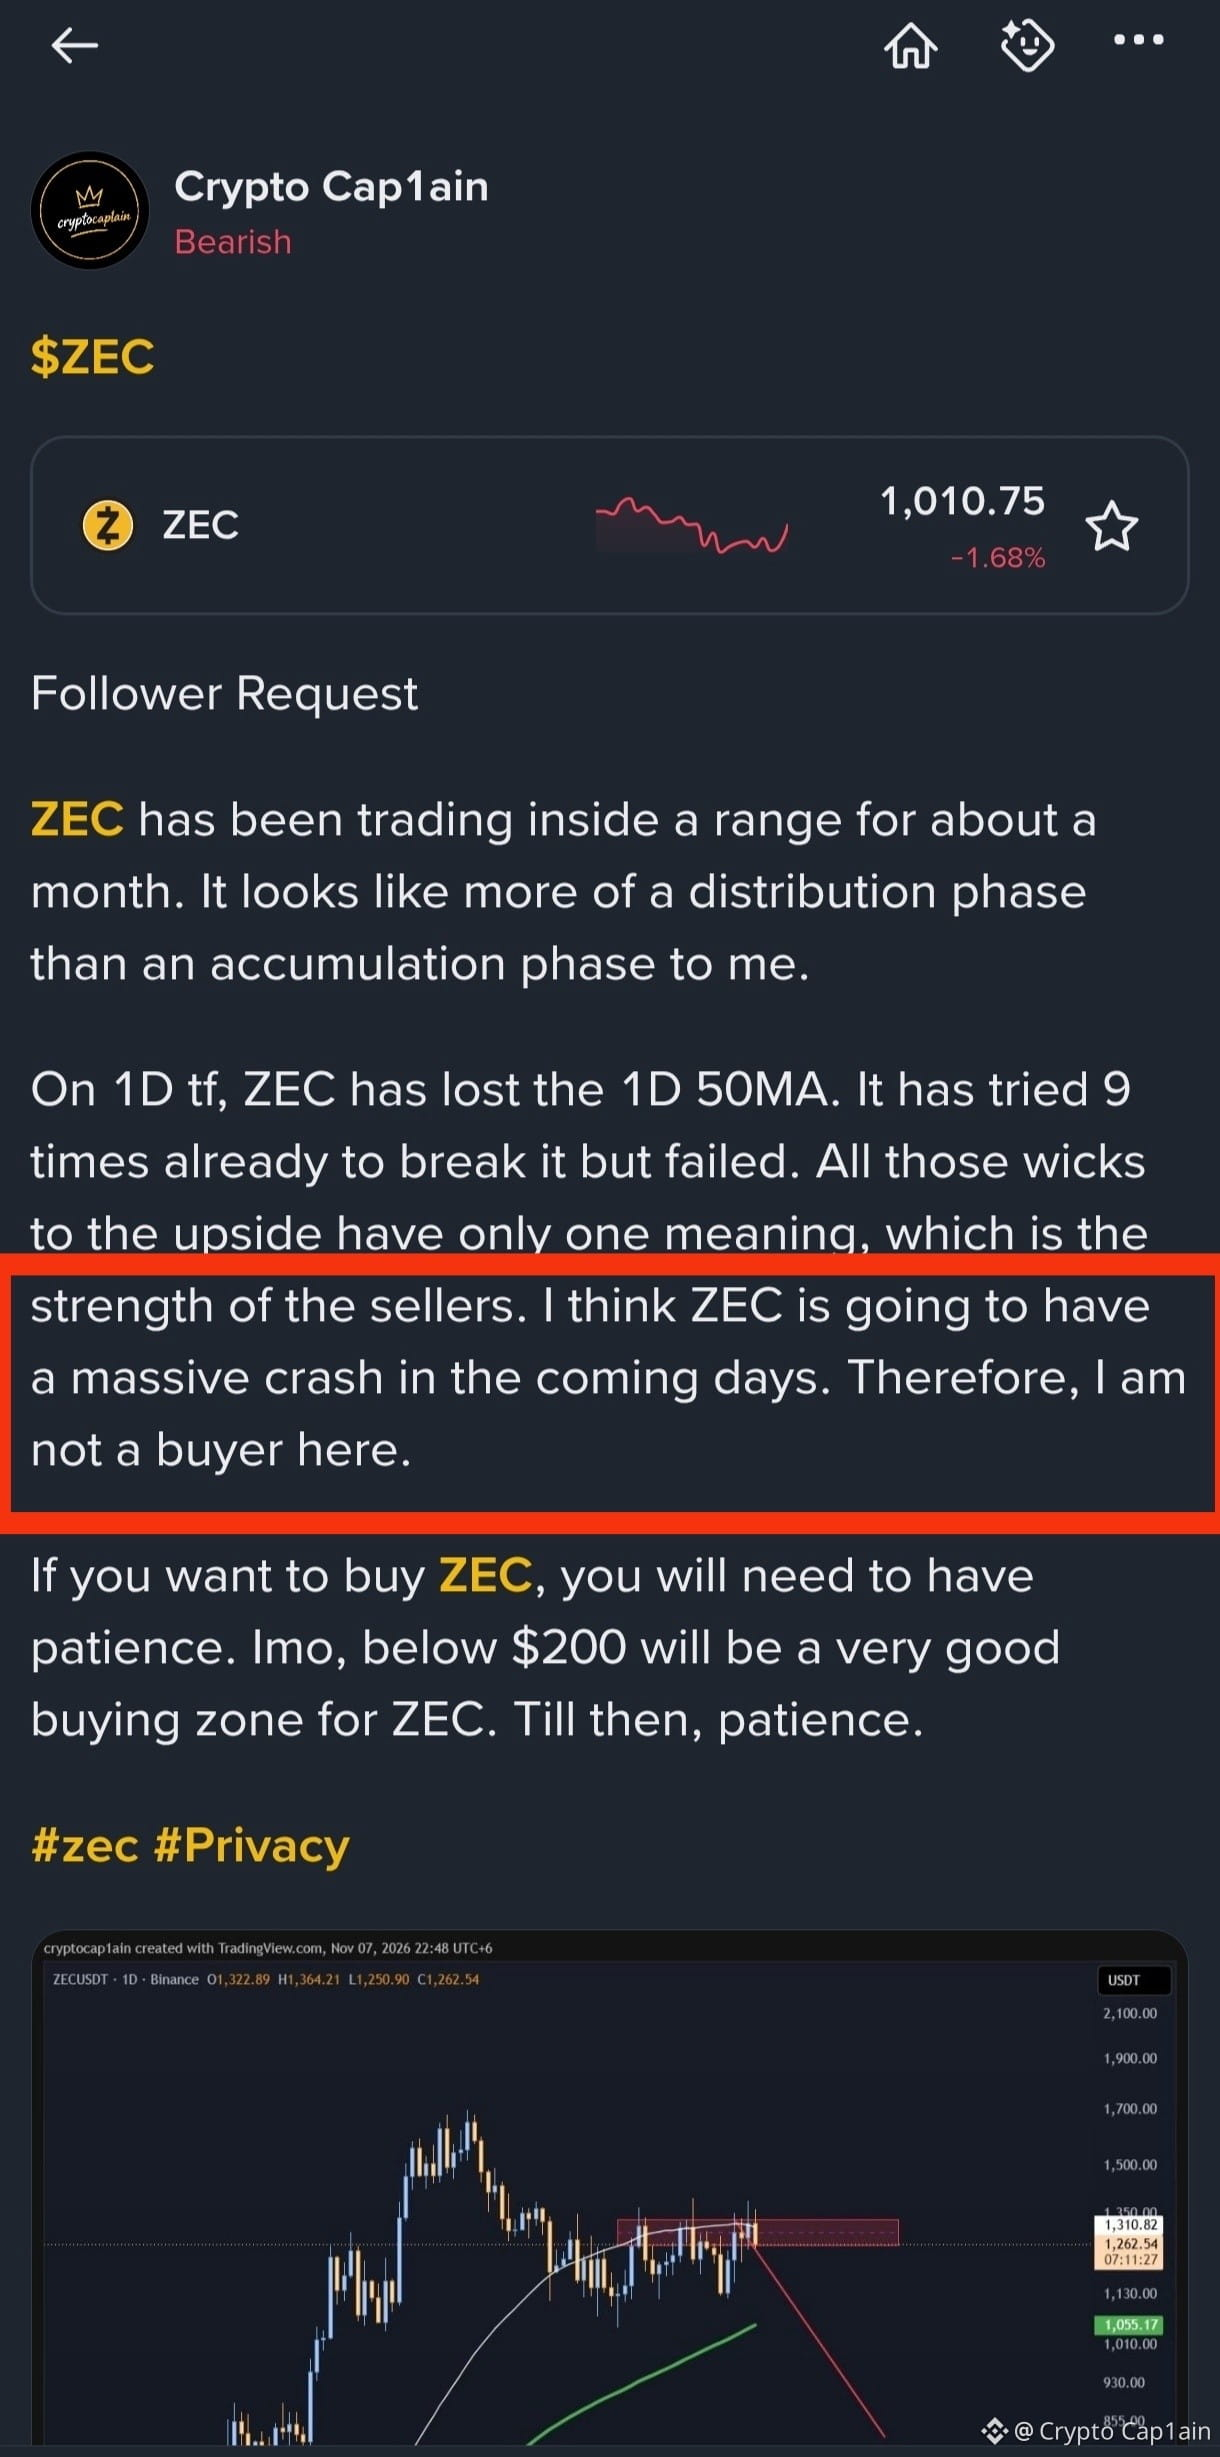
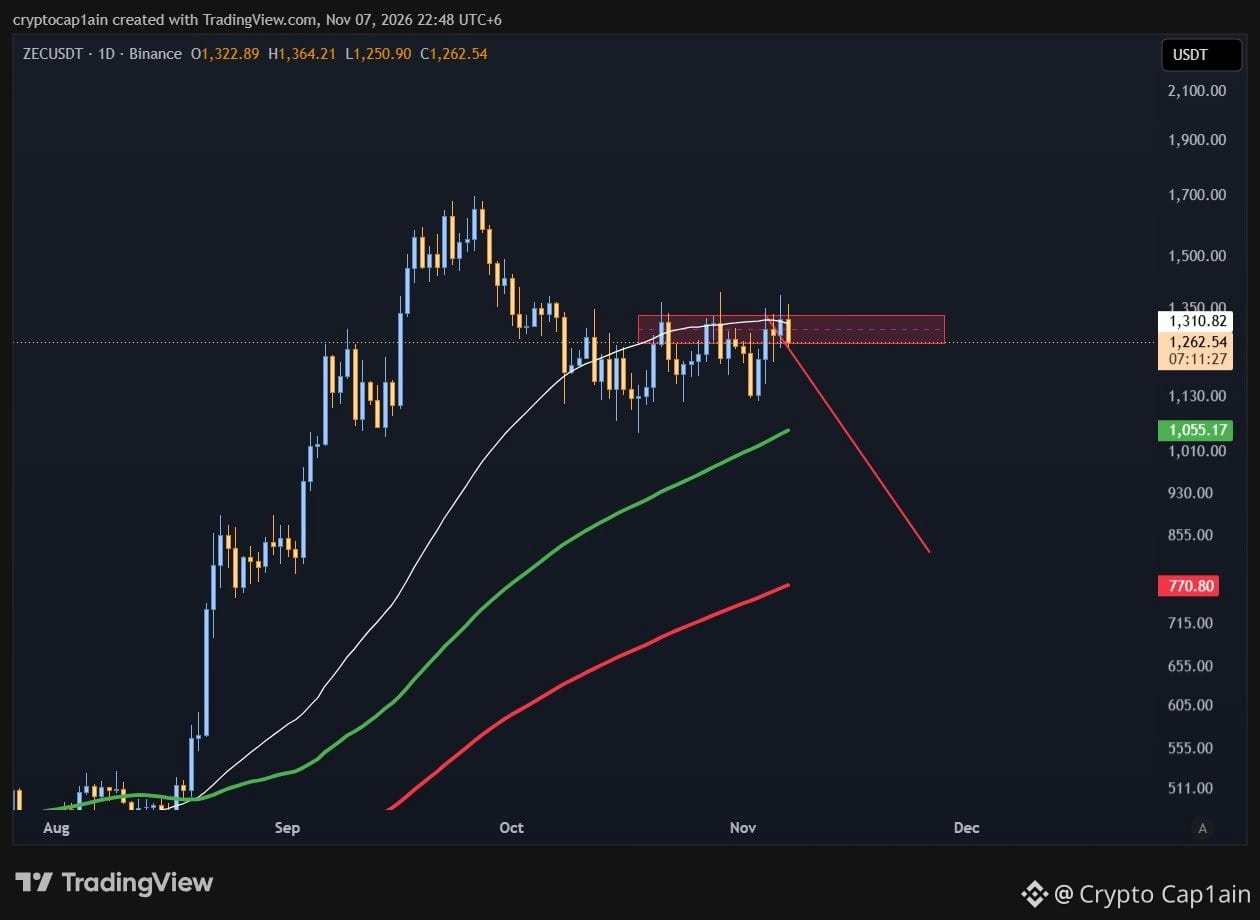
ZEC has been trading inside a range for about a month. It looks like more of a distribution phase than an accumulation phase to me.
On 1D tf, ZEC has lost the 1D 50MA. It has tried 9 times already to break it but failed. All those wicks to the upside have only one meaning, which is the strength of the sellers. I think ZEC is going to have a massive crash in the coming days. Therefore, I am not a buyer here.
If you want to buy ZEC, you will need to have patience. Imo, below $200 will be a very good buying zone for ZEC. Till then, patience.
#zec #Privacy
$ZEC
Follower Request
ZEC has been trading inside a range for about a month. It looks like more of a distribution phase than an accumulation phase to me.
On 1D tf, ZEC has lost the 1D 50MA. It has tried 9 times already to break it but failed. All those wicks to the upside have only one meaning, which is the strength of the sellers. I think ZEC is going to have a massive crash in the coming days. Therefore, I am not a buyer here.
If you want to buy ZEC, you will need to have patience. Imo, below $200 will be a very good buying zone for ZEC. Till then, patience.
#zec #Privacy
Follower Request
ZEC has been trading inside a range for about a month. It looks like more of a distribution phase than an accumulation phase to me.
On 1D tf, ZEC has lost the 1D 50MA. It has tried 9 times already to break it but failed. All those wicks to the upside have only one meaning, which is the strength of the sellers. I think ZEC is going to have a massive crash in the coming days. Therefore, I am not a buyer here.
If you want to buy ZEC, you will need to have patience. Imo, below $200 will be a very good buying zone for ZEC. Till then, patience.
#zec #Privacy
4
8
9.4k
$SUI
{spot}(SUIUSDT)
Follower Request
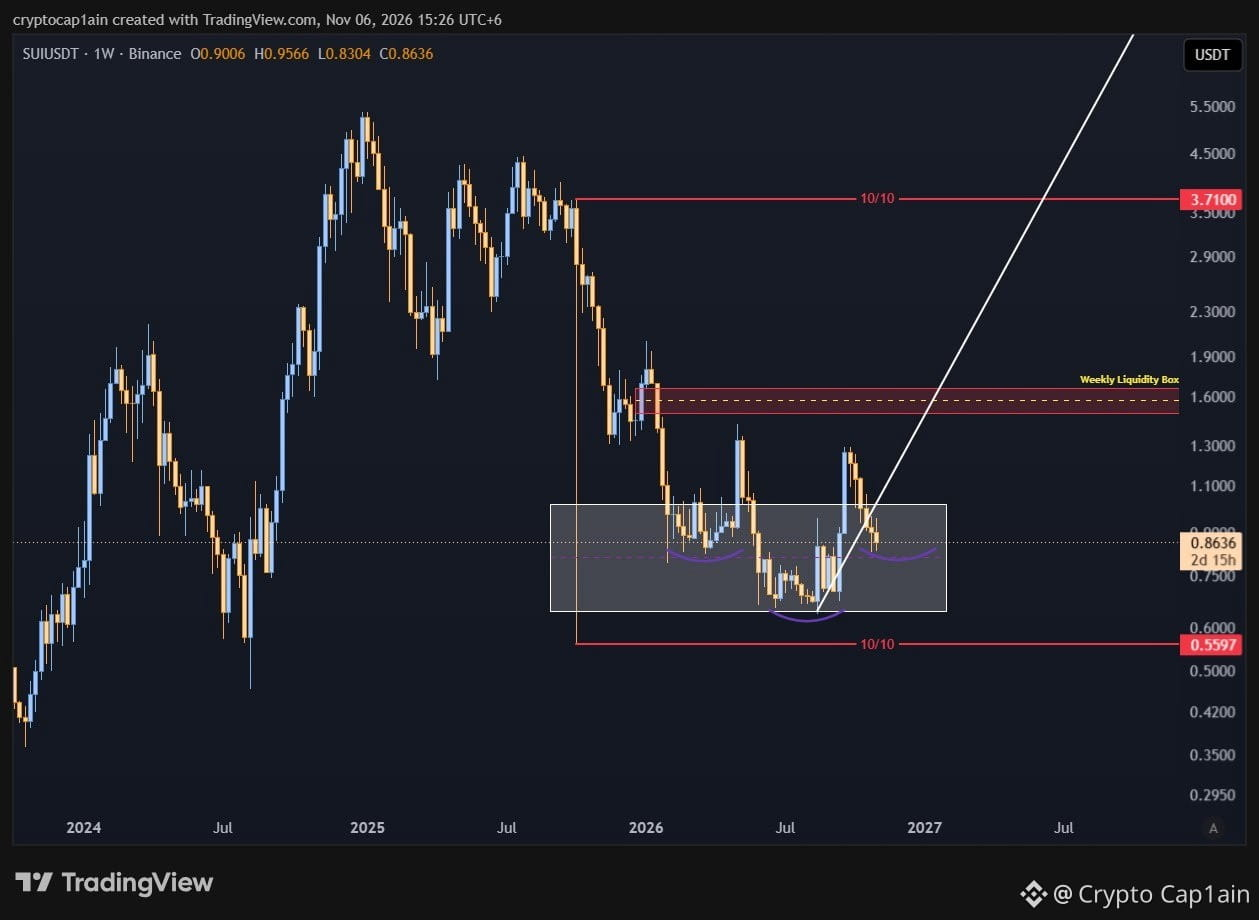
SUI has given us more than 30% profit last time. It seems like it has come to an interesting zone again.
On 1W tf, SUI is trading inside the white box. It is serving its purpose very well. As long as this box holds, we are going up. Also, it is forming an Inverse Head and Shoulder pattern which is bullish. Breaking out the neckline will confirm it properly.
But remember, there is 10th October low here which is a magnet. So, keep your eyes on it.
#SUI🔥 #SUİ
$SUI
Follower Request
SUI has given us more than 30% profit last time. It seems like it has come to an interesting zone again.
On 1W tf, SUI is trading inside the white box. It is serving its purpose very well. As long as this box holds, we are going up. Also, it is forming an Inverse Head and Shoulder pattern which is bullish. Breaking out the neckline will confirm it properly.
But remember, there is 10th October low here which is a magnet. So, keep your eyes on it.
#SUI🔥 #SUİ
Follower Request
SUI has given us more than 30% profit last time. It seems like it has come to an interesting zone again.
On 1W tf, SUI is trading inside the white box. It is serving its purpose very well. As long as this box holds, we are going up. Also, it is forming an Inverse Head and Shoulder pattern which is bullish. Breaking out the neckline will confirm it properly.
But remember, there is 10th October low here which is a magnet. So, keep your eyes on it.
#SUI🔥 #SUİ
6
2.1k
·
--
Bullish
$LDO
{spot}(LDOUSDT)
Follower Request
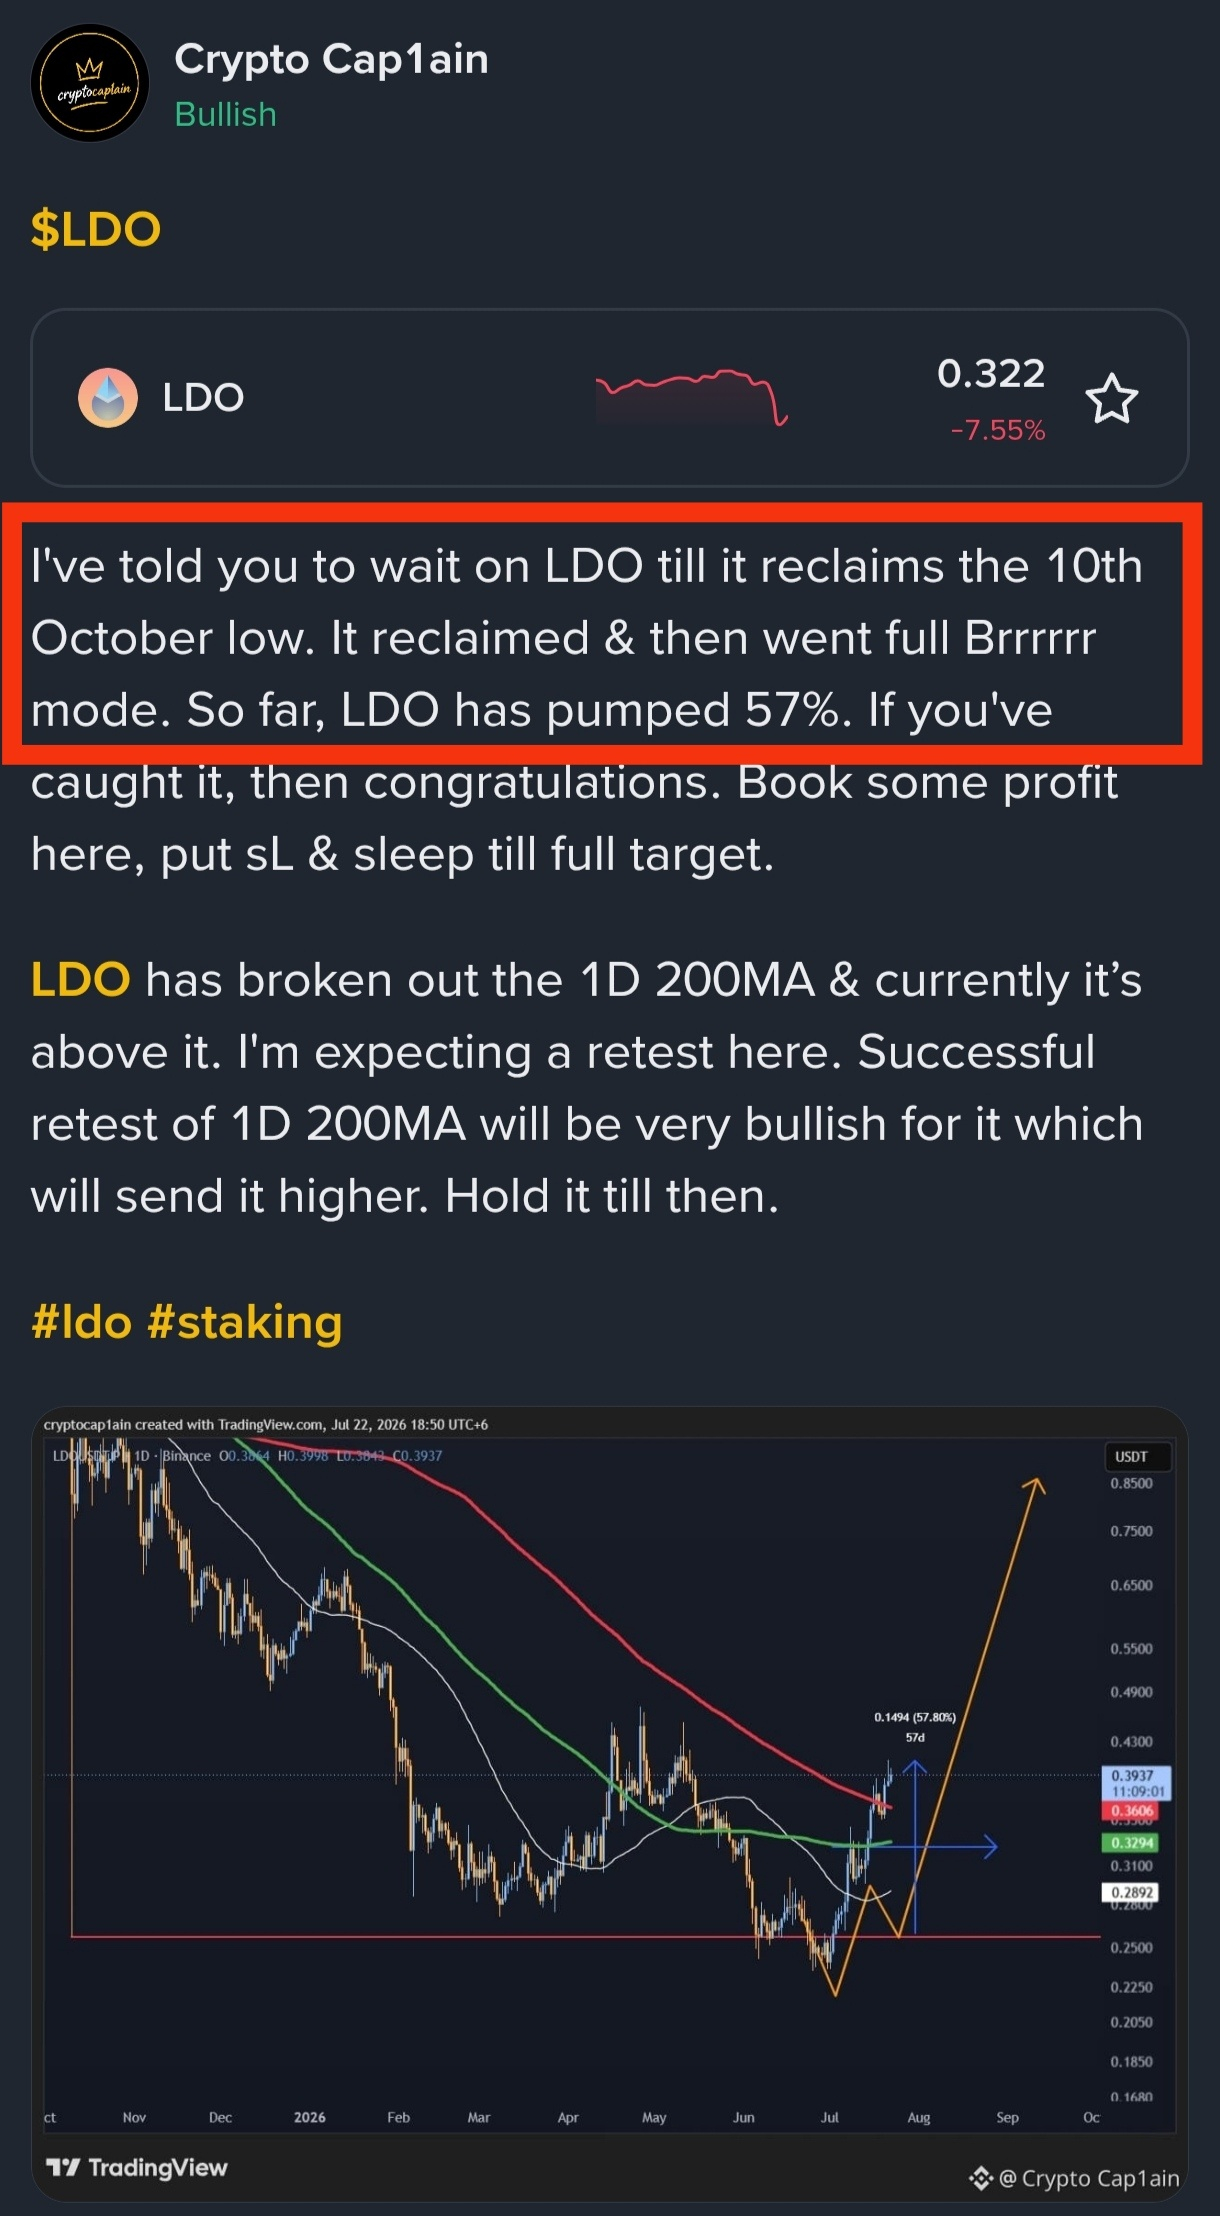
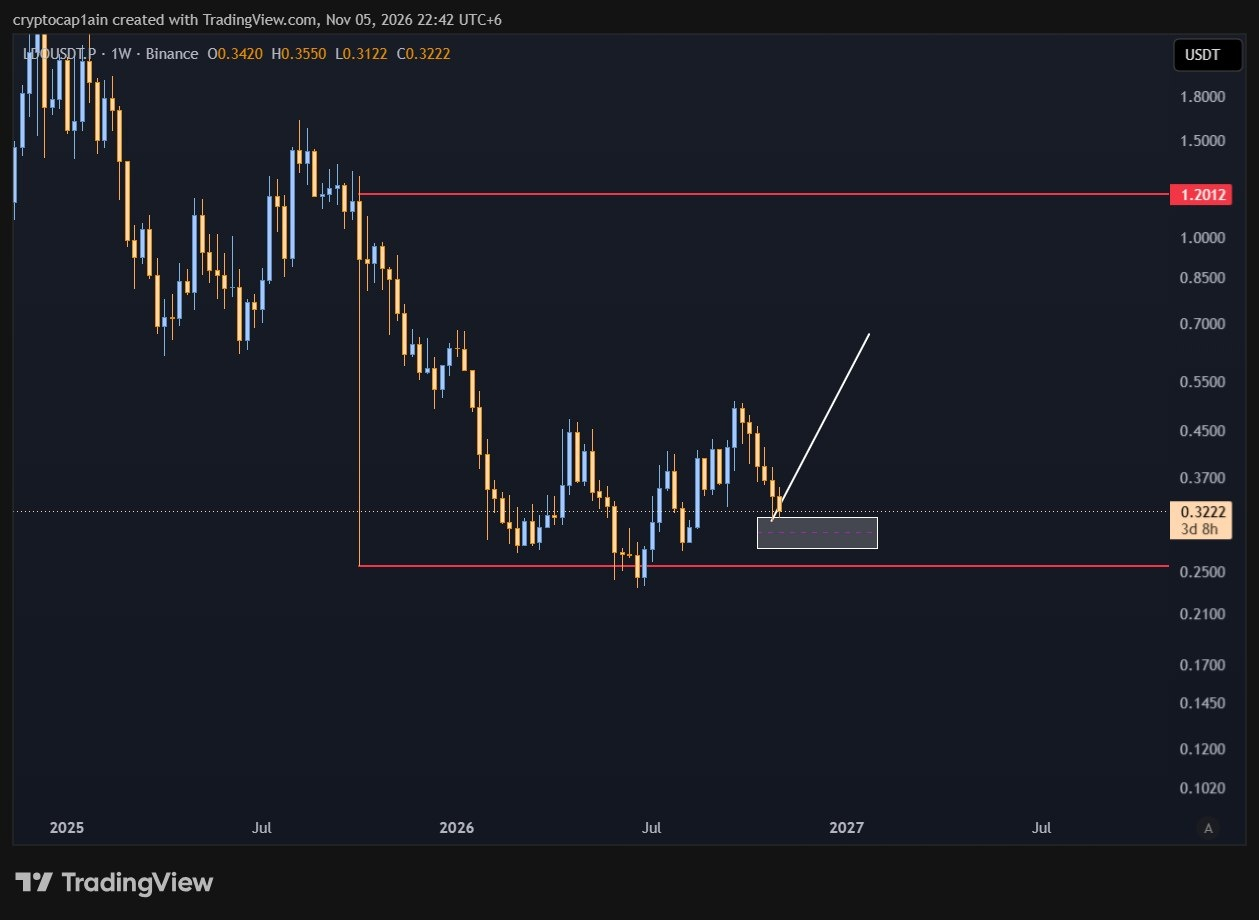
Last time we bought, LDO pumped 57% and now it has come to an interesting point. LDO has taken out the 10th October low and also reclaimed it. I have put the Fibonacci tool and drawn the white box. If you are following me for a while, you know what does the white box mean.
Therefore, as long as this box holds, LDO is bullish. First target will be around $0.7 and the final target will be at $1.2012
Buy at the white box and hodl with patience. Best of luck.
#ldo #staking
$LDO
Follower Request
Last time we bought, LDO pumped 57% and now it has come to an interesting point. LDO has taken out the 10th October low and also reclaimed it. I have put the Fibonacci tool and drawn the white box. If you are following me for a while, you know what does the white box mean.
Therefore, as long as this box holds, LDO is bullish. First target will be around $0.7 and the final target will be at $1.2012
Buy at the white box and hodl with patience. Best of luck.
#ldo #staking
Follower Request
Last time we bought, LDO pumped 57% and now it has come to an interesting point. LDO has taken out the 10th October low and also reclaimed it. I have put the Fibonacci tool and drawn the white box. If you are following me for a while, you know what does the white box mean.
Therefore, as long as this box holds, LDO is bullish. First target will be around $0.7 and the final target will be at $1.2012
Buy at the white box and hodl with patience. Best of luck.
#ldo #staking
2
2
514

·
--
Bearish
$GIGGLE
{spot}(GIGGLEUSDT)
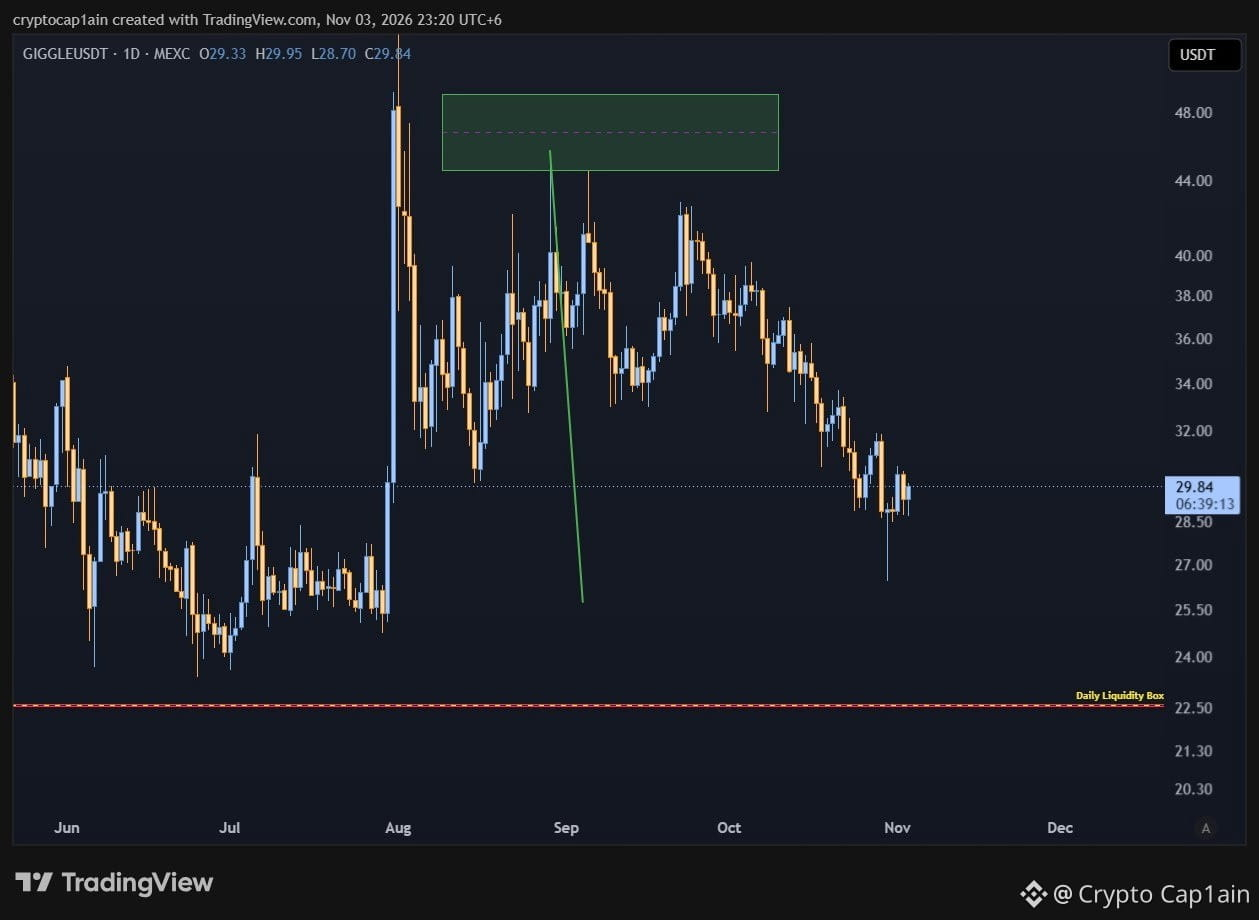
GIGGLE is down 43% since it hit my green box.
Full target of this box is done.
Next target is the red liquidity box. That's my buying zone.
Till then, patience.
BNB chain is having some tough times.
#giggle #GiggleAcademy
$GIGGLE
GIGGLE is down 43% since it hit my green box.
Full target of this box is done.
Next target is the red liquidity box. That's my buying zone.
Till then, patience.
BNB chain is having some tough times.
#giggle #GiggleAcademy
GIGGLE is down 43% since it hit my green box.
Full target of this box is done.
Next target is the red liquidity box. That's my buying zone.
Till then, patience.
BNB chain is having some tough times.
#giggle #GiggleAcademy
1
1k
$TAO
{spot}(TAOUSDT)
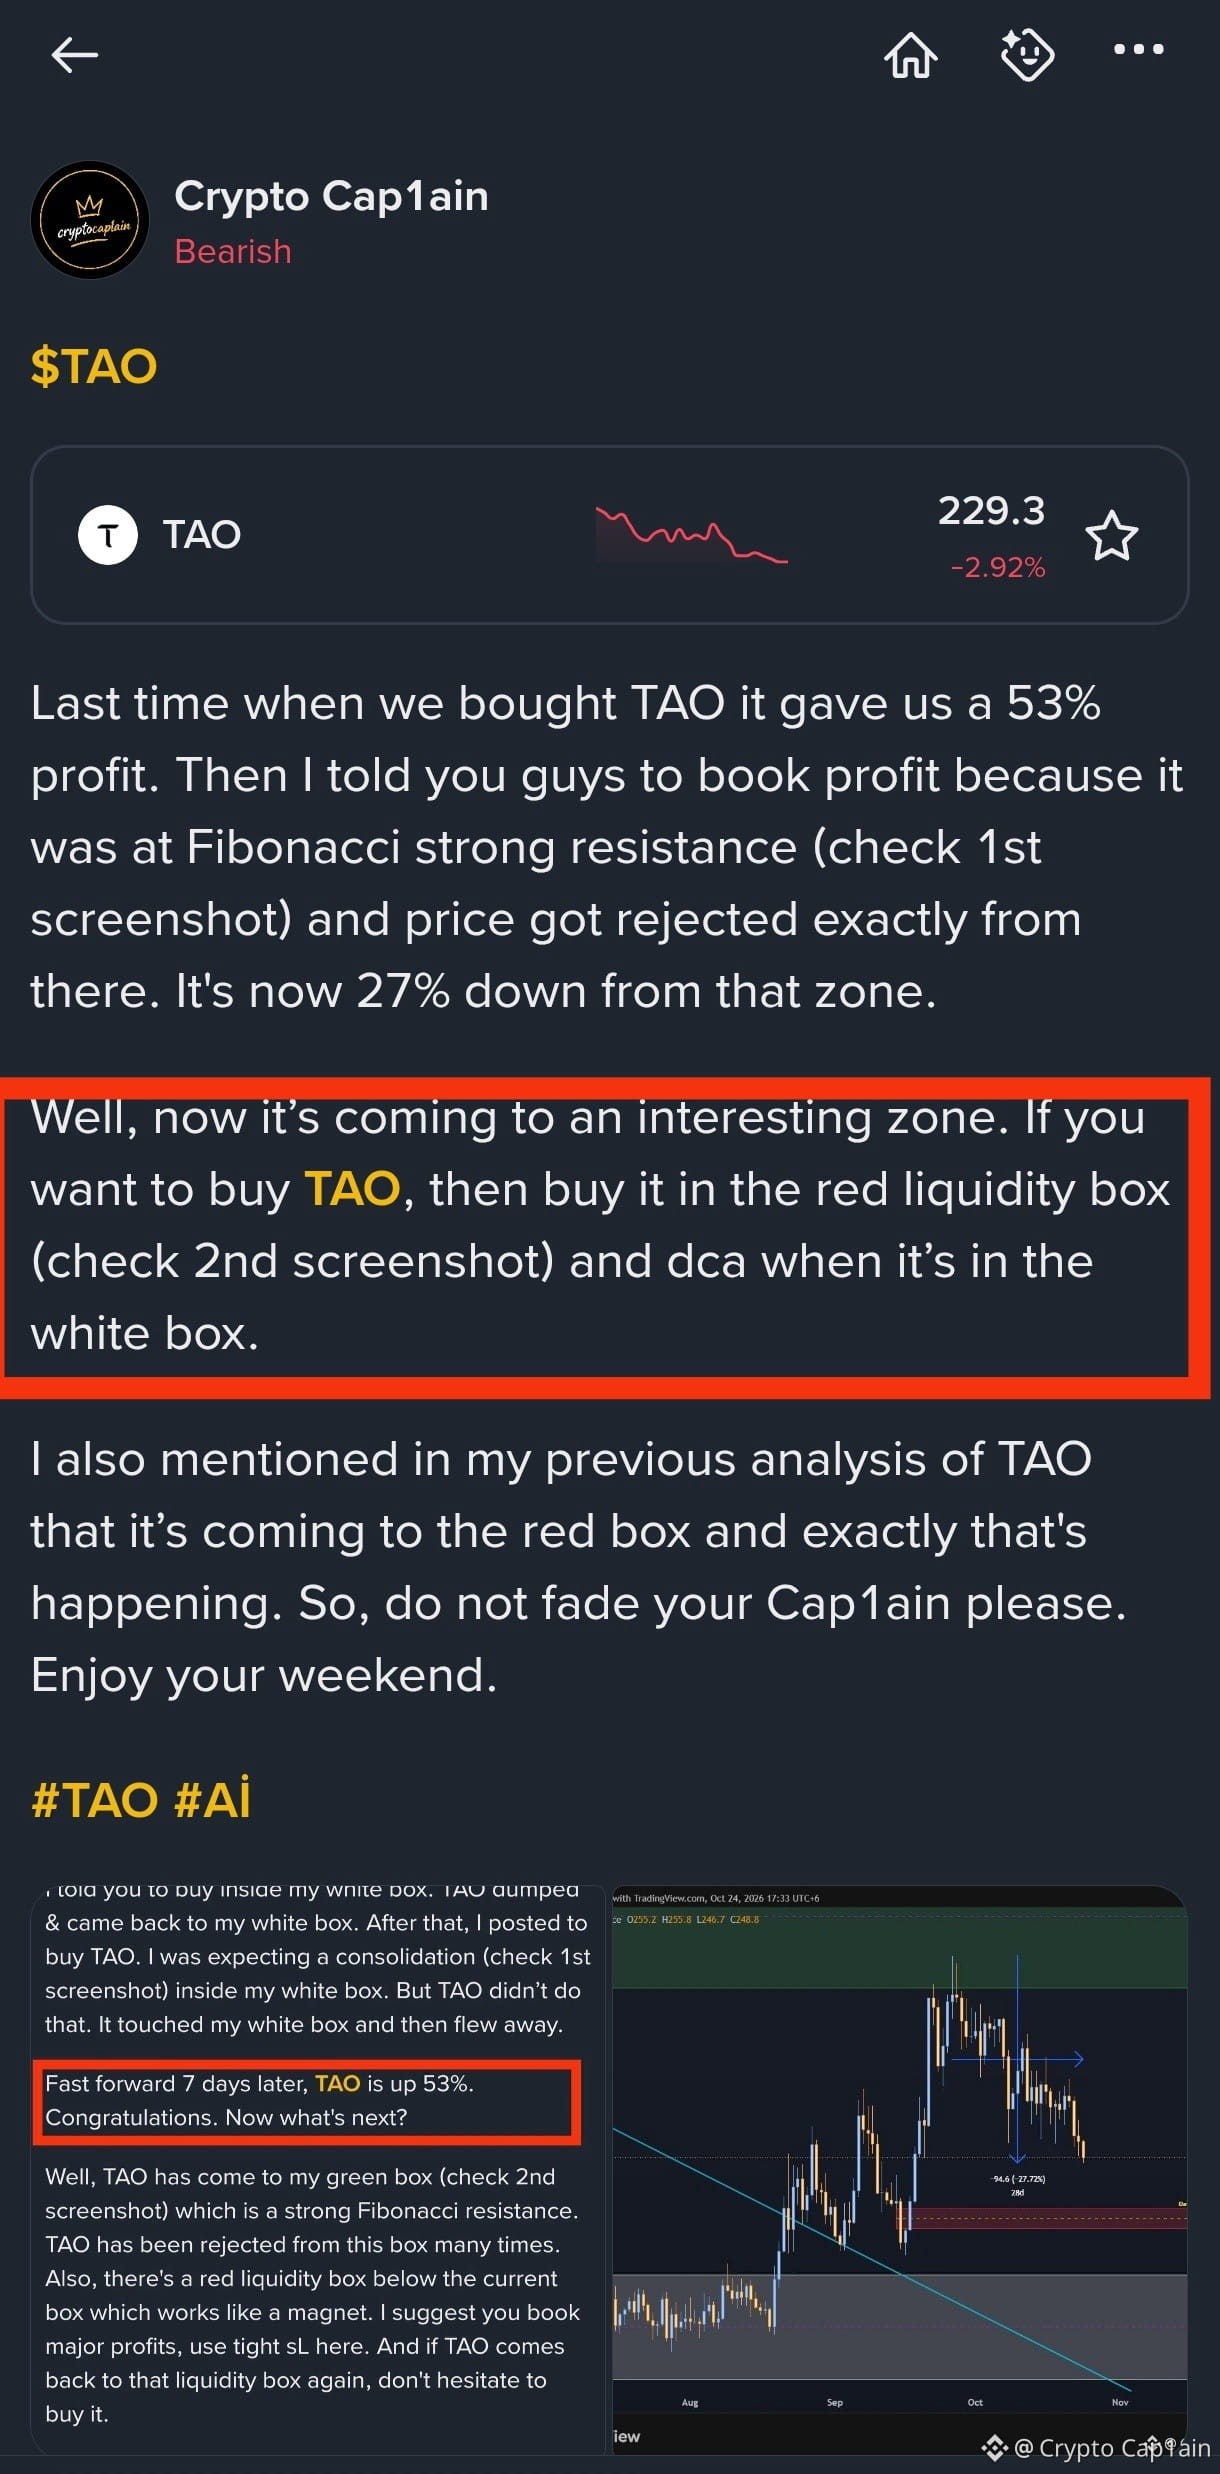
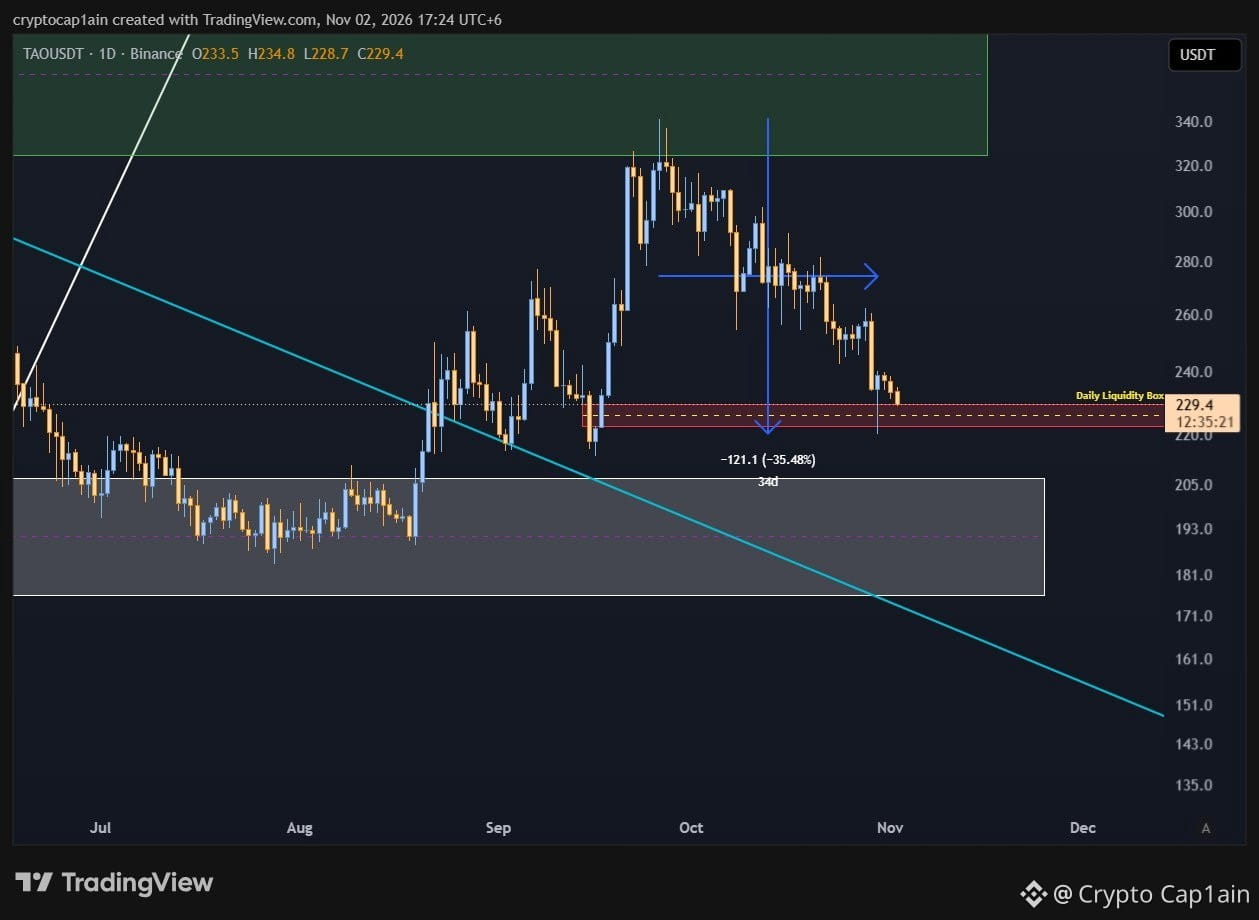
Told you guys that TAO is going down and it has finally hit my red liquidity box.
Price is looking interesting here. Buy small amount and then go for big amount in the white box.
Best of luck.
#TAO #Infrastructure
$TAO
Told you guys that TAO is going down and it has finally hit my red liquidity box.
Price is looking interesting here. Buy small amount and then go for big amount in the white box.
Best of luck.
#TAO #Infrastructure
Told you guys that TAO is going down and it has finally hit my red liquidity box.
Price is looking interesting here. Buy small amount and then go for big amount in the white box.
Best of luck.
#TAO #Infrastructure
4
27
41.8k
·
--
Bearish
$GIGGLE
{spot}(GIGGLEUSDT)
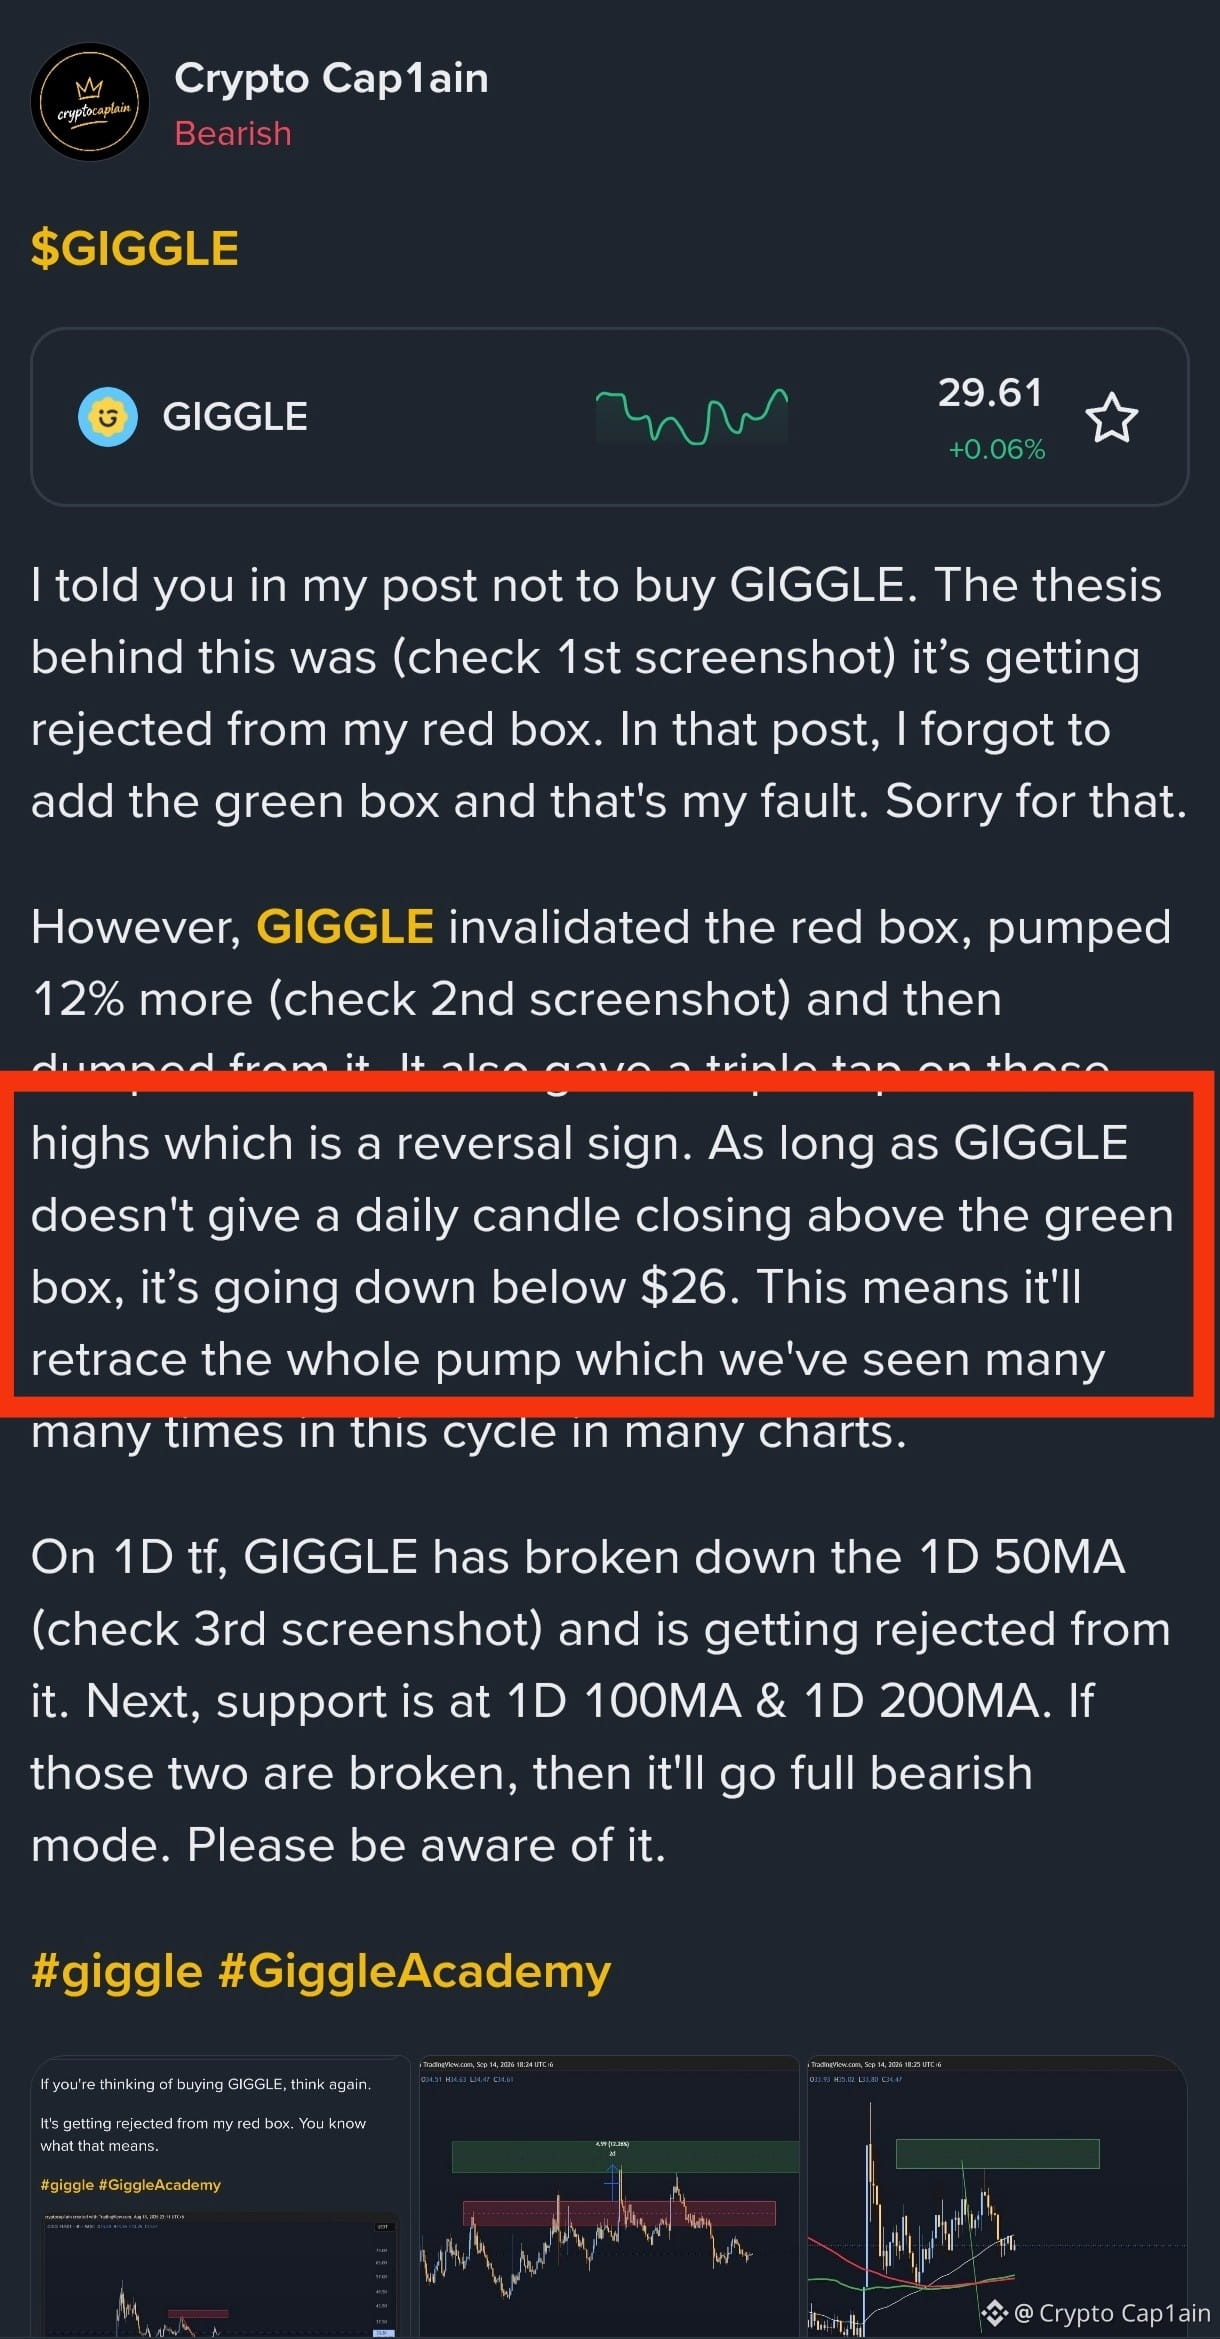
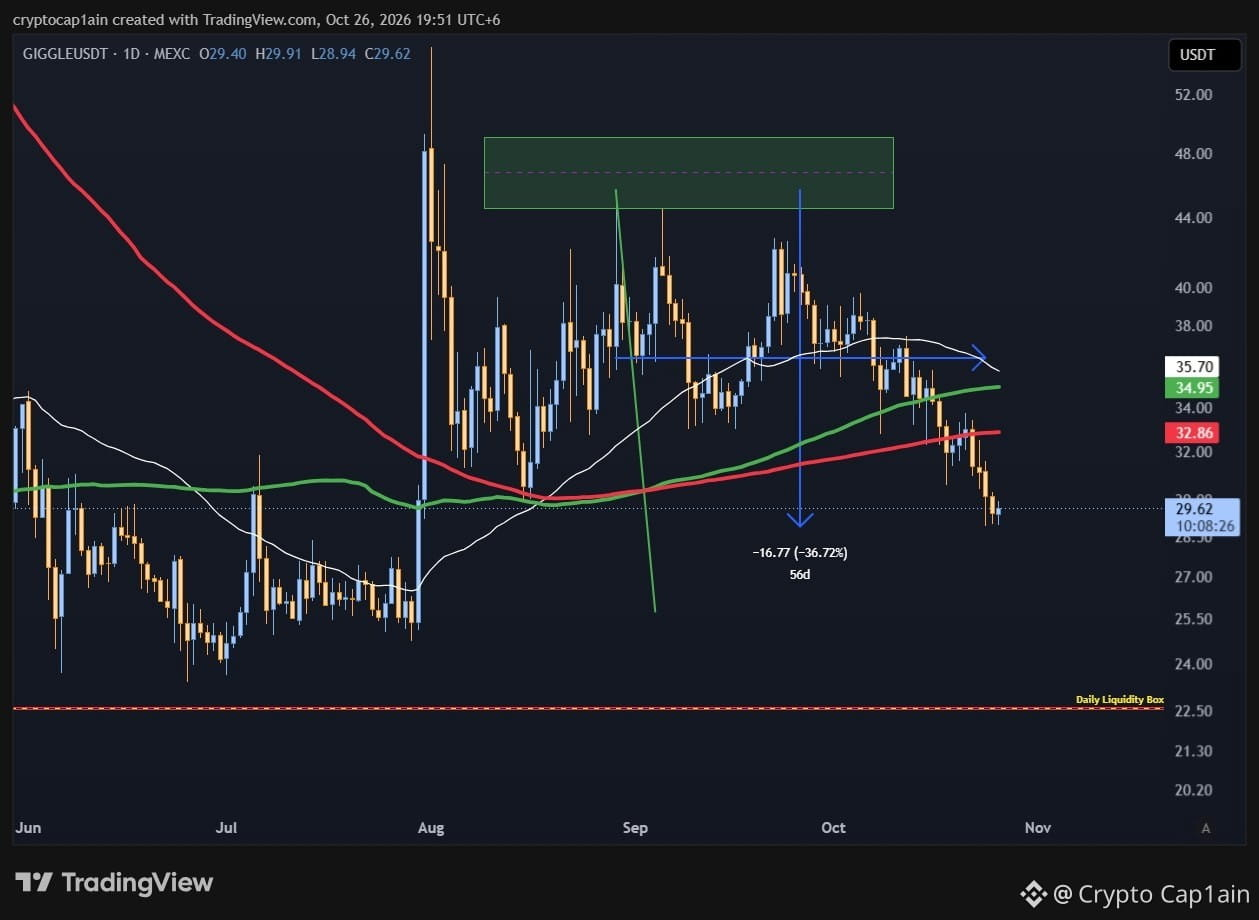
Like I said, GIGGLE is going below $26 and it’s still on the way of achieving this.
Got rejected from my green box and now 36% down. Lost all important MAs on 1D tf. The target remains the same, which is below $26. I will be interested to buy GIGGLE at $22.5
Till then, patience.
#giggle #GiggleAcademy
$GIGGLE
Like I said, GIGGLE is going below $26 and it’s still on the way of achieving this.
Got rejected from my green box and now 36% down. Lost all important MAs on 1D tf. The target remains the same, which is below $26. I will be interested to buy GIGGLE at $22.5
Till then, patience.
#giggle #GiggleAcademy
Like I said, GIGGLE is going below $26 and it’s still on the way of achieving this.
Got rejected from my green box and now 36% down. Lost all important MAs on 1D tf. The target remains the same, which is below $26. I will be interested to buy GIGGLE at $22.5
Till then, patience.
#giggle #GiggleAcademy
2
5
2.8k
$AVAX
{spot}(AVAXUSDT)
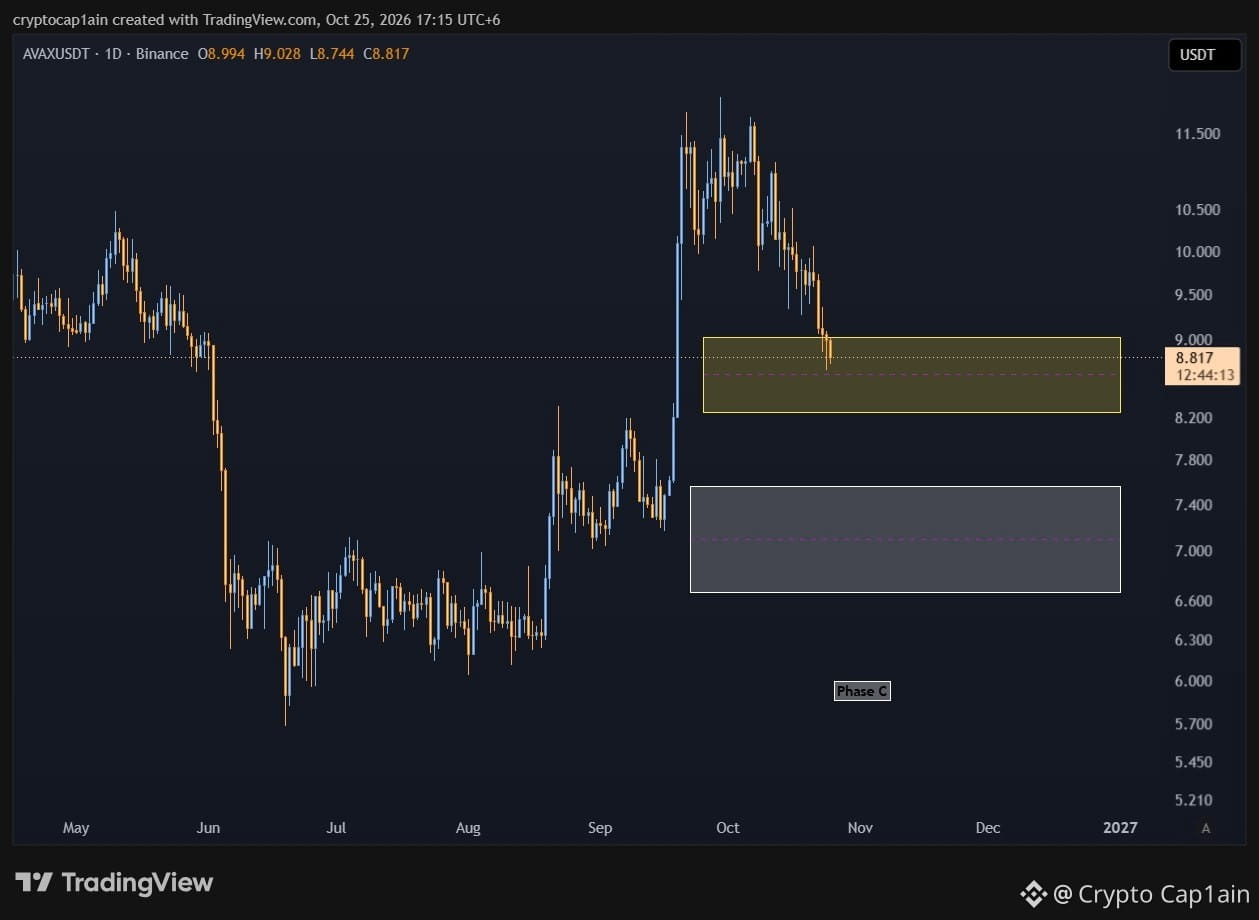
Last time we bought AVAX, it gave us a 63% profit. Now it’s ongoing a correction.
I have put Fibonacci tool on it and drawn two boxes for you. Currently, it’s inside the yellow box. This box is a strong support box. As long as it holds, we can expect a good pump on AVAX from it.
However, if this box fails to hold then a deeper correction is waiting for AVAX. This correction will take AVAX to the white box which is another support.
My advice will be buy some little here and dca at the white box. Let's see what comes next.
#AVAX #Avalanche
$AVAX
Last time we bought AVAX, it gave us a 63% profit. Now it’s ongoing a correction.
I have put Fibonacci tool on it and drawn two boxes for you. Currently, it’s inside the yellow box. This box is a strong support box. As long as it holds, we can expect a good pump on AVAX from it.
However, if this box fails to hold then a deeper correction is waiting for AVAX. This correction will take AVAX to the white box which is another support.
My advice will be buy some little here and dca at the white box. Let's see what comes next.
#AVAX #Avalanche
Last time we bought AVAX, it gave us a 63% profit. Now it’s ongoing a correction.
I have put Fibonacci tool on it and drawn two boxes for you. Currently, it’s inside the yellow box. This box is a strong support box. As long as it holds, we can expect a good pump on AVAX from it.
However, if this box fails to hold then a deeper correction is waiting for AVAX. This correction will take AVAX to the white box which is another support.
My advice will be buy some little here and dca at the white box. Let's see what comes next.
#AVAX #Avalanche
2
8
3.4k
·
--
Bearish
$TAO
{spot}(TAOUSDT)
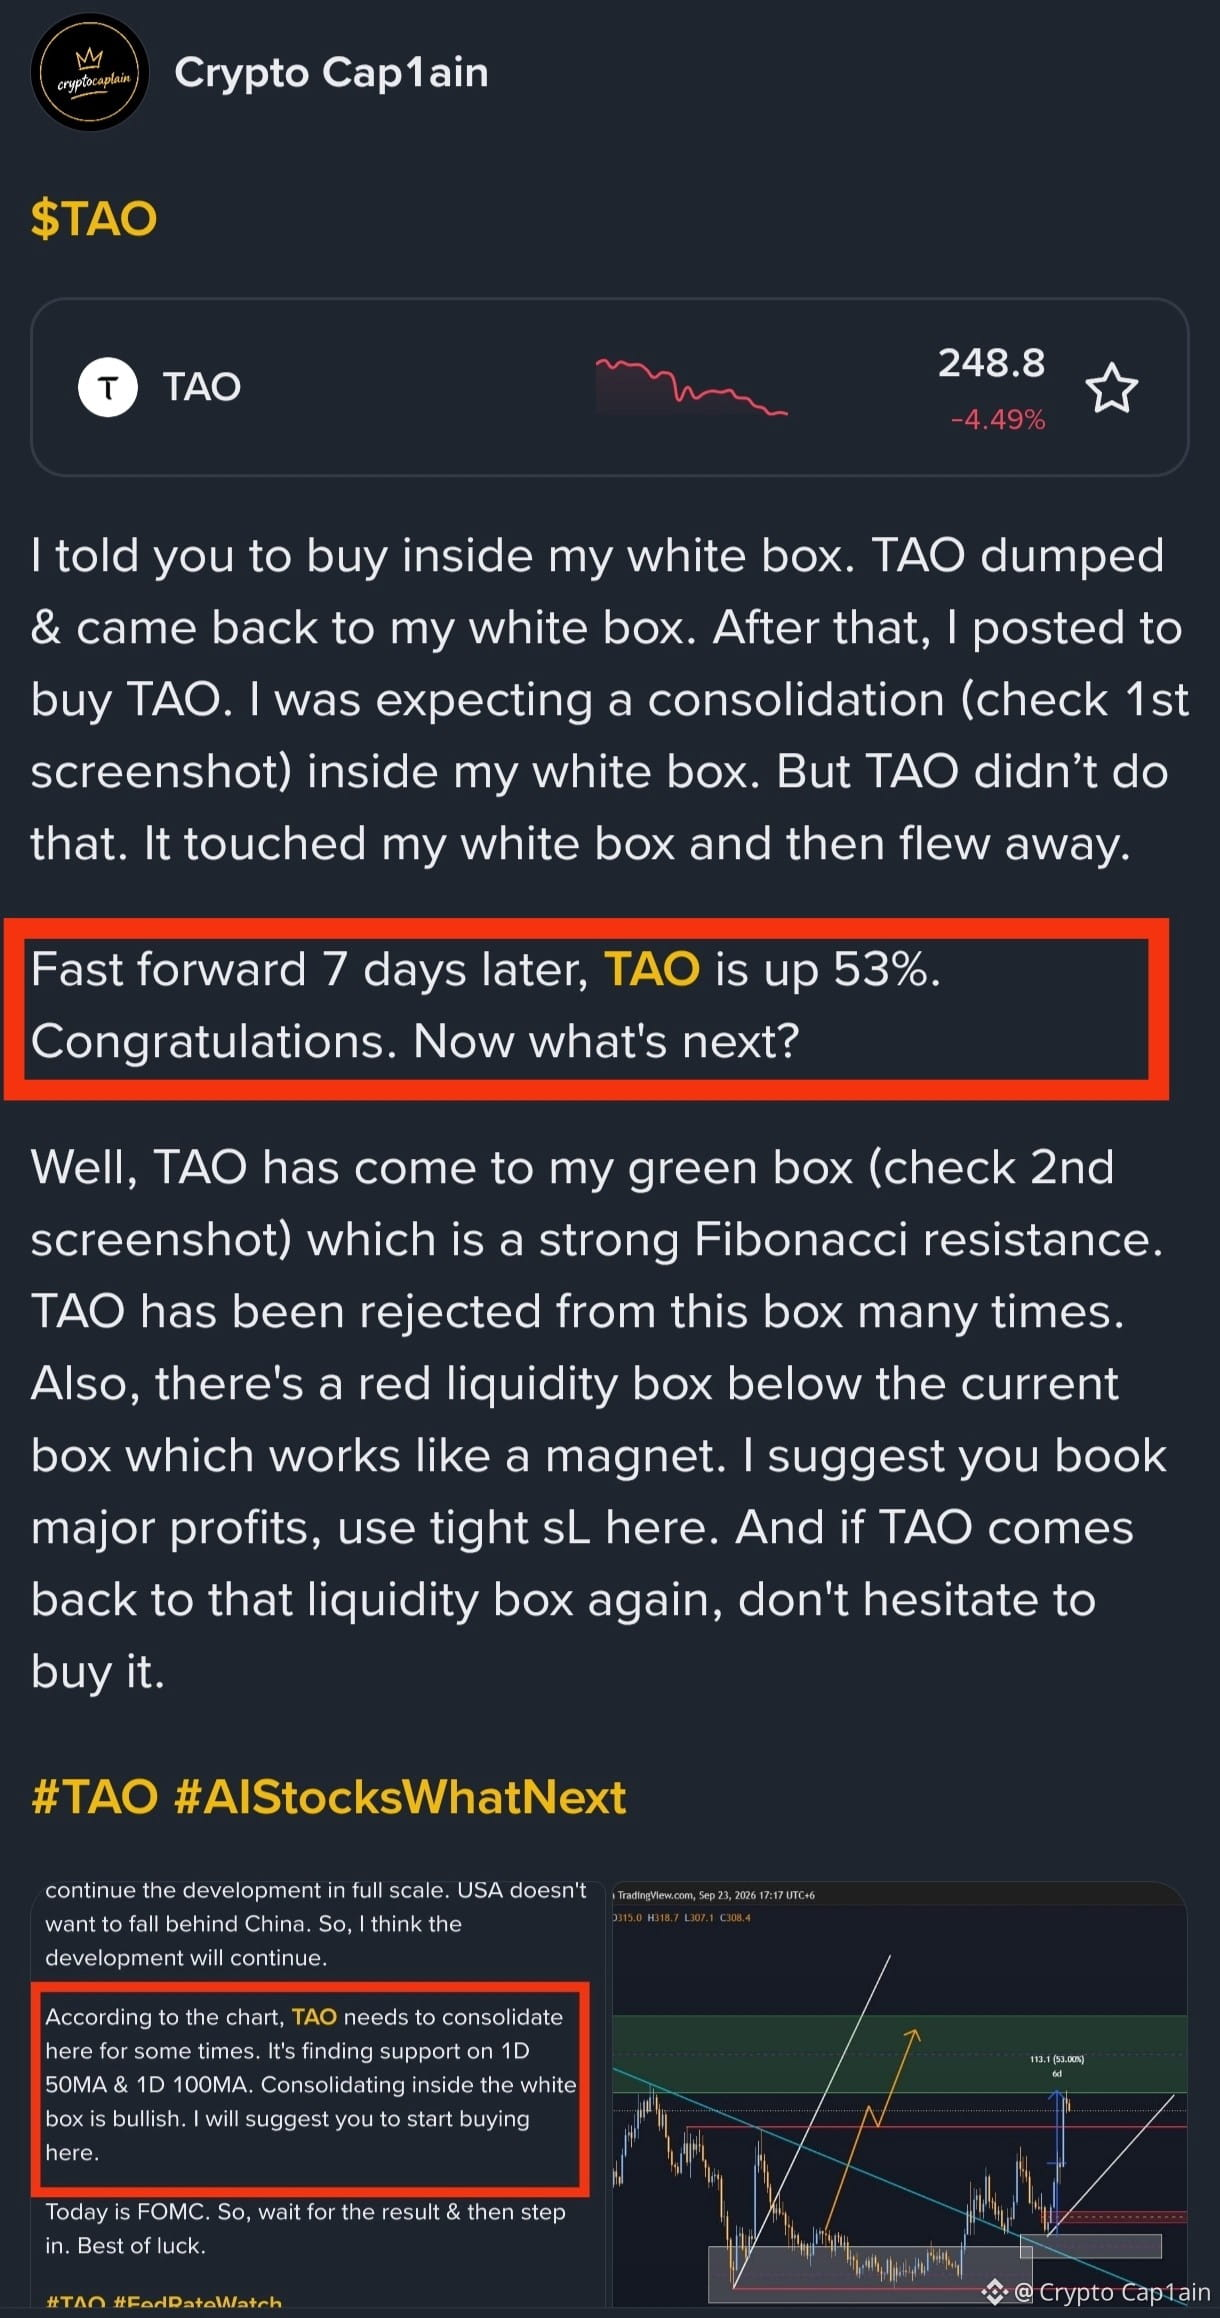
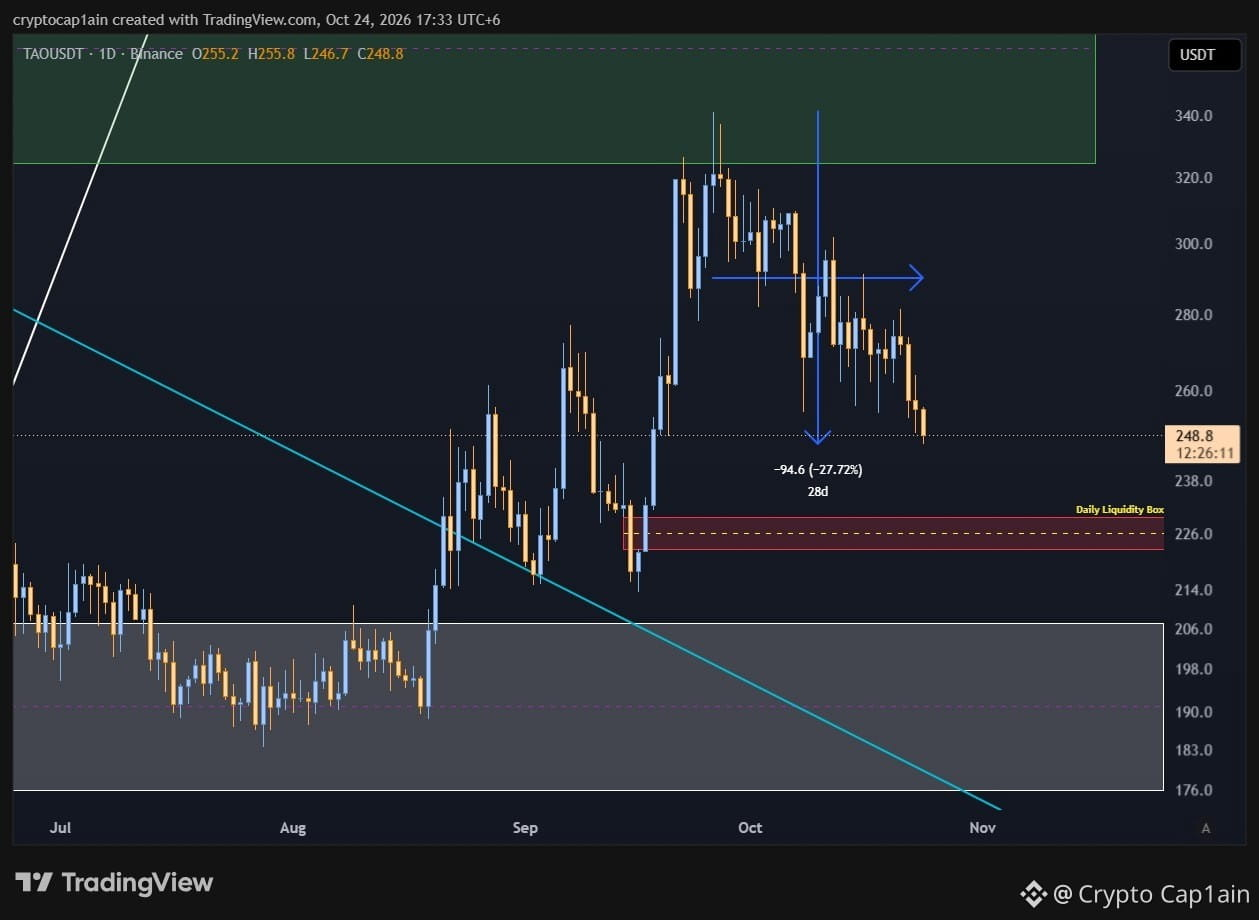
Last time when we bought TAO it gave us a 53% profit. Then I told you guys to book profit because it was at Fibonacci strong resistance (check 1st screenshot) and price got rejected exactly from there. It's now 27% down from that zone.
Well, now it’s coming to an interesting zone. If you want to buy TAO, then buy it in the red liquidity box (check 2nd screenshot) and dca when it’s in the white box.
I also mentioned in my previous analysis of TAO that it’s coming to the red box and exactly that's happening. So, do not fade your Cap1ain please. Enjoy your weekend.
#TAO #Aİ
$TAO
Last time when we bought TAO it gave us a 53% profit. Then I told you guys to book profit because it was at Fibonacci strong resistance (check 1st screenshot) and price got rejected exactly from there. It's now 27% down from that zone.
Well, now it’s coming to an interesting zone. If you want to buy TAO, then buy it in the red liquidity box (check 2nd screenshot) and dca when it’s in the white box.
I also mentioned in my previous analysis of TAO that it’s coming to the red box and exactly that's happening. So, do not fade your Cap1ain please. Enjoy your weekend.
#TAO #Aİ
Last time when we bought TAO it gave us a 53% profit. Then I told you guys to book profit because it was at Fibonacci strong resistance (check 1st screenshot) and price got rejected exactly from there. It's now 27% down from that zone.
Well, now it’s coming to an interesting zone. If you want to buy TAO, then buy it in the red liquidity box (check 2nd screenshot) and dca when it’s in the white box.
I also mentioned in my previous analysis of TAO that it’s coming to the red box and exactly that's happening. So, do not fade your Cap1ain please. Enjoy your weekend.
#TAO #Aİ
2
3
1.7k
·
--
Bearish
$ZEC
{spot}(ZECUSDT)
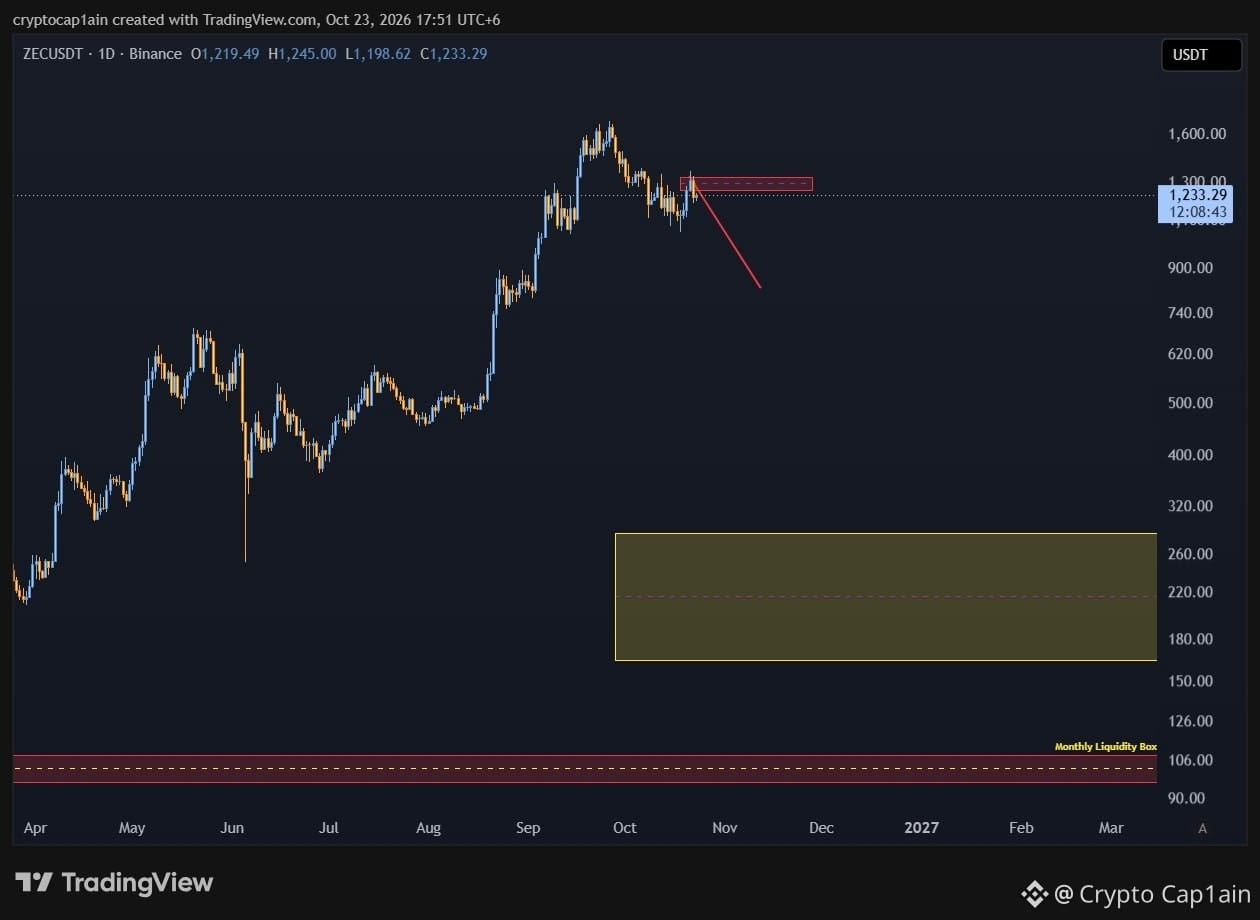
ZEC had the biggest bull run in this cycle. But will it continue the trend? Or a biggest crash coming to ZEC after the biggest pump?
Well, a wise man once said that WHAT GOES UP MUST COME DOWN. Same thing is happening to ZEC. On 1D tf, it is making a Head and Shoulder pattern which is a reversal sign. So, a reversal is coming to it.
I have put Fibonacci tool on it and drawn the red and yellow boxes for you. It is getting rejected from the red box which is strong Fibonacci resistance. As long as it holds, ZEC is coming below $900
I will be buying ZEC. But not now. My first buy will be at the yellow box. And my second buy will be at the monthly liquidity box. Remember, it is a bigger tf analysis. So it will take a long time to execute. Thus, have patience.
#zec #Privacy
$ZEC
ZEC had the biggest bull run in this cycle. But will it continue the trend? Or a biggest crash coming to ZEC after the biggest pump?
Well, a wise man once said that WHAT GOES UP MUST COME DOWN. Same thing is happening to ZEC. On 1D tf, it is making a Head and Shoulder pattern which is a reversal sign. So, a reversal is coming to it.
I have put Fibonacci tool on it and drawn the red and yellow boxes for you. It is getting rejected from the red box which is strong Fibonacci resistance. As long as it holds, ZEC is coming below $900
I will be buying ZEC. But not now. My first buy will be at the yellow box. And my second buy will be at the monthly liquidity box. Remember, it is a bigger tf analysis. So it will take a long time to execute. Thus, have patience.
#zec #Privacy
ZEC had the biggest bull run in this cycle. But will it continue the trend? Or a biggest crash coming to ZEC after the biggest pump?
Well, a wise man once said that WHAT GOES UP MUST COME DOWN. Same thing is happening to ZEC. On 1D tf, it is making a Head and Shoulder pattern which is a reversal sign. So, a reversal is coming to it.
I have put Fibonacci tool on it and drawn the red and yellow boxes for you. It is getting rejected from the red box which is strong Fibonacci resistance. As long as it holds, ZEC is coming below $900
I will be buying ZEC. But not now. My first buy will be at the yellow box. And my second buy will be at the monthly liquidity box. Remember, it is a bigger tf analysis. So it will take a long time to execute. Thus, have patience.
#zec #Privacy
2
1.5k
·
--
Bullish
$4
{alpha}(560x0a43fc31a73013089df59194872ecae4cae14444)
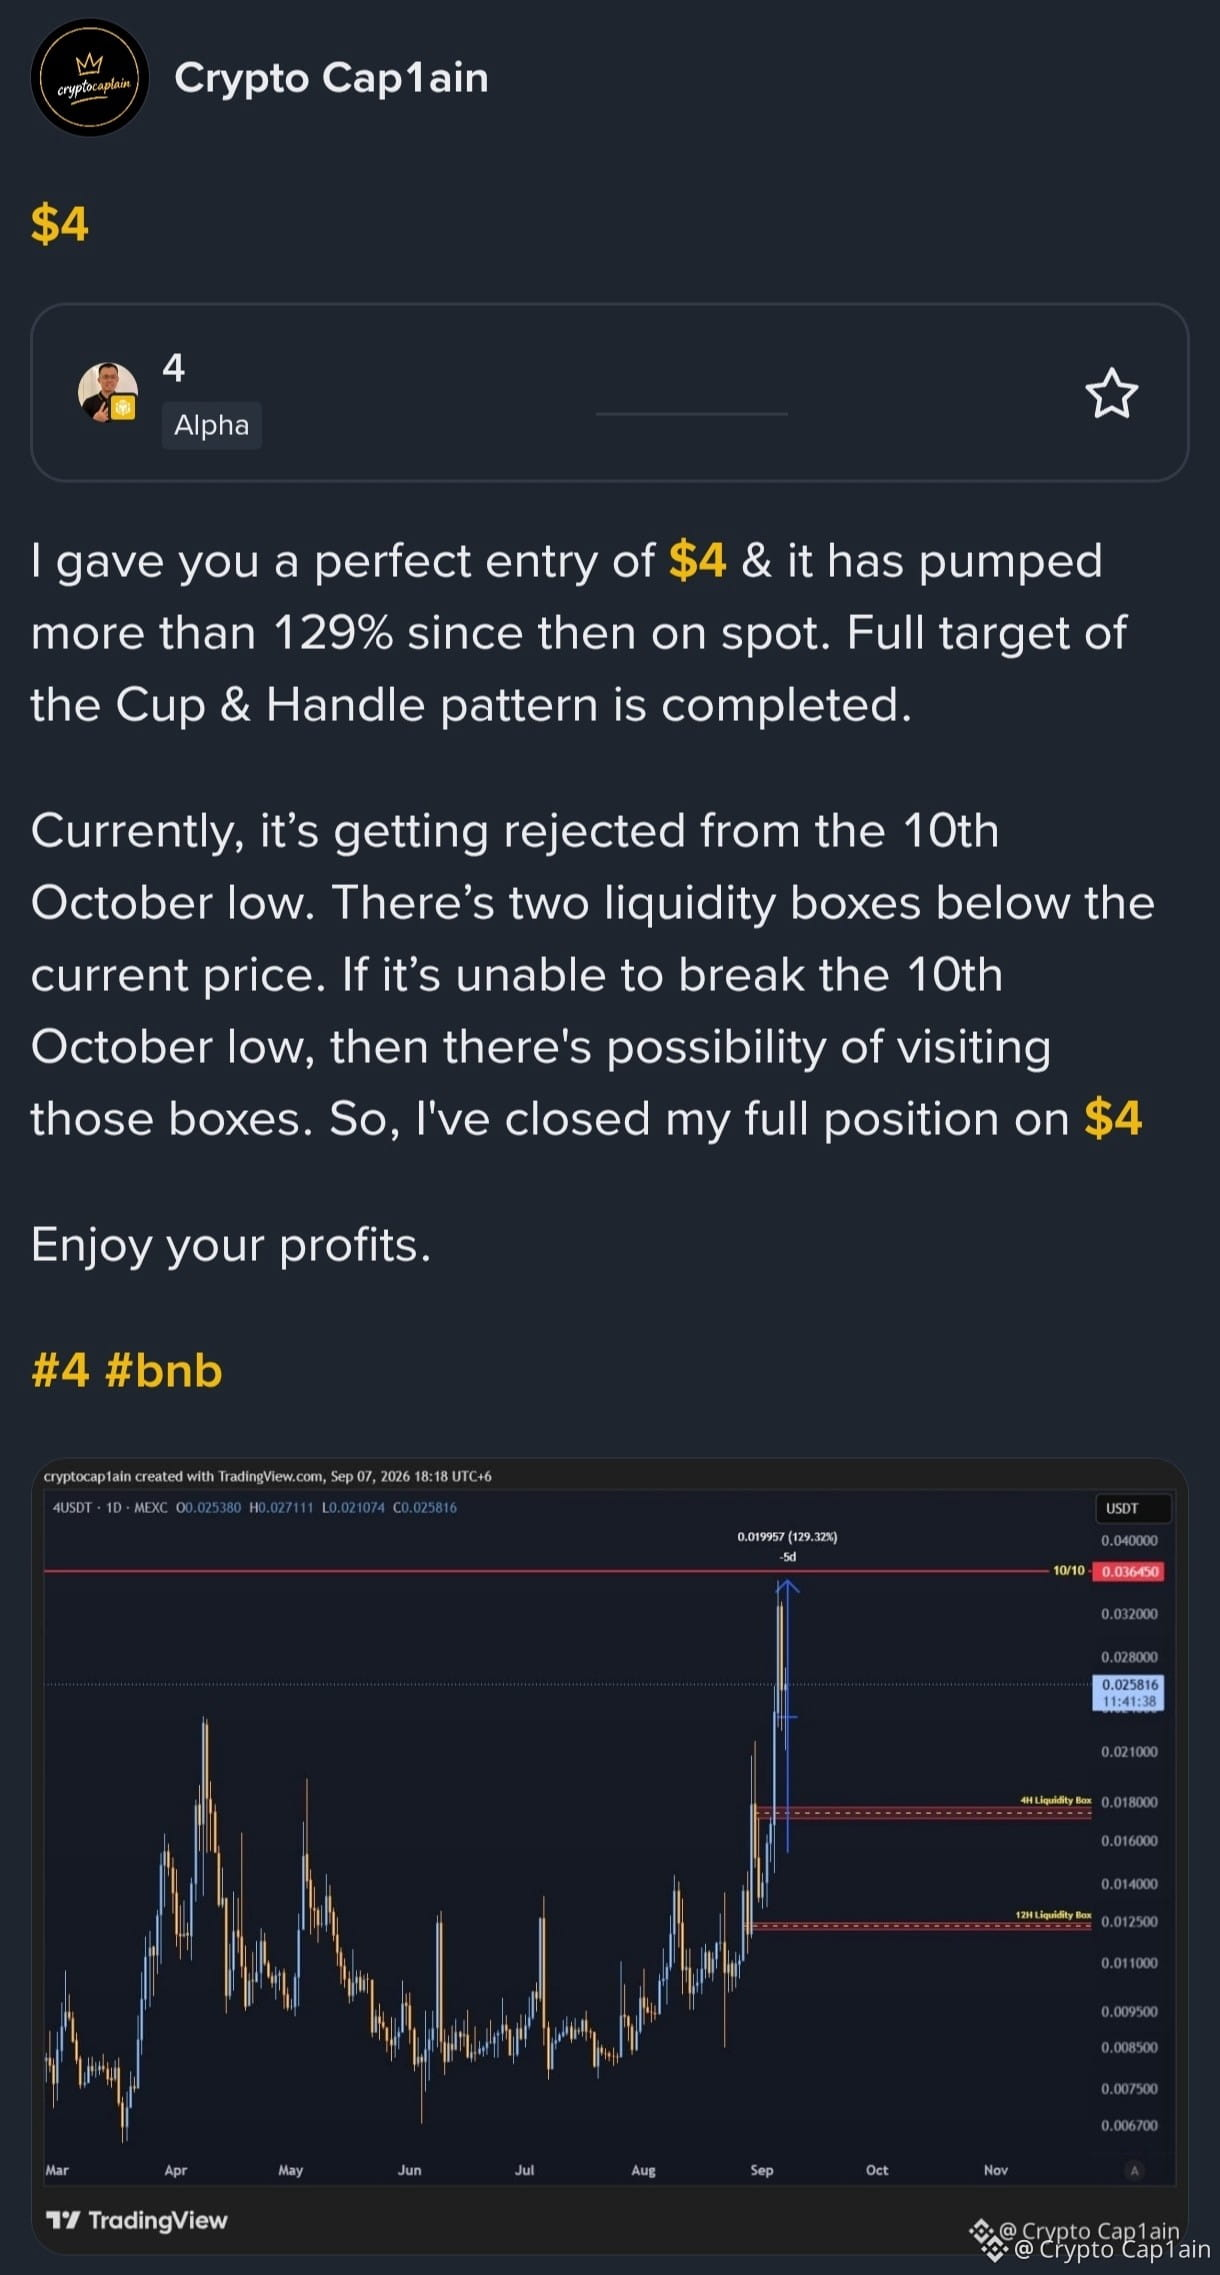
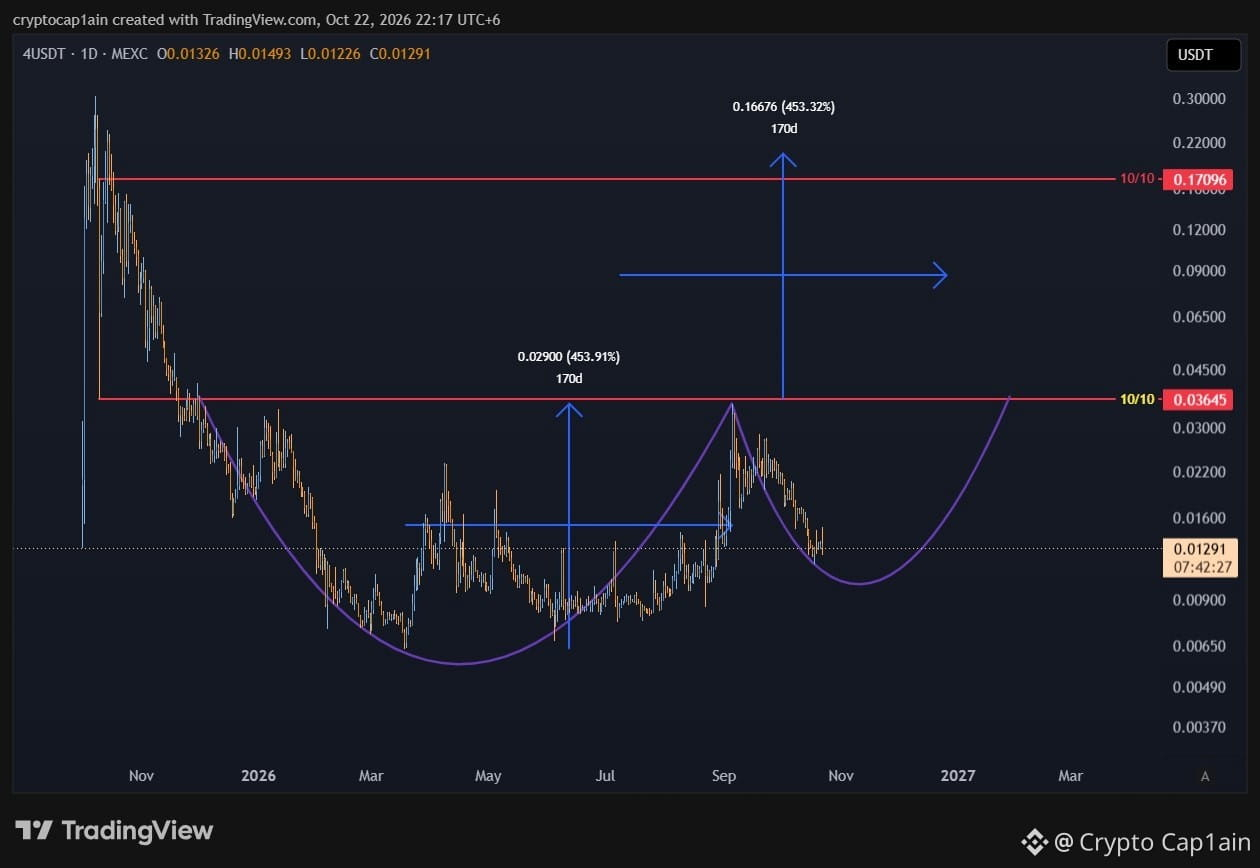
Last time when we bought 4 it gave us a 129% (check 1st screenshot) profit. After we closed the trade, it had round tipped the whole pump. Now it is looking good to buy again.
On 1D tf, 4 is making a cup and handle pattern (check 2nd screenshot) where it is currently in the process of making the handle. 4 should consolidate here for some days, pick up enough fuel and then shoot to the neckline which is also the 10th October low.
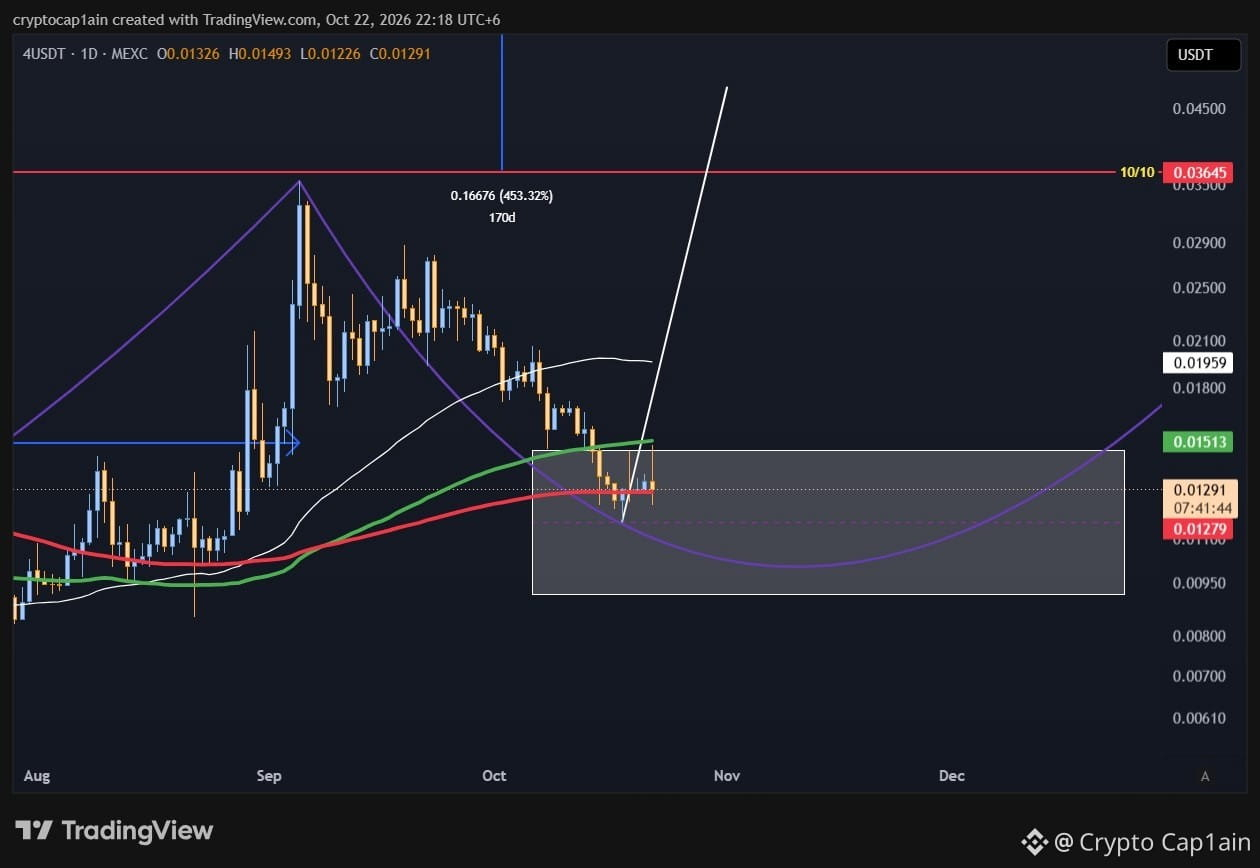
I have put the Fibonacci tool and drawn the white box (check 3rd screenshot) for you. Currently, it is in between the 1D 200MA and 1D 100MA. First task is to reclaim all three MAs and then we can expect the required pump from it.
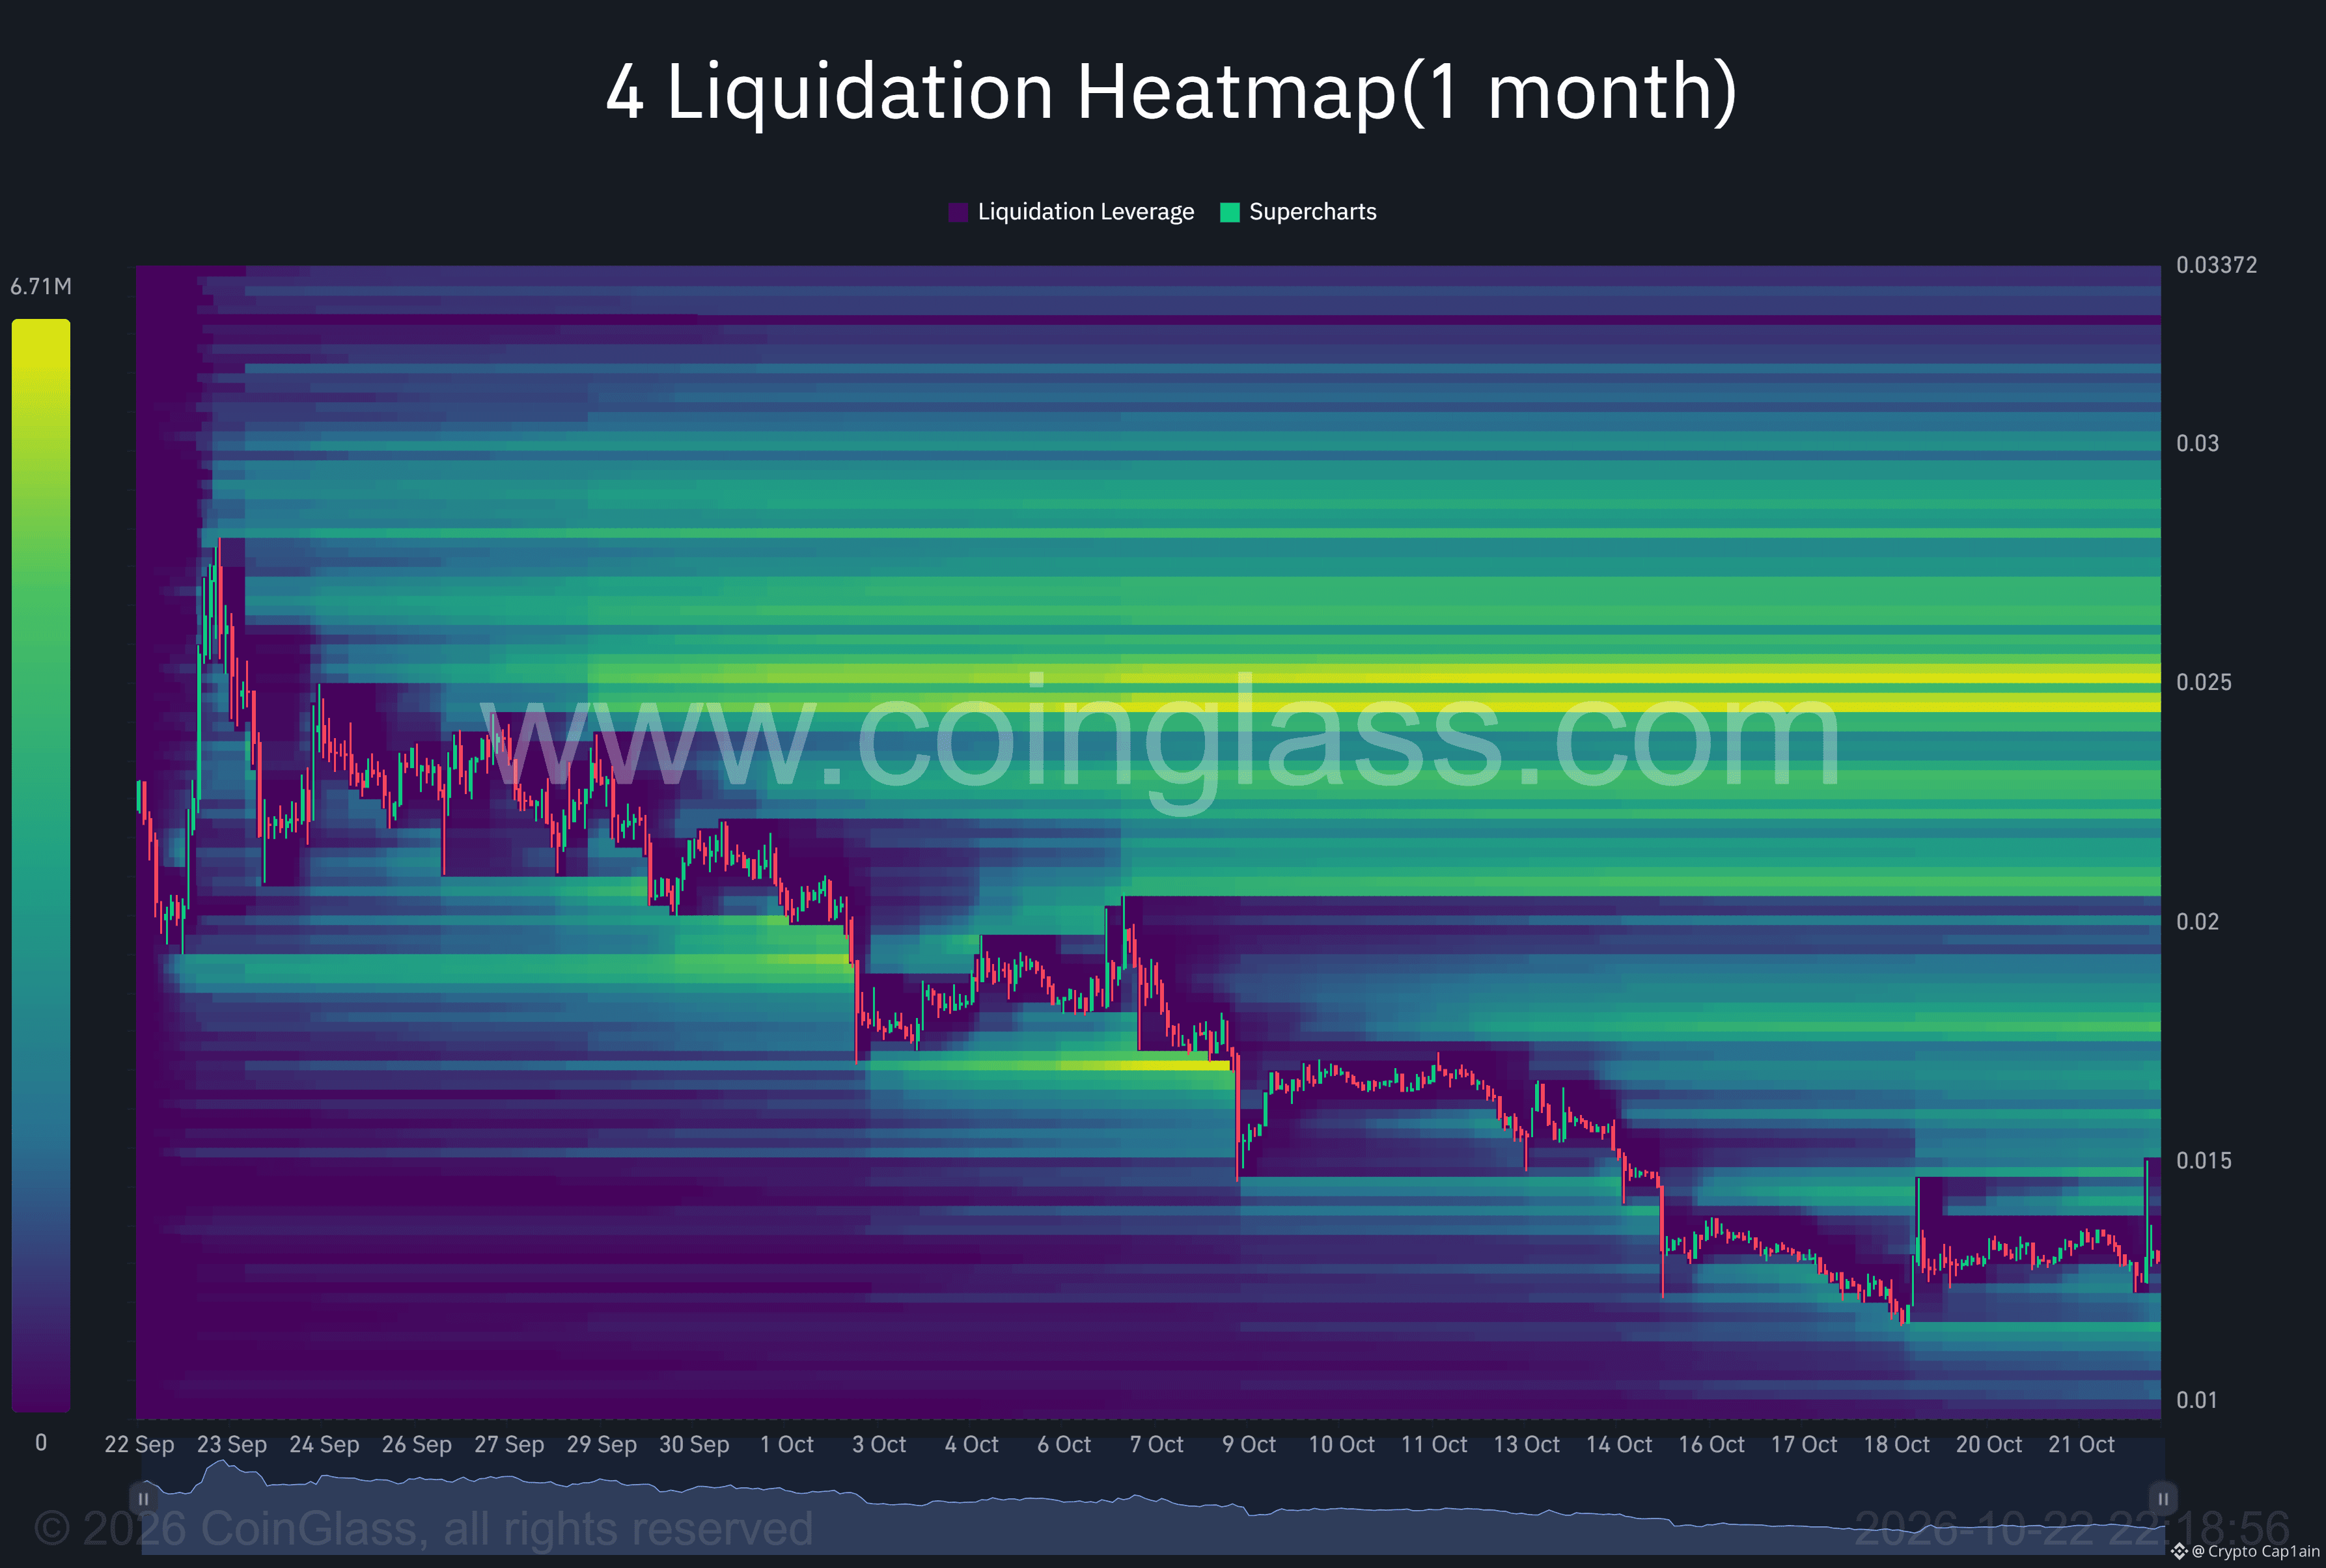
Liquidity Heatmap (check 4th screenshot) is showing that there are around $12M shorts waiting to be liquidated at $0.025 zone. That will be our first target which is around 95% up from here. That's a big profit if it happens.
#4 #memecoin
$4
Last time when we bought 4 it gave us a 129% (check 1st screenshot) profit. After we closed the trade, it had round tipped the whole pump. Now it is looking good to buy again.
On 1D tf, 4 is making a cup and handle pattern (check 2nd screenshot) where it is currently in the process of making the handle. 4 should consolidate here for some days, pick up enough fuel and then shoot to the neckline which is also the 10th October low.
I have put the Fibonacci tool and drawn the white box (check 3rd screenshot) for you. Currently, it is in between the 1D 200MA and 1D 100MA. First task is to reclaim all three MAs and then we can expect the required pump from it.
Liquidity Heatmap (check 4th screenshot) is showing that there are around $12M shorts waiting to be liquidated at $0.025 zone. That will be our first target which is around 95% up from here. That's a big profit if it happens.
#4 #memecoin
Last time when we bought 4 it gave us a 129% (check 1st screenshot) profit. After we closed the trade, it had round tipped the whole pump. Now it is looking good to buy again.
On 1D tf, 4 is making a cup and handle pattern (check 2nd screenshot) where it is currently in the process of making the handle. 4 should consolidate here for some days, pick up enough fuel and then shoot to the neckline which is also the 10th October low.
I have put the Fibonacci tool and drawn the white box (check 3rd screenshot) for you. Currently, it is in between the 1D 200MA and 1D 100MA. First task is to reclaim all three MAs and then we can expect the required pump from it.
Liquidity Heatmap (check 4th screenshot) is showing that there are around $12M shorts waiting to be liquidated at $0.025 zone. That will be our first target which is around 95% up from here. That's a big profit if it happens.
#4 #memecoin
4
4
1.4k
·
--
Bearish
$SPCXB
{spot}(SPCXBUSDT)
We have traded crypto coins. Let's check some stocks.
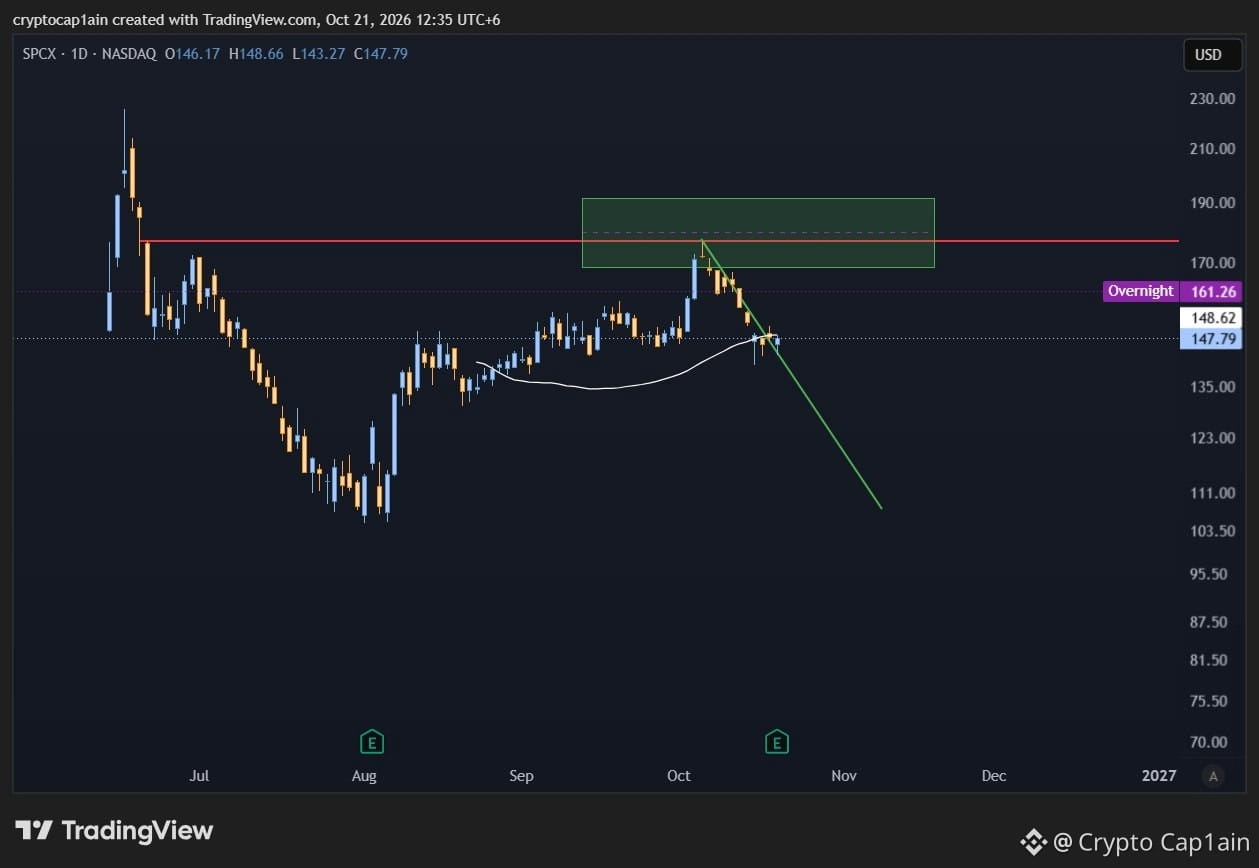
SPCX earning is released and it’s very much positive. However, this positiveness is not reflecting on the chart. On 1D tf, price went to my green box which is a Fibonacci resistance and getting rejected from it. The full target of it is $111
Also, SPCX has broken down the 1D 50MA closing three daily candles below it which is bearish. As long as its below the 1D 50MA, it’s not wise to buy it right now. Wait for the dust to be settled.
However, there's a liquidity box remaining to be hit inside my green box. Price can revisit there only to get rejected again to go lower. It seems SPCX is going to have some tough times in the coming days.
#EarningsSeason #SpaceX
$SPCXB
We have traded crypto coins. Let's check some stocks.
SPCX earning is released and it’s very much positive. However, this positiveness is not reflecting on the chart. On 1D tf, price went to my green box which is a Fibonacci resistance and getting rejected from it. The full target of it is $111
Also, SPCX has broken down the 1D 50MA closing three daily candles below it which is bearish. As long as its below the 1D 50MA, it’s not wise to buy it right now. Wait for the dust to be settled.
However, there's a liquidity box remaining to be hit inside my green box. Price can revisit there only to get rejected again to go lower. It seems SPCX is going to have some tough times in the coming days.
#EarningsSeason #SpaceX
We have traded crypto coins. Let's check some stocks.
SPCX earning is released and it’s very much positive. However, this positiveness is not reflecting on the chart. On 1D tf, price went to my green box which is a Fibonacci resistance and getting rejected from it. The full target of it is $111
Also, SPCX has broken down the 1D 50MA closing three daily candles below it which is bearish. As long as its below the 1D 50MA, it’s not wise to buy it right now. Wait for the dust to be settled.
However, there's a liquidity box remaining to be hit inside my green box. Price can revisit there only to get rejected again to go lower. It seems SPCX is going to have some tough times in the coming days.
#EarningsSeason #SpaceX
1
312
Log in to explore more content
Join global crypto users on Binance Square
⚡️ Get latest and useful information about crypto.
💬 Trusted by the world’s largest crypto exchange.
👍 Discover real insights from verified creators.
Email / Phone number
Trending Topics
WhoWillSucceedJensenHuangatNvidia?
85,606 views
1,143 Discussing
Nvidia Says No CEO Talks Underway as "Stand With Jensen" Petition Tops 77,900 Signatures
Binance News
·28 Likes
·36.9k views
WhatWillDriveCryptoandStocks’NextRebound?
439,239 views
3,050 Discussing
BitcoinActiveSupplyInProfitDropsBelow45%
24,530 views
357 Discussing