
#chartpatterns
chartpatterns
659,059 views
2,113 Discussing
Hot
Latest

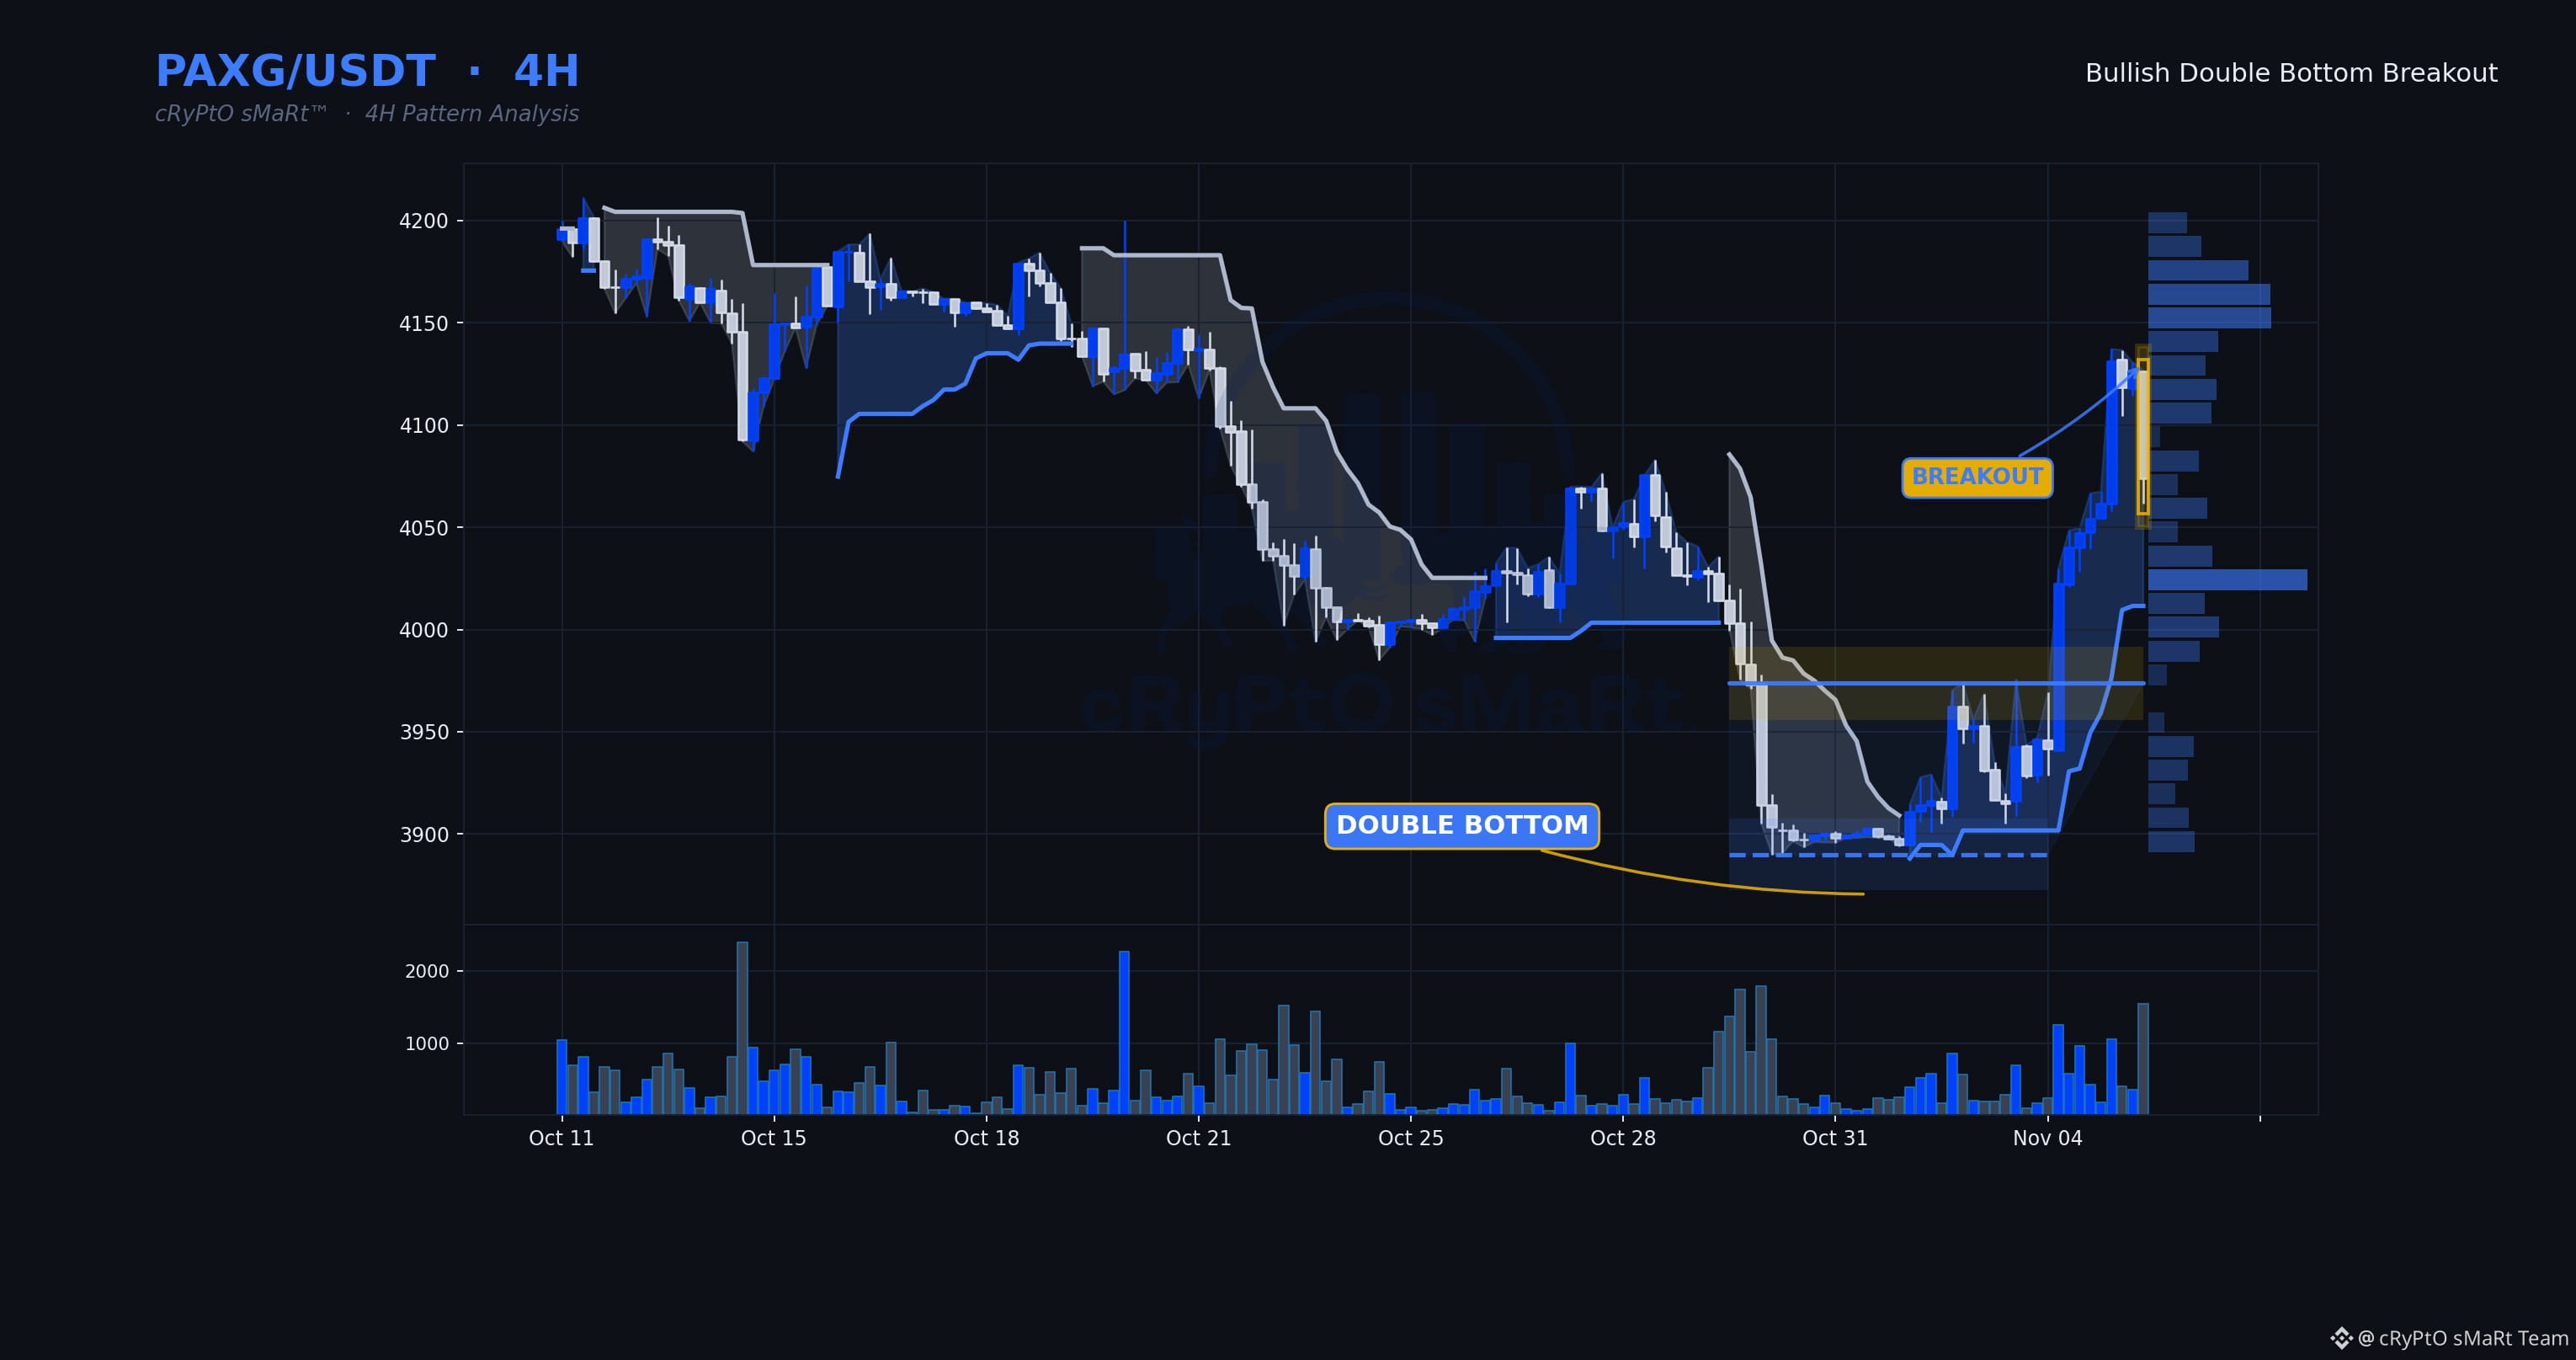
Buyers just took out the neckline on a double bottom with volume stepping up well above average — that's not a drift higher, that's participation showing up at the decision point. Momentum still has room before anything looks stretched, which matters for a breakout this clean.
🗓 Daily: Neutral — daily is mixed — Supertrend and EMAs not aligned
⏱ 4H: Double Bottom · Bullish bias
⏳ 1H: price is above the level but the 1H trend hasn't turned up yet — a 1H close that flips the trend up is the trigger.
📋 WHY IT QUALIFIES
✓ Double Bottom structure completed
✓ Decisive breakout — closed 2.5% beyond the line
✓ Volume 2.9× its 20-bar average
✓ RSI 63 — momentum confirms, not yet exhausted
🧭 Bias: Bullish while price holds above $3,973.74
⚠️ Invalidation: 4H close back below $3,973.74
🔵 Support $3,890.00 🟡 Resistance $3,973.74
$PAXG $BTC #ChartPatterns
Education only, not financial advice.
Buyers just took out the neckline on a double bottom with volume stepping up well above average — that's not a drift higher, that's participation showing up at the decision point. Momentum still has room before anything looks stretched, which matters for a breakout this clean.
🗓 Daily: Neutral — daily is mixed — Supertrend and EMAs not aligned
⏱ 4H: Double Bottom · Bullish bias
⏳ 1H: price is above the level but the 1H trend hasn't turned up yet — a 1H close that flips the trend up is the trigger.
📋 WHY IT QUALIFIES
✓ Double Bottom structure completed
✓ Decisive breakout — closed 2.5% beyond the line
✓ Volume 2.9× its 20-bar average
✓ RSI 63 — momentum confirms, not yet exhausted
🧭 Bias: Bullish while price holds above $3,973.74
⚠️ Invalidation: 4H close back below $3,973.74
🔵 Support $3,890.00 🟡 Resistance $3,973.74
$PAXG $BTC #ChartPatterns
Education only, not financial advice.
🗓 Daily: Neutral — daily is mixed — Supertrend and EMAs not aligned
⏱ 4H: Double Bottom · Bullish bias
⏳ 1H: price is above the level but the 1H trend hasn't turned up yet — a 1H close that flips the trend up is the trigger.
📋 WHY IT QUALIFIES
✓ Double Bottom structure completed
✓ Decisive breakout — closed 2.5% beyond the line
✓ Volume 2.9× its 20-bar average
✓ RSI 63 — momentum confirms, not yet exhausted
🧭 Bias: Bullish while price holds above $3,973.74
⚠️ Invalidation: 4H close back below $3,973.74
🔵 Support $3,890.00 🟡 Resistance $3,973.74
$PAXG $BTC #ChartPatterns
Education only, not financial advice.
156
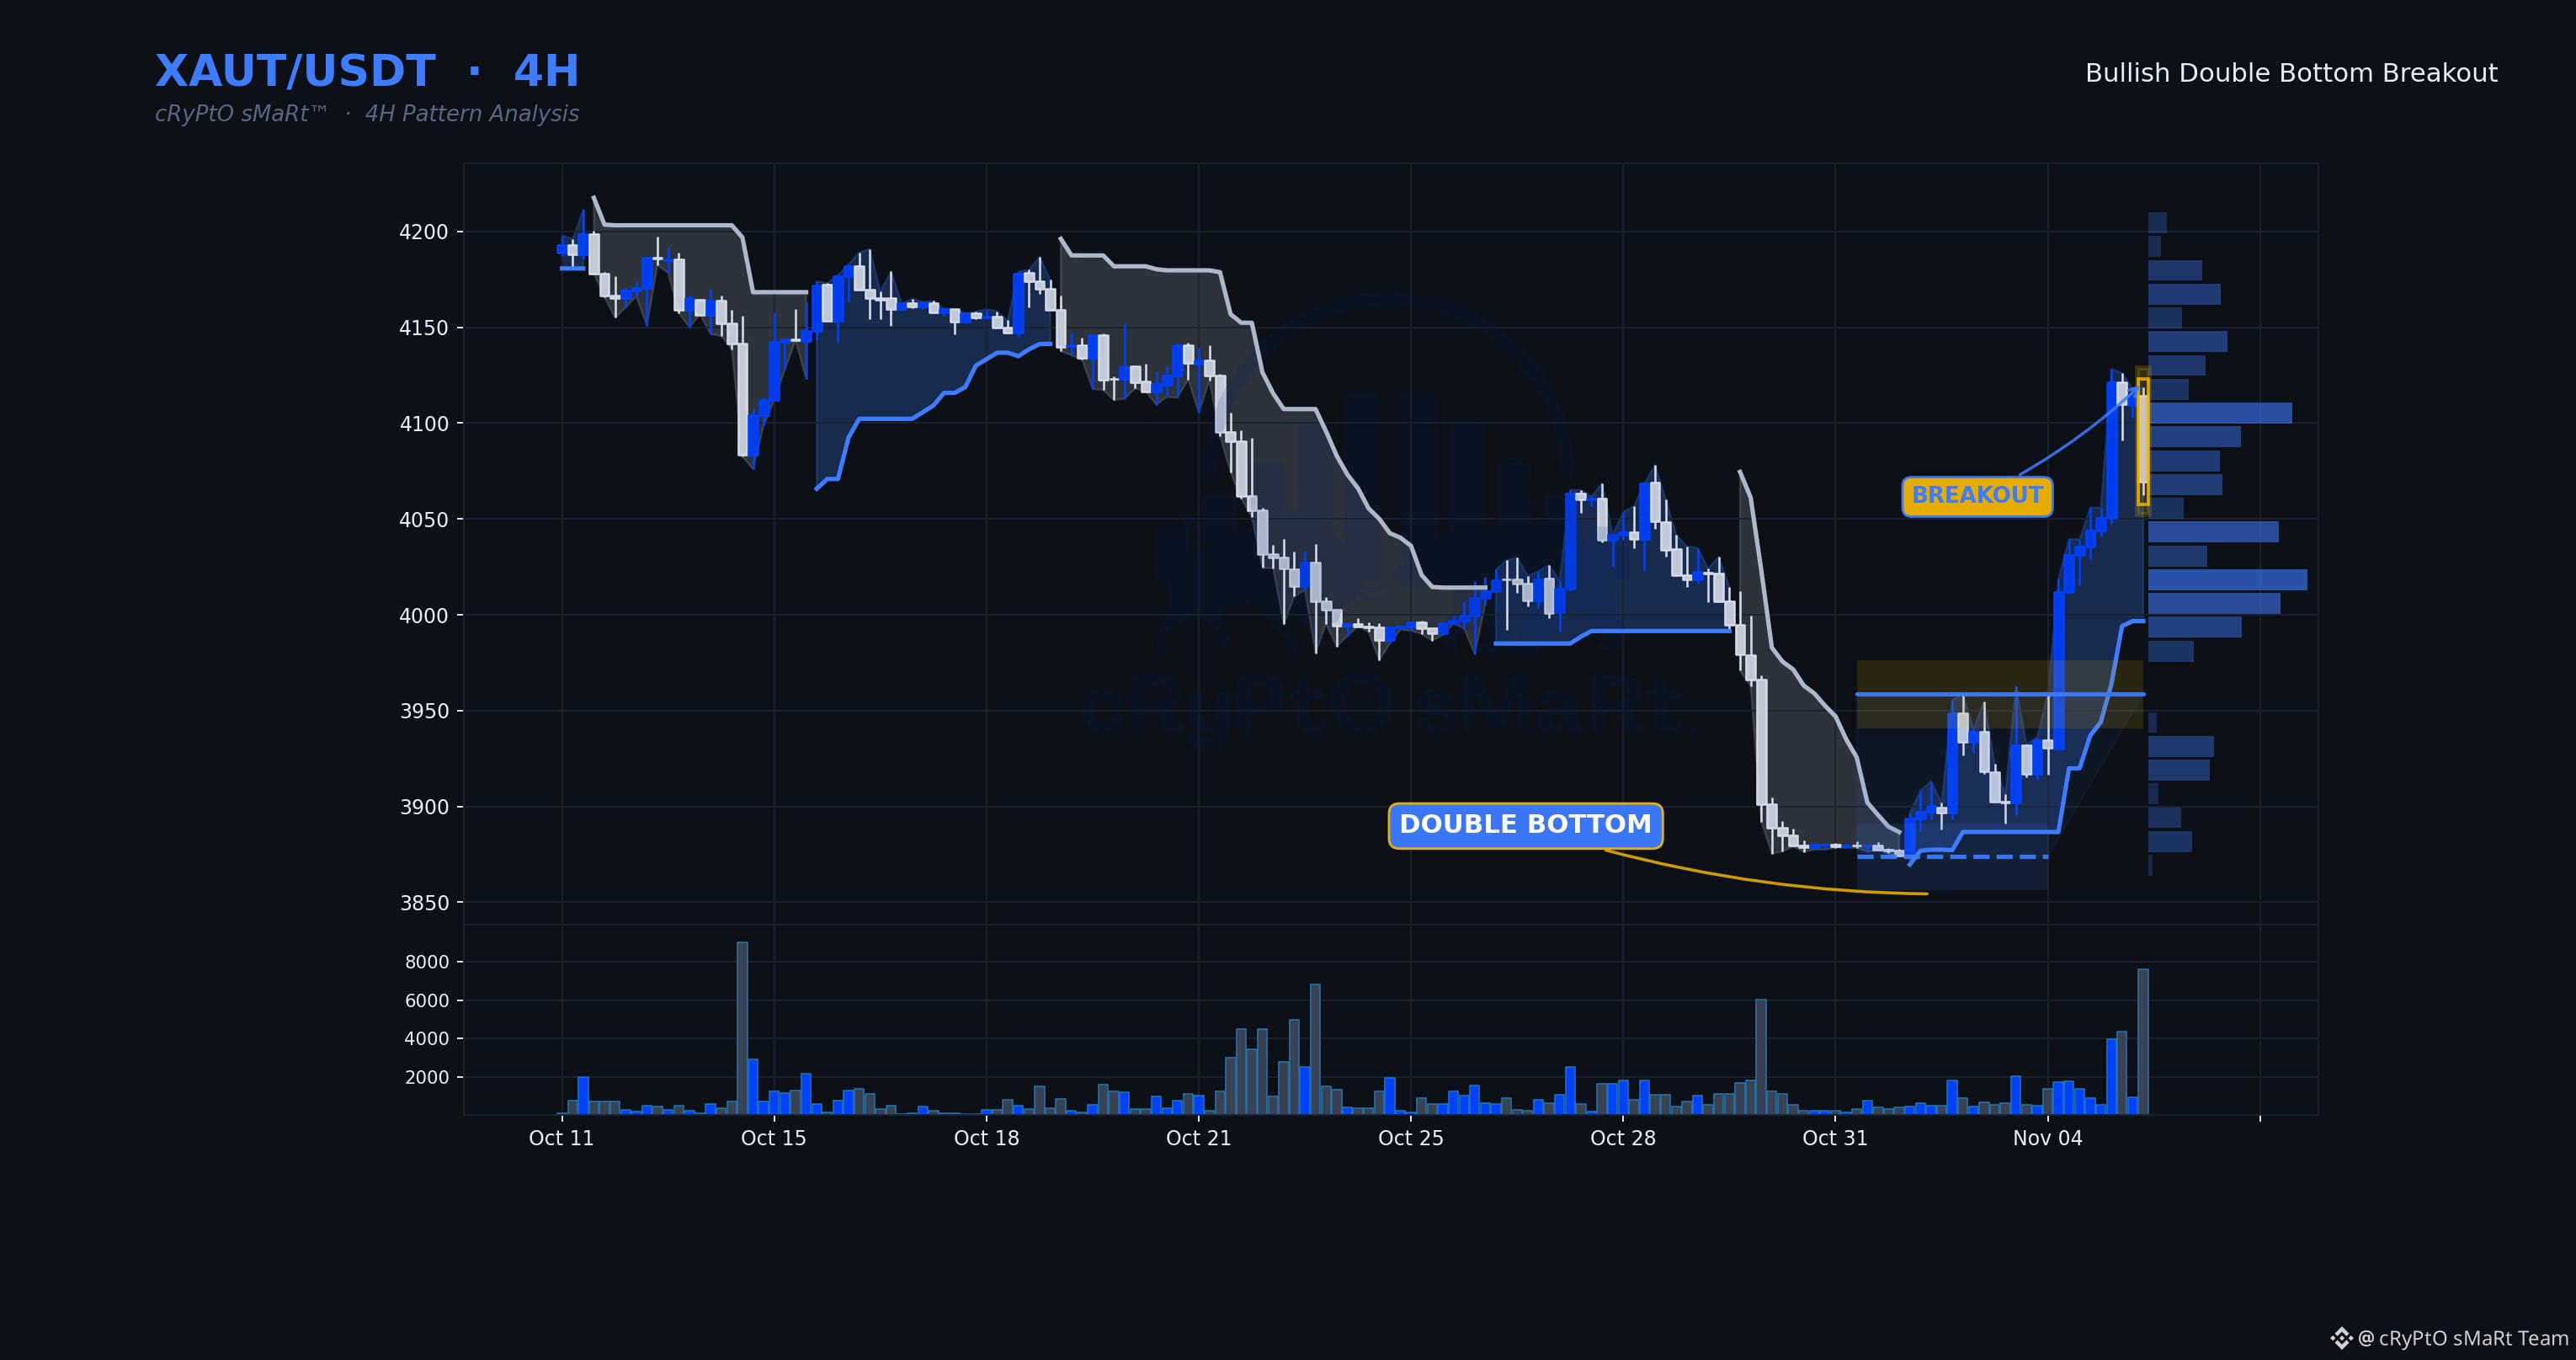
Buyers just took out the neckline with volume well above average, not a limp poke through — that's conviction stepping in, not stragglers. Double bottom confirms control has shifted away from sellers who defended that range twice and failed.
🗓 Daily: Neutral — daily is mixed — Supertrend and EMAs not aligned
⏱ 4H: Double Bottom · Bullish bias
⏳ 1H: price is above the level but the 1H trend hasn't turned up yet — a 1H close that flips the trend up is the trigger.
📋 WHY IT QUALIFIES
✓ Double Bottom structure completed
✓ Decisive breakout — closed 2.8% beyond the line
✓ Volume 4.6× its 20-bar average
✓ RSI 65 — momentum confirms, not yet exhausted
🧭 Bias: Bullish while price holds above $3,958.71
⚠️ Invalidation: 4H close back below $3,958.71
🔵 Support $3,873.76 🟡 Resistance $3,958.71
$XAUT $BTC #ChartPatterns
Education only, not financial advice.
Buyers just took out the neckline with volume well above average, not a limp poke through — that's conviction stepping in, not stragglers. Double bottom confirms control has shifted away from sellers who defended that range twice and failed.
🗓 Daily: Neutral — daily is mixed — Supertrend and EMAs not aligned
⏱ 4H: Double Bottom · Bullish bias
⏳ 1H: price is above the level but the 1H trend hasn't turned up yet — a 1H close that flips the trend up is the trigger.
📋 WHY IT QUALIFIES
✓ Double Bottom structure completed
✓ Decisive breakout — closed 2.8% beyond the line
✓ Volume 4.6× its 20-bar average
✓ RSI 65 — momentum confirms, not yet exhausted
🧭 Bias: Bullish while price holds above $3,958.71
⚠️ Invalidation: 4H close back below $3,958.71
🔵 Support $3,873.76 🟡 Resistance $3,958.71
$XAUT $BTC #ChartPatterns
Education only, not financial advice.
🗓 Daily: Neutral — daily is mixed — Supertrend and EMAs not aligned
⏱ 4H: Double Bottom · Bullish bias
⏳ 1H: price is above the level but the 1H trend hasn't turned up yet — a 1H close that flips the trend up is the trigger.
📋 WHY IT QUALIFIES
✓ Double Bottom structure completed
✓ Decisive breakout — closed 2.8% beyond the line
✓ Volume 4.6× its 20-bar average
✓ RSI 65 — momentum confirms, not yet exhausted
🧭 Bias: Bullish while price holds above $3,958.71
⚠️ Invalidation: 4H close back below $3,958.71
🔵 Support $3,873.76 🟡 Resistance $3,958.71
$XAUT $BTC #ChartPatterns
Education only, not financial advice.
130

·
--
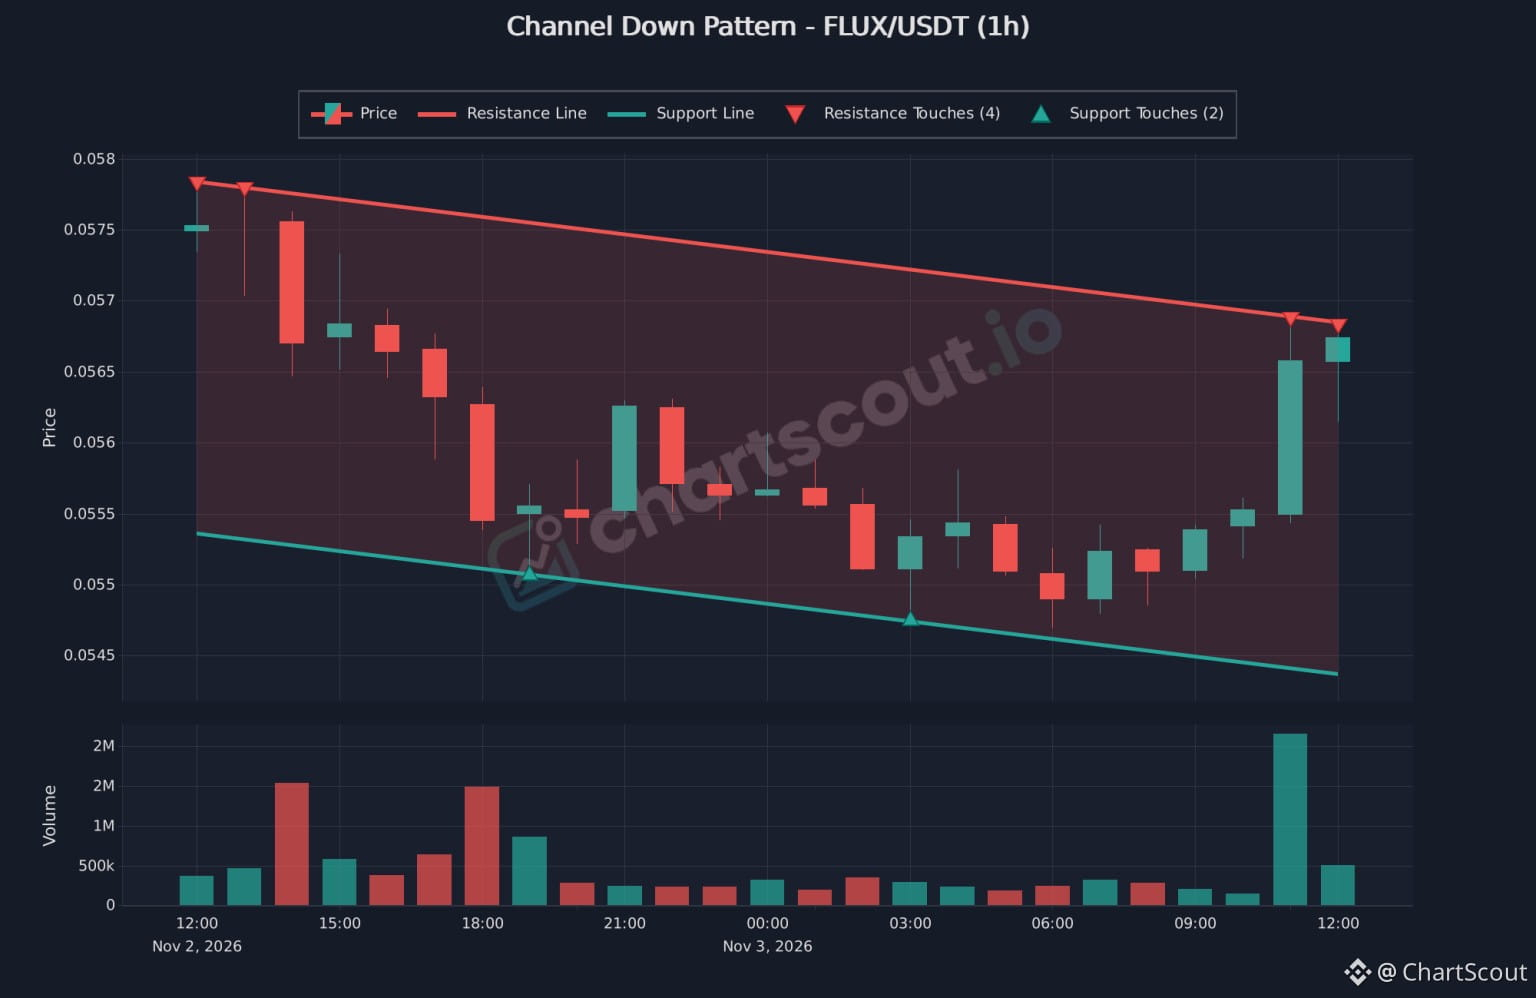
FLUX/USDT 1h: testing the top of a descending channel. 🔍
After a day of lower highs, a large green candle on the heaviest volume of the session pushed price up to the upper line near 0.0568. The lower line is around 0.0544.
The upper line has been touched 4 times and the lower only 2. A channel is only broken when price closes beyond a line, so a touch isn't enough.
Spotted with ChartScout's pattern scanner (free trial in our profile).
#flux #chartpatterns #TechnicalAnalysis #ChartScout
FLUX/USDT 1h: testing the top of a descending channel. 🔍
After a day of lower highs, a large green candle on the heaviest volume of the session pushed price up to the upper line near 0.0568. The lower line is around 0.0544.
The upper line has been touched 4 times and the lower only 2. A channel is only broken when price closes beyond a line, so a touch isn't enough.
Spotted with ChartScout's pattern scanner (free trial in our profile).
#flux #chartpatterns #TechnicalAnalysis #ChartScout
After a day of lower highs, a large green candle on the heaviest volume of the session pushed price up to the upper line near 0.0568. The lower line is around 0.0544.
The upper line has been touched 4 times and the lower only 2. A channel is only broken when price closes beyond a line, so a touch isn't enough.
Spotted with ChartScout's pattern scanner (free trial in our profile).
#flux #chartpatterns #TechnicalAnalysis #ChartScout
279
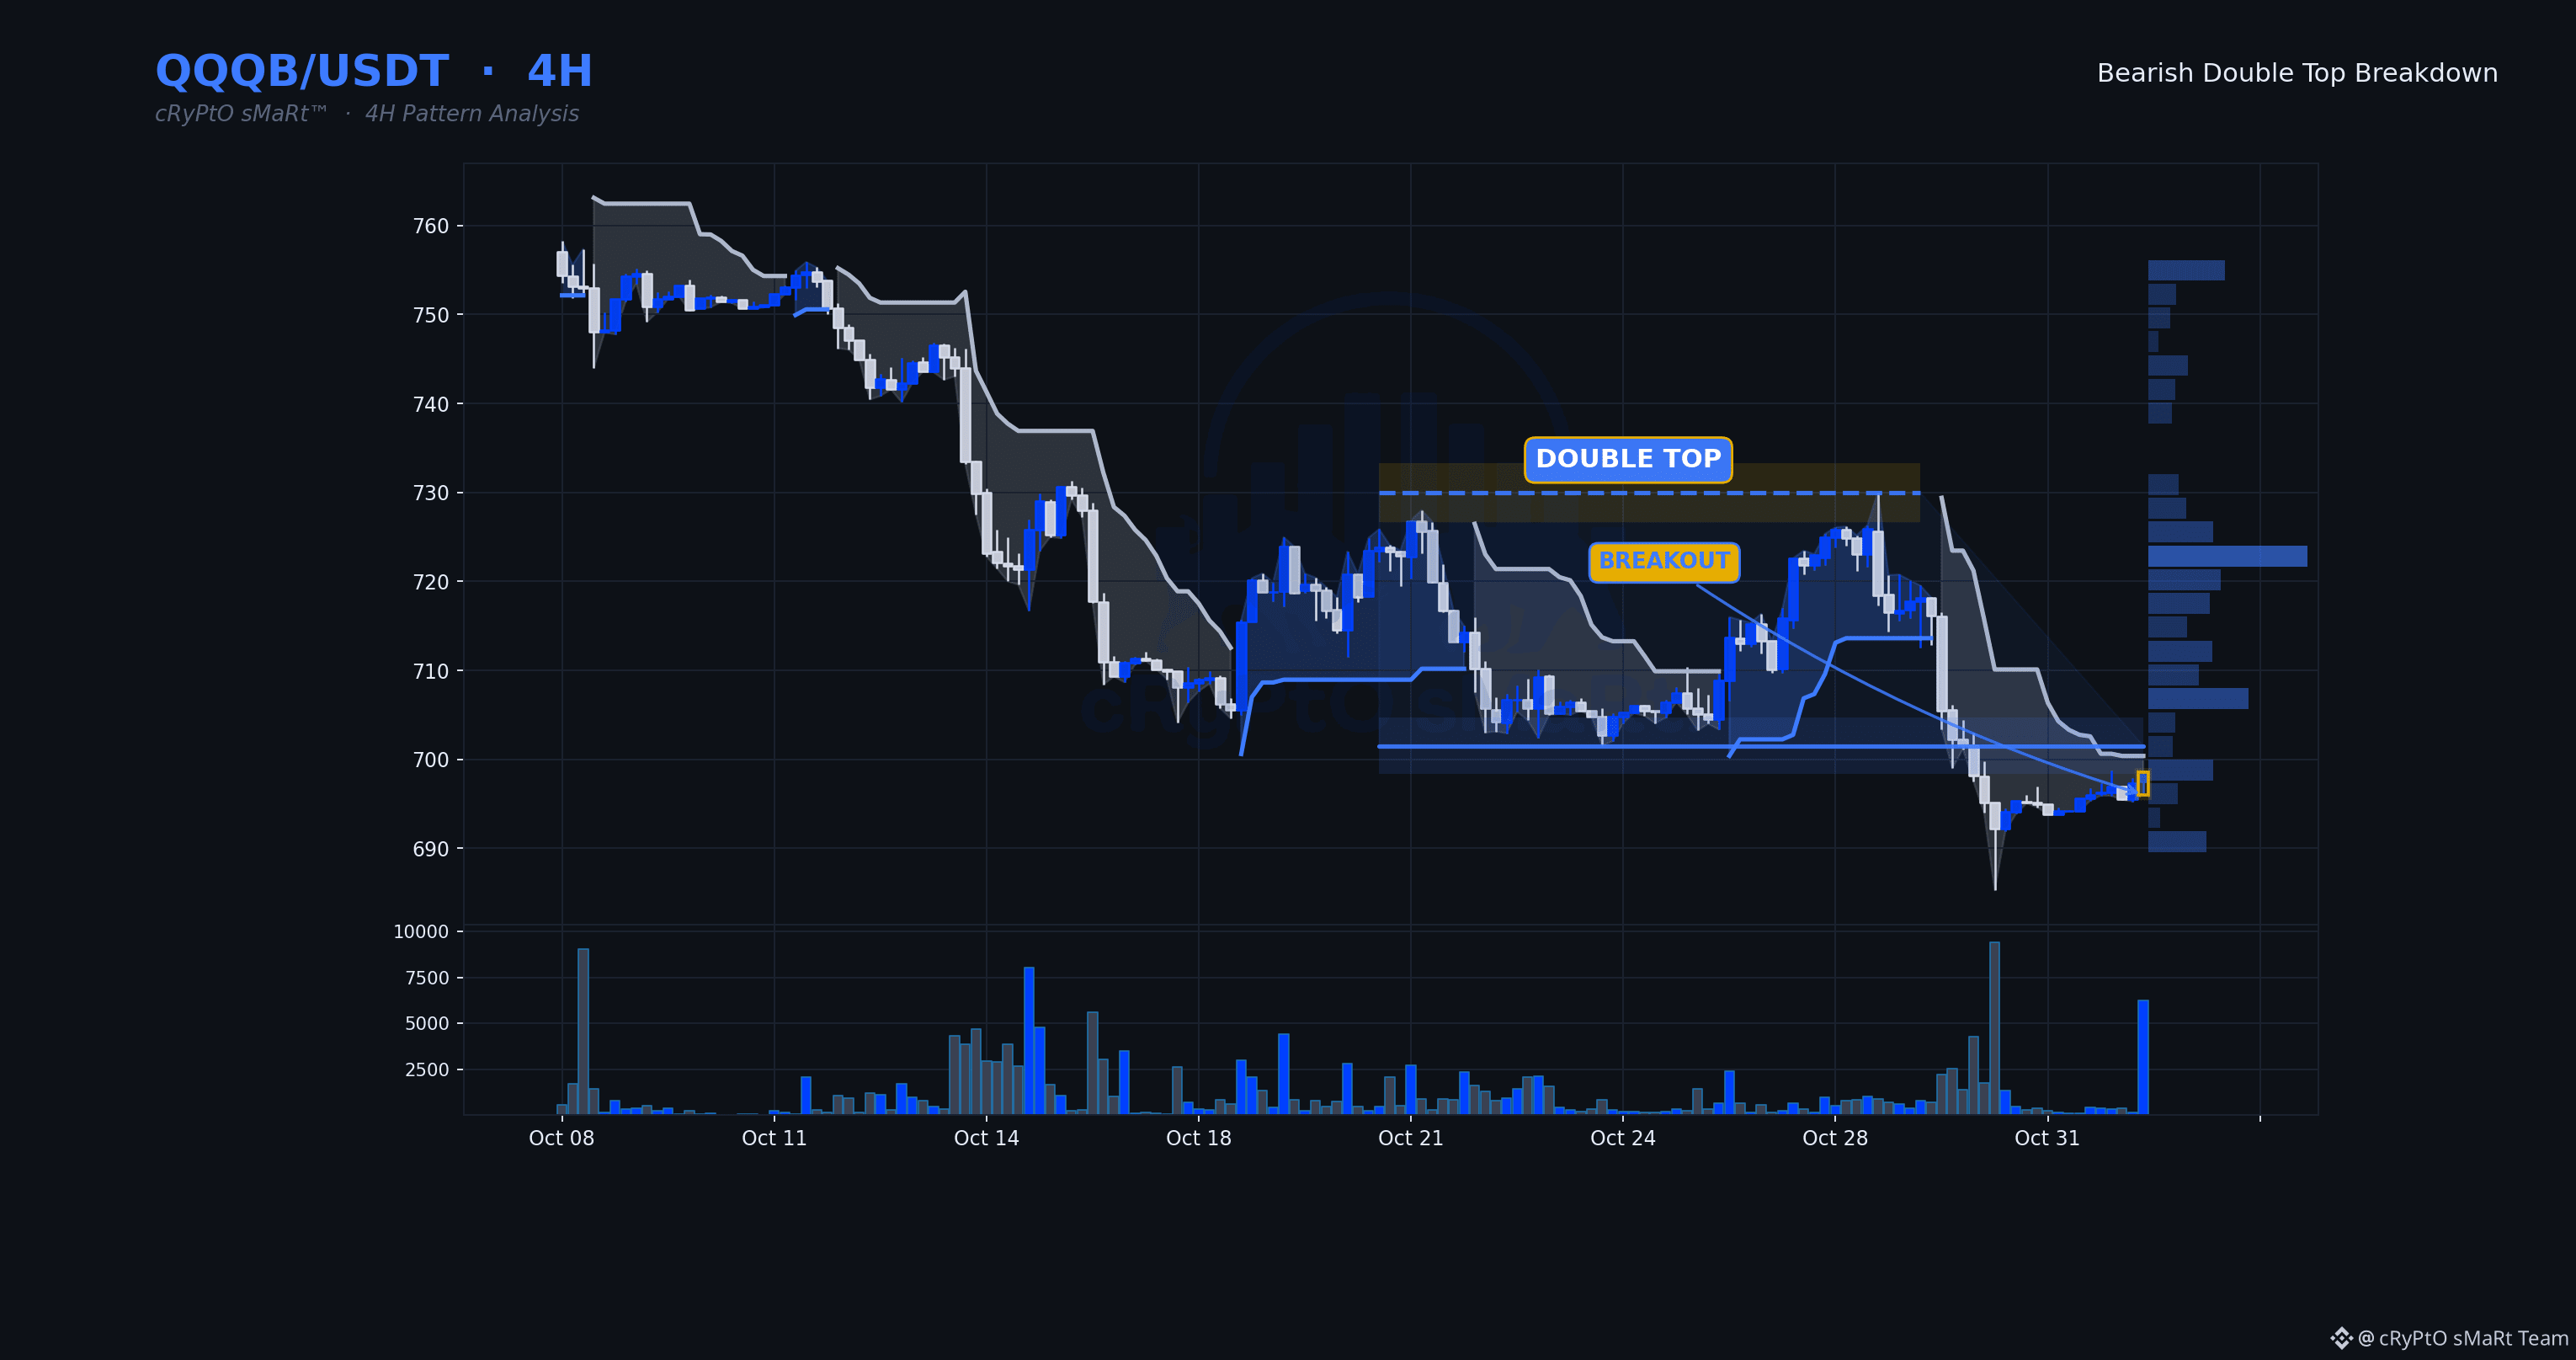
Sellers just took the neckline with volume that confirms real participation, not a thin stop-run. Double top structures resolving on decisive breaks tend to mean the buyers who defended that range are now underwater and trapped.
🗓 Daily: Bearish — price below the daily Supertrend with a falling 50/200 EMA stack
⏱ 4H: Double Top · Bearish bias
⏳ 1H: price is under the level but the 1H trend is still up — a 1H close that flips the trend down is the trigger.
📋 WHY IT QUALIFIES
✓ Double Top structure completed
✓ Decisive breakdown — closed 0.5% beyond the line
✓ Volume 3.8× its 20-bar average
✓ RSI 43 — momentum confirms, not yet exhausted
🧭 Bias: Bearish while price holds below $701.5300
⚠️ Invalidation: 4H close back above $701.5300
🔵 Support $701.5300 🟡 Resistance $729.9800
$QQQB $BTC #ChartPatterns
Education only, not financial advice.
Sellers just took the neckline with volume that confirms real participation, not a thin stop-run. Double top structures resolving on decisive breaks tend to mean the buyers who defended that range are now underwater and trapped.
🗓 Daily: Bearish — price below the daily Supertrend with a falling 50/200 EMA stack
⏱ 4H: Double Top · Bearish bias
⏳ 1H: price is under the level but the 1H trend is still up — a 1H close that flips the trend down is the trigger.
📋 WHY IT QUALIFIES
✓ Double Top structure completed
✓ Decisive breakdown — closed 0.5% beyond the line
✓ Volume 3.8× its 20-bar average
✓ RSI 43 — momentum confirms, not yet exhausted
🧭 Bias: Bearish while price holds below $701.5300
⚠️ Invalidation: 4H close back above $701.5300
🔵 Support $701.5300 🟡 Resistance $729.9800
$QQQB $BTC #ChartPatterns
Education only, not financial advice.
🗓 Daily: Bearish — price below the daily Supertrend with a falling 50/200 EMA stack
⏱ 4H: Double Top · Bearish bias
⏳ 1H: price is under the level but the 1H trend is still up — a 1H close that flips the trend down is the trigger.
📋 WHY IT QUALIFIES
✓ Double Top structure completed
✓ Decisive breakdown — closed 0.5% beyond the line
✓ Volume 3.8× its 20-bar average
✓ RSI 43 — momentum confirms, not yet exhausted
🧭 Bias: Bearish while price holds below $701.5300
⚠️ Invalidation: 4H close back above $701.5300
🔵 Support $701.5300 🟡 Resistance $729.9800
$QQQB $BTC #ChartPatterns
Education only, not financial advice.
85
·
--
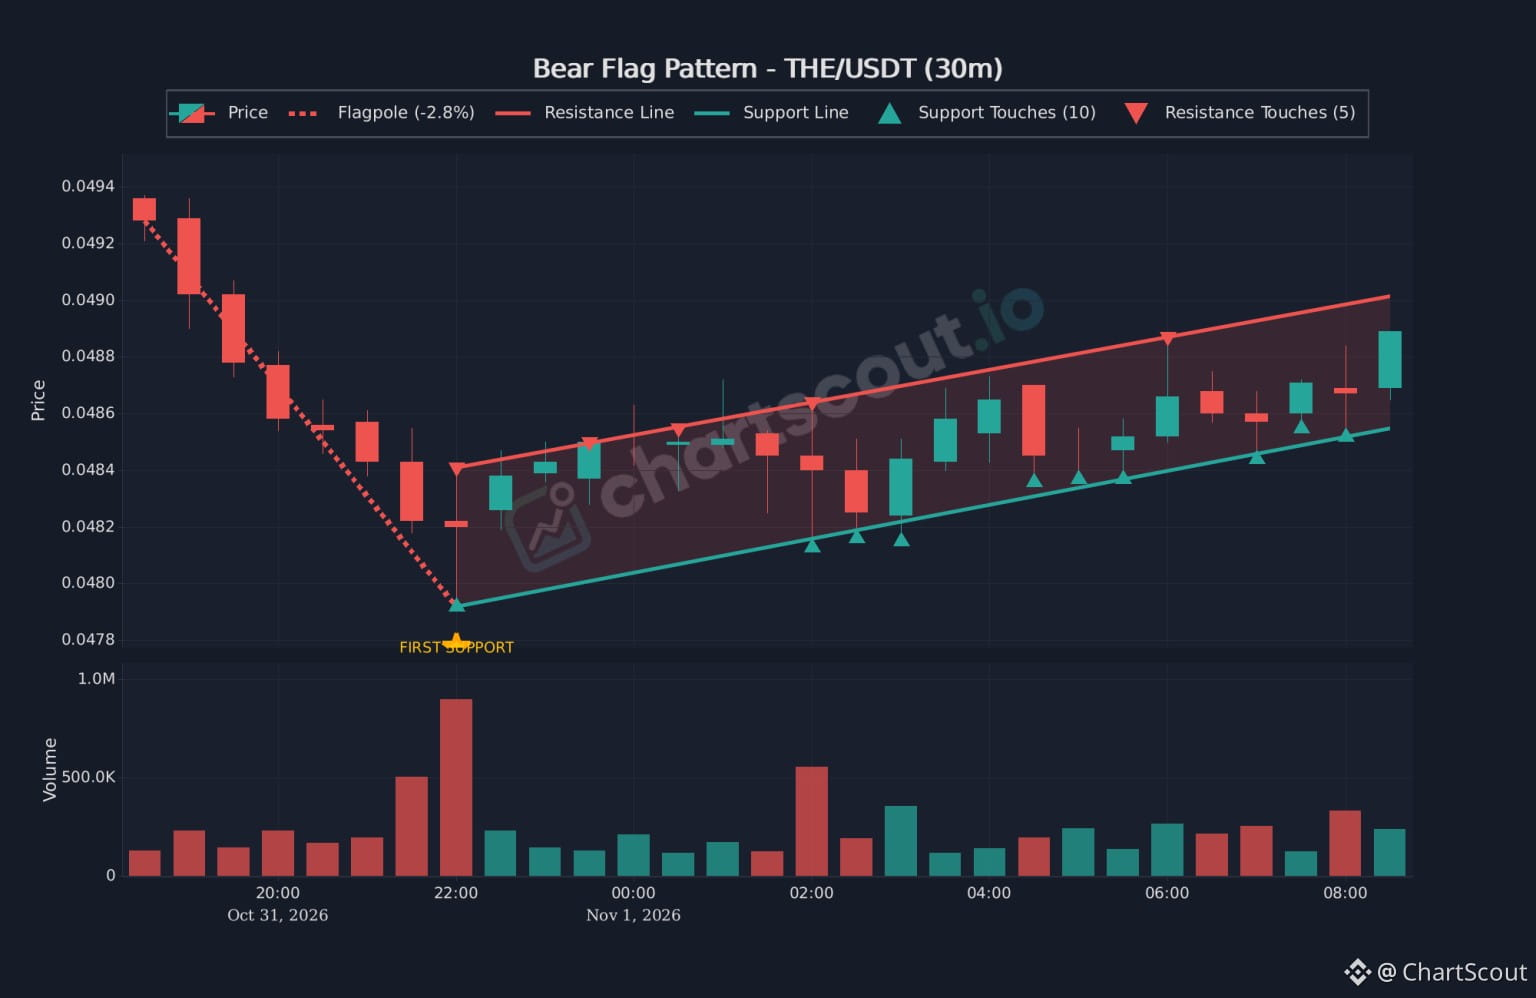
THE/USDT 30m: possible bear flag. 🔍
After a ~2.8% drop, price has been climbing inside a rising channel with 10 touches on the lower line and 5 on the upper. It's now near the top at about 0.0488–0.0490.
A bear flag only matters if price breaks the lower line, and a push above the upper line would invalidate the idea, so neither side is confirmed yet.
Spotted with ChartScout's pattern scanner (free trial in our profile).
#the #chartpatterns #TechnicalAnalysis
THE/USDT 30m: possible bear flag. 🔍
After a ~2.8% drop, price has been climbing inside a rising channel with 10 touches on the lower line and 5 on the upper. It's now near the top at about 0.0488–0.0490.
A bear flag only matters if price breaks the lower line, and a push above the upper line would invalidate the idea, so neither side is confirmed yet.
Spotted with ChartScout's pattern scanner (free trial in our profile).
#the #chartpatterns #TechnicalAnalysis
After a ~2.8% drop, price has been climbing inside a rising channel with 10 touches on the lower line and 5 on the upper. It's now near the top at about 0.0488–0.0490.
A bear flag only matters if price breaks the lower line, and a push above the upper line would invalidate the idea, so neither side is confirmed yet.
Spotted with ChartScout's pattern scanner (free trial in our profile).
#the #chartpatterns #TechnicalAnalysis
1
449
·
--
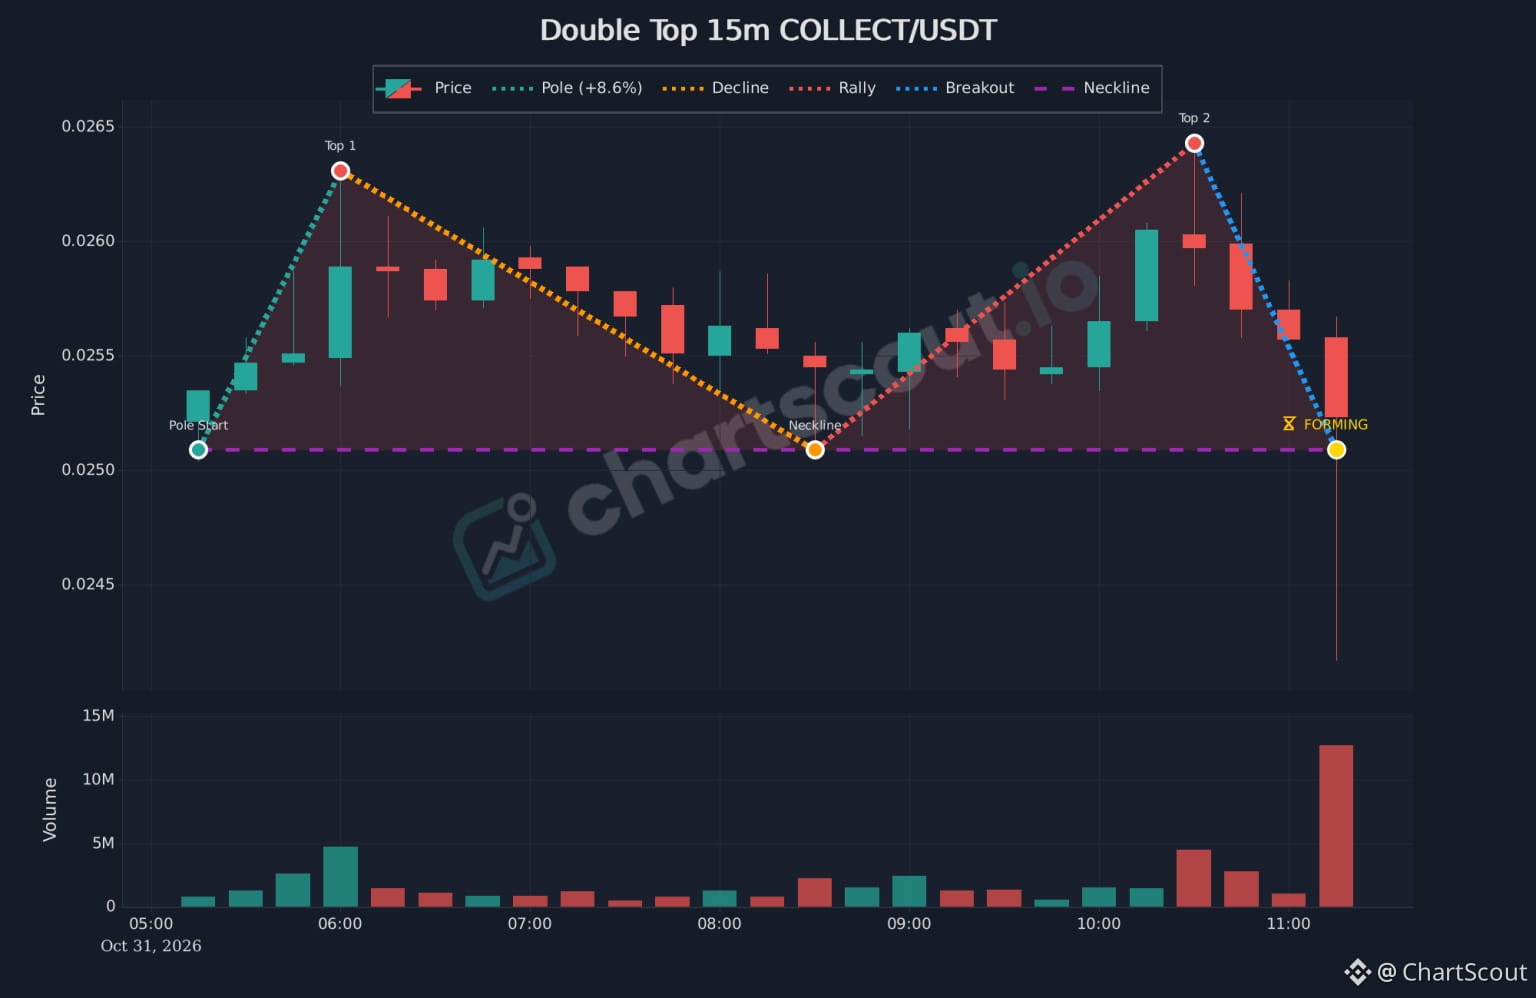
COLLECT/USDT 15m: double top forming. 🔍
After an 8.6% rise, price made two tops near 0.0263–0.0264 and is now testing the neckline around 0.0251. The latest candle printed heavy volume with a long wick below the line.
A double top isn't confirmed until a candle closes below the neckline, so a wick alone isn't enough.
Spotted with ChartScout's pattern scanner (free trial in our profile).
#collect #chartpatterns #TechnicalAnalysis #COLLECTUSDT
COLLECT/USDT 15m: double top forming. 🔍
After an 8.6% rise, price made two tops near 0.0263–0.0264 and is now testing the neckline around 0.0251. The latest candle printed heavy volume with a long wick below the line.
A double top isn't confirmed until a candle closes below the neckline, so a wick alone isn't enough.
Spotted with ChartScout's pattern scanner (free trial in our profile).
#collect #chartpatterns #TechnicalAnalysis #COLLECTUSDT
After an 8.6% rise, price made two tops near 0.0263–0.0264 and is now testing the neckline around 0.0251. The latest candle printed heavy volume with a long wick below the line.
A double top isn't confirmed until a candle closes below the neckline, so a wick alone isn't enough.
Spotted with ChartScout's pattern scanner (free trial in our profile).
#collect #chartpatterns #TechnicalAnalysis #COLLECTUSDT
631
·
--
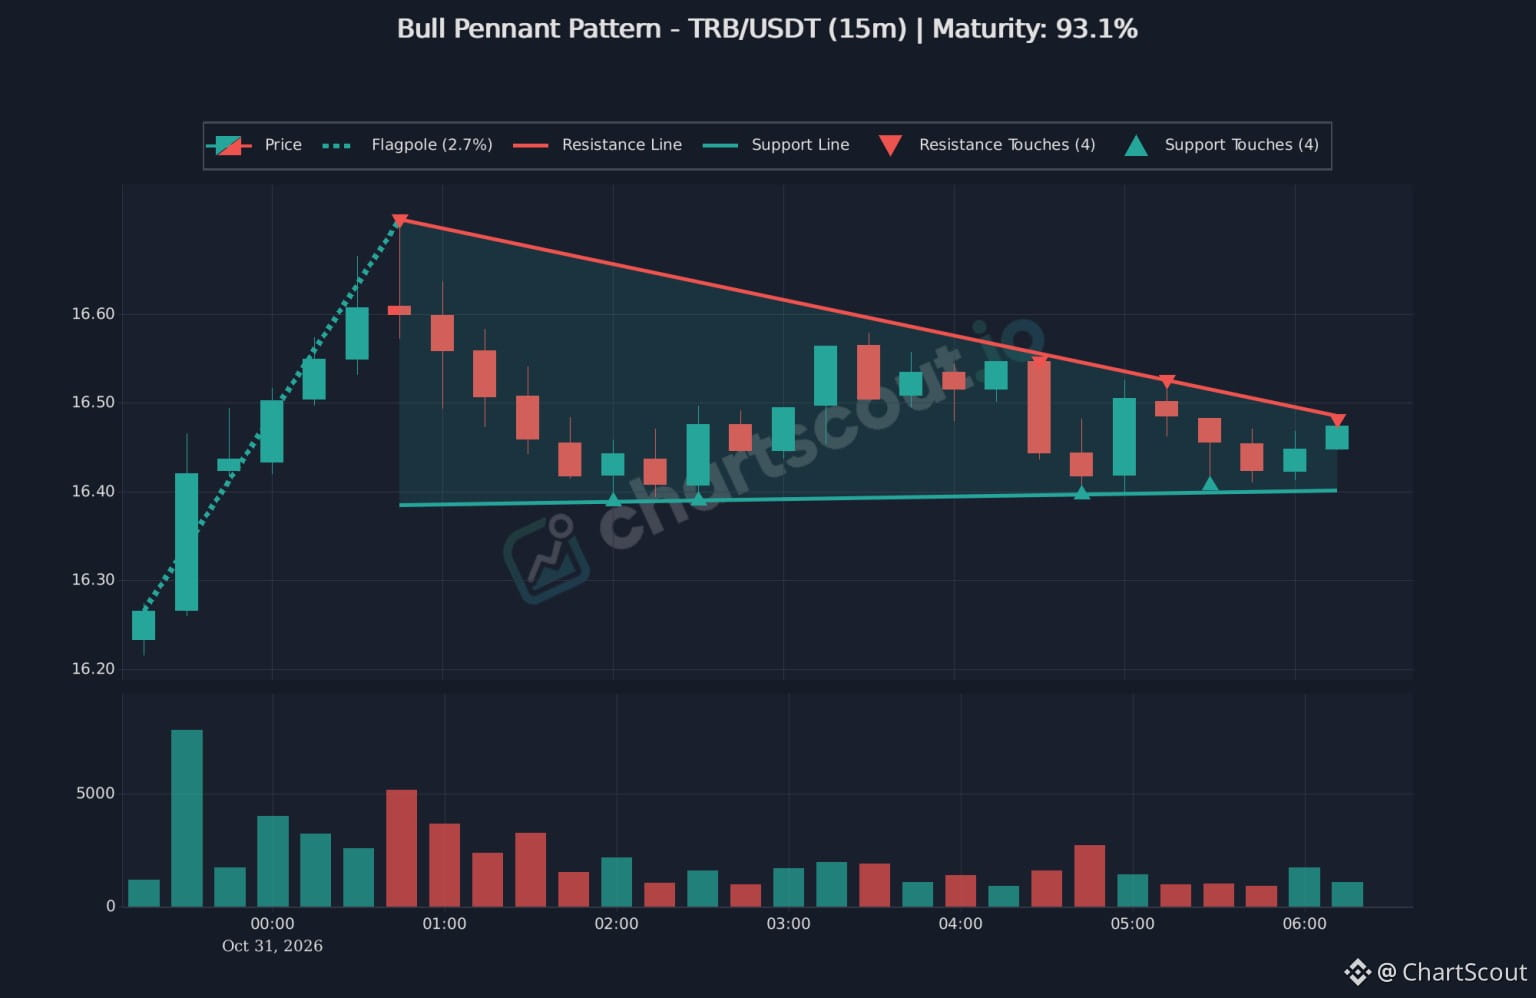
TRB/USDT 15m : bull pennant tightening. 🔍
A +2.7% pole, then a converging pennant with 4 touches on both lines. Price is pressing the upper line near 16.48 while support holds around 16.40.
A pennant is only a pattern, so watch for a clean 15m close beyond either line before drawing conclusions.
Spotted with ChartScout's pattern scanner (free trial in our profile).
#TRB #chartpatterns #TechnicalAnalysis
TRB/USDT 15m : bull pennant tightening. 🔍
A +2.7% pole, then a converging pennant with 4 touches on both lines. Price is pressing the upper line near 16.48 while support holds around 16.40.
A pennant is only a pattern, so watch for a clean 15m close beyond either line before drawing conclusions.
Spotted with ChartScout's pattern scanner (free trial in our profile).
#TRB #chartpatterns #TechnicalAnalysis
A +2.7% pole, then a converging pennant with 4 touches on both lines. Price is pressing the upper line near 16.48 while support holds around 16.40.
A pennant is only a pattern, so watch for a clean 15m close beyond either line before drawing conclusions.
Spotted with ChartScout's pattern scanner (free trial in our profile).
#TRB #chartpatterns #TechnicalAnalysis
1
667
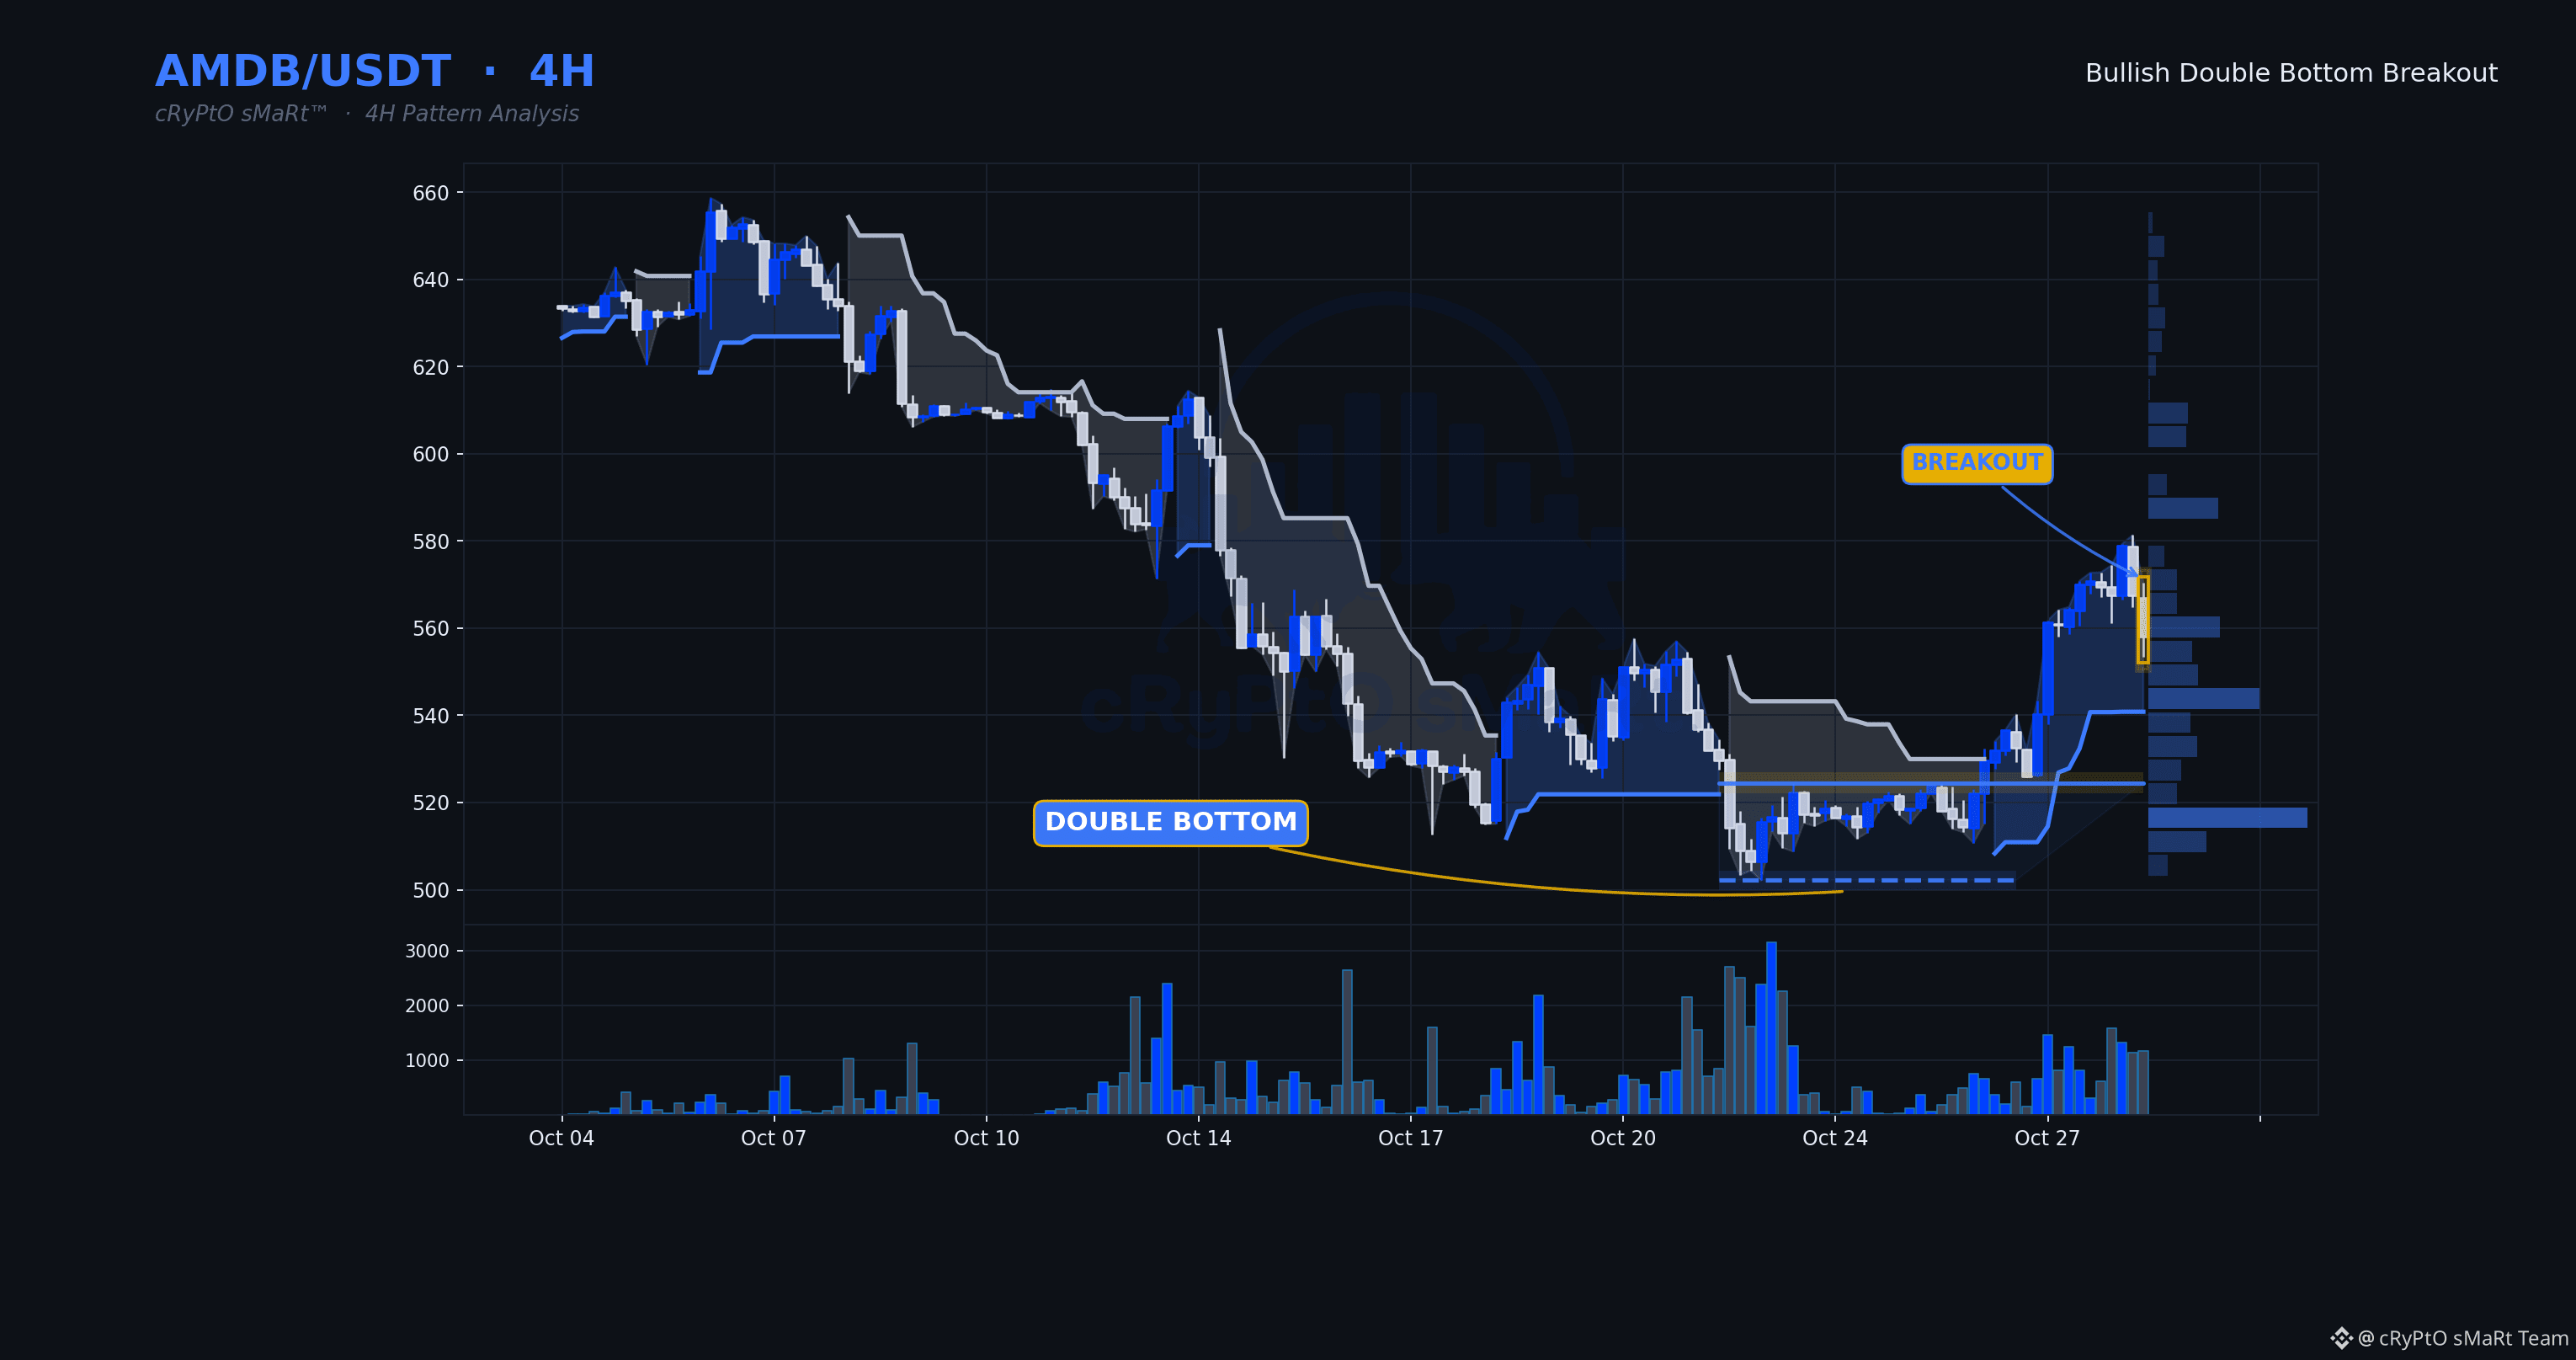
Double bottom resolving higher on a decisive breakout, and the volume behind it confirms buyers forced the issue rather than drifted into it. Momentum still has room, which matters — this isn't a stretched move chasing exhaustion, it's early-stage control shifting to the bulls.
🗓 Daily: Neutral — daily is mixed — Supertrend and EMAs not aligned
⏱ 4H: Double Bottom · Bullish bias
⏳ 1H: price is above the level but the 1H trend hasn't turned up yet — a 1H close that flips the trend up is the trigger.
📋 WHY IT QUALIFIES
✓ Double Bottom structure completed
✓ Decisive breakout — closed 6.4% beyond the line
✓ Volume 1.6× its 20-bar average
✓ RSI 57 — momentum confirms, not yet exhausted
🧭 Bias: Bullish while price holds above $524.5000
⚠️ Invalidation: 4H close back below $524.5000
🔵 Support $502.1500 🟡 Resistance $524.5000
$AMDB $BTC #ChartPatterns
Education only, not financial advice.
Double bottom resolving higher on a decisive breakout, and the volume behind it confirms buyers forced the issue rather than drifted into it. Momentum still has room, which matters — this isn't a stretched move chasing exhaustion, it's early-stage control shifting to the bulls.
🗓 Daily: Neutral — daily is mixed — Supertrend and EMAs not aligned
⏱ 4H: Double Bottom · Bullish bias
⏳ 1H: price is above the level but the 1H trend hasn't turned up yet — a 1H close that flips the trend up is the trigger.
📋 WHY IT QUALIFIES
✓ Double Bottom structure completed
✓ Decisive breakout — closed 6.4% beyond the line
✓ Volume 1.6× its 20-bar average
✓ RSI 57 — momentum confirms, not yet exhausted
🧭 Bias: Bullish while price holds above $524.5000
⚠️ Invalidation: 4H close back below $524.5000
🔵 Support $502.1500 🟡 Resistance $524.5000
$AMDB $BTC #ChartPatterns
Education only, not financial advice.
🗓 Daily: Neutral — daily is mixed — Supertrend and EMAs not aligned
⏱ 4H: Double Bottom · Bullish bias
⏳ 1H: price is above the level but the 1H trend hasn't turned up yet — a 1H close that flips the trend up is the trigger.
📋 WHY IT QUALIFIES
✓ Double Bottom structure completed
✓ Decisive breakout — closed 6.4% beyond the line
✓ Volume 1.6× its 20-bar average
✓ RSI 57 — momentum confirms, not yet exhausted
🧭 Bias: Bullish while price holds above $524.5000
⚠️ Invalidation: 4H close back below $524.5000
🔵 Support $502.1500 🟡 Resistance $524.5000
$AMDB $BTC #ChartPatterns
Education only, not financial advice.
21
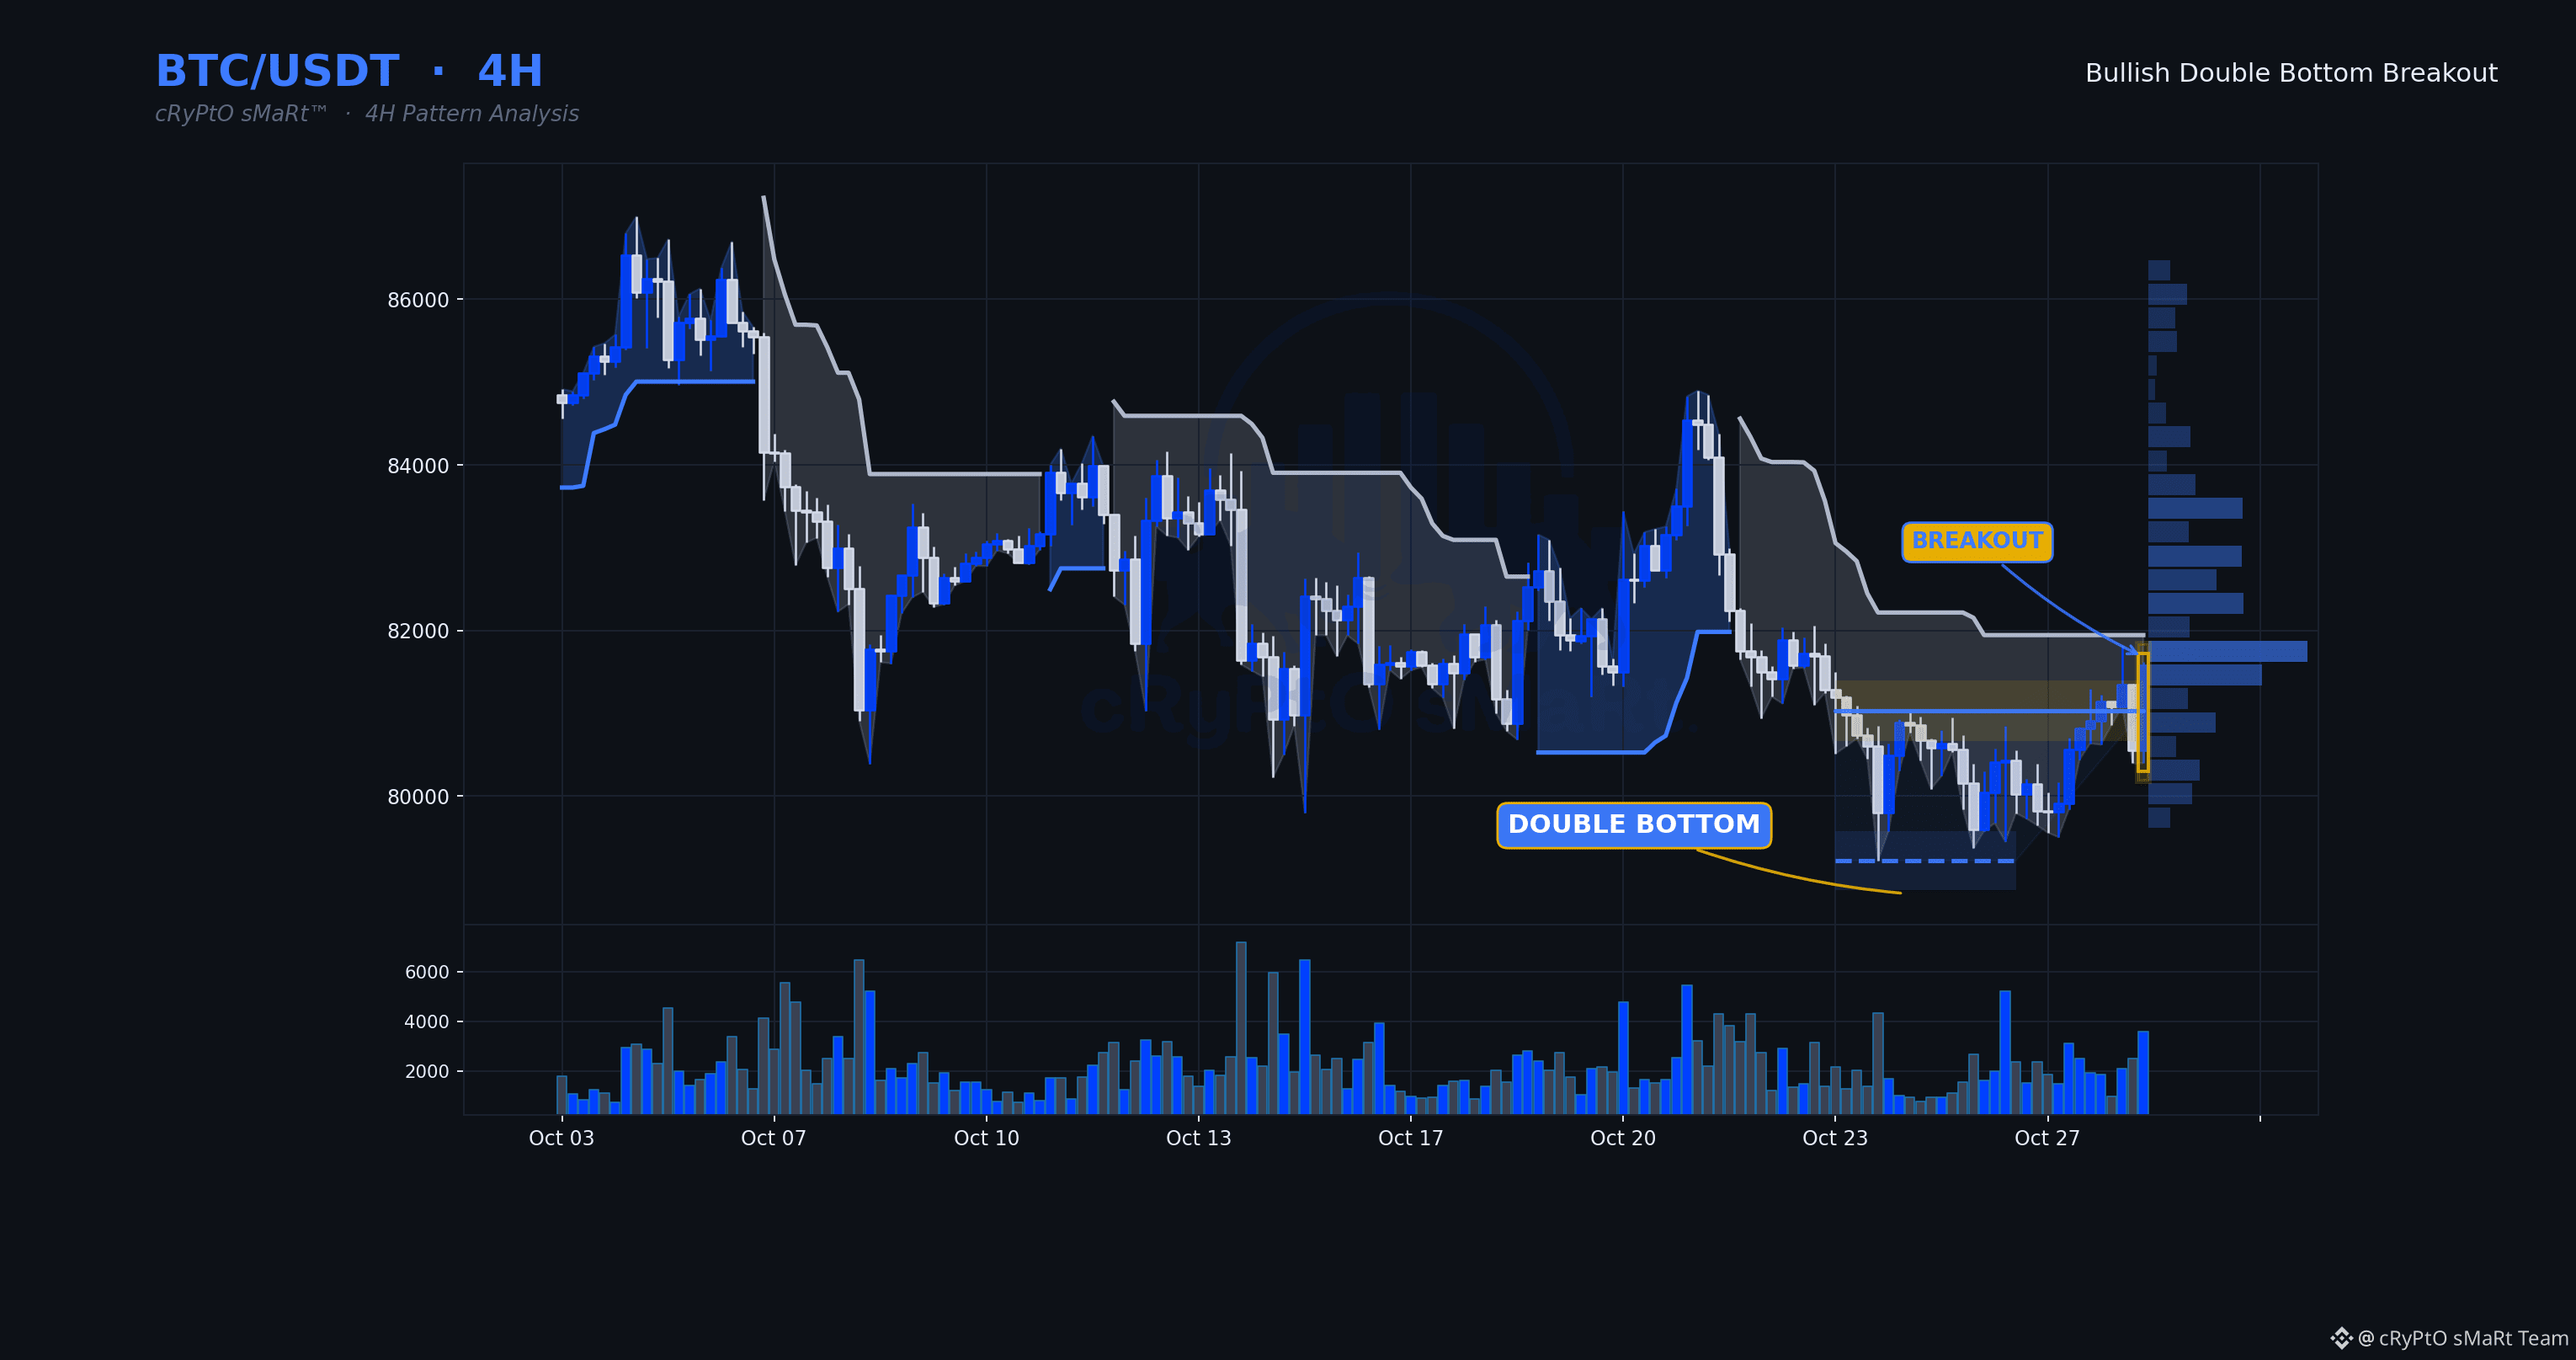
Double bottom resolving higher with volume stepping up well above average on the break — that's demand showing up with conviction, not a quiet drift through resistance. Momentum still has room, meaning this isn't a stretched move chasing itself into exhaustion.
🗓 Daily: Neutral — daily is mixed — Supertrend and EMAs not aligned
⏱ 4H: Double Bottom · Bullish bias
⏳ 1H: price is above the level but the 1H trend hasn't turned up yet — a 1H close that flips the trend up is the trigger.
📋 WHY IT QUALIFIES
✓ Double Bottom structure completed
✓ Decisive breakout — closed 0.7% beyond the line
✓ Volume 1.7× its 20-bar average
✓ RSI 59 — momentum confirms, not yet exhausted
🧭 Bias: Bullish while price holds above $81,033.69
⚠️ Invalidation: 4H close back below $81,033.69
🔵 Support $79,220.74 🟡 Resistance $81,033.69
$BTC #ChartPatterns
Education only, not financial advice.
Double bottom resolving higher with volume stepping up well above average on the break — that's demand showing up with conviction, not a quiet drift through resistance. Momentum still has room, meaning this isn't a stretched move chasing itself into exhaustion.
🗓 Daily: Neutral — daily is mixed — Supertrend and EMAs not aligned
⏱ 4H: Double Bottom · Bullish bias
⏳ 1H: price is above the level but the 1H trend hasn't turned up yet — a 1H close that flips the trend up is the trigger.
📋 WHY IT QUALIFIES
✓ Double Bottom structure completed
✓ Decisive breakout — closed 0.7% beyond the line
✓ Volume 1.7× its 20-bar average
✓ RSI 59 — momentum confirms, not yet exhausted
🧭 Bias: Bullish while price holds above $81,033.69
⚠️ Invalidation: 4H close back below $81,033.69
🔵 Support $79,220.74 🟡 Resistance $81,033.69
$BTC #ChartPatterns
Education only, not financial advice.
🗓 Daily: Neutral — daily is mixed — Supertrend and EMAs not aligned
⏱ 4H: Double Bottom · Bullish bias
⏳ 1H: price is above the level but the 1H trend hasn't turned up yet — a 1H close that flips the trend up is the trigger.
📋 WHY IT QUALIFIES
✓ Double Bottom structure completed
✓ Decisive breakout — closed 0.7% beyond the line
✓ Volume 1.7× its 20-bar average
✓ RSI 59 — momentum confirms, not yet exhausted
🧭 Bias: Bullish while price holds above $81,033.69
⚠️ Invalidation: 4H close back below $81,033.69
🔵 Support $79,220.74 🟡 Resistance $81,033.69
$BTC #ChartPatterns
Education only, not financial advice.
38
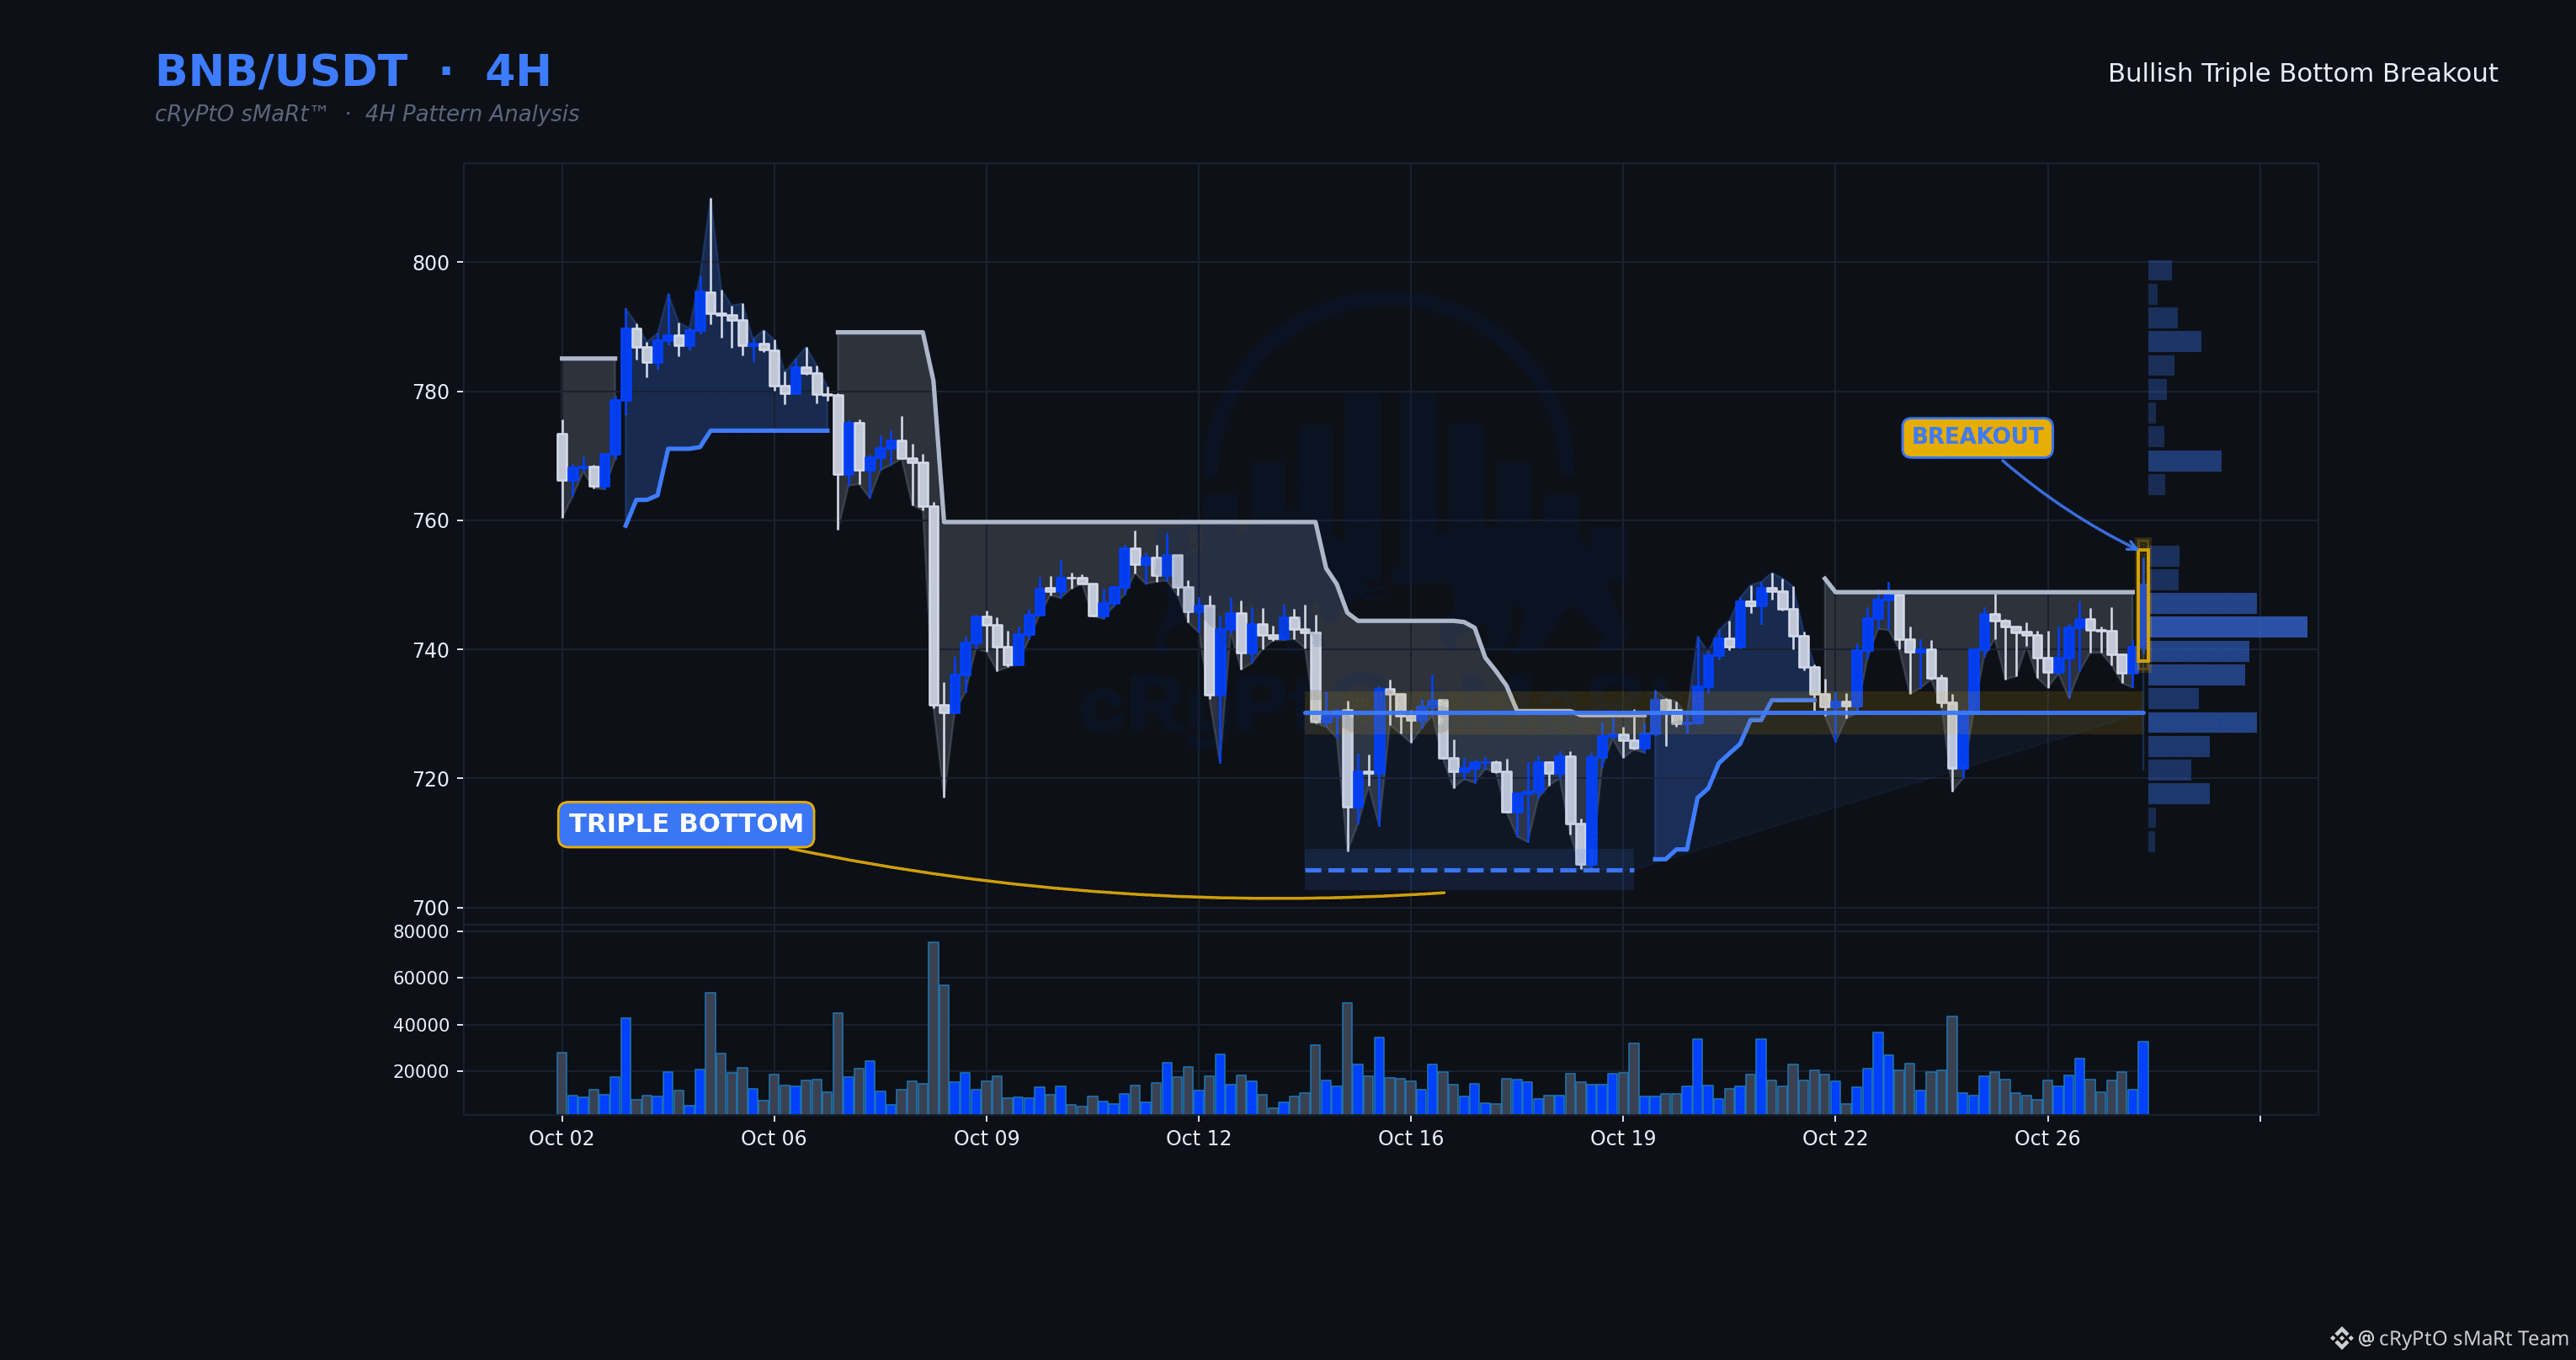
Three failed attempts at the same floor, then a clean break through on volume well above average — that's not a retest grind, that's buyers finally overwhelming the level that held three times.
🗓 Daily: Neutral — daily is mixed — Supertrend and EMAs not aligned
⏱ 4H: Triple Bottom · Bullish bias
⏳ 1H: the 1H is holding above the level with its trend up — the lower timeframe confirms the setup.
📋 WHY IT QUALIFIES
✓ Triple Bottom structure completed
✓ Decisive breakout — closed 2.7% beyond the line
✓ Volume 1.9× its 20-bar average
✓ RSI 61 — momentum confirms, not yet exhausted
🧭 Bias: Bullish while price holds above $730.1900
⚠️ Invalidation: 4H close back below $730.1900
🔵 Support $705.8600 🟡 Resistance $730.1900
$BNB $BTC #ChartPatterns
Education only, not financial advice.
Three failed attempts at the same floor, then a clean break through on volume well above average — that's not a retest grind, that's buyers finally overwhelming the level that held three times.
🗓 Daily: Neutral — daily is mixed — Supertrend and EMAs not aligned
⏱ 4H: Triple Bottom · Bullish bias
⏳ 1H: the 1H is holding above the level with its trend up — the lower timeframe confirms the setup.
📋 WHY IT QUALIFIES
✓ Triple Bottom structure completed
✓ Decisive breakout — closed 2.7% beyond the line
✓ Volume 1.9× its 20-bar average
✓ RSI 61 — momentum confirms, not yet exhausted
🧭 Bias: Bullish while price holds above $730.1900
⚠️ Invalidation: 4H close back below $730.1900
🔵 Support $705.8600 🟡 Resistance $730.1900
$BNB $BTC #ChartPatterns
Education only, not financial advice.
🗓 Daily: Neutral — daily is mixed — Supertrend and EMAs not aligned
⏱ 4H: Triple Bottom · Bullish bias
⏳ 1H: the 1H is holding above the level with its trend up — the lower timeframe confirms the setup.
📋 WHY IT QUALIFIES
✓ Triple Bottom structure completed
✓ Decisive breakout — closed 2.7% beyond the line
✓ Volume 1.9× its 20-bar average
✓ RSI 61 — momentum confirms, not yet exhausted
🧭 Bias: Bullish while price holds above $730.1900
⚠️ Invalidation: 4H close back below $730.1900
🔵 Support $705.8600 🟡 Resistance $730.1900
$BNB $BTC #ChartPatterns
Education only, not financial advice.
50
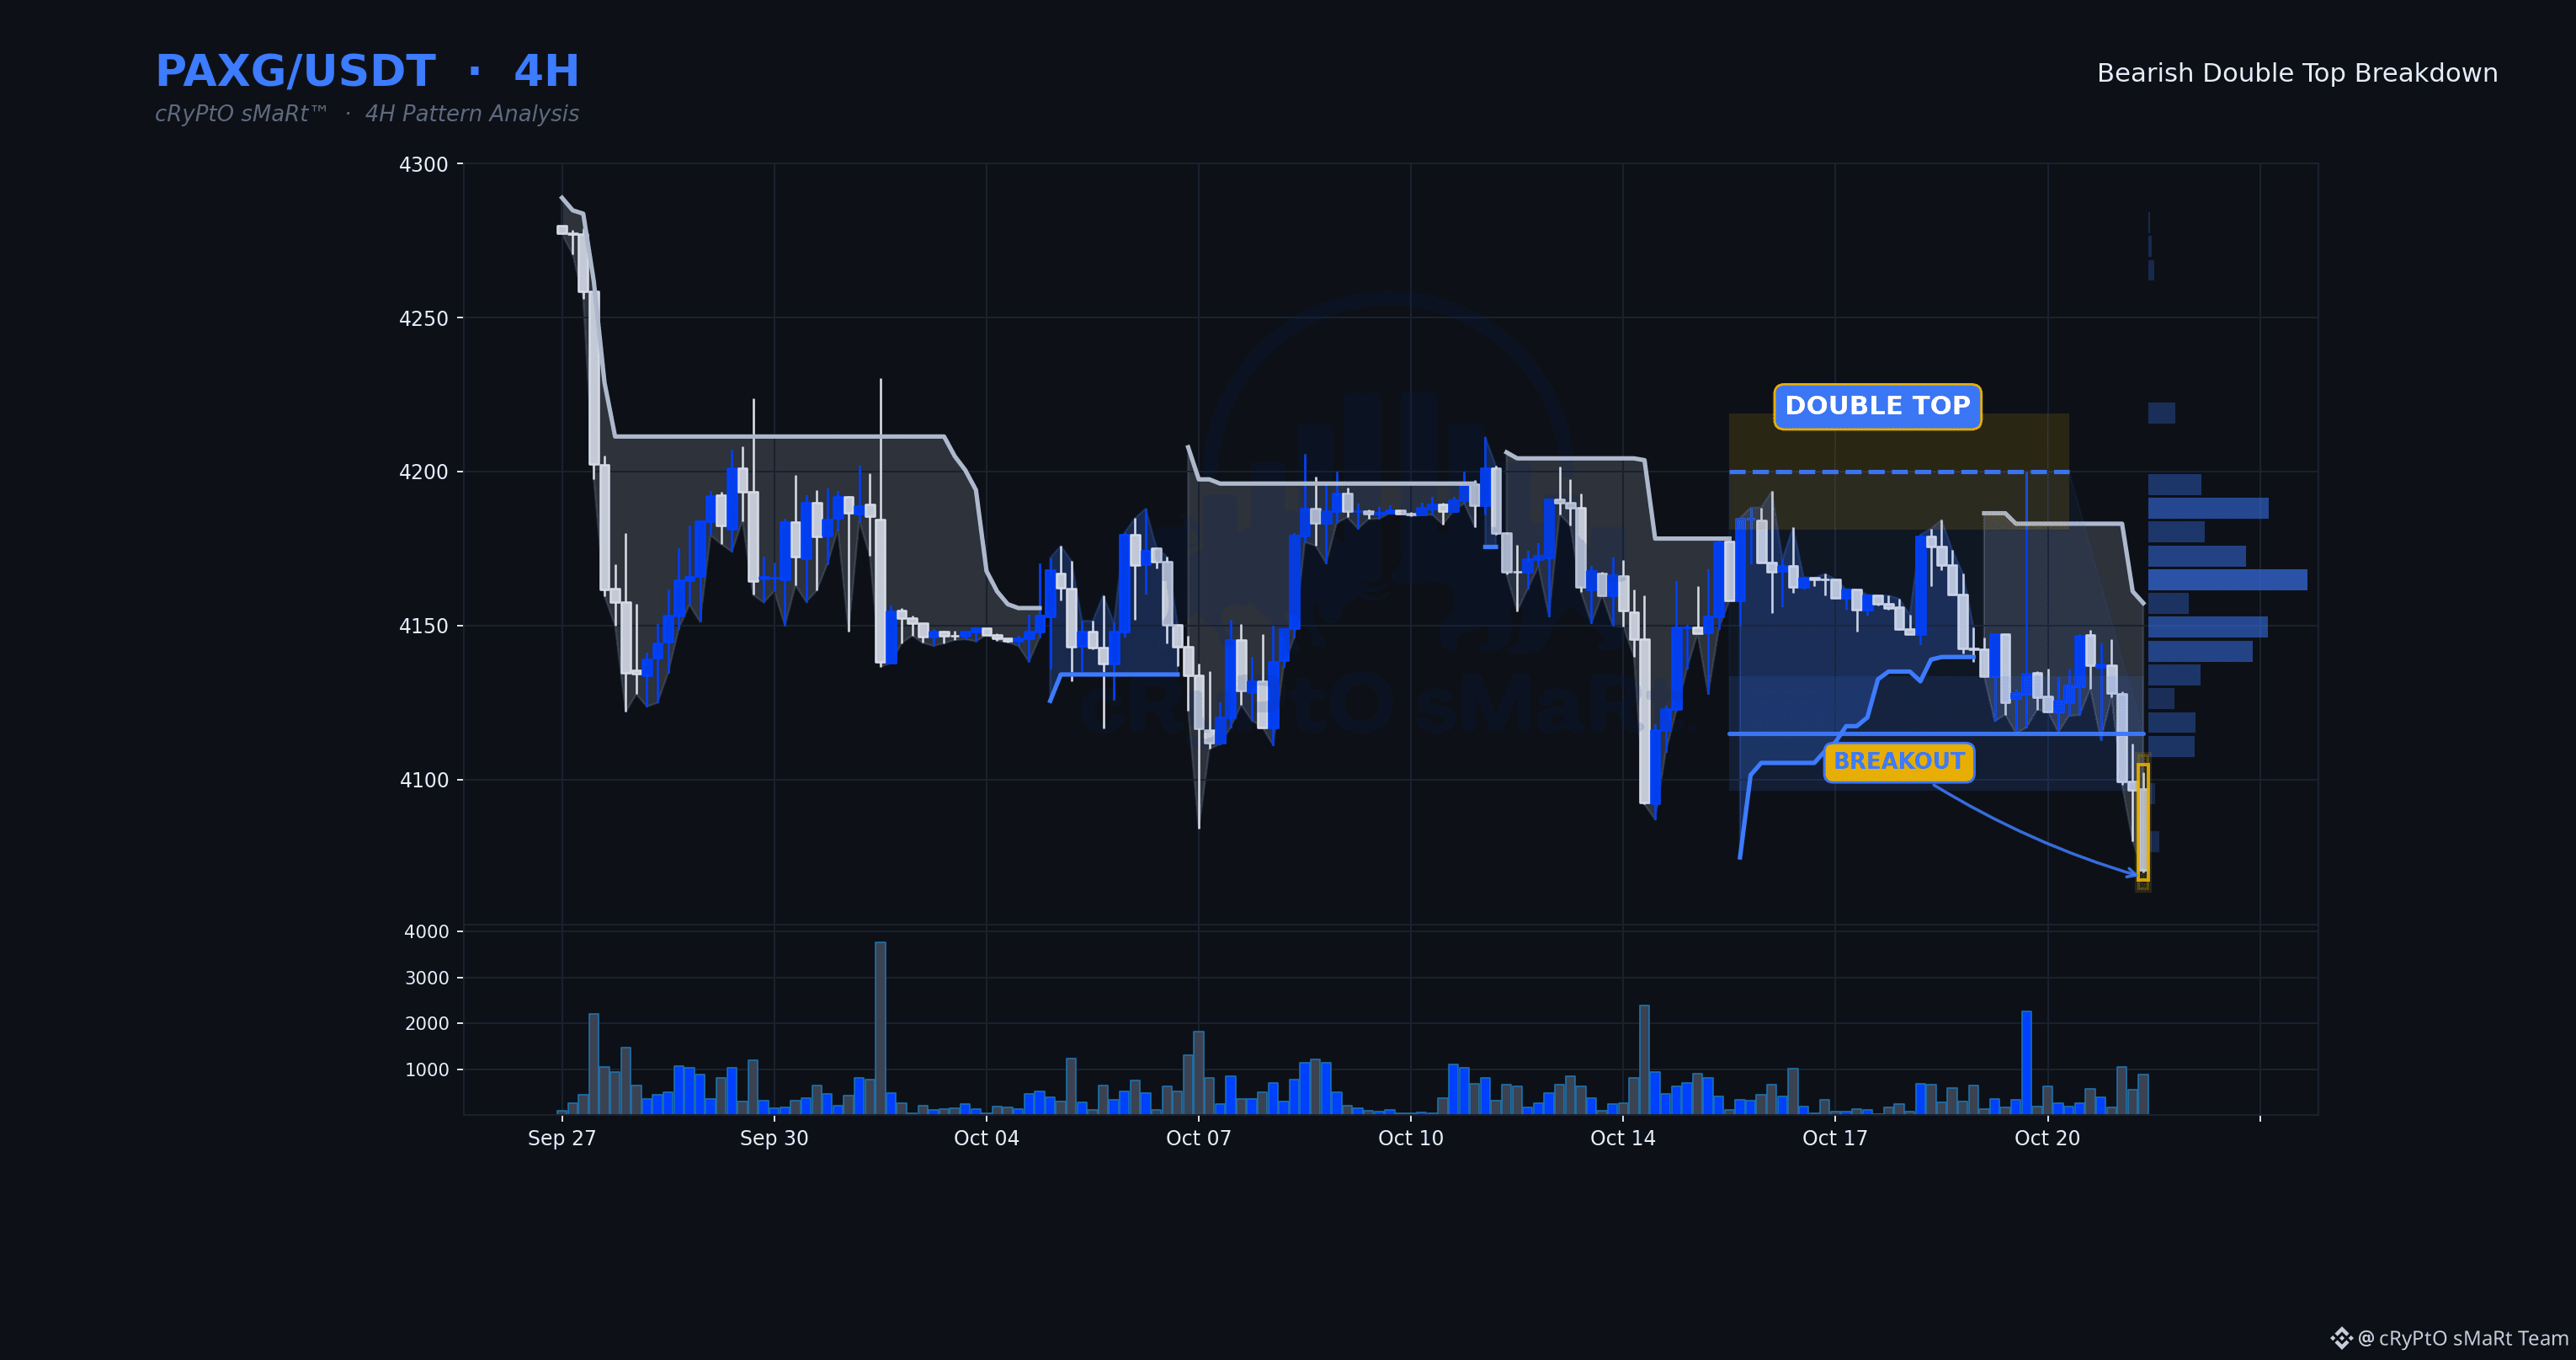
Sellers just took the neckline out with volume stepping up, not fading — that's the detail that separates a real breakdown from a trap. Two failed attempts at the top now read as distribution, and the decisive close through structure confirms sellers were in control the whole time.
🗓 Daily: Bearish — price below the daily Supertrend with a falling 50/200 EMA stack
⏱ 4H: Double Top · Bearish bias
⏳ 1H: the 1H is trading below the level with its trend down — the lower timeframe confirms the setup.
✅ Daily, 4H and 1H all point bearish.
📋 WHY IT QUALIFIES
✓ Double Top structure completed
✓ Decisive breakdown — closed 1.1% beyond the line
✓ Volume 1.7× its 20-bar average
✓ RSI 27 — momentum confirms, not yet exhausted
🧭 Bias: Bearish while price holds below $4,115.00
⚠️ Invalidation: 4H close back above $4,115.00
🔵 Support $4,115.00 🟡 Resistance $4,200.00
$PAXG $BTC #ChartPatterns
Education only, not financial advice.
Sellers just took the neckline out with volume stepping up, not fading — that's the detail that separates a real breakdown from a trap. Two failed attempts at the top now read as distribution, and the decisive close through structure confirms sellers were in control the whole time.
🗓 Daily: Bearish — price below the daily Supertrend with a falling 50/200 EMA stack
⏱ 4H: Double Top · Bearish bias
⏳ 1H: the 1H is trading below the level with its trend down — the lower timeframe confirms the setup.
✅ Daily, 4H and 1H all point bearish.
📋 WHY IT QUALIFIES
✓ Double Top structure completed
✓ Decisive breakdown — closed 1.1% beyond the line
✓ Volume 1.7× its 20-bar average
✓ RSI 27 — momentum confirms, not yet exhausted
🧭 Bias: Bearish while price holds below $4,115.00
⚠️ Invalidation: 4H close back above $4,115.00
🔵 Support $4,115.00 🟡 Resistance $4,200.00
$PAXG $BTC #ChartPatterns
Education only, not financial advice.
🗓 Daily: Bearish — price below the daily Supertrend with a falling 50/200 EMA stack
⏱ 4H: Double Top · Bearish bias
⏳ 1H: the 1H is trading below the level with its trend down — the lower timeframe confirms the setup.
✅ Daily, 4H and 1H all point bearish.
📋 WHY IT QUALIFIES
✓ Double Top structure completed
✓ Decisive breakdown — closed 1.1% beyond the line
✓ Volume 1.7× its 20-bar average
✓ RSI 27 — momentum confirms, not yet exhausted
🧭 Bias: Bearish while price holds below $4,115.00
⚠️ Invalidation: 4H close back above $4,115.00
🔵 Support $4,115.00 🟡 Resistance $4,200.00
$PAXG $BTC #ChartPatterns
Education only, not financial advice.
141
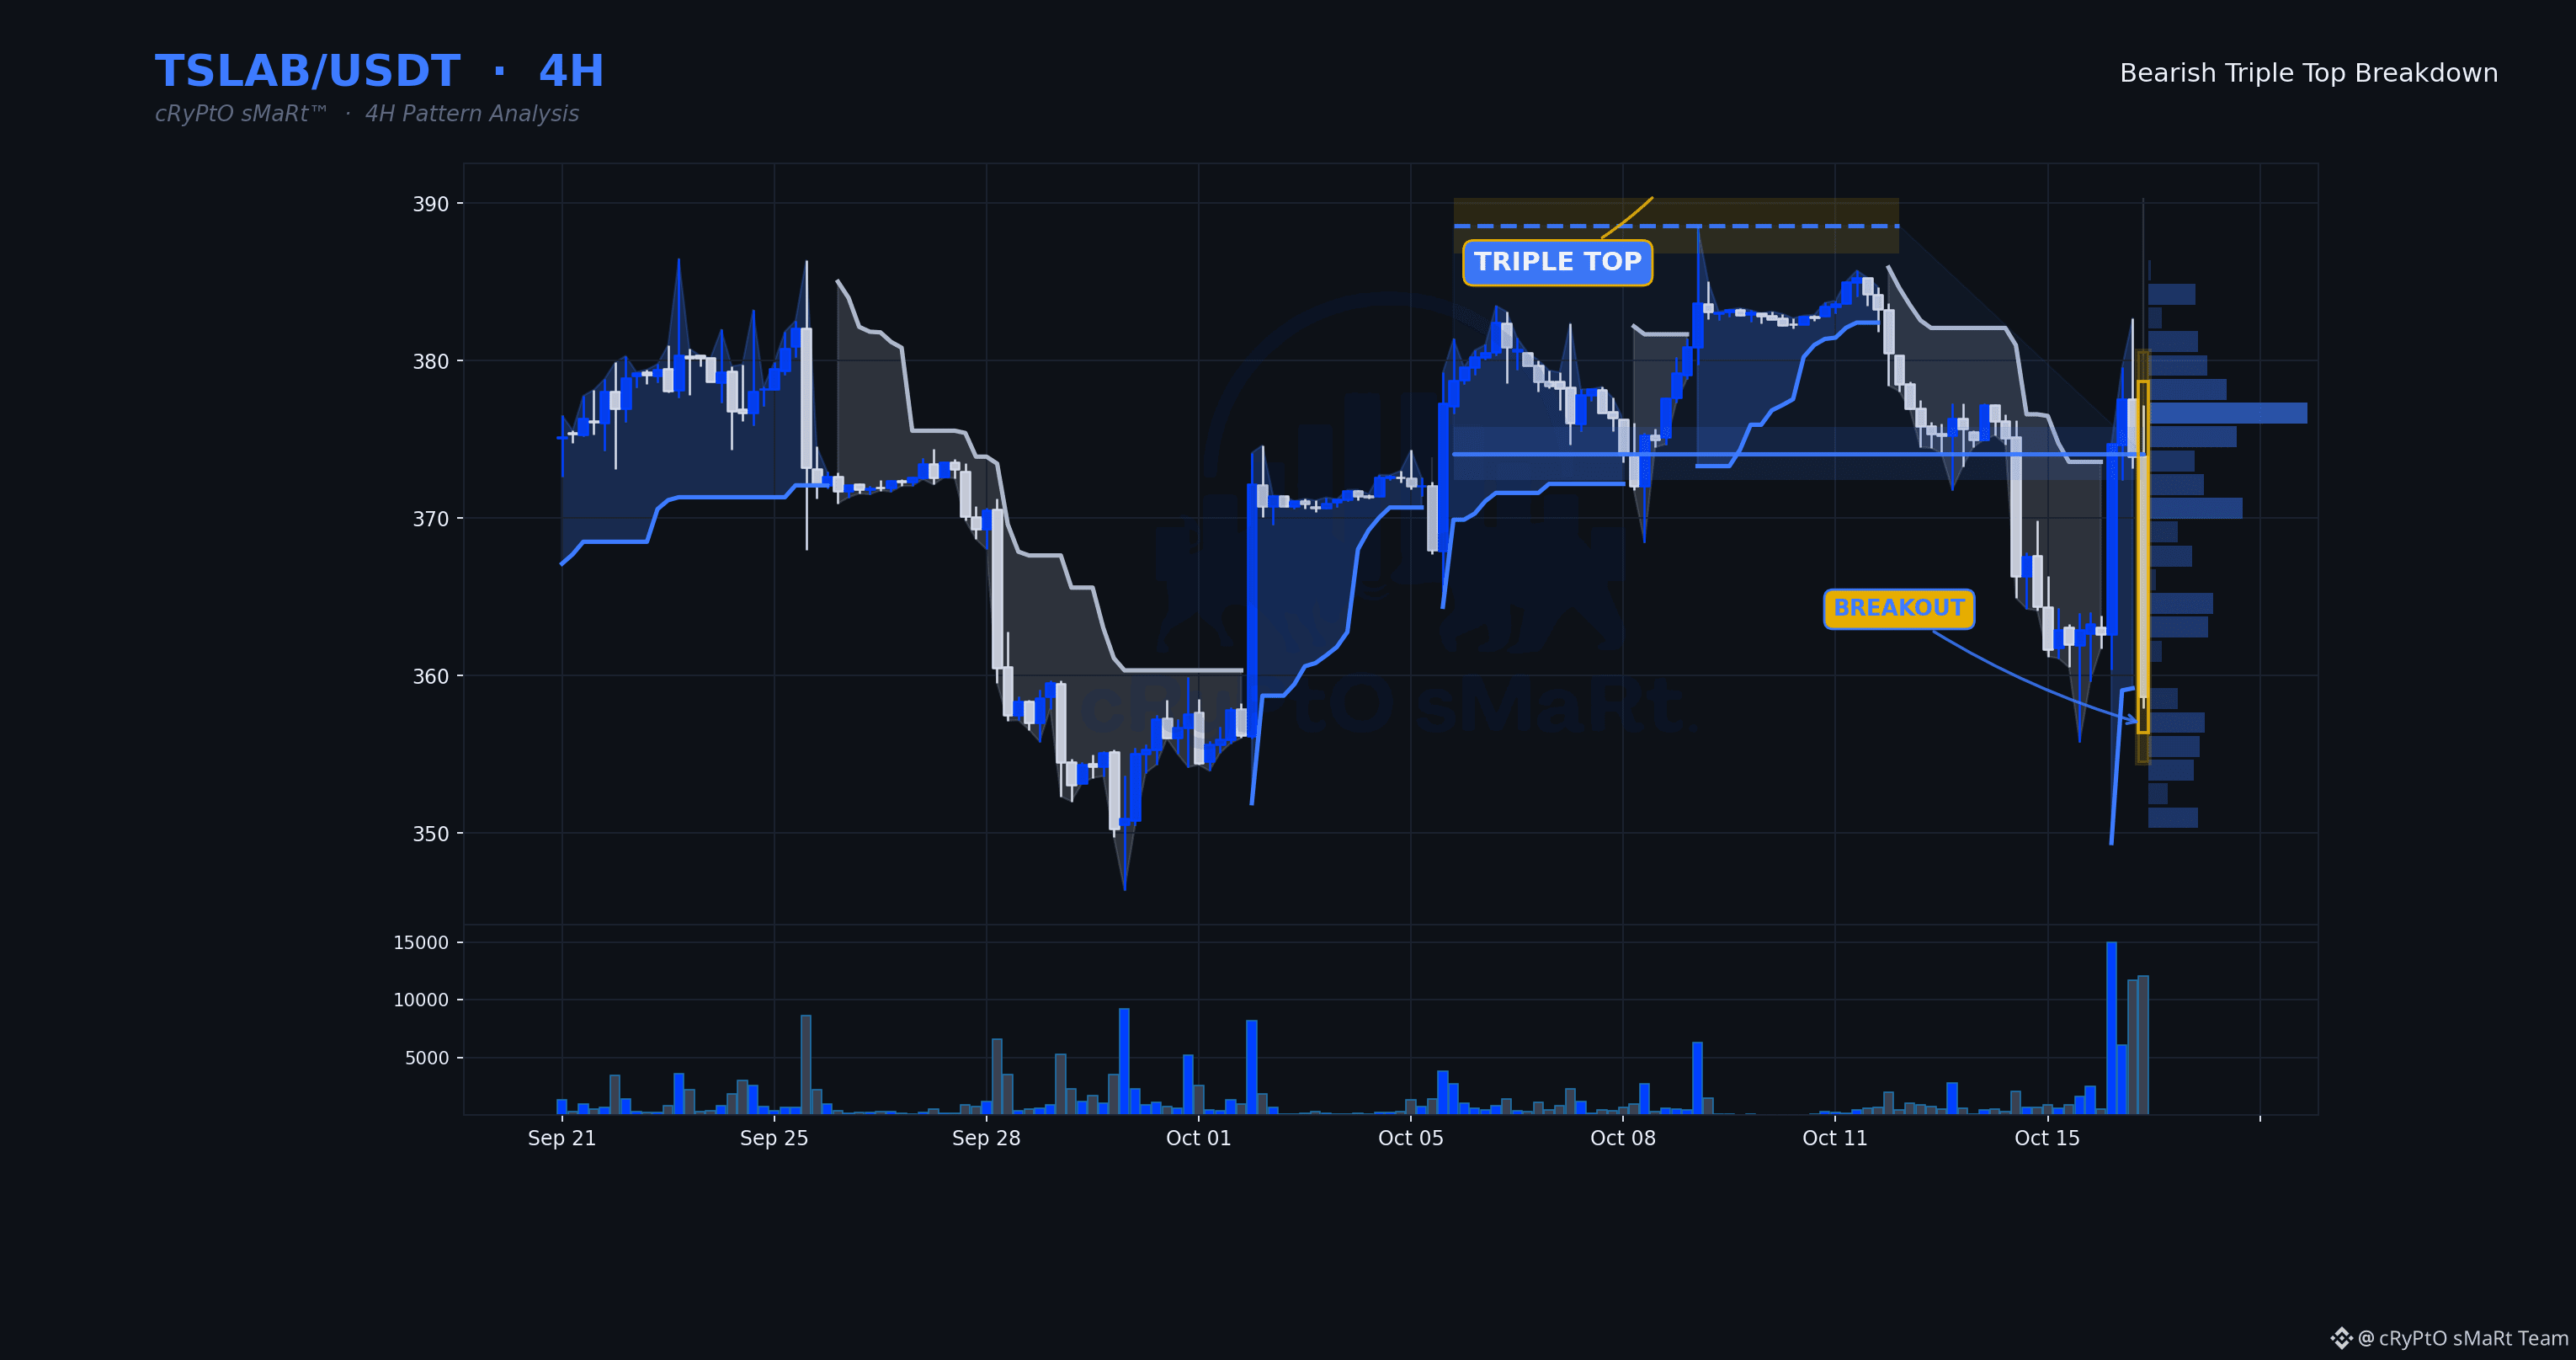
Sellers finally broke the shelf that held three separate times, and they did it with volume stepping up, not fading — that's distribution finishing, not a one-off flush. Momentum still has room to extend, which tells you this isn't exhausted on the first push down.
🗓 Daily: Neutral — daily is mixed — Supertrend and EMAs not aligned
⏱ 4H: Triple Top · Bearish bias
⏳ 1H: the 1H is trading below the level with its trend down — the lower timeframe confirms the setup.
📋 WHY IT QUALIFIES
✓ Triple Top structure completed
✓ Decisive breakdown — closed 4.1% beyond the line
✓ Volume 4.0× its 20-bar average
✓ RSI 35 — momentum confirms, not yet exhausted
🧭 Bias: Bearish while price holds below $374.0850
⚠️ Invalidation: 4H close back above $374.0850
🔵 Support $374.0850 🟡 Resistance $388.5600
$TSLAB $BTC #ChartPatterns
Education only, not financial advice.
Sellers finally broke the shelf that held three separate times, and they did it with volume stepping up, not fading — that's distribution finishing, not a one-off flush. Momentum still has room to extend, which tells you this isn't exhausted on the first push down.
🗓 Daily: Neutral — daily is mixed — Supertrend and EMAs not aligned
⏱ 4H: Triple Top · Bearish bias
⏳ 1H: the 1H is trading below the level with its trend down — the lower timeframe confirms the setup.
📋 WHY IT QUALIFIES
✓ Triple Top structure completed
✓ Decisive breakdown — closed 4.1% beyond the line
✓ Volume 4.0× its 20-bar average
✓ RSI 35 — momentum confirms, not yet exhausted
🧭 Bias: Bearish while price holds below $374.0850
⚠️ Invalidation: 4H close back above $374.0850
🔵 Support $374.0850 🟡 Resistance $388.5600
$TSLAB $BTC #ChartPatterns
Education only, not financial advice.
🗓 Daily: Neutral — daily is mixed — Supertrend and EMAs not aligned
⏱ 4H: Triple Top · Bearish bias
⏳ 1H: the 1H is trading below the level with its trend down — the lower timeframe confirms the setup.
📋 WHY IT QUALIFIES
✓ Triple Top structure completed
✓ Decisive breakdown — closed 4.1% beyond the line
✓ Volume 4.0× its 20-bar average
✓ RSI 35 — momentum confirms, not yet exhausted
🧭 Bias: Bearish while price holds below $374.0850
⚠️ Invalidation: 4H close back above $374.0850
🔵 Support $374.0850 🟡 Resistance $388.5600
$TSLAB $BTC #ChartPatterns
Education only, not financial advice.
91

·
--
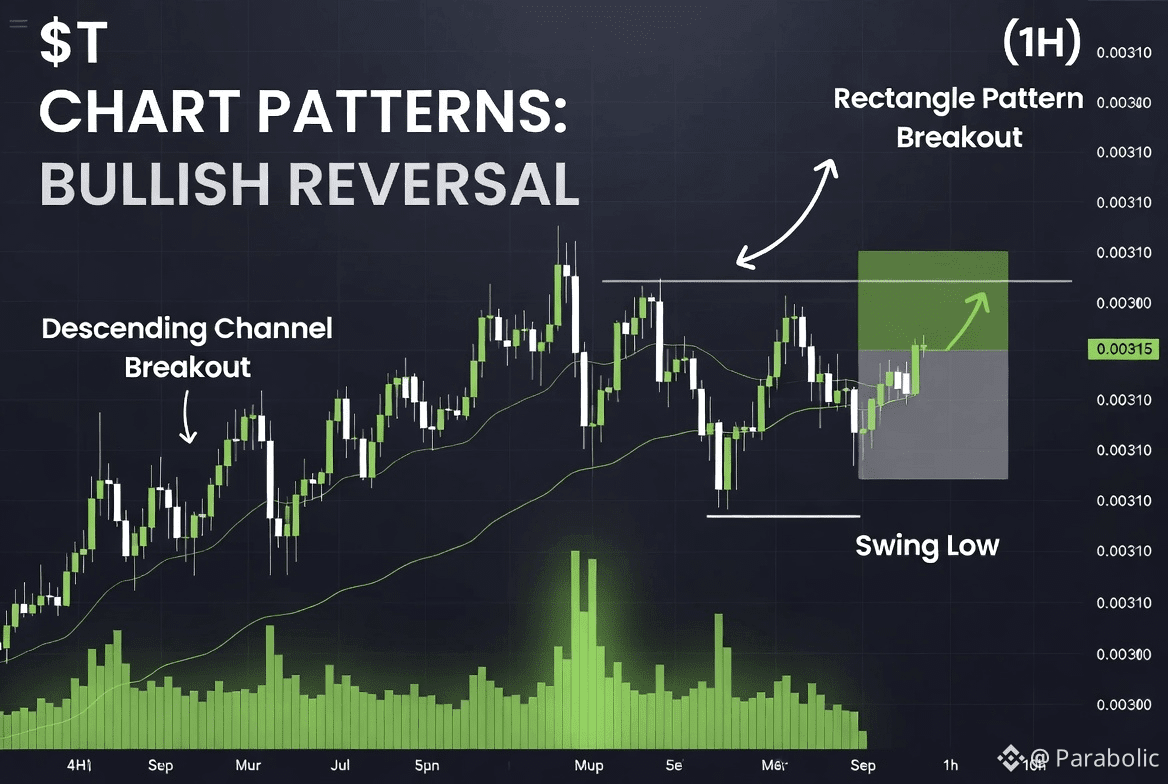
On the 4H timeframe, $T has broken out of a prolonged downtrend that bottomed near 0.00315. The latest 4H candle is a strong bullish breaker that has cleared previous resistance and the declining moving averages, forming a classic trend-reversal breakout. On the 1H chart, price has simultaneously broken out of a multi-week rectangular consolidation pattern. These dual-timeframe breakouts often produce measured moves equal to the height of the prior range or channel. X sentiment is strongly bullish, with multiple traders posting long setups targeting higher prices amid the ongoing pump. Trading Setup (Long – Pattern Breakout):
Entry: 0.00470 (confirmed close above resistance)
Take Profit 1: 0.00520
Take Profit 2: 0.00580
Take Profit 3: 0.00650
Stop Loss: 0.00430 (below 4H structure low)
#ChartPatterns #BreakoutTrading
trade here $T
{spot}(TUSDT)
On the 4H timeframe, $T has broken out of a prolonged downtrend that bottomed near 0.00315. The latest 4H candle is a strong bullish breaker that has cleared previous resistance and the declining moving averages, forming a classic trend-reversal breakout. On the 1H chart, price has simultaneously broken out of a multi-week rectangular consolidation pattern. These dual-timeframe breakouts often produce measured moves equal to the height of the prior range or channel. X sentiment is strongly bullish, with multiple traders posting long setups targeting higher prices amid the ongoing pump. Trading Setup (Long – Pattern Breakout):
Entry: 0.00470 (confirmed close above resistance)
Take Profit 1: 0.00520
Take Profit 2: 0.00580
Take Profit 3: 0.00650
Stop Loss: 0.00430 (below 4H structure low)
#ChartPatterns #BreakoutTrading
trade here $T
Entry: 0.00470 (confirmed close above resistance)
Take Profit 1: 0.00520
Take Profit 2: 0.00580
Take Profit 3: 0.00650
Stop Loss: 0.00430 (below 4H structure low)
#ChartPatterns #BreakoutTrading
trade here $T
178

·
--
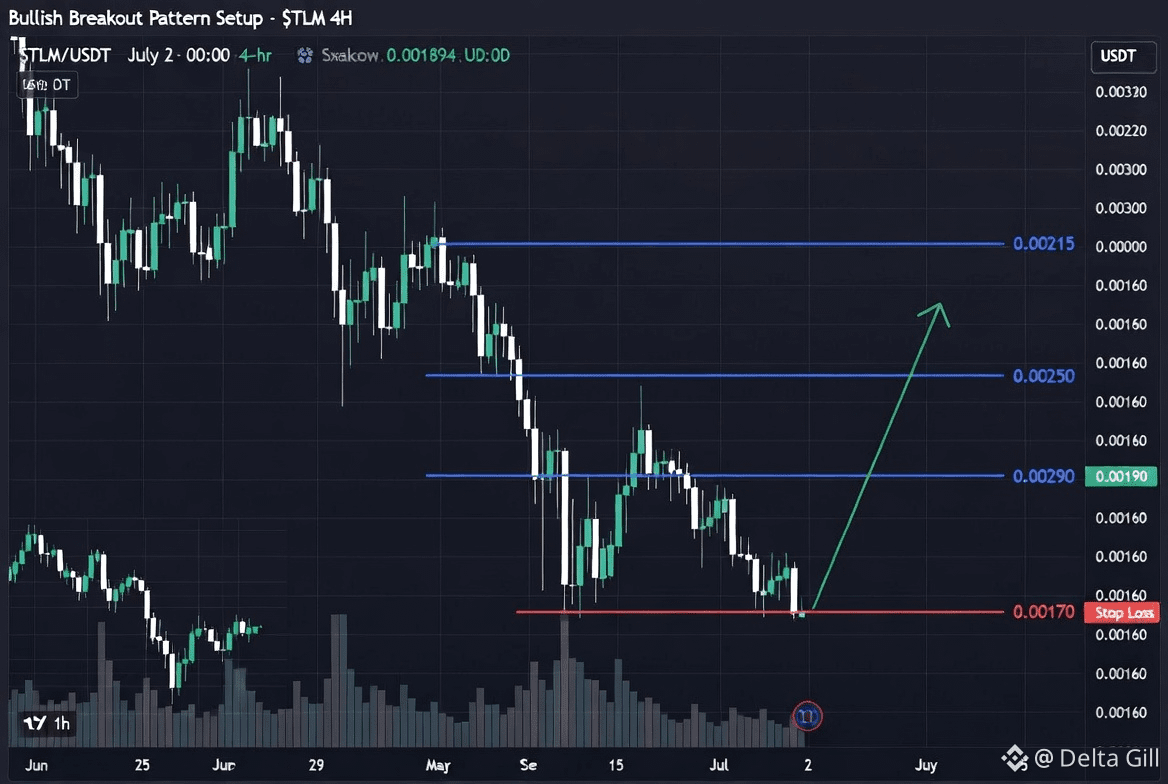
On the 4H chart, $TLM has broken out of a prolonged descending channel with a decisive bullish candle and heavy volume. The 1H timeframe shows a clear impulsive breakout structure after consolidation near the lows. This pattern resembles a falling wedge or descending channel breakout — classic bullish reversal signals. Combined with the latest data showing extreme volume spike and renewed trader interest in Alien Worlds, the breakout has strong conviction.Bullish Trading Setup Entry: 0.00190 (break and close above recent high or retest of breakout level)
Take Profit 1: 0.00215
Take Profit 2: 0.00250
Take Profit 3: 0.00300
Stop Loss: 0.00170 (below the breakout candle low)
Measured move targets suggest significant upside potential. #TLM #ChartPatterns
On the 4H chart, $TLM has broken out of a prolonged descending channel with a decisive bullish candle and heavy volume. The 1H timeframe shows a clear impulsive breakout structure after consolidation near the lows. This pattern resembles a falling wedge or descending channel breakout — classic bullish reversal signals. Combined with the latest data showing extreme volume spike and renewed trader interest in Alien Worlds, the breakout has strong conviction.Bullish Trading Setup Entry: 0.00190 (break and close above recent high or retest of breakout level)
Take Profit 1: 0.00215
Take Profit 2: 0.00250
Take Profit 3: 0.00300
Stop Loss: 0.00170 (below the breakout candle low)
Measured move targets suggest significant upside potential. #TLM #ChartPatterns
Take Profit 1: 0.00215
Take Profit 2: 0.00250
Take Profit 3: 0.00300
Stop Loss: 0.00170 (below the breakout candle low)
Measured move targets suggest significant upside potential. #TLM #ChartPatterns
182

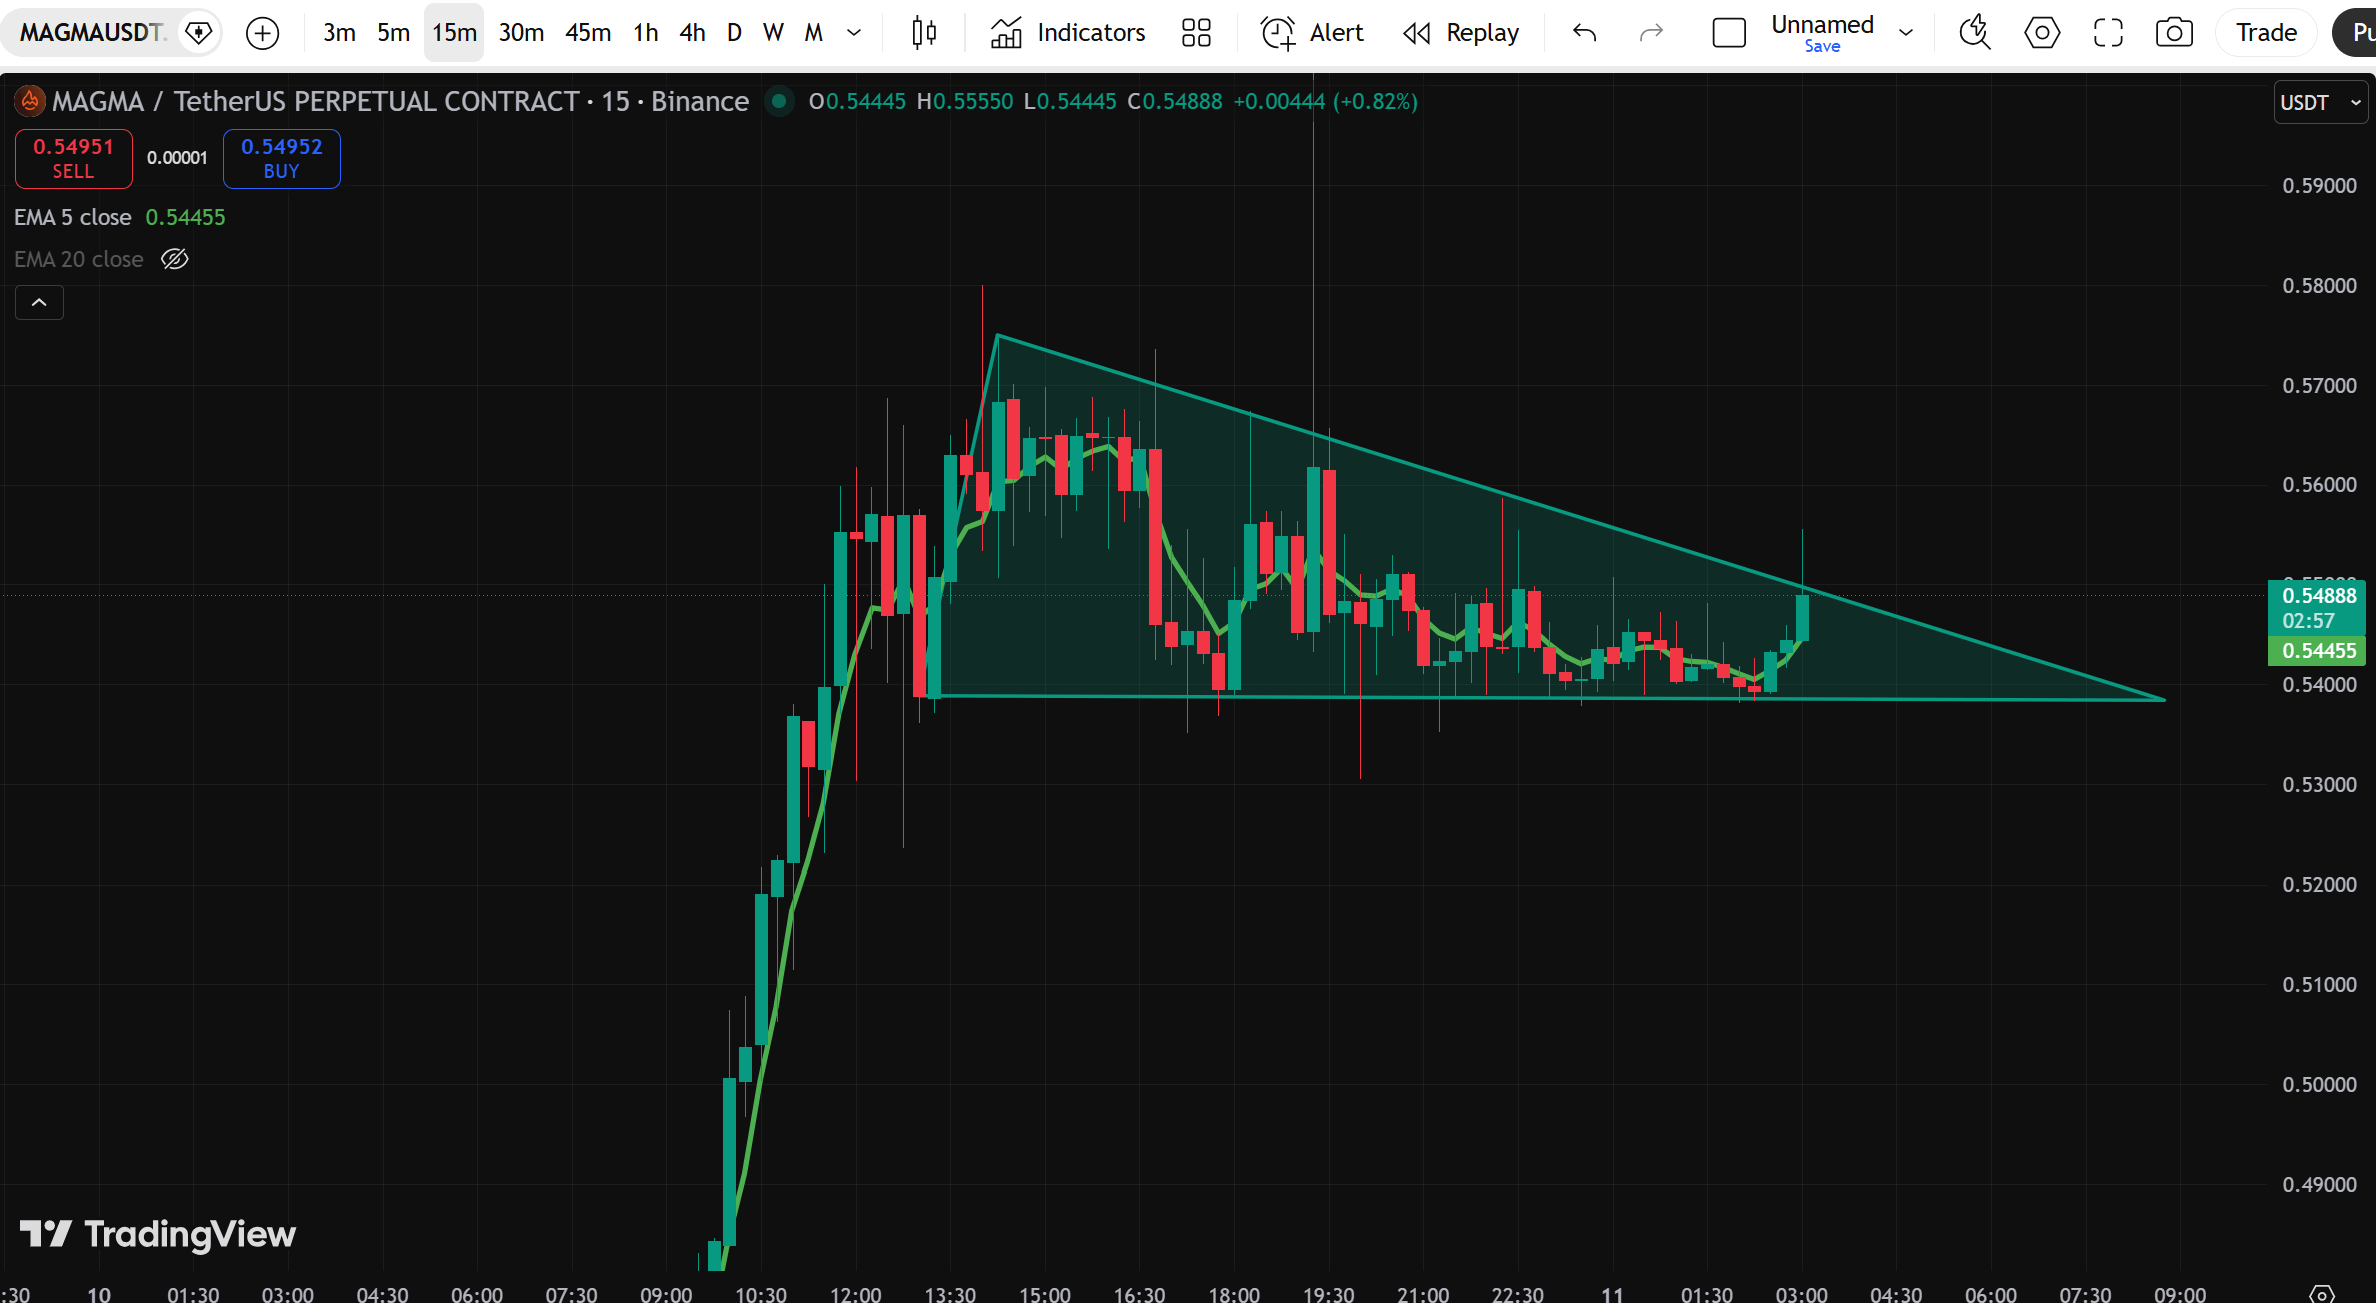
🚨 $MAGMA IS ABOUT TO ERUPT! MASSIVE SQUEEZE IN PROGRESS!
🚨If you are trading MAGMA/USDT, you need to be watching this 15-minute chart right now. After a phenomenal vertical rally, the price has entered a massive volatility squeeze, and the pressure is reaching a boiling point!
🌋📊 The Technical Setup:
The Squeeze:
We are looking at a textbook consolidation pattern. The bulls have built an unbreakable horizontal floor of support, while descending resistance has kept the price tightly compressed over the last several hours.The Breakout Attempt: Right now, the price is sitting at $0.54888 and aggressively pushing against the upper boundary of this triangle!Momentum:
$MAGMA just reclaimed the short-term 5 EMA (the green line), showing that buyers are waking up and applying serious pressure right at the exact moment it matters most.💡 The Play:The apex is getting incredibly tight, and volume is thinning out—this is the classic "calm before the storm." We are waiting for that single explosive 15m candle close above the descending trendline. Once that lid blows off, expect a violent expansion back toward the local highs!Set your alerts and keep your eyes glued to the chart. This coil is about to spring! 🚀📈
$MAGMA
{future}(MAGMAUSDT)
#MAGMAUSDT #cryptosignals #chartpatterns #BreakoutTrading
🚨 $MAGMA IS ABOUT TO ERUPT! MASSIVE SQUEEZE IN PROGRESS!
🚨If you are trading MAGMA/USDT, you need to be watching this 15-minute chart right now. After a phenomenal vertical rally, the price has entered a massive volatility squeeze, and the pressure is reaching a boiling point!
🌋📊 The Technical Setup:
The Squeeze:
We are looking at a textbook consolidation pattern. The bulls have built an unbreakable horizontal floor of support, while descending resistance has kept the price tightly compressed over the last several hours.The Breakout Attempt: Right now, the price is sitting at $0.54888 and aggressively pushing against the upper boundary of this triangle!Momentum:
$MAGMA just reclaimed the short-term 5 EMA (the green line), showing that buyers are waking up and applying serious pressure right at the exact moment it matters most.💡 The Play:The apex is getting incredibly tight, and volume is thinning out—this is the classic "calm before the storm." We are waiting for that single explosive 15m candle close above the descending trendline. Once that lid blows off, expect a violent expansion back toward the local highs!Set your alerts and keep your eyes glued to the chart. This coil is about to spring! 🚀📈
$MAGMA
#MAGMAUSDT #cryptosignals #chartpatterns #BreakoutTrading
🚨If you are trading MAGMA/USDT, you need to be watching this 15-minute chart right now. After a phenomenal vertical rally, the price has entered a massive volatility squeeze, and the pressure is reaching a boiling point!
🌋📊 The Technical Setup:
The Squeeze:
We are looking at a textbook consolidation pattern. The bulls have built an unbreakable horizontal floor of support, while descending resistance has kept the price tightly compressed over the last several hours.The Breakout Attempt: Right now, the price is sitting at $0.54888 and aggressively pushing against the upper boundary of this triangle!Momentum:
$MAGMA just reclaimed the short-term 5 EMA (the green line), showing that buyers are waking up and applying serious pressure right at the exact moment it matters most.💡 The Play:The apex is getting incredibly tight, and volume is thinning out—this is the classic "calm before the storm." We are waiting for that single explosive 15m candle close above the descending trendline. Once that lid blows off, expect a violent expansion back toward the local highs!Set your alerts and keep your eyes glued to the chart. This coil is about to spring! 🚀📈
$MAGMA
#MAGMAUSDT #cryptosignals #chartpatterns #BreakoutTrading
100

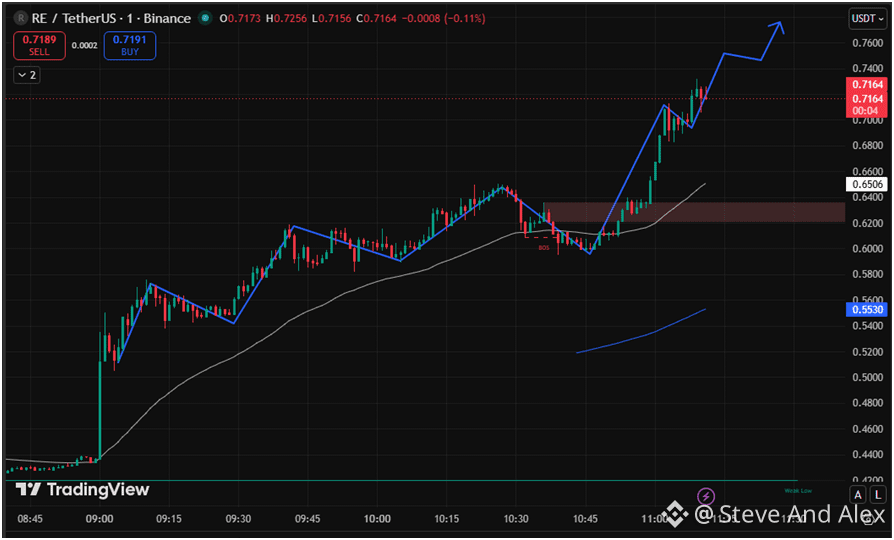
🚀 RE/USDT Technical Analysis: Bullish Momentum & Market Structure Break!
📈Looking at the 1-minute chart for RE/USDT on Binance, we are witnessing some incredibly clean price action and a strong textbook reversal.
Here is a breakdown of what the chart in image_a3335c.png is telling us:
🔹 The Setup: After an initial massive surge earlier in the session, the price entered a healthy correction phase, putting in a lower high and searching for a solid support floor.
🔹 Market Structure Shift: The price found strong buying interest around the 0.5800–0.6000 zone. Following a brief "Break of Structure" (BOS) signal, the bulls aggressively took over.
🔹 The Breakout: RE has completely invalidated the previous local resistance zone (highlighted by the red horizontal block around 0.6200–0.6400). It didn't just break it—it surged right through it with high volume, pushing past the 0.7200 mark!
🔹 Current State: The price is sitting strong at 0.7244 (+0.84% on the immediate candle), holding well above its moving averages. The blue pathing indicator suggests the asset is eyeing a continuation toward the 0.7600–0.7800 levels if this momentum sustains.
💡 Key Takeaway:When an asset breaks a key psychological and structural resistance zone with this kind of velocity, the old resistance frequently flips into a rock-solid support floor. Watching closely to see if it consolidates here before the next leg up!Are you holding or trading $RE today? What are your short-term price targets for this rally? Let me know your thoughts in the comments below! 👇
#TechnicalAnalysis $RE #ChartPatterns #BullishMomentum
{spot}(REUSDT)
TRADE NOW!!!
🚀 RE/USDT Technical Analysis: Bullish Momentum & Market Structure Break!
📈Looking at the 1-minute chart for RE/USDT on Binance, we are witnessing some incredibly clean price action and a strong textbook reversal.
Here is a breakdown of what the chart in image_a3335c.png is telling us:
🔹 The Setup: After an initial massive surge earlier in the session, the price entered a healthy correction phase, putting in a lower high and searching for a solid support floor.
🔹 Market Structure Shift: The price found strong buying interest around the 0.5800–0.6000 zone. Following a brief "Break of Structure" (BOS) signal, the bulls aggressively took over.
🔹 The Breakout: RE has completely invalidated the previous local resistance zone (highlighted by the red horizontal block around 0.6200–0.6400). It didn't just break it—it surged right through it with high volume, pushing past the 0.7200 mark!
🔹 Current State: The price is sitting strong at 0.7244 (+0.84% on the immediate candle), holding well above its moving averages. The blue pathing indicator suggests the asset is eyeing a continuation toward the 0.7600–0.7800 levels if this momentum sustains.
💡 Key Takeaway:When an asset breaks a key psychological and structural resistance zone with this kind of velocity, the old resistance frequently flips into a rock-solid support floor. Watching closely to see if it consolidates here before the next leg up!Are you holding or trading $RE today? What are your short-term price targets for this rally? Let me know your thoughts in the comments below! 👇
#TechnicalAnalysis $RE #ChartPatterns #BullishMomentum
TRADE NOW!!!
📈Looking at the 1-minute chart for RE/USDT on Binance, we are witnessing some incredibly clean price action and a strong textbook reversal.
Here is a breakdown of what the chart in image_a3335c.png is telling us:
🔹 The Setup: After an initial massive surge earlier in the session, the price entered a healthy correction phase, putting in a lower high and searching for a solid support floor.
🔹 Market Structure Shift: The price found strong buying interest around the 0.5800–0.6000 zone. Following a brief "Break of Structure" (BOS) signal, the bulls aggressively took over.
🔹 The Breakout: RE has completely invalidated the previous local resistance zone (highlighted by the red horizontal block around 0.6200–0.6400). It didn't just break it—it surged right through it with high volume, pushing past the 0.7200 mark!
🔹 Current State: The price is sitting strong at 0.7244 (+0.84% on the immediate candle), holding well above its moving averages. The blue pathing indicator suggests the asset is eyeing a continuation toward the 0.7600–0.7800 levels if this momentum sustains.
💡 Key Takeaway:When an asset breaks a key psychological and structural resistance zone with this kind of velocity, the old resistance frequently flips into a rock-solid support floor. Watching closely to see if it consolidates here before the next leg up!Are you holding or trading $RE today? What are your short-term price targets for this rally? Let me know your thoughts in the comments below! 👇
#TechnicalAnalysis $RE #ChartPatterns #BullishMomentum
TRADE NOW!!!
1
1
317
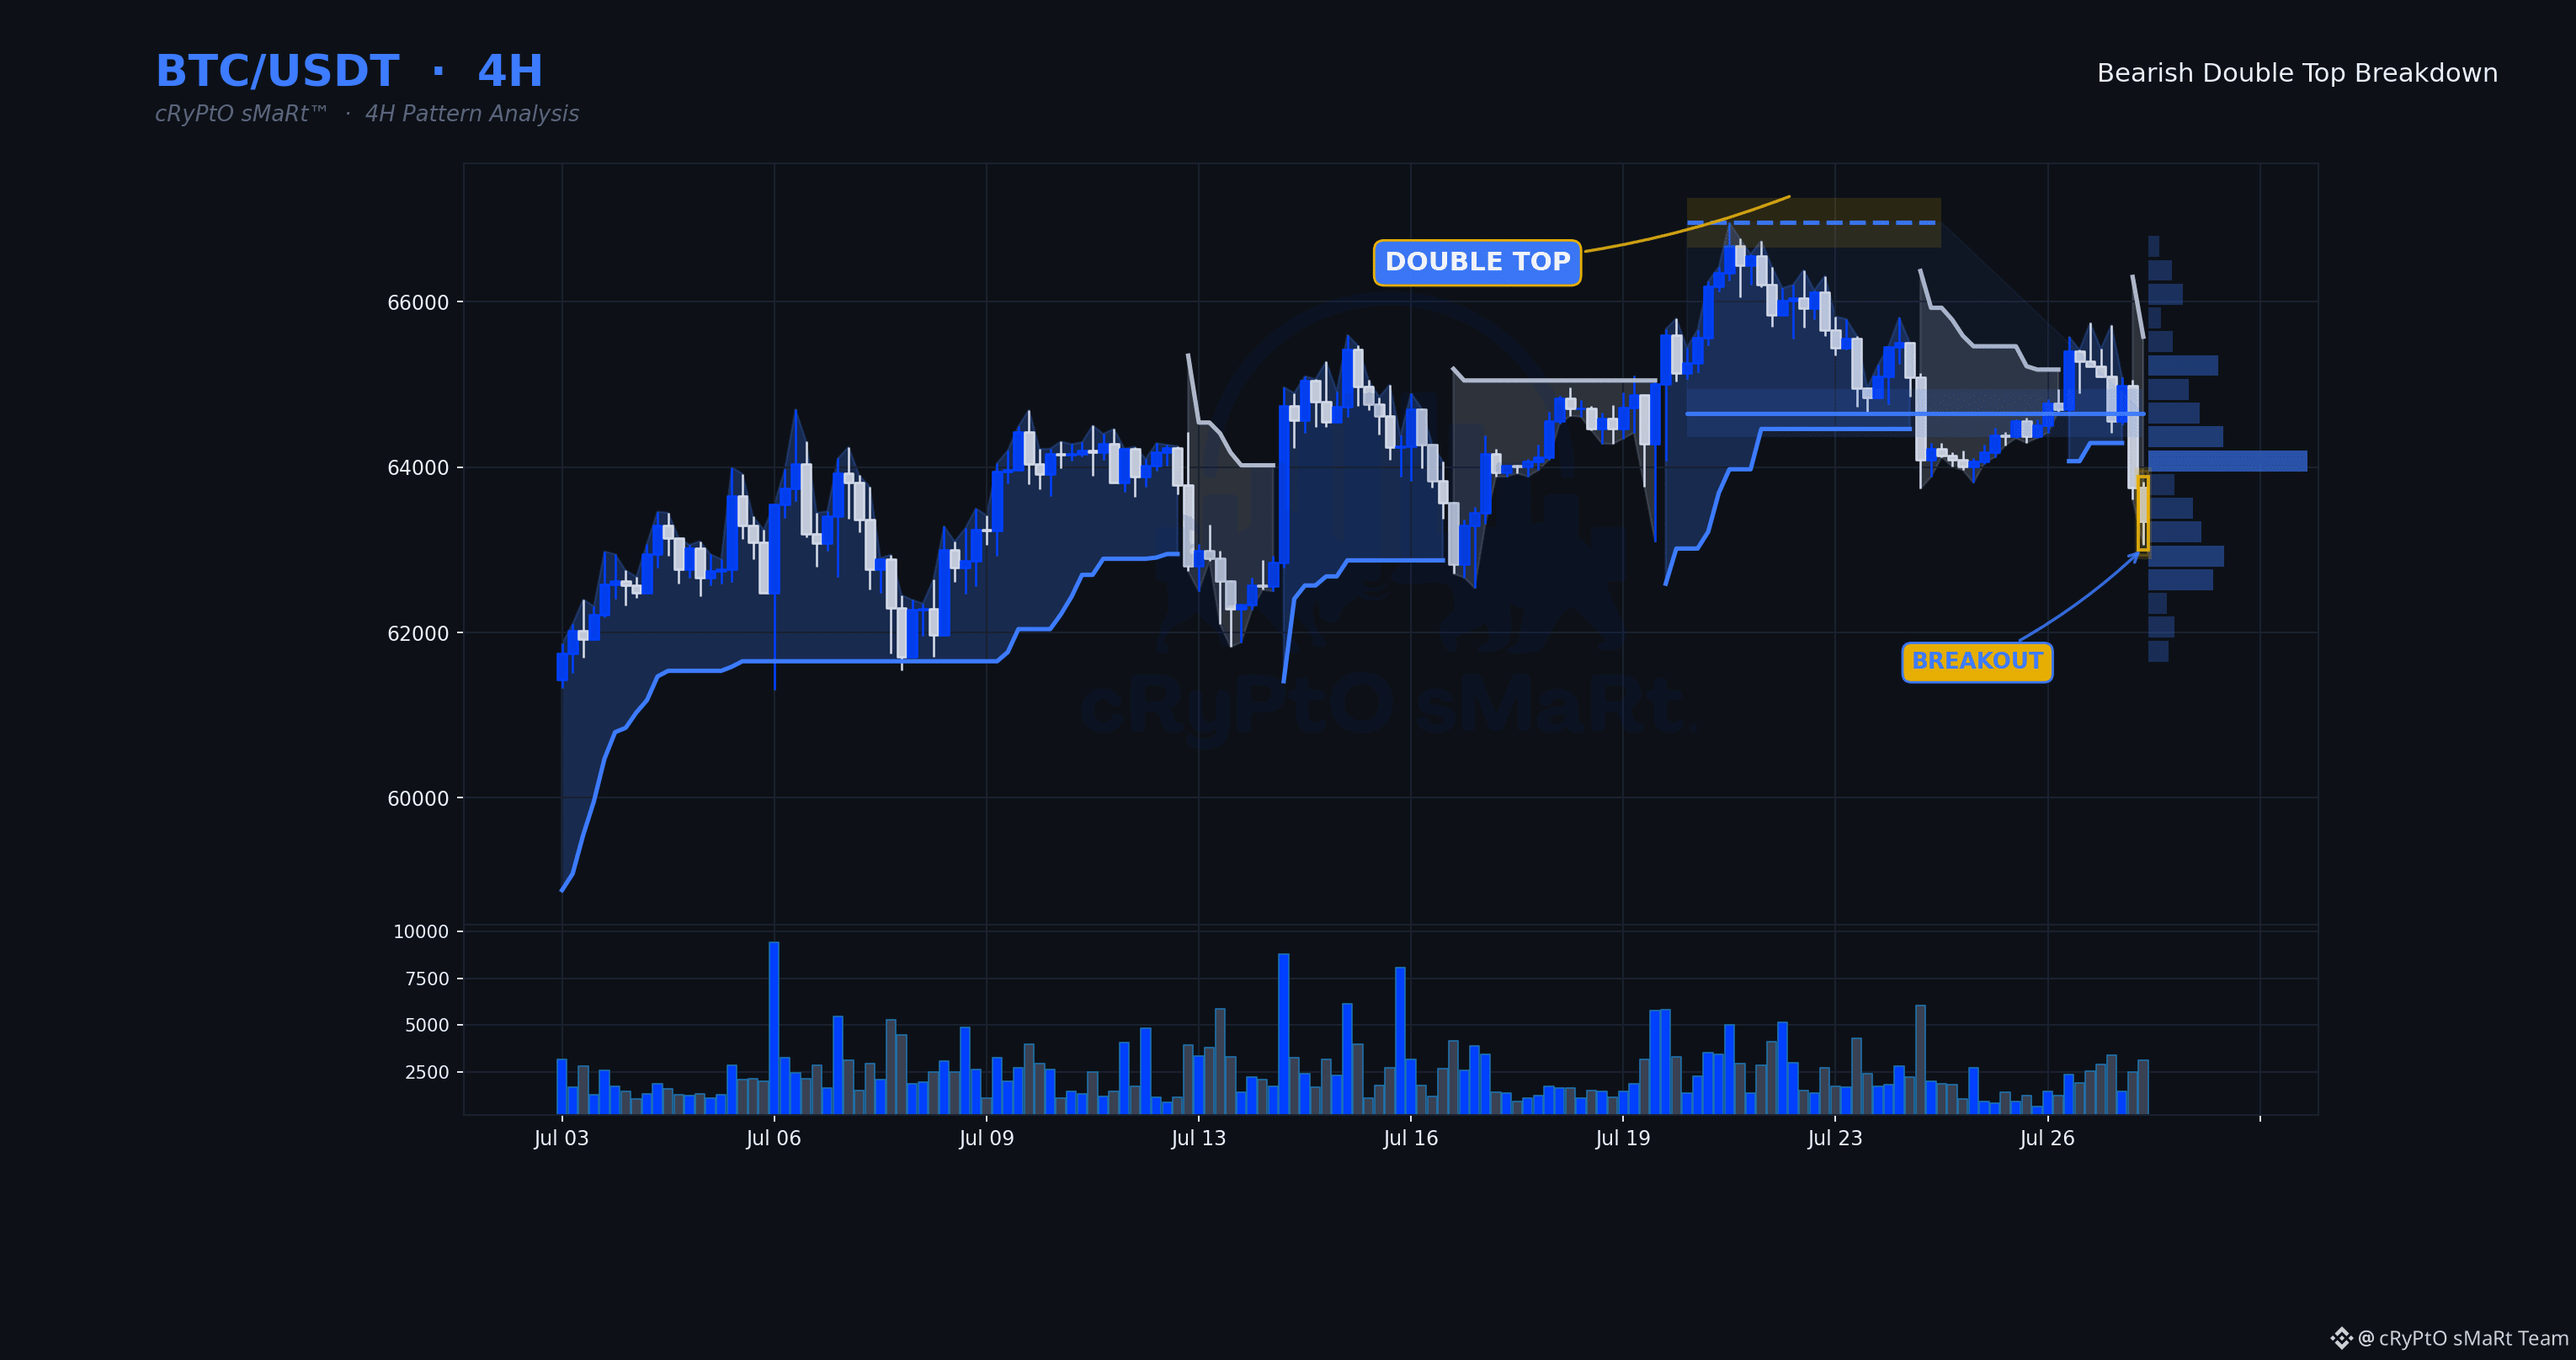
Sellers just took the neckline out with volume that actually backs the move — this isn't a drift lower, it's a decisive break with participation behind it. Momentum's got room left, which means the move isn't stretched or exhausted on this timeframe yet.
🗓 Daily: Neutral — daily is mixed — Supertrend and EMAs not aligned
⏱ 4H: Double Top · Bearish bias
⏳ 1H: the 1H is trading below the level with its trend down — the lower timeframe confirms the setup.
📋 WHY IT QUALIFIES
✓ Double Top structure completed
✓ Decisive breakdown — closed 2.0% beyond the line
✓ Volume 1.7× its 20-bar average
✓ RSI 34 — momentum confirms, not yet exhausted
🧭 Bias: Bearish while price holds below $64,650.00
⚠️ Invalidation: 4H close back above $64,650.00
🔵 Support $64,650.00 🟡 Resistance $66,956.15
$BTC #ChartPatterns
Education only, not financial advice.
Sellers just took the neckline out with volume that actually backs the move — this isn't a drift lower, it's a decisive break with participation behind it. Momentum's got room left, which means the move isn't stretched or exhausted on this timeframe yet.
🗓 Daily: Neutral — daily is mixed — Supertrend and EMAs not aligned
⏱ 4H: Double Top · Bearish bias
⏳ 1H: the 1H is trading below the level with its trend down — the lower timeframe confirms the setup.
📋 WHY IT QUALIFIES
✓ Double Top structure completed
✓ Decisive breakdown — closed 2.0% beyond the line
✓ Volume 1.7× its 20-bar average
✓ RSI 34 — momentum confirms, not yet exhausted
🧭 Bias: Bearish while price holds below $64,650.00
⚠️ Invalidation: 4H close back above $64,650.00
🔵 Support $64,650.00 🟡 Resistance $66,956.15
$BTC #ChartPatterns
Education only, not financial advice.
🗓 Daily: Neutral — daily is mixed — Supertrend and EMAs not aligned
⏱ 4H: Double Top · Bearish bias
⏳ 1H: the 1H is trading below the level with its trend down — the lower timeframe confirms the setup.
📋 WHY IT QUALIFIES
✓ Double Top structure completed
✓ Decisive breakdown — closed 2.0% beyond the line
✓ Volume 1.7× its 20-bar average
✓ RSI 34 — momentum confirms, not yet exhausted
🧭 Bias: Bearish while price holds below $64,650.00
⚠️ Invalidation: 4H close back above $64,650.00
🔵 Support $64,650.00 🟡 Resistance $66,956.15
$BTC #ChartPatterns
Education only, not financial advice.
58

On the 4H chart, $ERA has completed a clean breakout from a long descending channel that defined price action since early June. The explosive July 21 impulse candle with surging volume is textbook channel-breakout behavior, often leading to measured-move extensions. The 1H chart shows the initial surge followed by consolidation that resembles a developing bull flag or pennant. This pattern setup favors continuation if the flag holds. X traders are actively calling longs on $ERA, noting its pump alongside other Binance Alpha names during the platform’s anniversary events, adding confluence to the technical breakout.Trading Setup (Descending Channel Breakout):
Entry: 0.1000–0.1030 (flag retest or current levels)
Take Profit 1: 0.1080
Take Profit 2: 0.1150
Take Profit 3: 0.1350 (measured move target)
Stop Loss: 0.0940
#ERA #ChartPatterns $ERA
{spot}(ERAUSDT)
On the 4H chart, $ERA has completed a clean breakout from a long descending channel that defined price action since early June. The explosive July 21 impulse candle with surging volume is textbook channel-breakout behavior, often leading to measured-move extensions. The 1H chart shows the initial surge followed by consolidation that resembles a developing bull flag or pennant. This pattern setup favors continuation if the flag holds. X traders are actively calling longs on $ERA , noting its pump alongside other Binance Alpha names during the platform’s anniversary events, adding confluence to the technical breakout.Trading Setup (Descending Channel Breakout):
Entry: 0.1000–0.1030 (flag retest or current levels)
Take Profit 1: 0.1080
Take Profit 2: 0.1150
Take Profit 3: 0.1350 (measured move target)
Stop Loss: 0.0940
#ERA #ChartPatterns $ERA
Entry: 0.1000–0.1030 (flag retest or current levels)
Take Profit 1: 0.1080
Take Profit 2: 0.1150
Take Profit 3: 0.1350 (measured move target)
Stop Loss: 0.0940
#ERA #ChartPatterns $ERA

217

·
--
📚 Trading Tip of the Day — What is an Ascending Triangle?
$XRP
{spot}(XRPUSDT)
You saw me mention "ascending triangle" in today's XRP analysis. Here's what this chart pattern actually means.
🔍 What is an ascending triangle?
A chart pattern formed by a flat (horizontal) resistance line on top and a rising support line on the bottom — created as buyers keep pushing price higher on each dip, while sellers defend the same resistance level repeatedly.
📊 Why it's considered bullish:
Each time price fails to break resistance but bounces from a HIGHER low than before, it shows buyers are gaining strength — they're willing to buy at increasingly higher prices rather than waiting for a deeper discount. This pattern often (though not always) resolves with a breakout above resistance.
🔑 How to trade around it (conceptually):
Traders typically watch for a confirmed close ABOVE the flat resistance line, often with increased volume, as the signal that buyers have finally won the battle. The height of the triangle is sometimes used as a rough guide for how far price might move after breaking out.
❌ Common mistake beginners make:
Assuming every ascending triangle breaks upward. These patterns can also fail and break down — that's why waiting for confirmation (an actual close above resistance) matters more than anticipating the breakout early.
📌 Golden rule: Chart patterns describe probability, not certainty. An ascending triangle increases the odds of an upside breakout, but always pair it with volume confirmation and broader market context before acting.
⚠️ This is educational content, not financial advice.
#CryptoEducation #TradingTips #ChartPatterns #BinanceSquare
📚 Trading Tip of the Day — What is an Ascending Triangle?
$XRP
You saw me mention "ascending triangle" in today's XRP analysis. Here's what this chart pattern actually means.
🔍 What is an ascending triangle?
A chart pattern formed by a flat (horizontal) resistance line on top and a rising support line on the bottom — created as buyers keep pushing price higher on each dip, while sellers defend the same resistance level repeatedly.
📊 Why it's considered bullish:
Each time price fails to break resistance but bounces from a HIGHER low than before, it shows buyers are gaining strength — they're willing to buy at increasingly higher prices rather than waiting for a deeper discount. This pattern often (though not always) resolves with a breakout above resistance.
🔑 How to trade around it (conceptually):
Traders typically watch for a confirmed close ABOVE the flat resistance line, often with increased volume, as the signal that buyers have finally won the battle. The height of the triangle is sometimes used as a rough guide for how far price might move after breaking out.
❌ Common mistake beginners make:
Assuming every ascending triangle breaks upward. These patterns can also fail and break down — that's why waiting for confirmation (an actual close above resistance) matters more than anticipating the breakout early.
📌 Golden rule: Chart patterns describe probability, not certainty. An ascending triangle increases the odds of an upside breakout, but always pair it with volume confirmation and broader market context before acting.
⚠️ This is educational content, not financial advice.
#CryptoEducation #TradingTips #ChartPatterns #BinanceSquare
$XRP
You saw me mention "ascending triangle" in today's XRP analysis. Here's what this chart pattern actually means.
🔍 What is an ascending triangle?
A chart pattern formed by a flat (horizontal) resistance line on top and a rising support line on the bottom — created as buyers keep pushing price higher on each dip, while sellers defend the same resistance level repeatedly.
📊 Why it's considered bullish:
Each time price fails to break resistance but bounces from a HIGHER low than before, it shows buyers are gaining strength — they're willing to buy at increasingly higher prices rather than waiting for a deeper discount. This pattern often (though not always) resolves with a breakout above resistance.
🔑 How to trade around it (conceptually):
Traders typically watch for a confirmed close ABOVE the flat resistance line, often with increased volume, as the signal that buyers have finally won the battle. The height of the triangle is sometimes used as a rough guide for how far price might move after breaking out.
❌ Common mistake beginners make:
Assuming every ascending triangle breaks upward. These patterns can also fail and break down — that's why waiting for confirmation (an actual close above resistance) matters more than anticipating the breakout early.
📌 Golden rule: Chart patterns describe probability, not certainty. An ascending triangle increases the odds of an upside breakout, but always pair it with volume confirmation and broader market context before acting.
⚠️ This is educational content, not financial advice.
#CryptoEducation #TradingTips #ChartPatterns #BinanceSquare

77
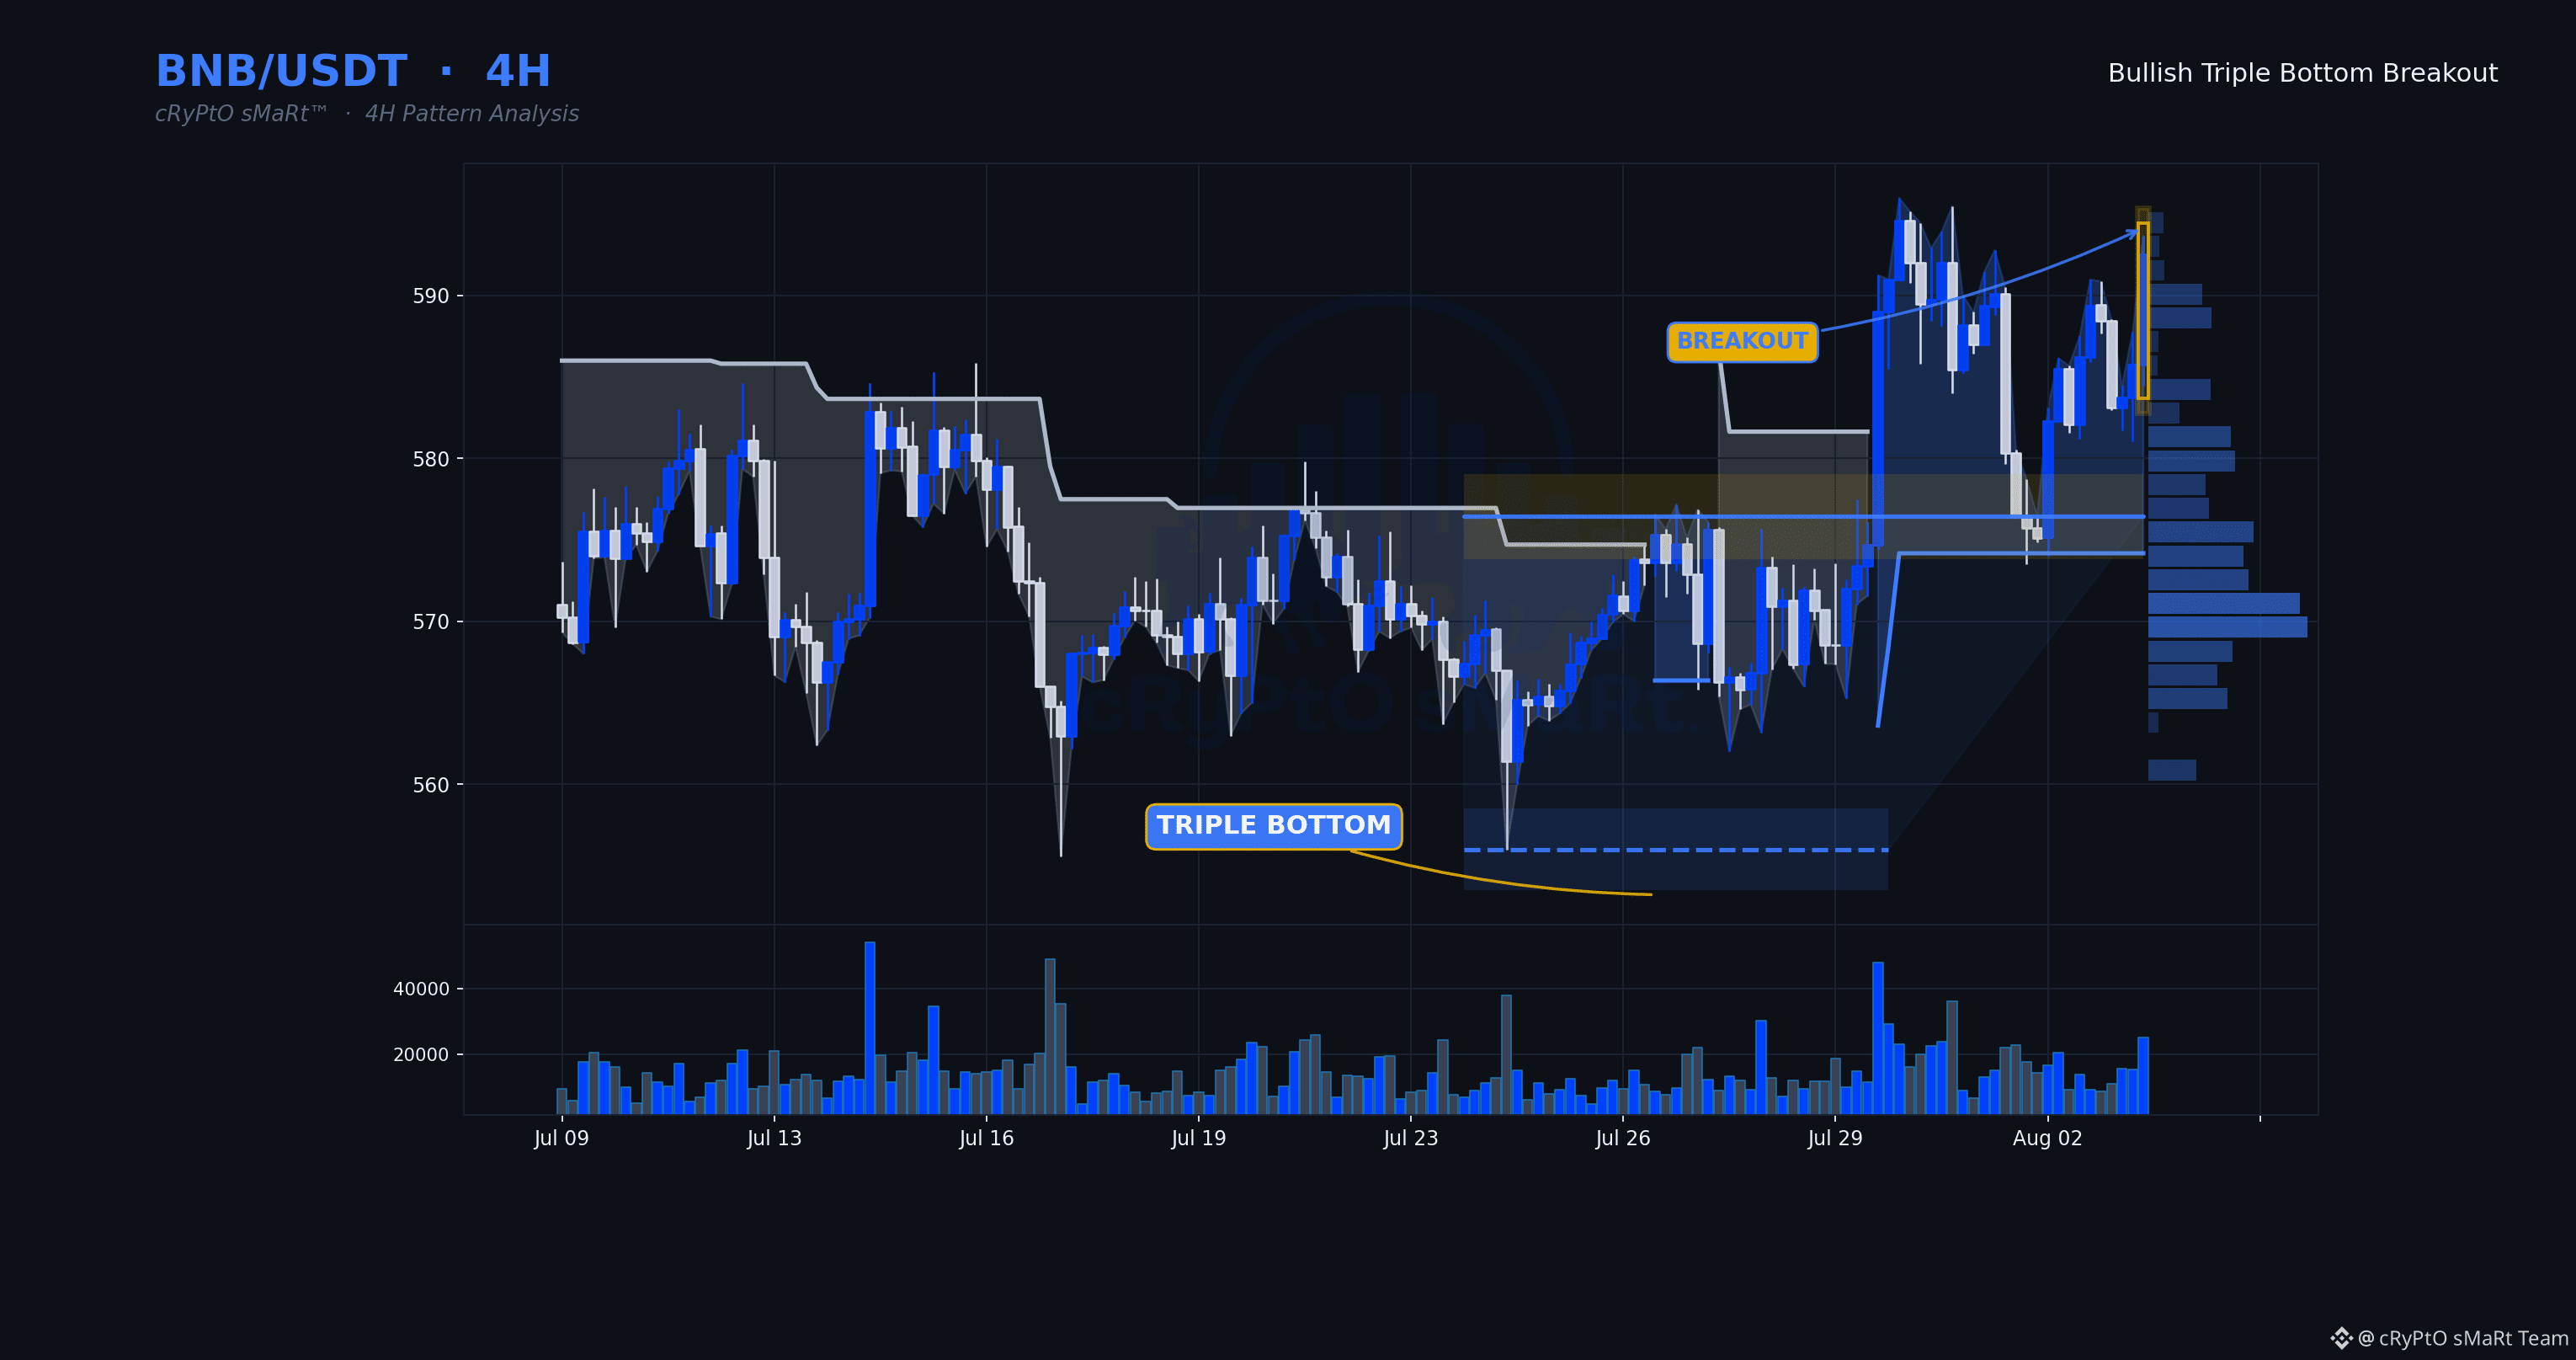
Three tests at the same floor, three failures to break it — sellers had their shot and couldn't close the deal. This breakout comes on volume that actually confirms participation, not a thin push through resistance.
🗓 Daily: Neutral — daily is mixed — Supertrend and EMAs not aligned
⏱ 4H: Triple Bottom · Bullish bias
⏳ 1H: the 1H is holding above the level with its trend up — the lower timeframe confirms the setup.
📋 WHY IT QUALIFIES
✓ Triple Bottom structure completed
✓ Decisive breakout — closed 2.8% beyond the line
✓ Volume 1.5× its 20-bar average
✓ RSI 61 — momentum confirms, not yet exhausted
🧭 Bias: Bullish while price holds above $576.4300
⚠️ Invalidation: 4H close back below $576.4300
🔵 Support $556.0000 🟡 Resistance $576.4300
$BNB $BTC #ChartPatterns
Education only, not financial advice.
Three tests at the same floor, three failures to break it — sellers had their shot and couldn't close the deal. This breakout comes on volume that actually confirms participation, not a thin push through resistance.
🗓 Daily: Neutral — daily is mixed — Supertrend and EMAs not aligned
⏱ 4H: Triple Bottom · Bullish bias
⏳ 1H: the 1H is holding above the level with its trend up — the lower timeframe confirms the setup.
📋 WHY IT QUALIFIES
✓ Triple Bottom structure completed
✓ Decisive breakout — closed 2.8% beyond the line
✓ Volume 1.5× its 20-bar average
✓ RSI 61 — momentum confirms, not yet exhausted
🧭 Bias: Bullish while price holds above $576.4300
⚠️ Invalidation: 4H close back below $576.4300
🔵 Support $556.0000 🟡 Resistance $576.4300
$BNB $BTC #ChartPatterns
Education only, not financial advice.
🗓 Daily: Neutral — daily is mixed — Supertrend and EMAs not aligned
⏱ 4H: Triple Bottom · Bullish bias
⏳ 1H: the 1H is holding above the level with its trend up — the lower timeframe confirms the setup.
📋 WHY IT QUALIFIES
✓ Triple Bottom structure completed
✓ Decisive breakout — closed 2.8% beyond the line
✓ Volume 1.5× its 20-bar average
✓ RSI 61 — momentum confirms, not yet exhausted
🧭 Bias: Bullish while price holds above $576.4300
⚠️ Invalidation: 4H close back below $576.4300
🔵 Support $556.0000 🟡 Resistance $576.4300
$BNB $BTC #ChartPatterns
Education only, not financial advice.
48
Log in to explore more content
Join global crypto users on Binance Square
⚡️ Get latest and useful information about crypto.
💬 Trusted by the world’s largest crypto exchange.
👍 Discover real insights from verified creators.
Email / Phone number
Trending Topics
1
#WhoWillSucceedJensenHuangatNvidia?
108,427 views
1,328 Discussing
2
#WhatWillDriveCryptoandStocks’NextRebound?
483,468 views
3,226 Discussing
3
#BitcoinActiveSupplyInProfitDropsBelow45%
40,994 views
511 Discussing
4
#KavaSaysAbnormalActivityLimitedToKavaLend
18,346 views
270 Discussing
5
#USSpotXRPETFsSeeLargestWeeklyOutflowIn8Months
15,475 views
236 Discussing
6
#USPPIMissMayEaseBTCPressure
236,903 views
2,127 Discussing
7
#WORPTLetsTouristsConvertCryptoToThaiBaht
4,586 views
65 Discussing
8
#TONStrategyReports$23.97MQ3NetLoss
5,927 views
41 Discussing
9
#PolkadotCommunityApprovesNewStrategyWith97%Vote
22,017 views
261 Discussing
10
#dYdXPlansV9.9UpgradeToShiftUSDCToInjective
15,757 views
213 Discussing