
#amat
amat
26,089 views
634 Discussing
Hot
Latest

·
--
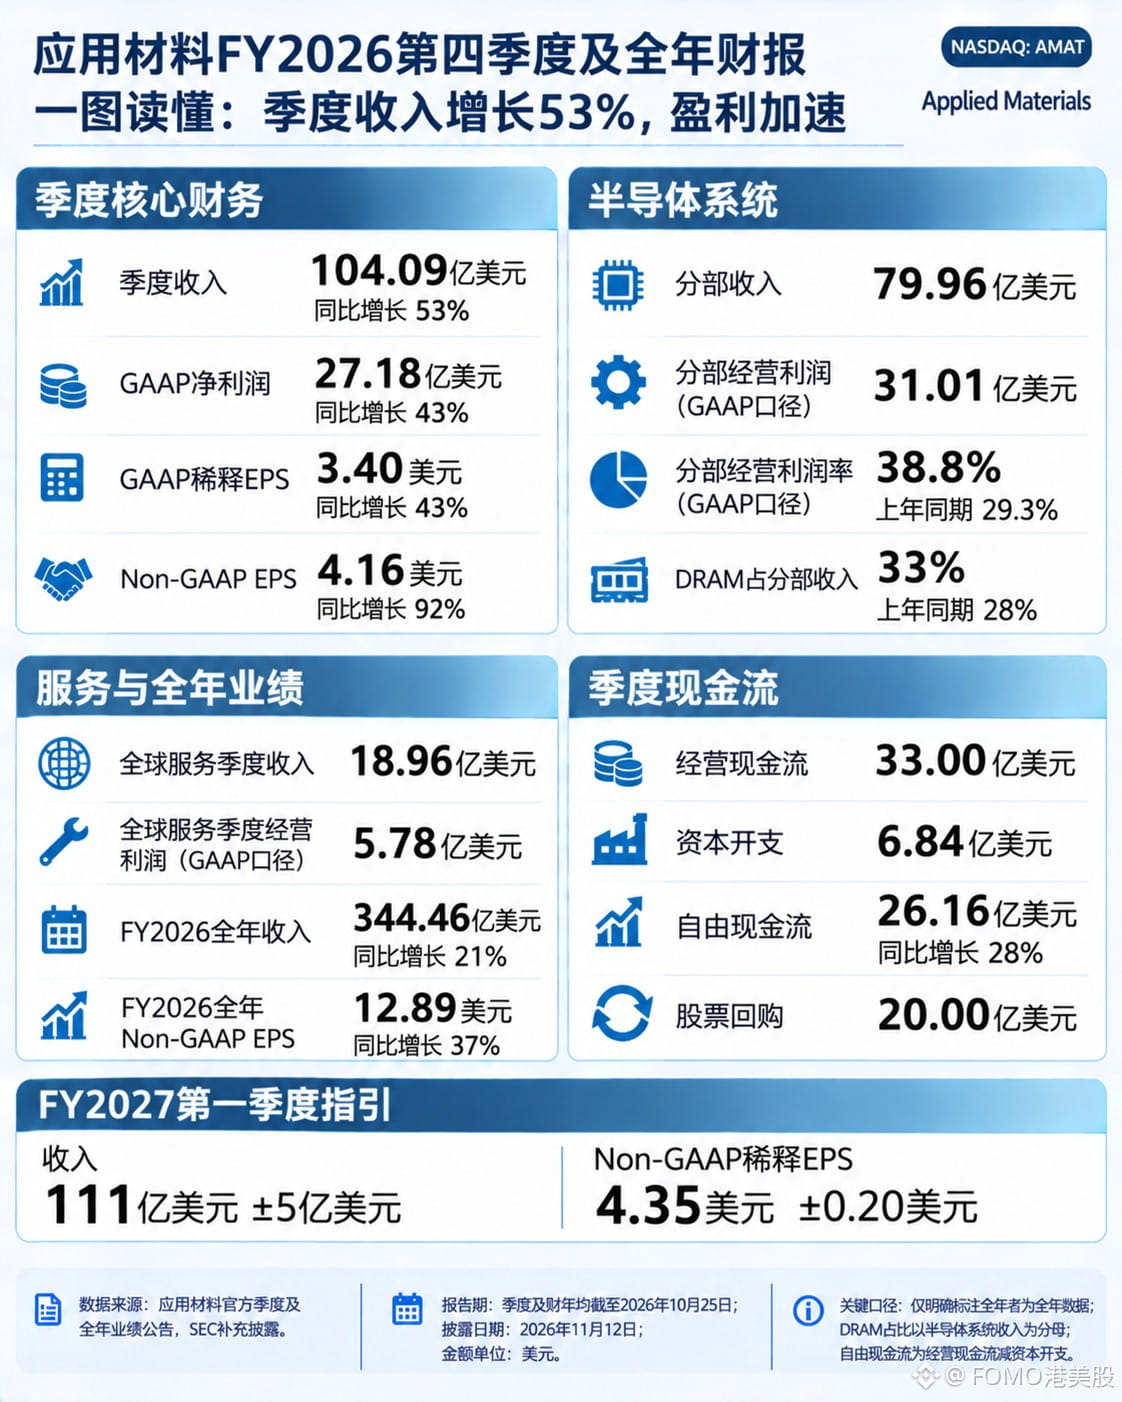
Applied Materials $AMATB reported FY2026 fourth-quarter revenue of $10.409 billion, up 53% year over year, and Non-GAAP EPS of $4.16, up 92%.
Nearly all the growth came from equipment. Semiconductor Systems revenue was $7.996 billion, up from $4.879 billion a year ago, while its operating margin rose from 29.3% to 38.8%. Within the segment, foundry and logic accounted for 58%, DRAM 33%, and flash 9%; a year ago, DRAM and flash accounted for 28% and 6%, respectively.
The difference between the two growth rates comes down to a non-operating item.
GAAP net income rose just 43% to $2.718 billion, $603 million below adjusted net income. That’s because this quarter included a $653 million unrealized loss on strategic investments, compared with a $467 million gain in the year-ago quarter—a $1.12 billion swing, greater than the Services segment’s quarterly earnings of $578 million.
Most of the cash went back to shareholders: free cash flow was $2.616 billion, and $2 billion in buybacks plus $421 million in dividends amounted to 92.5% of it. Q1 guidance is $11.1 billion ± $500 million, with the midpoint just 6.6% above this quarter’s revenue. Looking ahead, whether next quarter can reach the upper end of the $11.1 billion range is the first real test; don’t mistake the lower end of the range for a win.
The variable is Services. Its 30.5% segment margin is 8 points below equipment’s, and its 26% growth trails equipment’s 64%. Only if this segment holds steady can we start talking about a cycle.
{spot}(AMATBUSDT)
#AMAT #BStocks #半导体
Applied Materials $AMATB reported FY2026 fourth-quarter revenue of $10.409 billion, up 53% year over year, and Non-GAAP EPS of $4.16, up 92%.
Nearly all the growth came from equipment. Semiconductor Systems revenue was $7.996 billion, up from $4.879 billion a year ago, while its operating margin rose from 29.3% to 38.8%. Within the segment, foundry and logic accounted for 58%, DRAM 33%, and flash 9%; a year ago, DRAM and flash accounted for 28% and 6%, respectively.
The difference between the two growth rates comes down to a non-operating item.
GAAP net income rose just 43% to $2.718 billion, $603 million below adjusted net income. That’s because this quarter included a $653 million unrealized loss on strategic investments, compared with a $467 million gain in the year-ago quarter—a $1.12 billion swing, greater than the Services segment’s quarterly earnings of $578 million.
Most of the cash went back to shareholders: free cash flow was $2.616 billion, and $2 billion in buybacks plus $421 million in dividends amounted to 92.5% of it. Q1 guidance is $11.1 billion ± $500 million, with the midpoint just 6.6% above this quarter’s revenue. Looking ahead, whether next quarter can reach the upper end of the $11.1 billion range is the first real test; don’t mistake the lower end of the range for a win.
The variable is Services. Its 30.5% segment margin is 8 points below equipment’s, and its 26% growth trails equipment’s 64%. Only if this segment holds steady can we start talking about a cycle.
#AMAT #BStocks #半导体
Nearly all the growth came from equipment. Semiconductor Systems revenue was $7.996 billion, up from $4.879 billion a year ago, while its operating margin rose from 29.3% to 38.8%. Within the segment, foundry and logic accounted for 58%, DRAM 33%, and flash 9%; a year ago, DRAM and flash accounted for 28% and 6%, respectively.
The difference between the two growth rates comes down to a non-operating item.
GAAP net income rose just 43% to $2.718 billion, $603 million below adjusted net income. That’s because this quarter included a $653 million unrealized loss on strategic investments, compared with a $467 million gain in the year-ago quarter—a $1.12 billion swing, greater than the Services segment’s quarterly earnings of $578 million.
Most of the cash went back to shareholders: free cash flow was $2.616 billion, and $2 billion in buybacks plus $421 million in dividends amounted to 92.5% of it. Q1 guidance is $11.1 billion ± $500 million, with the midpoint just 6.6% above this quarter’s revenue. Looking ahead, whether next quarter can reach the upper end of the $11.1 billion range is the first real test; don’t mistake the lower end of the range for a win.
The variable is Services. Its 30.5% segment margin is 8 points below equipment’s, and its 26% growth trails equipment’s 64%. Only if this segment holds steady can we start talking about a cycle.
#AMAT #BStocks #半导体
1
476

·
--
$RKLB / $AMAT / $SHAZ 30-minute bullish signals, 4-hour bullish trend confirmed 🔥
════════════════════
🔴 $RKLB 30-minute bullish signal
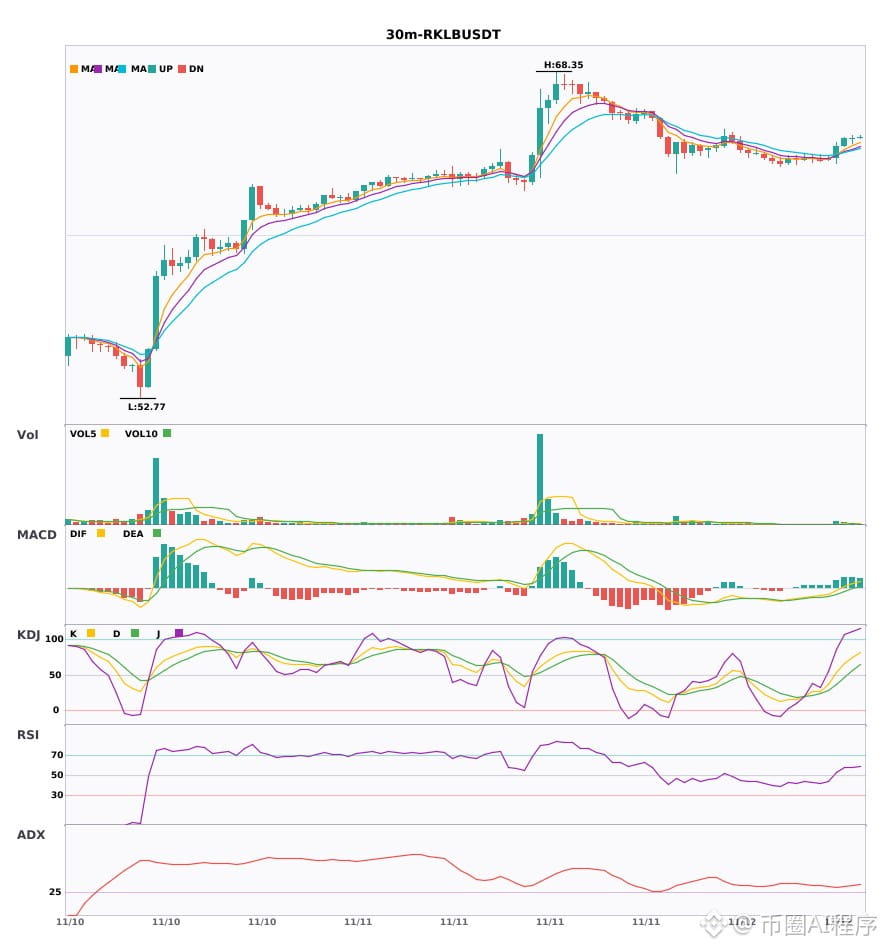
⚠️Technical analysis: 4-hour bullish confluence confirmed | 30-minute entry: MACD DIF breaks above the zero line, trend turns bullish | EMA5 > EMA8 > EMA13, bullish alignment | Volume surge (4.4x)
════════════════════
🔴 $AMAT 30-minute bullish signal
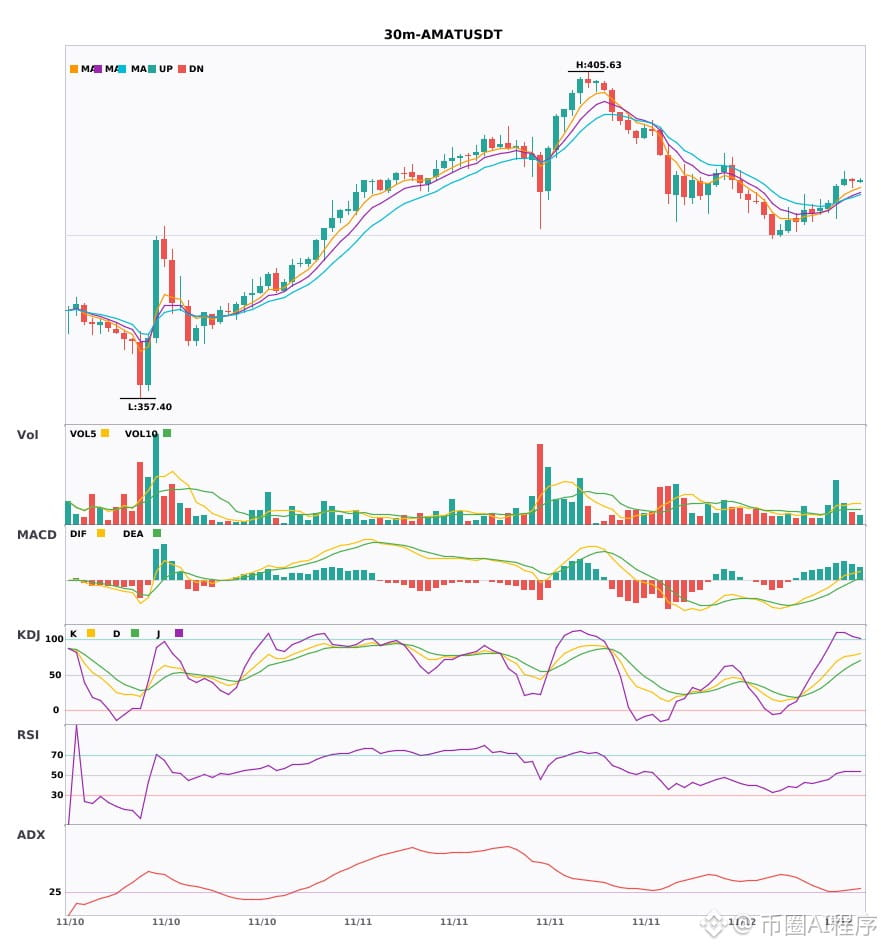
⚠️Technical analysis: 4-hour bullish confluence confirmed | 30-minute entry: MACD DIF breaks above the zero line, trend turns bullish | EMA5 > EMA8 > EMA13, bullish alignment | KDJ showing strength, bulls in control (K: 75.4, D: 58.3) | Volume surge (3.2x)
════════════════════
🔴 $SHAZ 30-minute bullish signal
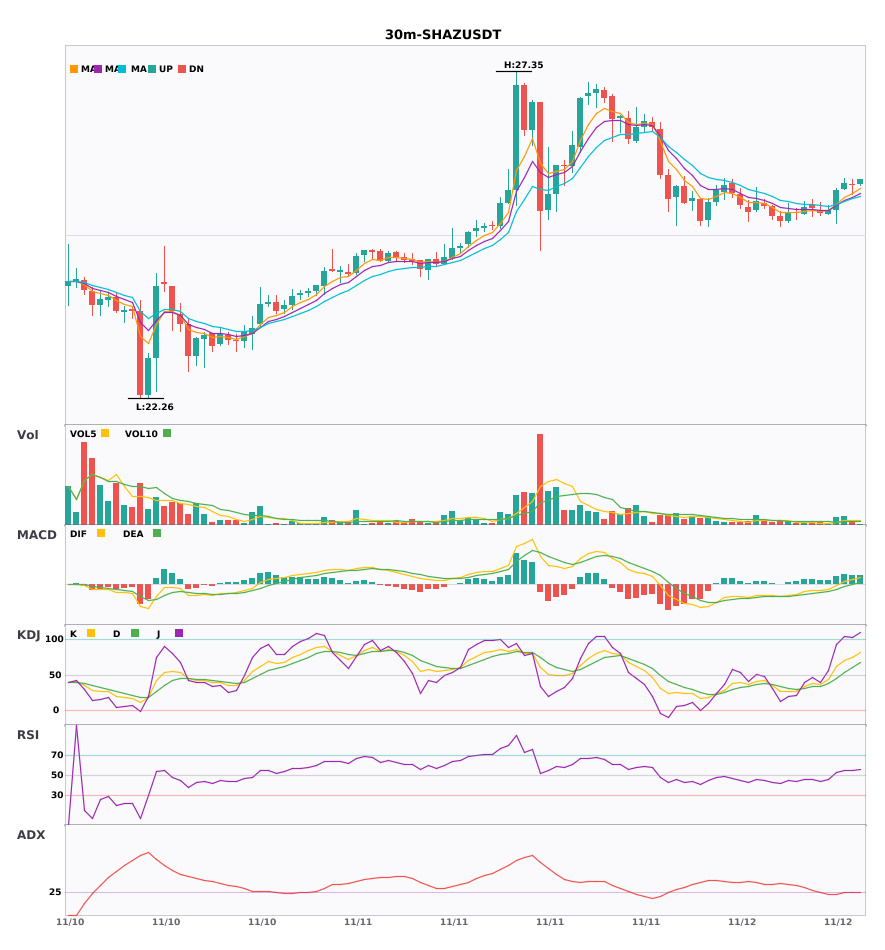
⚠️Technical analysis: 4-hour bullish confluence confirmed | 30-minute entry: MACD DIF breaks above the zero line, trend turns bullish | EMA5 > EMA8 > EMA13, bullish alignment | KDJ showing strength, bulls in control (K: 70.4, D: 53.9) | Volume surge (2.7x)
════════════════════
🔔 Follow for first-hand market updates 🔔
#多周期共振 #RKLB #AMAT #SHAZ
📌 When trading, pay attention to whether the candlestick pattern confirms the signal
$RKLB / $AMAT / $SHAZ 30-minute bullish signals, 4-hour bullish trend confirmed 🔥
════════════════════
🔴 $RKLB 30-minute bullish signal
⚠️Technical analysis: 4-hour bullish confluence confirmed | 30-minute entry: MACD DIF breaks above the zero line, trend turns bullish | EMA5 > EMA8 > EMA13, bullish alignment | Volume surge (4.4x)
════════════════════
🔴 $AMAT 30-minute bullish signal
⚠️Technical analysis: 4-hour bullish confluence confirmed | 30-minute entry: MACD DIF breaks above the zero line, trend turns bullish | EMA5 > EMA8 > EMA13, bullish alignment | KDJ showing strength, bulls in control (K: 75.4, D: 58.3) | Volume surge (3.2x)
════════════════════
🔴 $SHAZ 30-minute bullish signal
⚠️Technical analysis: 4-hour bullish confluence confirmed | 30-minute entry: MACD DIF breaks above the zero line, trend turns bullish | EMA5 > EMA8 > EMA13, bullish alignment | KDJ showing strength, bulls in control (K: 70.4, D: 53.9) | Volume surge (2.7x)
════════════════════
🔔 Follow for first-hand market updates 🔔
#多周期共振 #RKLB #AMAT #SHAZ
📌 When trading, pay attention to whether the candlestick pattern confirms the signal
════════════════════
🔴 $RKLB 30-minute bullish signal
⚠️Technical analysis: 4-hour bullish confluence confirmed | 30-minute entry: MACD DIF breaks above the zero line, trend turns bullish | EMA5 > EMA8 > EMA13, bullish alignment | Volume surge (4.4x)
════════════════════
🔴 $AMAT 30-minute bullish signal
⚠️Technical analysis: 4-hour bullish confluence confirmed | 30-minute entry: MACD DIF breaks above the zero line, trend turns bullish | EMA5 > EMA8 > EMA13, bullish alignment | KDJ showing strength, bulls in control (K: 75.4, D: 58.3) | Volume surge (3.2x)
════════════════════
🔴 $SHAZ 30-minute bullish signal
⚠️Technical analysis: 4-hour bullish confluence confirmed | 30-minute entry: MACD DIF breaks above the zero line, trend turns bullish | EMA5 > EMA8 > EMA13, bullish alignment | KDJ showing strength, bulls in control (K: 70.4, D: 53.9) | Volume surge (2.7x)
════════════════════
🔔 Follow for first-hand market updates 🔔
#多周期共振 #RKLB #AMAT #SHAZ
📌 When trading, pay attention to whether the candlestick pattern confirms the signal
1

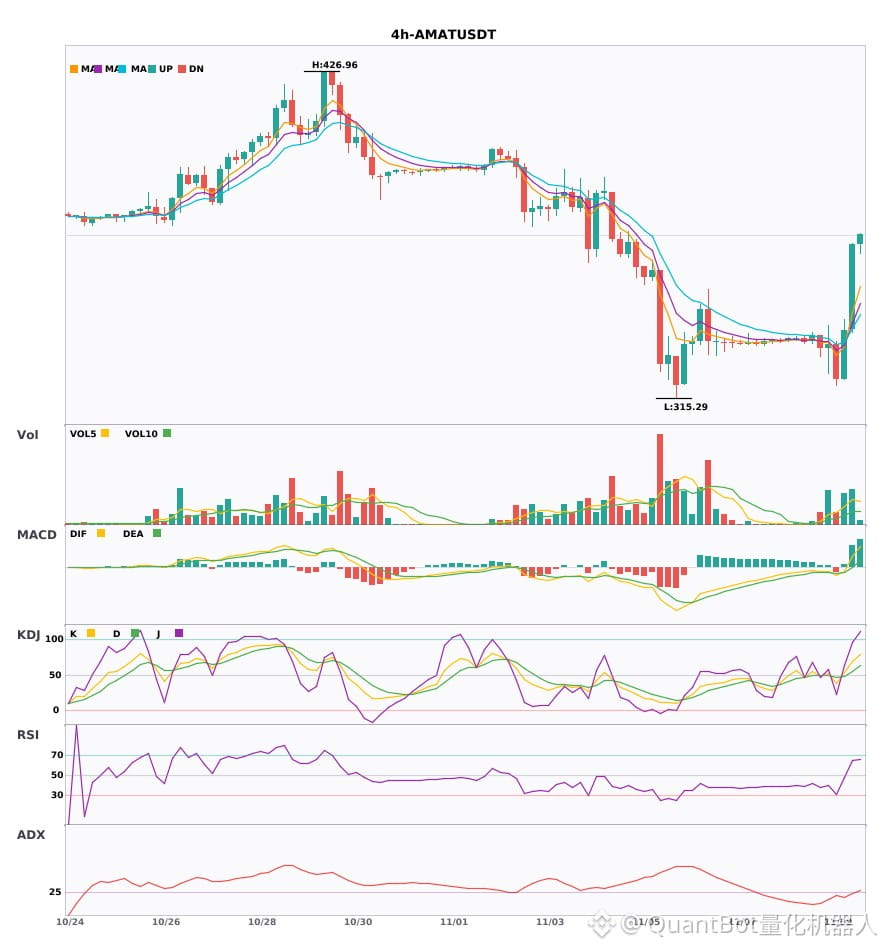
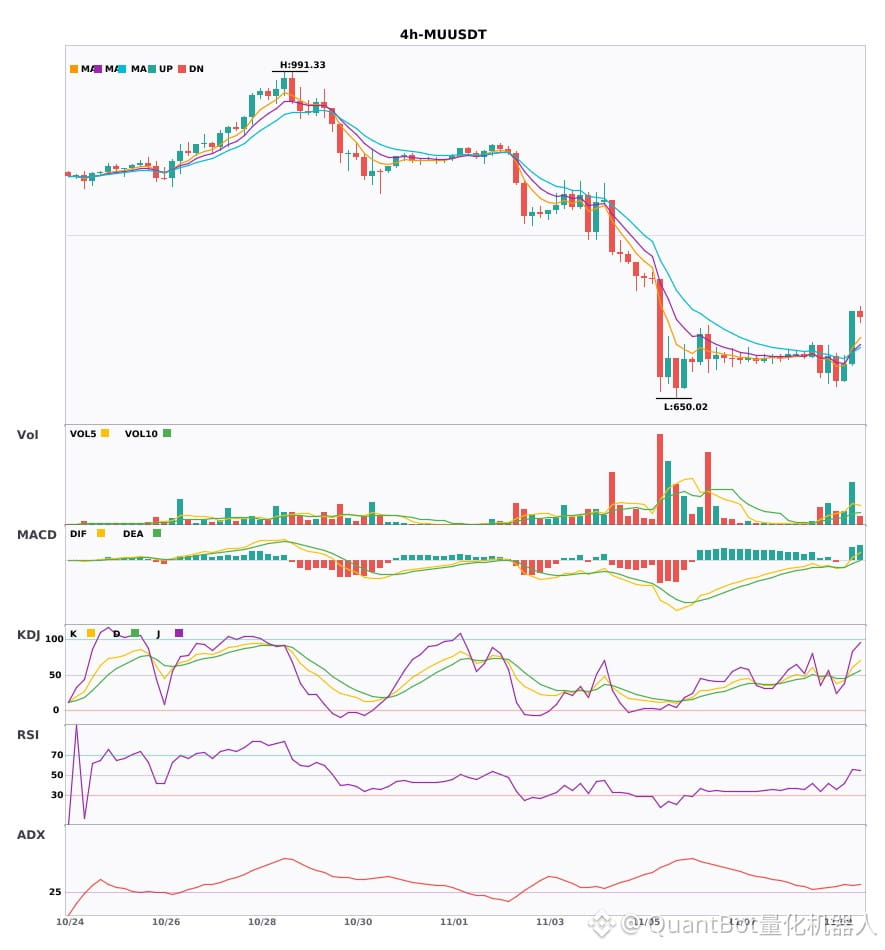
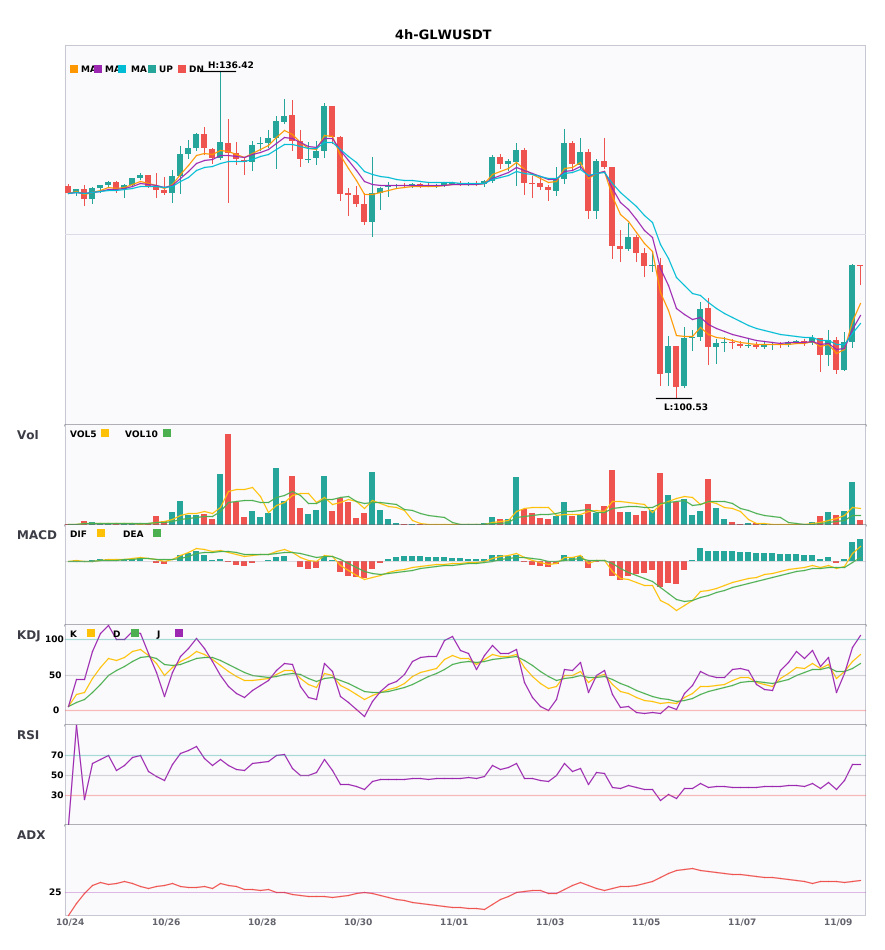
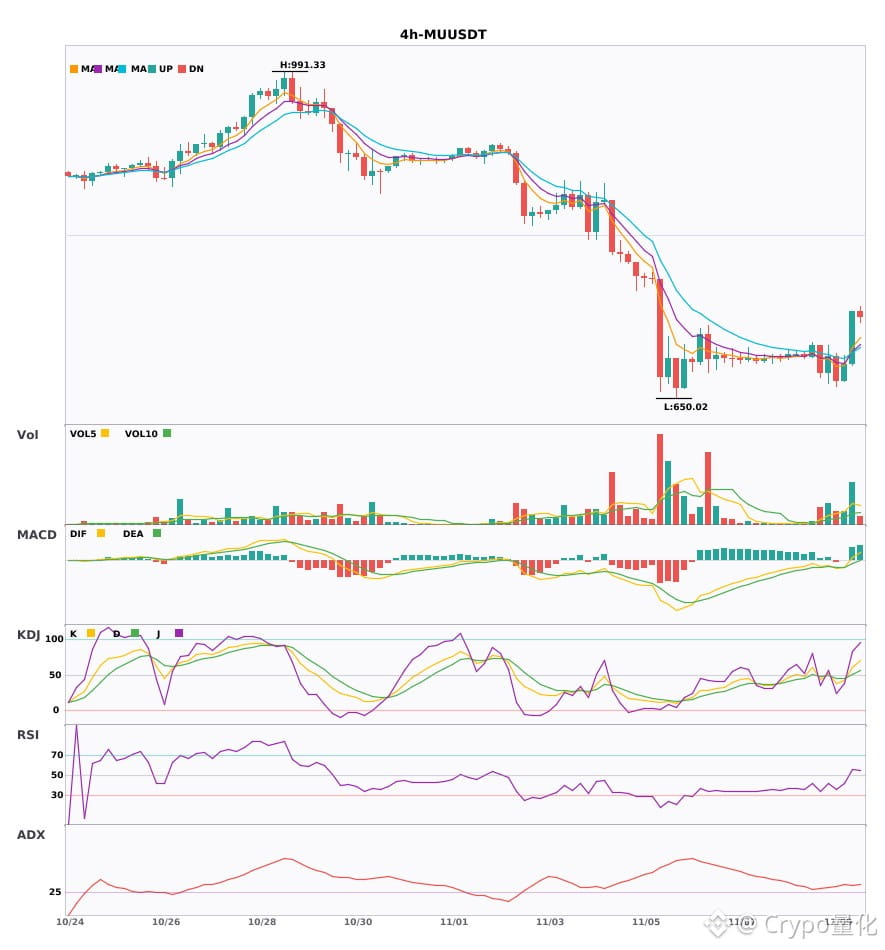
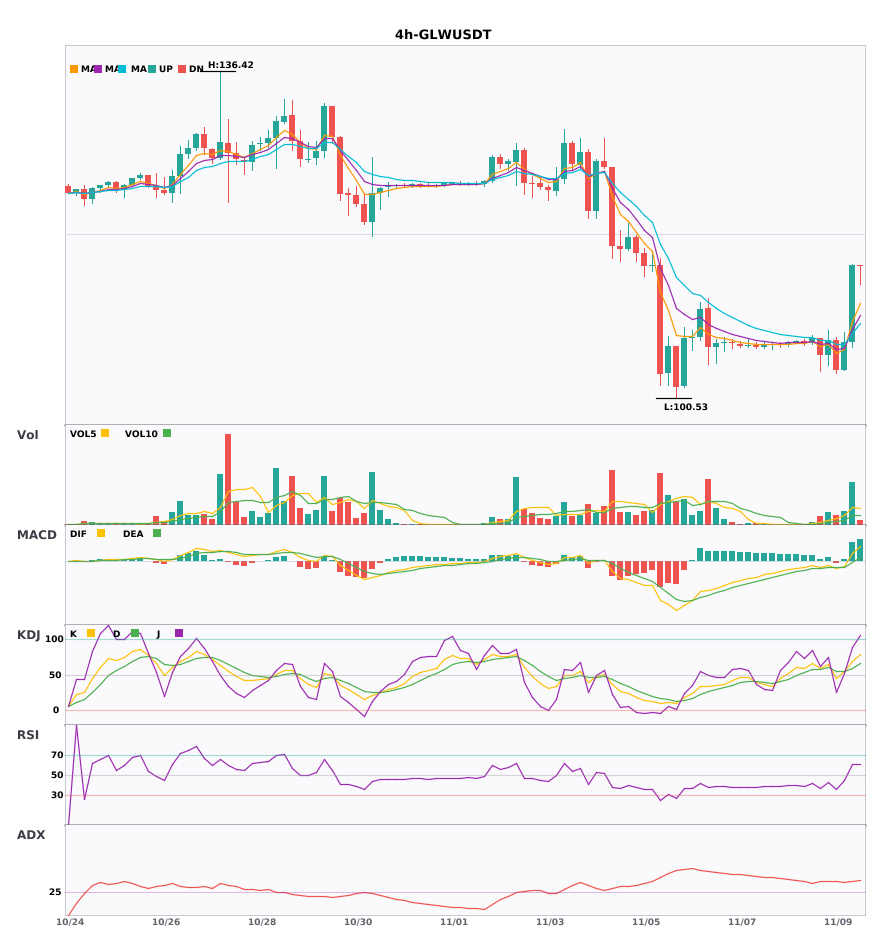
$AMAT / $MU / $GLW 4-hour bullish bias, short-term confluence opportunities
📈 $AMAT | 4-hour bullish signal
━━━━━━━━━━━━━━━━━━
Technical analysis: ADX(27): A trend is forming; opportunity to participate | MACD DIF breaks above the zero line, turning bullish | EMA5 crosses above EMA8, turning bullish in the short term | KDJ is running strongly, with bulls in control (K: 68.9, D: 55.3) | Volume surge (3.2x)
Price change: 8.7000%
📈 $MU | 4-hour bullish signal
━━━━━━━━━━━━━━━━━━
Technical analysis: ADX(33): Clear trending market | MACD golden cross above zero, releasing bullish momentum | EMA5 crosses above EMA8, turning bullish in the short term | KDJ golden cross, short-term outlook bullish (K: 61.1, D: 50.0) | Volume surge (3.6x)
Price change: 8.0700%
📌 Market update: Binance Will Support Micron Technology (MU) Cash Dividend Distribution via bStocks
📈 $GLW | 4-hour bullish signal
━━━━━━━━━━━━━━━━━━
Technical analysis: ADX(36): Clear trending market | MACD DIF breaks above the zero line, turning bullish | EMA5 crosses above EMA8, turning bullish in the short term | KDJ golden cross, short-term outlook bullish (K: 69.3, D: 59.7) | Volume surge (4.6x)
Price change: 7.8900%
📌 Market update: Binance Will Support the International Business Machines Corporation (IBM), Apple Inc. (AAPL), Corning Incorporated (GLW), and Eli Lilly and Company (LLY) Cash Dividend Distribution via bStocks
━━━━━━━━━━━━━━━━━━
#技术分析 #AMAT #MU #GLW
📌 The above content is for reference only and does not constitute investment advice
$AMAT / $MU / $GLW 4-hour bullish bias, short-term confluence opportunities
📈 $AMAT | 4-hour bullish signal
━━━━━━━━━━━━━━━━━━
Technical analysis: ADX(27): A trend is forming; opportunity to participate | MACD DIF breaks above the zero line, turning bullish | EMA5 crosses above EMA8, turning bullish in the short term | KDJ is running strongly, with bulls in control (K: 68.9, D: 55.3) | Volume surge (3.2x)
Price change: 8.7000%
📈 $MU | 4-hour bullish signal
━━━━━━━━━━━━━━━━━━
Technical analysis: ADX(33): Clear trending market | MACD golden cross above zero, releasing bullish momentum | EMA5 crosses above EMA8, turning bullish in the short term | KDJ golden cross, short-term outlook bullish (K: 61.1, D: 50.0) | Volume surge (3.6x)
Price change: 8.0700%
📌 Market update: Binance Will Support Micron Technology (MU) Cash Dividend Distribution via bStocks
📈 $GLW | 4-hour bullish signal
━━━━━━━━━━━━━━━━━━
Technical analysis: ADX(36): Clear trending market | MACD DIF breaks above the zero line, turning bullish | EMA5 crosses above EMA8, turning bullish in the short term | KDJ golden cross, short-term outlook bullish (K: 69.3, D: 59.7) | Volume surge (4.6x)
Price change: 7.8900%
📌 Market update: Binance Will Support the International Business Machines Corporation (IBM), Apple Inc. (AAPL), Corning Incorporated (GLW), and Eli Lilly and Company (LLY) Cash Dividend Distribution via bStocks
━━━━━━━━━━━━━━━━━━
#技术分析 #AMAT #MU #GLW
📌 The above content is for reference only and does not constitute investment advice
📈 $AMAT | 4-hour bullish signal
━━━━━━━━━━━━━━━━━━
Technical analysis: ADX(27): A trend is forming; opportunity to participate | MACD DIF breaks above the zero line, turning bullish | EMA5 crosses above EMA8, turning bullish in the short term | KDJ is running strongly, with bulls in control (K: 68.9, D: 55.3) | Volume surge (3.2x)
Price change: 8.7000%
📈 $MU | 4-hour bullish signal
━━━━━━━━━━━━━━━━━━
Technical analysis: ADX(33): Clear trending market | MACD golden cross above zero, releasing bullish momentum | EMA5 crosses above EMA8, turning bullish in the short term | KDJ golden cross, short-term outlook bullish (K: 61.1, D: 50.0) | Volume surge (3.6x)
Price change: 8.0700%
📌 Market update: Binance Will Support Micron Technology (MU) Cash Dividend Distribution via bStocks
📈 $GLW | 4-hour bullish signal
━━━━━━━━━━━━━━━━━━
Technical analysis: ADX(36): Clear trending market | MACD DIF breaks above the zero line, turning bullish | EMA5 crosses above EMA8, turning bullish in the short term | KDJ golden cross, short-term outlook bullish (K: 69.3, D: 59.7) | Volume surge (4.6x)
Price change: 7.8900%
📌 Market update: Binance Will Support the International Business Machines Corporation (IBM), Apple Inc. (AAPL), Corning Incorporated (GLW), and Eli Lilly and Company (LLY) Cash Dividend Distribution via bStocks
━━━━━━━━━━━━━━━━━━
#技术分析 #AMAT #MU #GLW
📌 The above content is for reference only and does not constitute investment advice
24

·
--
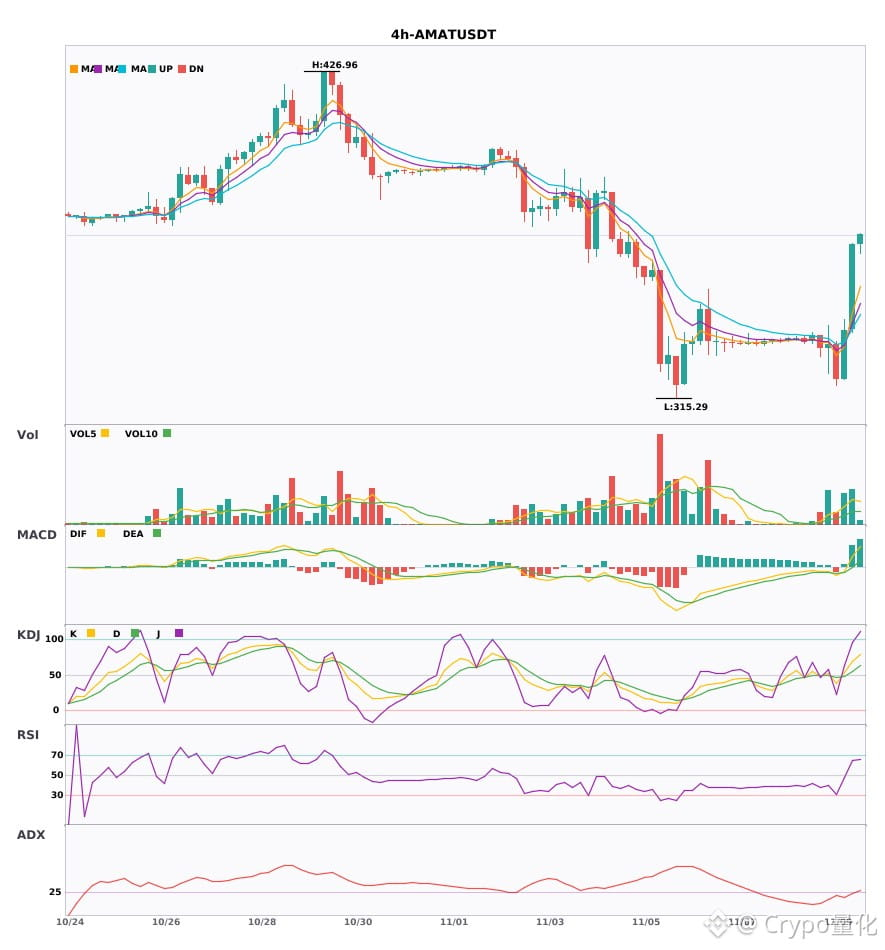
3 bullish signals on the 4-hour timeframe appeared simultaneously: $AMAT / $MU / $GLW🔥
════════════════════
🔴 $AMAT 4-hour bullish signal
⚠️Technical analysis: ADX(27) Trend is forming; entry is possible | MACD DIF broke above the zero line, turning the trend bullish | EMA5 crossed above EMA8, turning short-term momentum bullish | KDJ is running strong, with bulls in control (K: 68.9, D: 55.3) | Volume surge (3.2x)
════════════════════
🔴 $MU 4-hour bullish signal
⚠️Technical analysis: ADX(33) Clear trending market | MACD golden cross above zero, releasing bullish momentum | EMA5 crossed above EMA8, turning short-term momentum bullish | KDJ golden cross, short-term outlook bullish (K: 61.1, D: 50.0) | Volume surge (3.6x)
📢Market update: Binance Will Support Micron Technology (MU) Cash Dividend Distribution via bStocks
════════════════════
🔴 $GLW 4-hour bullish signal
⚠️Technical analysis: ADX(36) Clear trending market | MACD DIF broke above the zero line, turning the trend bullish | EMA5 crossed above EMA8, turning short-term momentum bullish | KDJ golden cross, short-term outlook bullish (K: 69.3, D: 59.7) | Volume surge (4.6x)
📢Market update: Binance Will Support the International Business Machines Corporation (IBM), Apple Inc. (AAPL), Corning Incorporated (GLW), and Eli Lilly and Company (LLY) Cash Dividend Distribution via bStocks
════════════════════
🔔 Follow to get real-time market alerts 🔔
#技术分析 #AMAT #MU #GLW
📌 When trading, pay attention to whether the candlestick pattern aligns
3 bullish signals on the 4-hour timeframe appeared simultaneously: $AMAT / $MU / $GLW 🔥
════════════════════
🔴 $AMAT 4-hour bullish signal
⚠️Technical analysis: ADX(27) Trend is forming; entry is possible | MACD DIF broke above the zero line, turning the trend bullish | EMA5 crossed above EMA8, turning short-term momentum bullish | KDJ is running strong, with bulls in control (K: 68.9, D: 55.3) | Volume surge (3.2x)
════════════════════
🔴 $MU 4-hour bullish signal
⚠️Technical analysis: ADX(33) Clear trending market | MACD golden cross above zero, releasing bullish momentum | EMA5 crossed above EMA8, turning short-term momentum bullish | KDJ golden cross, short-term outlook bullish (K: 61.1, D: 50.0) | Volume surge (3.6x)
📢Market update: Binance Will Support Micron Technology (MU) Cash Dividend Distribution via bStocks
════════════════════
🔴 $GLW 4-hour bullish signal
⚠️Technical analysis: ADX(36) Clear trending market | MACD DIF broke above the zero line, turning the trend bullish | EMA5 crossed above EMA8, turning short-term momentum bullish | KDJ golden cross, short-term outlook bullish (K: 69.3, D: 59.7) | Volume surge (4.6x)
📢Market update: Binance Will Support the International Business Machines Corporation (IBM), Apple Inc. (AAPL), Corning Incorporated (GLW), and Eli Lilly and Company (LLY) Cash Dividend Distribution via bStocks
════════════════════
🔔 Follow to get real-time market alerts 🔔
#技术分析 #AMAT #MU #GLW
📌 When trading, pay attention to whether the candlestick pattern aligns
════════════════════
🔴 $AMAT 4-hour bullish signal
⚠️Technical analysis: ADX(27) Trend is forming; entry is possible | MACD DIF broke above the zero line, turning the trend bullish | EMA5 crossed above EMA8, turning short-term momentum bullish | KDJ is running strong, with bulls in control (K: 68.9, D: 55.3) | Volume surge (3.2x)
════════════════════
🔴 $MU 4-hour bullish signal
⚠️Technical analysis: ADX(33) Clear trending market | MACD golden cross above zero, releasing bullish momentum | EMA5 crossed above EMA8, turning short-term momentum bullish | KDJ golden cross, short-term outlook bullish (K: 61.1, D: 50.0) | Volume surge (3.6x)
📢Market update: Binance Will Support Micron Technology (MU) Cash Dividend Distribution via bStocks
════════════════════
🔴 $GLW 4-hour bullish signal
⚠️Technical analysis: ADX(36) Clear trending market | MACD DIF broke above the zero line, turning the trend bullish | EMA5 crossed above EMA8, turning short-term momentum bullish | KDJ golden cross, short-term outlook bullish (K: 69.3, D: 59.7) | Volume surge (4.6x)
📢Market update: Binance Will Support the International Business Machines Corporation (IBM), Apple Inc. (AAPL), Corning Incorporated (GLW), and Eli Lilly and Company (LLY) Cash Dividend Distribution via bStocks
════════════════════
🔔 Follow to get real-time market alerts 🔔
#技术分析 #AMAT #MU #GLW
📌 When trading, pay attention to whether the candlestick pattern aligns
10

·
--
Bullish
3 Best Stocks I Buy Now…………….🚀🚀🚀
$CEG $KKR.US $AMAT
But why I buy these stocks 🤔 let’s
explain…..
#CEG ; Business Electricity and clean energy.
Growing electricity demand form AI data centres.
#KKR ; Private equityand asset management. Growth investment assets and potential recovery in financial markets.
#AMAT ; Semiconductor manufacturing equipment. AI chips demand and semiconductor industry expansion.
{stock_us}(CEG.US)
{stock_us}(KKR.US)
{stock_us}(AMAT.US)
3 Best Stocks I Buy Now…………….🚀🚀🚀
$CEG $KKR.US $AMAT
But why I buy these stocks 🤔 let’s
explain…..
#CEG ; Business Electricity and clean energy.
Growing electricity demand form AI data centres.
#KKR ; Private equityand asset management. Growth investment assets and potential recovery in financial markets.
#AMAT ; Semiconductor manufacturing equipment. AI chips demand and semiconductor industry expansion.
$CEG $KKR.US $AMAT
But why I buy these stocks 🤔 let’s
explain…..
#CEG ; Business Electricity and clean energy.
Growing electricity demand form AI data centres.
#KKR ; Private equityand asset management. Growth investment assets and potential recovery in financial markets.
#AMAT ; Semiconductor manufacturing equipment. AI chips demand and semiconductor industry expansion.
169
·
--
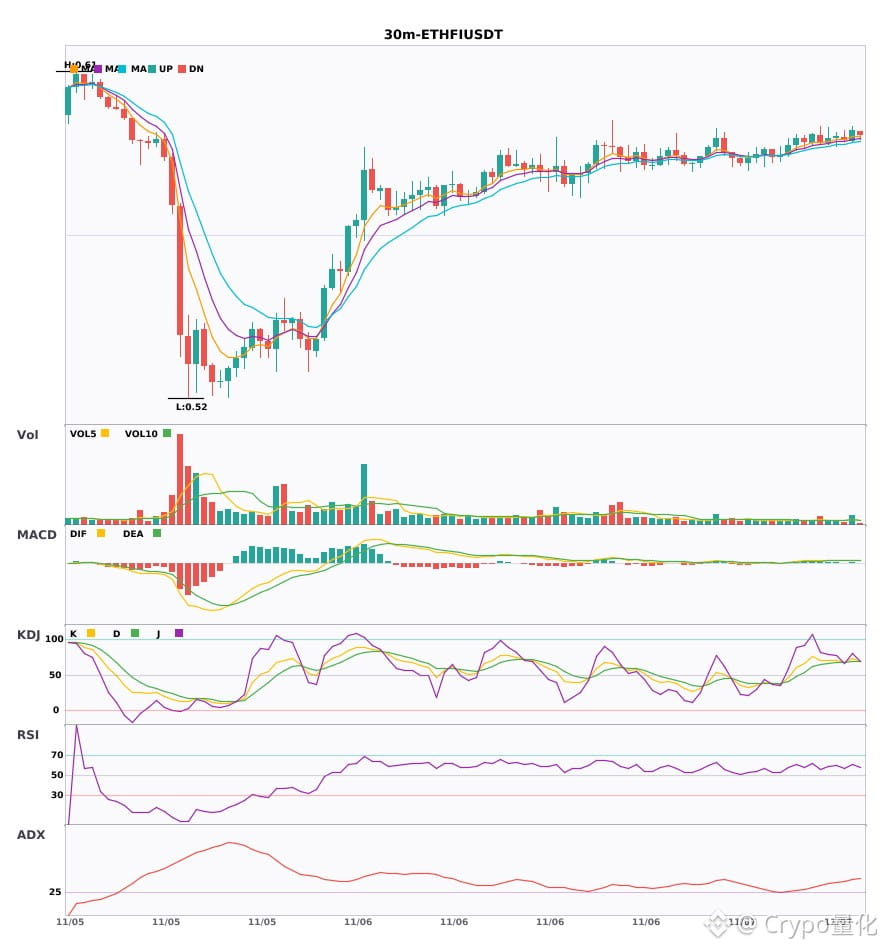
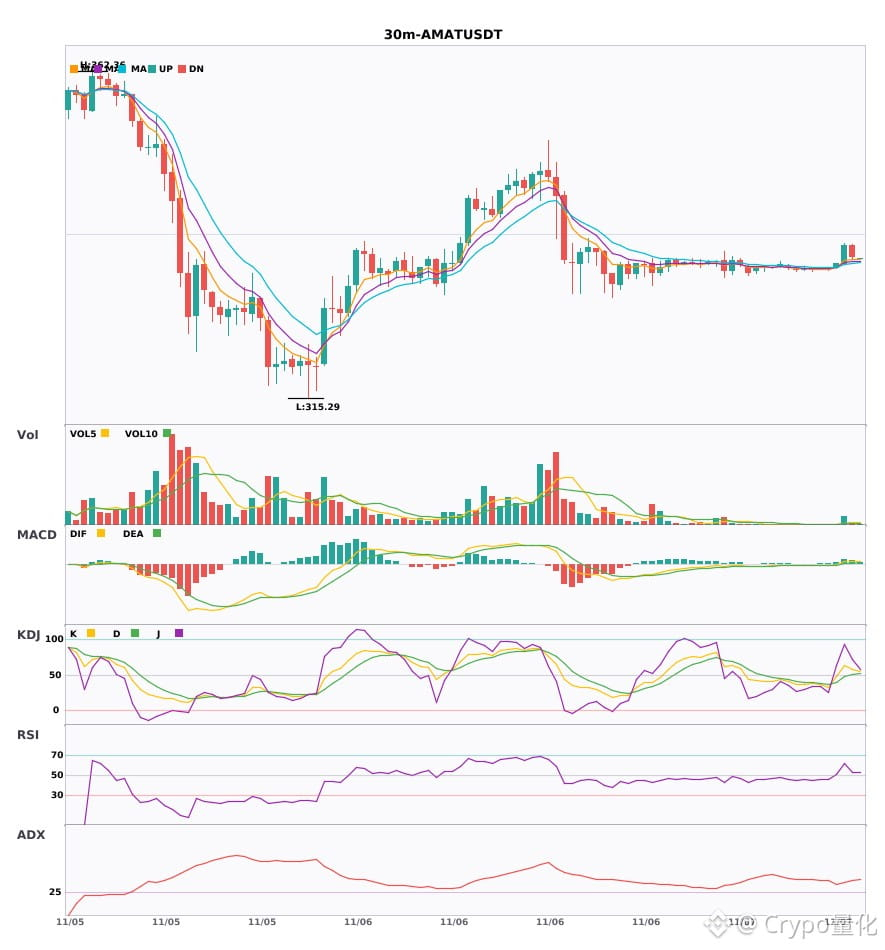
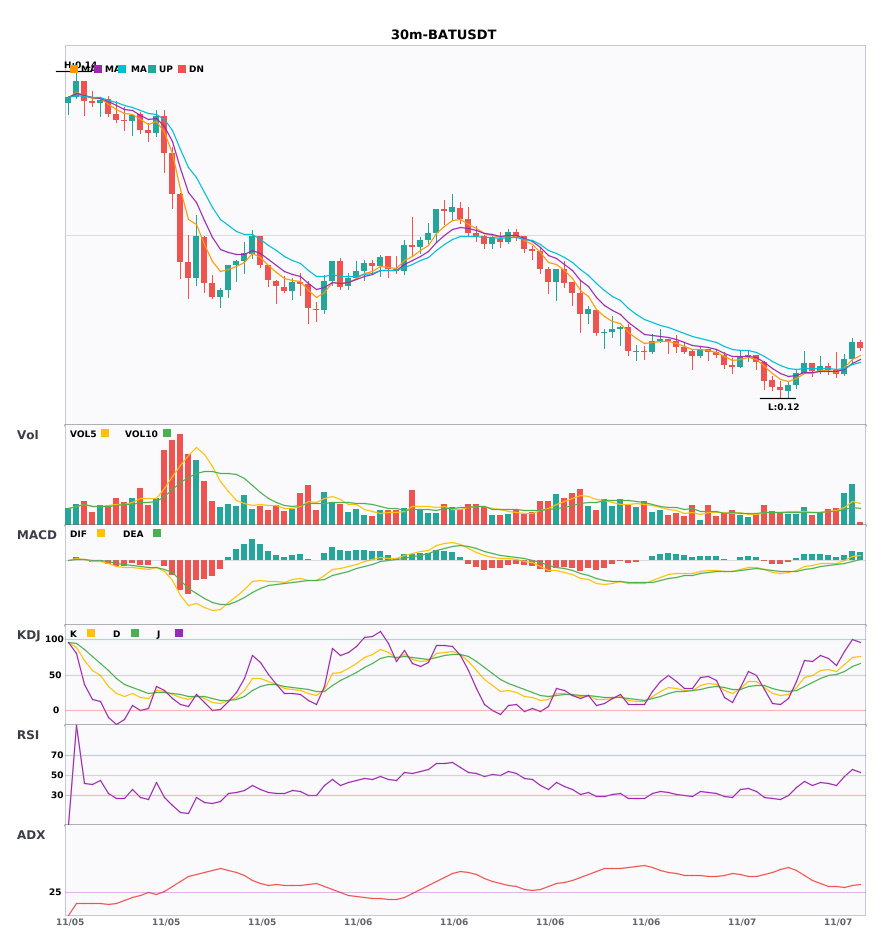
3 simultaneous 30-minute bullish signals: $ETHFI / $AMAT / $BAT🔥
════════════════════
🔴 $ETHFI 30-minute bullish signal
⚠️Technical analysis: ADX(41) indicates a clear trend | MACD bullish crossover above zero, releasing bullish momentum | EMA5 > EMA8 > EMA13, bullish alignment | KDJ bullish crossover, short-term outlook is bullish (K is 73.2, D is 69.4) | Volume up (1.9x)
════════════════════
🔴 $AMAT 30-minute bullish signal
⚠️Technical analysis: ADX(39) indicates a clear trend | MACD DIF breaks above the zero line, trend turns bullish | EMA5 > EMA8 > EMA13, bullish alignment | Volume surges (6.9x)
════════════════════
🔴 $BAT 30-minute bullish signal
⚠️Technical analysis: ADX(36) indicates a clear trend | MACD DIF breaks above the zero line, trend turns bullish | EMA5 > EMA8 > EMA13, bullish alignment | KDJ is running strong, bulls have the upper hand (K is 74.2, D is 61.8) | Volume up (2.3x)
════════════════════
🔔 Follow for first-hand market updates 🔔
#技术分析 #ETHFI #AMAT #BAT
📌 When trading, pay attention to whether the candlestick pattern confirms the signal
3 simultaneous 30-minute bullish signals: $ETHFI / $AMAT / $BAT 🔥
════════════════════
🔴 $ETHFI 30-minute bullish signal
⚠️Technical analysis: ADX(41) indicates a clear trend | MACD bullish crossover above zero, releasing bullish momentum | EMA5 > EMA8 > EMA13, bullish alignment | KDJ bullish crossover, short-term outlook is bullish (K is 73.2, D is 69.4) | Volume up (1.9x)
════════════════════
🔴 $AMAT 30-minute bullish signal
⚠️Technical analysis: ADX(39) indicates a clear trend | MACD DIF breaks above the zero line, trend turns bullish | EMA5 > EMA8 > EMA13, bullish alignment | Volume surges (6.9x)
════════════════════
🔴 $BAT 30-minute bullish signal
⚠️Technical analysis: ADX(36) indicates a clear trend | MACD DIF breaks above the zero line, trend turns bullish | EMA5 > EMA8 > EMA13, bullish alignment | KDJ is running strong, bulls have the upper hand (K is 74.2, D is 61.8) | Volume up (2.3x)
════════════════════
🔔 Follow for first-hand market updates 🔔
#技术分析 #ETHFI #AMAT #BAT
📌 When trading, pay attention to whether the candlestick pattern confirms the signal
════════════════════
🔴 $ETHFI 30-minute bullish signal
⚠️Technical analysis: ADX(41) indicates a clear trend | MACD bullish crossover above zero, releasing bullish momentum | EMA5 > EMA8 > EMA13, bullish alignment | KDJ bullish crossover, short-term outlook is bullish (K is 73.2, D is 69.4) | Volume up (1.9x)
════════════════════
🔴 $AMAT 30-minute bullish signal
⚠️Technical analysis: ADX(39) indicates a clear trend | MACD DIF breaks above the zero line, trend turns bullish | EMA5 > EMA8 > EMA13, bullish alignment | Volume surges (6.9x)
════════════════════
🔴 $BAT 30-minute bullish signal
⚠️Technical analysis: ADX(36) indicates a clear trend | MACD DIF breaks above the zero line, trend turns bullish | EMA5 > EMA8 > EMA13, bullish alignment | KDJ is running strong, bulls have the upper hand (K is 74.2, D is 61.8) | Volume up (2.3x)
════════════════════
🔔 Follow for first-hand market updates 🔔
#技术分析 #ETHFI #AMAT #BAT
📌 When trading, pay attention to whether the candlestick pattern confirms the signal
16
·
--
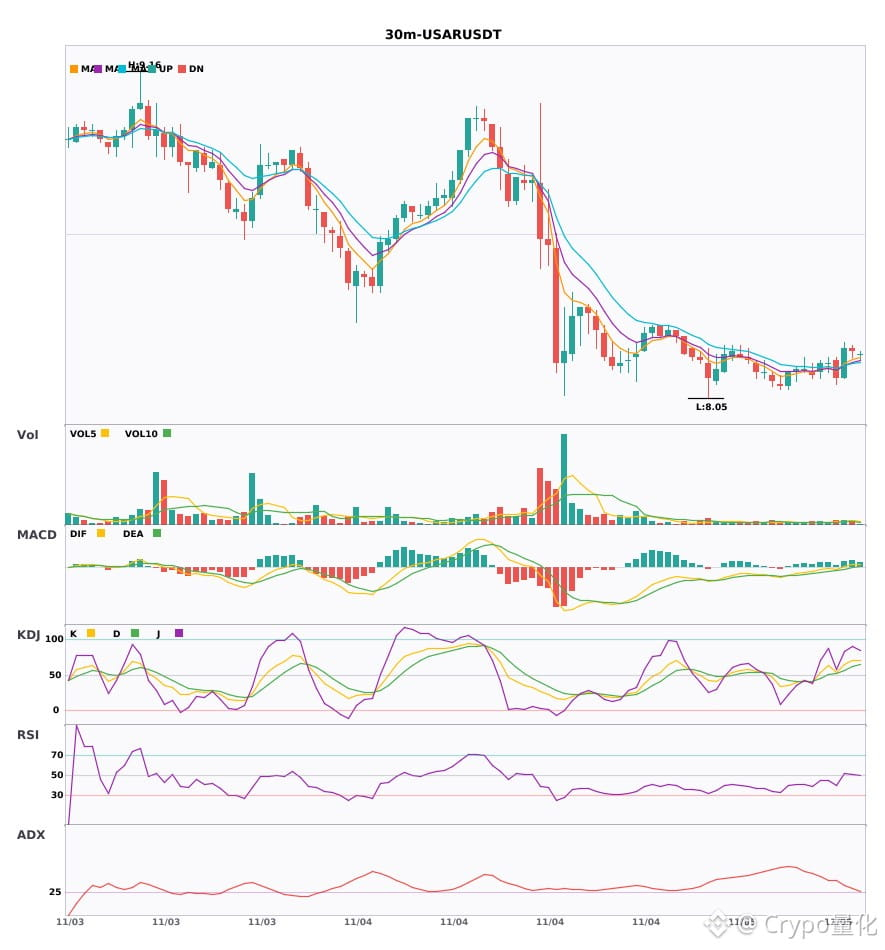
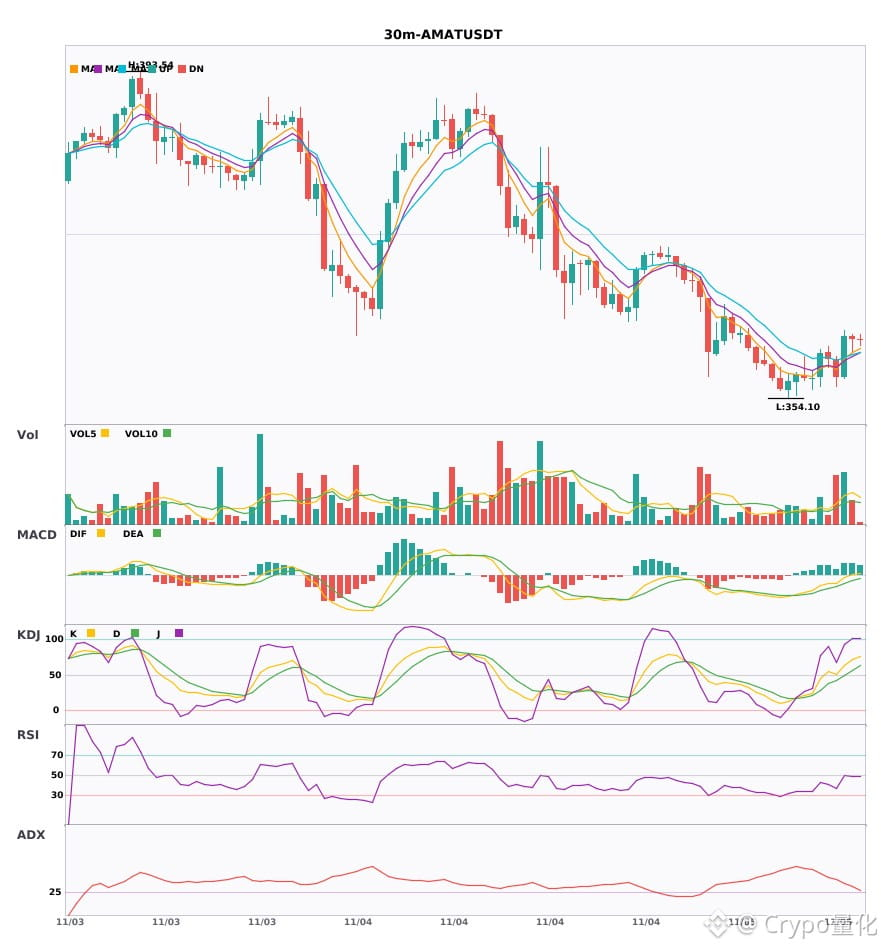
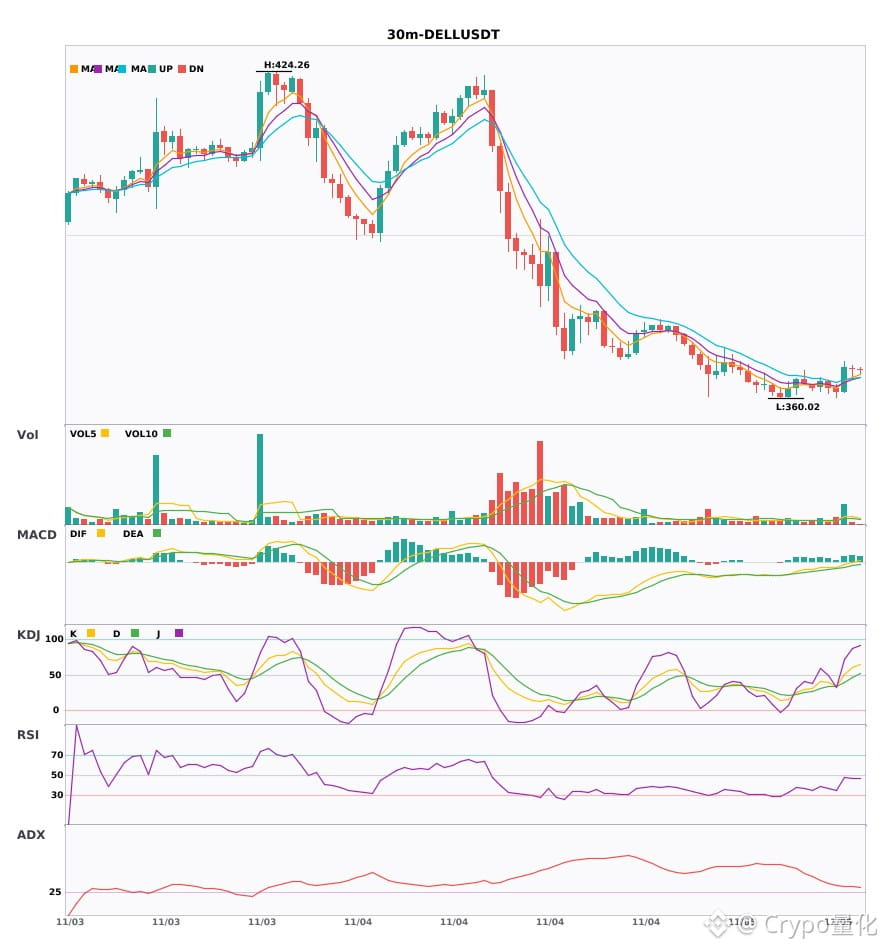
3 simultaneous 30-minute bullish signals: $USAR / $AMAT / $DELL🔥
════════════════════
🔴 $USAR 30-minute bullish signal
⚠️Technical analysis: ADX(31): clear trending market | MACD DIF breaks above zero, trend turns bullish | EMA5 crosses above EMA8, short-term trend turns bullish | KDJ is strong, bulls have the upper hand (K: 65.3, D: 56.5) | Volume increases (1.6x)
════════════════════
🔴 $AMAT 30-minute bullish signal
⚠️Technical analysis: ADX(30): trend is forming, opportunity to participate | MACD DIF breaks above zero, trend turns bullish | Moving averages converge as momentum builds; direction is about to be chosen | KDJ is strong, bulls have the upper hand (K: 71.2, D: 56.4) | Volume increases (2.4x)
════════════════════
🔴 $DELL 30-minute bullish signal
⚠️Technical analysis: ADX(28): trend is forming, opportunity to participate | MACD DIF breaks above zero, trend turns bullish | Moving averages converge as momentum builds; direction is about to be chosen | Volume surges (3.2x)
════════════════════
🔔 Follow for real-time market moves 🔔
#技术分析 #USAR #AMAT #DELL
📌 When trading, pay attention to whether the candlestick pattern matches
3 simultaneous 30-minute bullish signals: $USAR / $AMAT / $DELL 🔥
════════════════════
🔴 $USAR 30-minute bullish signal
⚠️Technical analysis: ADX(31): clear trending market | MACD DIF breaks above zero, trend turns bullish | EMA5 crosses above EMA8, short-term trend turns bullish | KDJ is strong, bulls have the upper hand (K: 65.3, D: 56.5) | Volume increases (1.6x)
════════════════════
🔴 $AMAT 30-minute bullish signal
⚠️Technical analysis: ADX(30): trend is forming, opportunity to participate | MACD DIF breaks above zero, trend turns bullish | Moving averages converge as momentum builds; direction is about to be chosen | KDJ is strong, bulls have the upper hand (K: 71.2, D: 56.4) | Volume increases (2.4x)
════════════════════
🔴 $DELL 30-minute bullish signal
⚠️Technical analysis: ADX(28): trend is forming, opportunity to participate | MACD DIF breaks above zero, trend turns bullish | Moving averages converge as momentum builds; direction is about to be chosen | Volume surges (3.2x)
════════════════════
🔔 Follow for real-time market moves 🔔
#技术分析 #USAR #AMAT #DELL
📌 When trading, pay attention to whether the candlestick pattern matches
════════════════════
🔴 $USAR 30-minute bullish signal
⚠️Technical analysis: ADX(31): clear trending market | MACD DIF breaks above zero, trend turns bullish | EMA5 crosses above EMA8, short-term trend turns bullish | KDJ is strong, bulls have the upper hand (K: 65.3, D: 56.5) | Volume increases (1.6x)
════════════════════
🔴 $AMAT 30-minute bullish signal
⚠️Technical analysis: ADX(30): trend is forming, opportunity to participate | MACD DIF breaks above zero, trend turns bullish | Moving averages converge as momentum builds; direction is about to be chosen | KDJ is strong, bulls have the upper hand (K: 71.2, D: 56.4) | Volume increases (2.4x)
════════════════════
🔴 $DELL 30-minute bullish signal
⚠️Technical analysis: ADX(28): trend is forming, opportunity to participate | MACD DIF breaks above zero, trend turns bullish | Moving averages converge as momentum builds; direction is about to be chosen | Volume surges (3.2x)
════════════════════
🔔 Follow for real-time market moves 🔔
#技术分析 #USAR #AMAT #DELL
📌 When trading, pay attention to whether the candlestick pattern matches
10
·
--
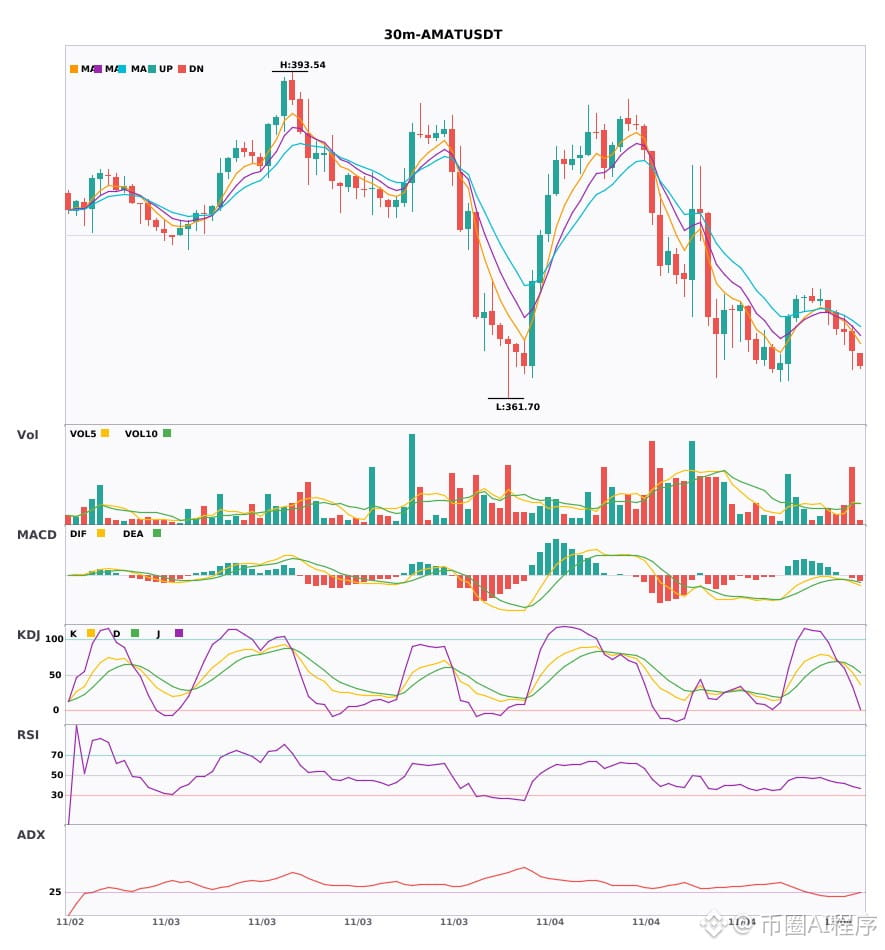
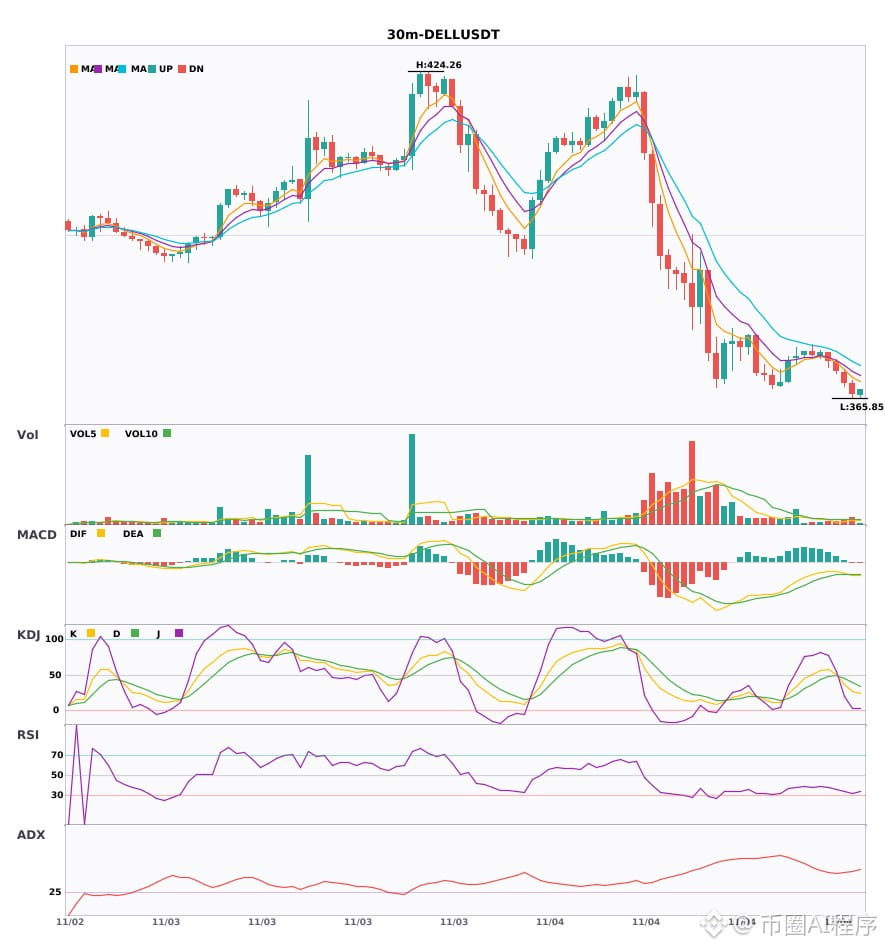
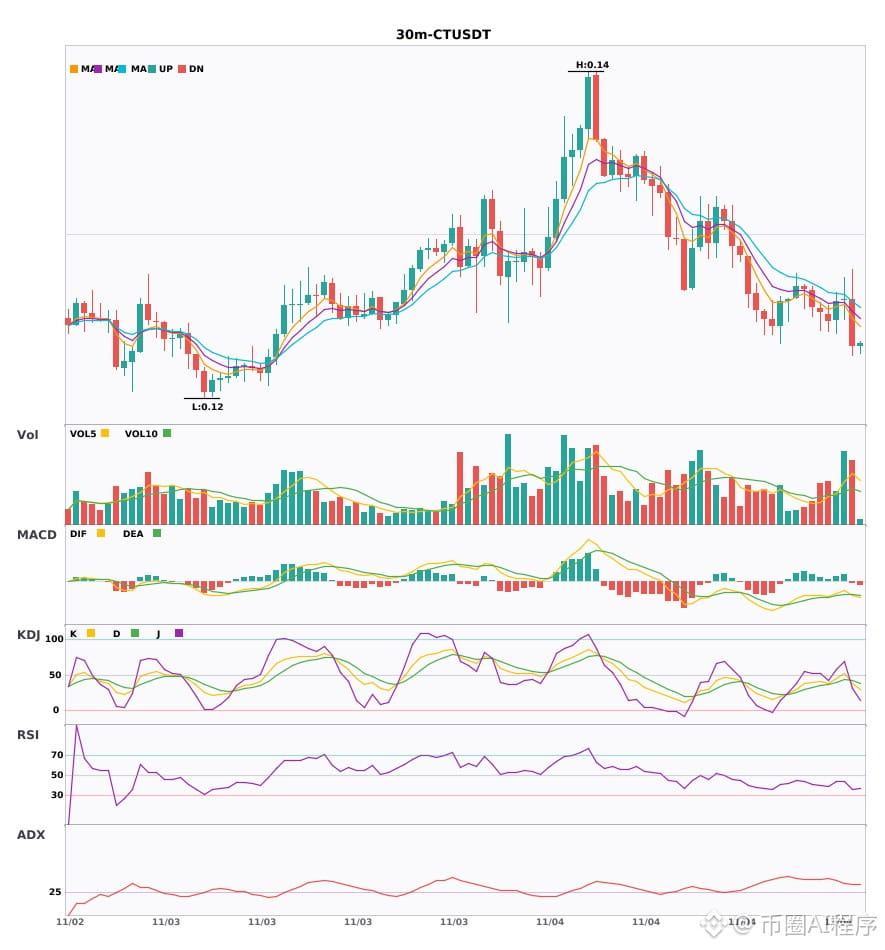
Multi-timeframe confluence: $AMAT / $DELL / $CT 30-minute weakness, 4-hour bearish trend confirmed 🔥
════════════════════
🟢 $AMAT 30-minute bearish signal
⚠️Technical analysis: 4-hour bearish confluence confirmed | 30-minute entry: MACD bearish crossover below zero, bearish momentum accelerating | EMA5 < EMA8 < EMA13, bearish alignment | KDJ running strong, bulls have the upper hand (K: 53.2, D: 62.5) | Volume surge (2.7x)
════════════════════
🟢 $DELL 30-minute bearish signal
⚠️Technical analysis: 4-hour bearish confluence confirmed | 30-minute entry: MACD bearish crossover below zero, bearish momentum accelerating | EMA5 < EMA8 < EMA13, bearish alignment | KDJ running weak, bears have the upper hand (K: 27.2, D: 39.1) | Normal volume (1.3x)
════════════════════
🟢 $CT 30-minute bearish signal
⚠️Technical analysis: 4-hour bearish confluence confirmed | 30-minute entry: MACD bearish crossover below zero, bearish momentum accelerating | EMA5 < EMA8 < EMA13, bearish alignment | KDJ bearish crossover, short-term outlook is bearish (K: 38.0, D: 41.7) | Increased volume (2.2x)
════════════════════
🔔 Follow for first-hand market updates 🔔
#多周期共振 #AMAT #DELL #CT
📌 When trading, pay attention to whether the candlestick pattern aligns
Multi-timeframe confluence: $AMAT / $DELL / $CT 30-minute weakness, 4-hour bearish trend confirmed 🔥
════════════════════
🟢 $AMAT 30-minute bearish signal
⚠️Technical analysis: 4-hour bearish confluence confirmed | 30-minute entry: MACD bearish crossover below zero, bearish momentum accelerating | EMA5 < EMA8 < EMA13, bearish alignment | KDJ running strong, bulls have the upper hand (K: 53.2, D: 62.5) | Volume surge (2.7x)
════════════════════
🟢 $DELL 30-minute bearish signal
⚠️Technical analysis: 4-hour bearish confluence confirmed | 30-minute entry: MACD bearish crossover below zero, bearish momentum accelerating | EMA5 < EMA8 < EMA13, bearish alignment | KDJ running weak, bears have the upper hand (K: 27.2, D: 39.1) | Normal volume (1.3x)
════════════════════
🟢 $CT 30-minute bearish signal
⚠️Technical analysis: 4-hour bearish confluence confirmed | 30-minute entry: MACD bearish crossover below zero, bearish momentum accelerating | EMA5 < EMA8 < EMA13, bearish alignment | KDJ bearish crossover, short-term outlook is bearish (K: 38.0, D: 41.7) | Increased volume (2.2x)
════════════════════
🔔 Follow for first-hand market updates 🔔
#多周期共振 #AMAT #DELL #CT
📌 When trading, pay attention to whether the candlestick pattern aligns
════════════════════
🟢 $AMAT 30-minute bearish signal
⚠️Technical analysis: 4-hour bearish confluence confirmed | 30-minute entry: MACD bearish crossover below zero, bearish momentum accelerating | EMA5 < EMA8 < EMA13, bearish alignment | KDJ running strong, bulls have the upper hand (K: 53.2, D: 62.5) | Volume surge (2.7x)
════════════════════
🟢 $DELL 30-minute bearish signal
⚠️Technical analysis: 4-hour bearish confluence confirmed | 30-minute entry: MACD bearish crossover below zero, bearish momentum accelerating | EMA5 < EMA8 < EMA13, bearish alignment | KDJ running weak, bears have the upper hand (K: 27.2, D: 39.1) | Normal volume (1.3x)
════════════════════
🟢 $CT 30-minute bearish signal
⚠️Technical analysis: 4-hour bearish confluence confirmed | 30-minute entry: MACD bearish crossover below zero, bearish momentum accelerating | EMA5 < EMA8 < EMA13, bearish alignment | KDJ bearish crossover, short-term outlook is bearish (K: 38.0, D: 41.7) | Increased volume (2.2x)
════════════════════
🔔 Follow for first-hand market updates 🔔
#多周期共振 #AMAT #DELL #CT
📌 When trading, pay attention to whether the candlestick pattern aligns
32
·
--
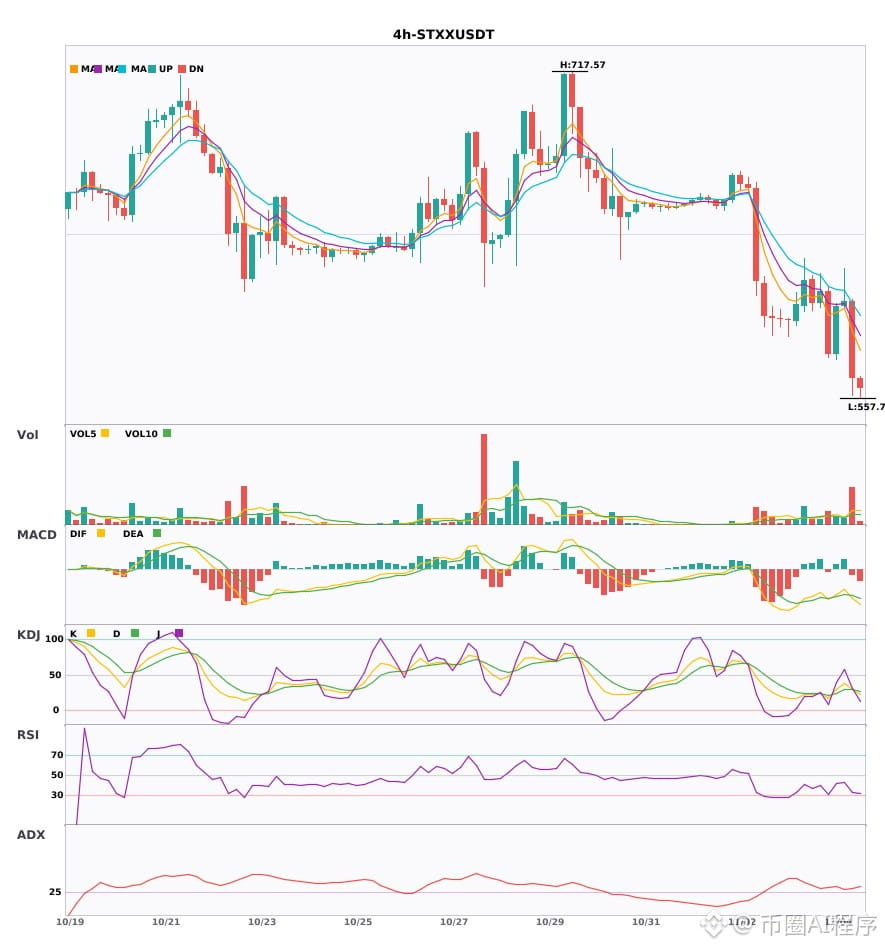
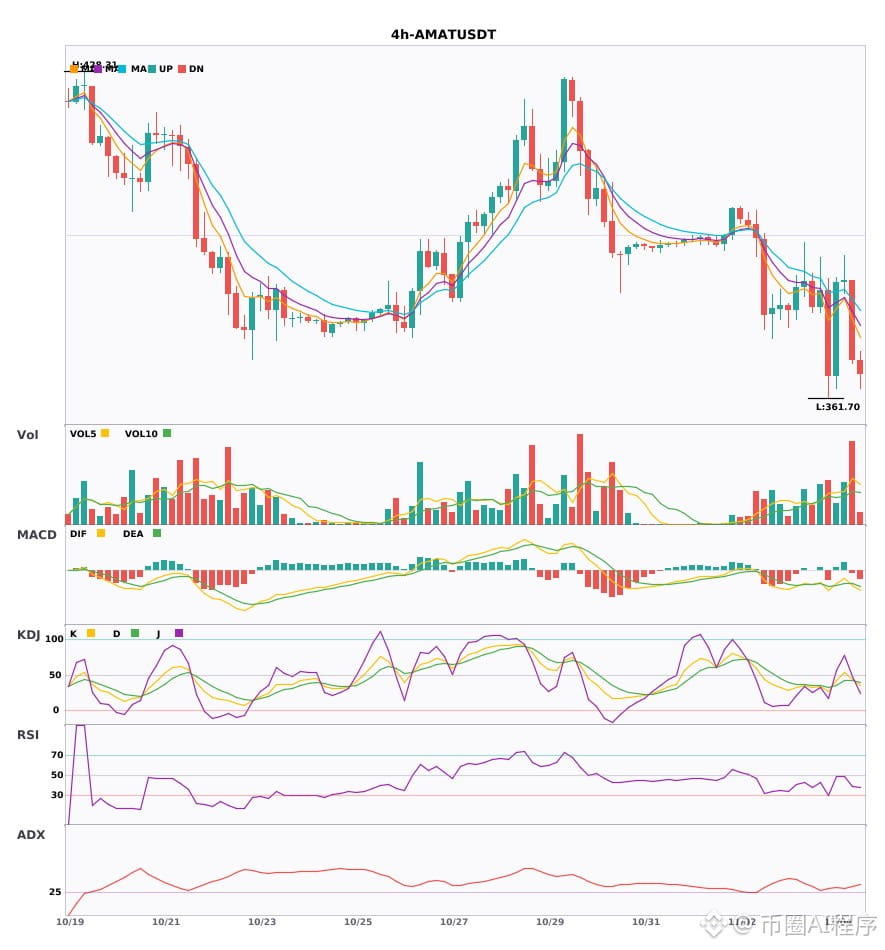
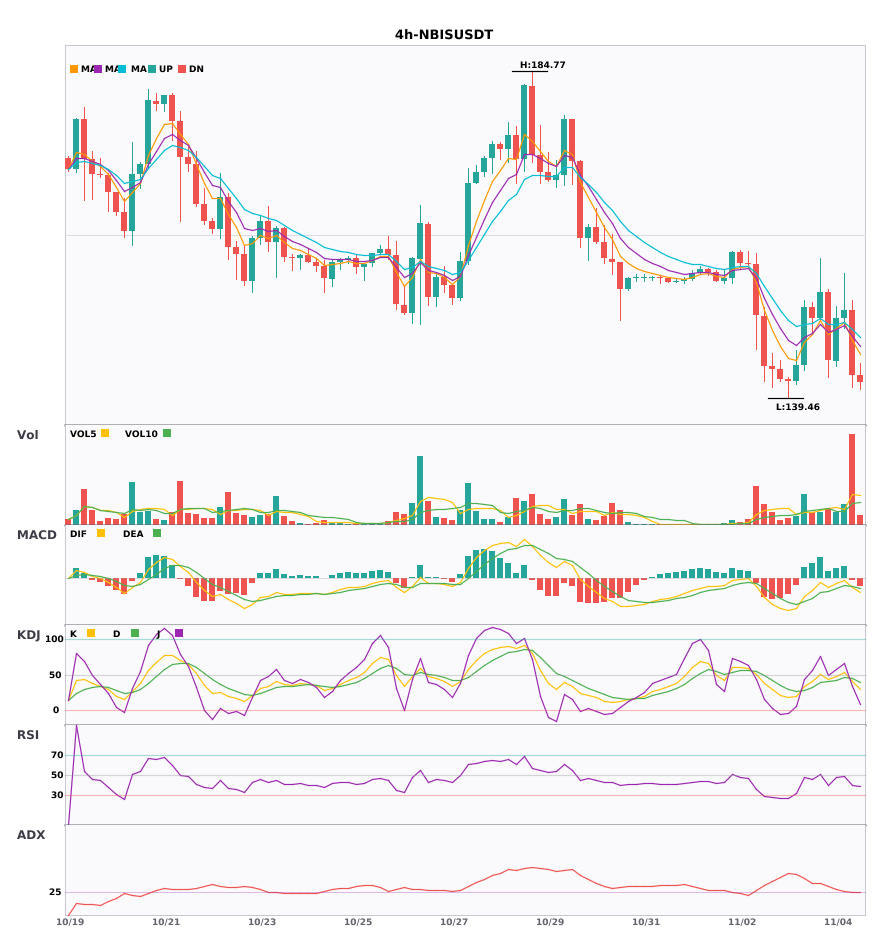
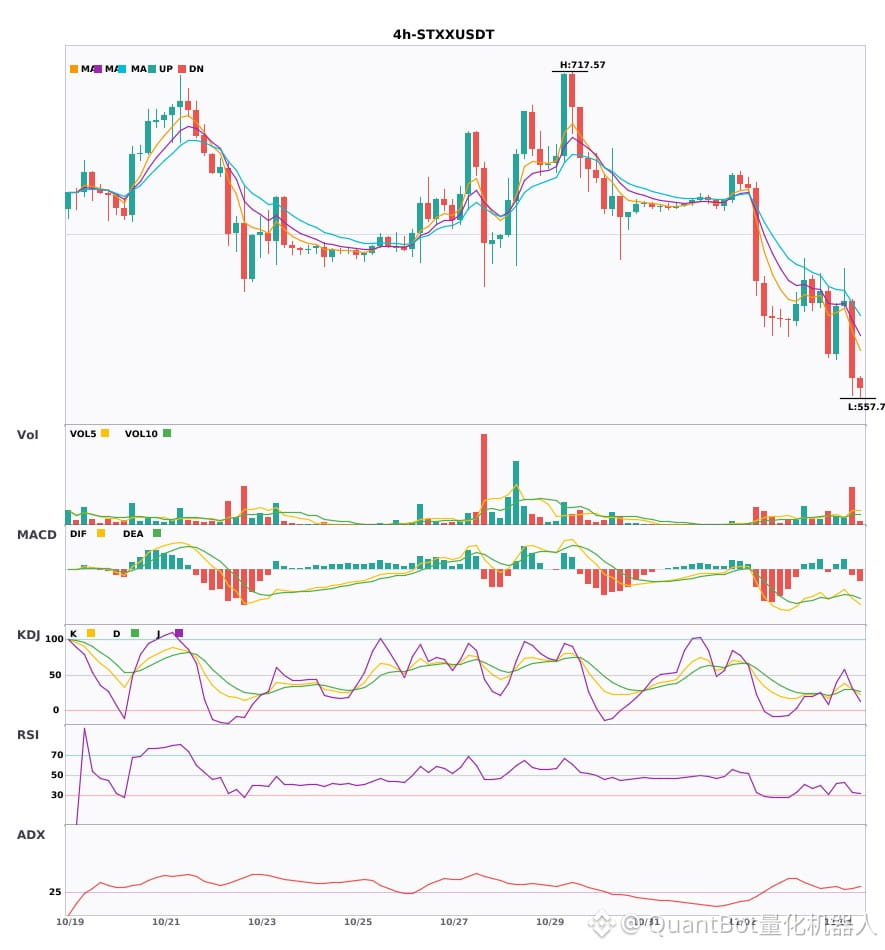
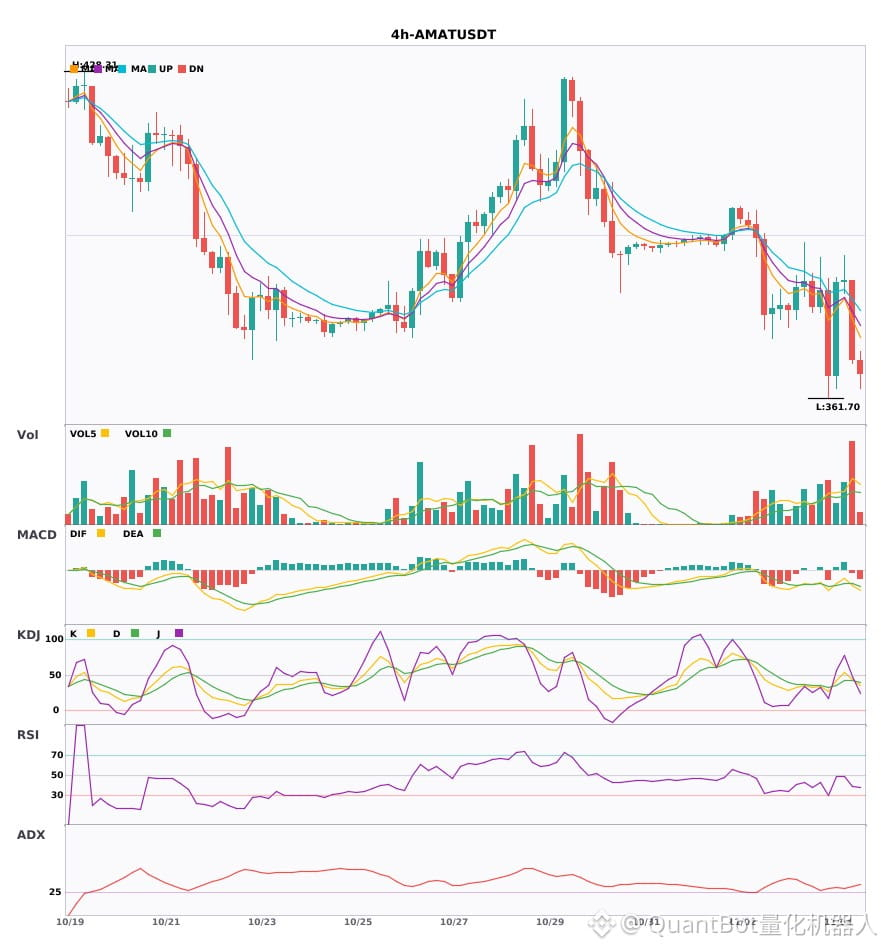
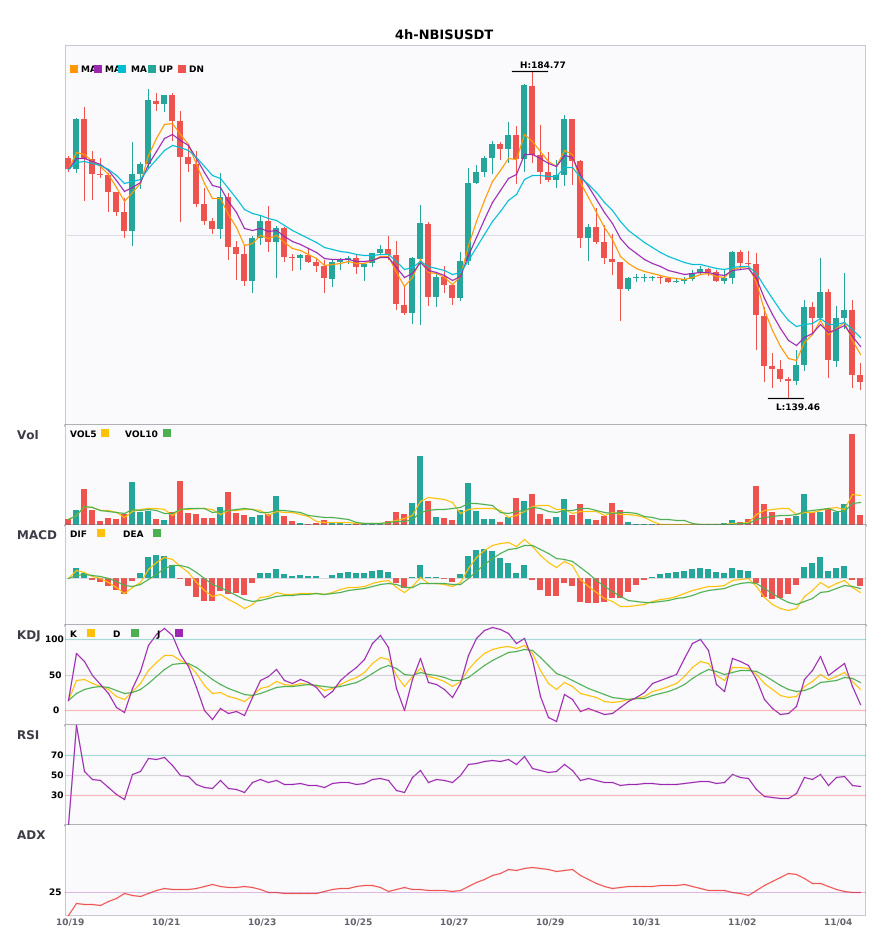
Multi-timeframe confluence: $STXX / $AMAT / $NBIS 4-hour weakness, daily bearish trend confirmed🔥
════════════════════
🟢 $STXX 4-hour bearish signal
⚠️Technical analysis: Daily bearish confluence confirmed | 4-hour entry: MACD bearish crossover below zero, bearish momentum accelerating | EMA5 < EMA8 < EMA13, bearish alignment | KDJ trending weakly, bears in control (K=29.9, D=29.4) | Volume surge (3.5x)
════════════════════
🟢 $AMAT 4-hour bearish signal
⚠️Technical analysis: Daily bearish confluence confirmed | 4-hour entry: MACD bearish crossover below zero, bearish momentum accelerating | EMA5 < EMA8 < EMA13, bearish alignment | KDJ trending weakly, bears in control (K=44.1, D=42.5) | Volume increased (2.5x)
════════════════════
🟢 $NBIS 4-hour bearish signal
⚠️Technical analysis: Daily bearish confluence confirmed | 4-hour entry: MACD bearish crossover below zero, bearish momentum accelerating | EMA5 crossed below EMA8, short-term bearish shift | KDJ bearish crossover, short-term outlook bearish (K=41.0, D=44.5) | Volume surge (4.2x)
════════════════════
🔔 Follow for real-time market alerts 🔔
#多周期共振 #STXX #AMAT #NBIS
📌 When trading, watch for confirmation from the candlestick pattern
Multi-timeframe confluence: $STXX / $AMAT / $NBIS 4-hour weakness, daily bearish trend confirmed🔥
════════════════════
🟢 $STXX 4-hour bearish signal
⚠️Technical analysis: Daily bearish confluence confirmed | 4-hour entry: MACD bearish crossover below zero, bearish momentum accelerating | EMA5 < EMA8 < EMA13, bearish alignment | KDJ trending weakly, bears in control (K=29.9, D=29.4) | Volume surge (3.5x)
════════════════════
🟢 $AMAT 4-hour bearish signal
⚠️Technical analysis: Daily bearish confluence confirmed | 4-hour entry: MACD bearish crossover below zero, bearish momentum accelerating | EMA5 < EMA8 < EMA13, bearish alignment | KDJ trending weakly, bears in control (K=44.1, D=42.5) | Volume increased (2.5x)
════════════════════
🟢 $NBIS 4-hour bearish signal
⚠️Technical analysis: Daily bearish confluence confirmed | 4-hour entry: MACD bearish crossover below zero, bearish momentum accelerating | EMA5 crossed below EMA8, short-term bearish shift | KDJ bearish crossover, short-term outlook bearish (K=41.0, D=44.5) | Volume surge (4.2x)
════════════════════
🔔 Follow for real-time market alerts 🔔
#多周期共振 #STXX #AMAT #NBIS
📌 When trading, watch for confirmation from the candlestick pattern
════════════════════
🟢 $STXX 4-hour bearish signal
⚠️Technical analysis: Daily bearish confluence confirmed | 4-hour entry: MACD bearish crossover below zero, bearish momentum accelerating | EMA5 < EMA8 < EMA13, bearish alignment | KDJ trending weakly, bears in control (K=29.9, D=29.4) | Volume surge (3.5x)
════════════════════
🟢 $AMAT 4-hour bearish signal
⚠️Technical analysis: Daily bearish confluence confirmed | 4-hour entry: MACD bearish crossover below zero, bearish momentum accelerating | EMA5 < EMA8 < EMA13, bearish alignment | KDJ trending weakly, bears in control (K=44.1, D=42.5) | Volume increased (2.5x)
════════════════════
🟢 $NBIS 4-hour bearish signal
⚠️Technical analysis: Daily bearish confluence confirmed | 4-hour entry: MACD bearish crossover below zero, bearish momentum accelerating | EMA5 crossed below EMA8, short-term bearish shift | KDJ bearish crossover, short-term outlook bearish (K=41.0, D=44.5) | Volume surge (4.2x)
════════════════════
🔔 Follow for real-time market alerts 🔔
#多周期共振 #STXX #AMAT #NBIS
📌 When trading, watch for confirmation from the candlestick pattern
10
$STXX / $AMAT / $NBIS 4-hour technical indicators are weakening simultaneously; beware of risk
📉 $STXX | 4-hour bearish signal
━━━━━━━━━━━━━━━━━━
Technical analysis: ADX(30) Trend is forming; entry is possible | MACD bearish crossover below zero; bearish momentum accelerating | EMA5 < EMA8 < EMA13, bearish alignment | KDJ moving weakly, bears in control (K: 29.9, D: 29.4) | Volume surge (3.5x)
Price change: -6.2300%
📉 $AMAT | 4-hour bearish signal
━━━━━━━━━━━━━━━━━━
Technical analysis: ADX(33) Clear trending market | MACD bearish crossover below zero; bearish momentum accelerating | EMA5 < EMA8 < EMA13, bearish alignment | KDJ moving weakly, bears in control (K: 44.1, D: 42.5) | Volume increased (2.5x)
Price change: -4.2100%
📉 $NBIS | 4-hour bearish signal
━━━━━━━━━━━━━━━━━━
Technical analysis: ADX(26) Trend is forming; entry is possible | MACD bearish crossover below zero; bearish momentum accelerating | EMA5 crossed below EMA8, short-term outlook has turned bearish | KDJ bearish crossover; bearish short-term outlook (K: 41.0, D: 44.5) | Volume surge (4.2x)
Price change: -5.8800%
━━━━━━━━━━━━━━━━━━
#技术分析 #STXX #AMAT #NBIS
📌 The above is for reference only and does not constitute investment advice
$STXX / $AMAT / $NBIS 4-hour technical indicators are weakening simultaneously; beware of risk
📉 $STXX | 4-hour bearish signal
━━━━━━━━━━━━━━━━━━
Technical analysis: ADX(30) Trend is forming; entry is possible | MACD bearish crossover below zero; bearish momentum accelerating | EMA5 < EMA8 < EMA13, bearish alignment | KDJ moving weakly, bears in control (K: 29.9, D: 29.4) | Volume surge (3.5x)
Price change: -6.2300%
📉 $AMAT | 4-hour bearish signal
━━━━━━━━━━━━━━━━━━
Technical analysis: ADX(33) Clear trending market | MACD bearish crossover below zero; bearish momentum accelerating | EMA5 < EMA8 < EMA13, bearish alignment | KDJ moving weakly, bears in control (K: 44.1, D: 42.5) | Volume increased (2.5x)
Price change: -4.2100%
📉 $NBIS | 4-hour bearish signal
━━━━━━━━━━━━━━━━━━
Technical analysis: ADX(26) Trend is forming; entry is possible | MACD bearish crossover below zero; bearish momentum accelerating | EMA5 crossed below EMA8, short-term outlook has turned bearish | KDJ bearish crossover; bearish short-term outlook (K: 41.0, D: 44.5) | Volume surge (4.2x)
Price change: -5.8800%
━━━━━━━━━━━━━━━━━━
#技术分析 #STXX #AMAT #NBIS
📌 The above is for reference only and does not constitute investment advice
📉 $STXX | 4-hour bearish signal
━━━━━━━━━━━━━━━━━━
Technical analysis: ADX(30) Trend is forming; entry is possible | MACD bearish crossover below zero; bearish momentum accelerating | EMA5 < EMA8 < EMA13, bearish alignment | KDJ moving weakly, bears in control (K: 29.9, D: 29.4) | Volume surge (3.5x)
Price change: -6.2300%
📉 $AMAT | 4-hour bearish signal
━━━━━━━━━━━━━━━━━━
Technical analysis: ADX(33) Clear trending market | MACD bearish crossover below zero; bearish momentum accelerating | EMA5 < EMA8 < EMA13, bearish alignment | KDJ moving weakly, bears in control (K: 44.1, D: 42.5) | Volume increased (2.5x)
Price change: -4.2100%
📉 $NBIS | 4-hour bearish signal
━━━━━━━━━━━━━━━━━━
Technical analysis: ADX(26) Trend is forming; entry is possible | MACD bearish crossover below zero; bearish momentum accelerating | EMA5 crossed below EMA8, short-term outlook has turned bearish | KDJ bearish crossover; bearish short-term outlook (K: 41.0, D: 44.5) | Volume surge (4.2x)
Price change: -5.8800%
━━━━━━━━━━━━━━━━━━
#技术分析 #STXX #AMAT #NBIS
📌 The above is for reference only and does not constitute investment advice
8
·
--
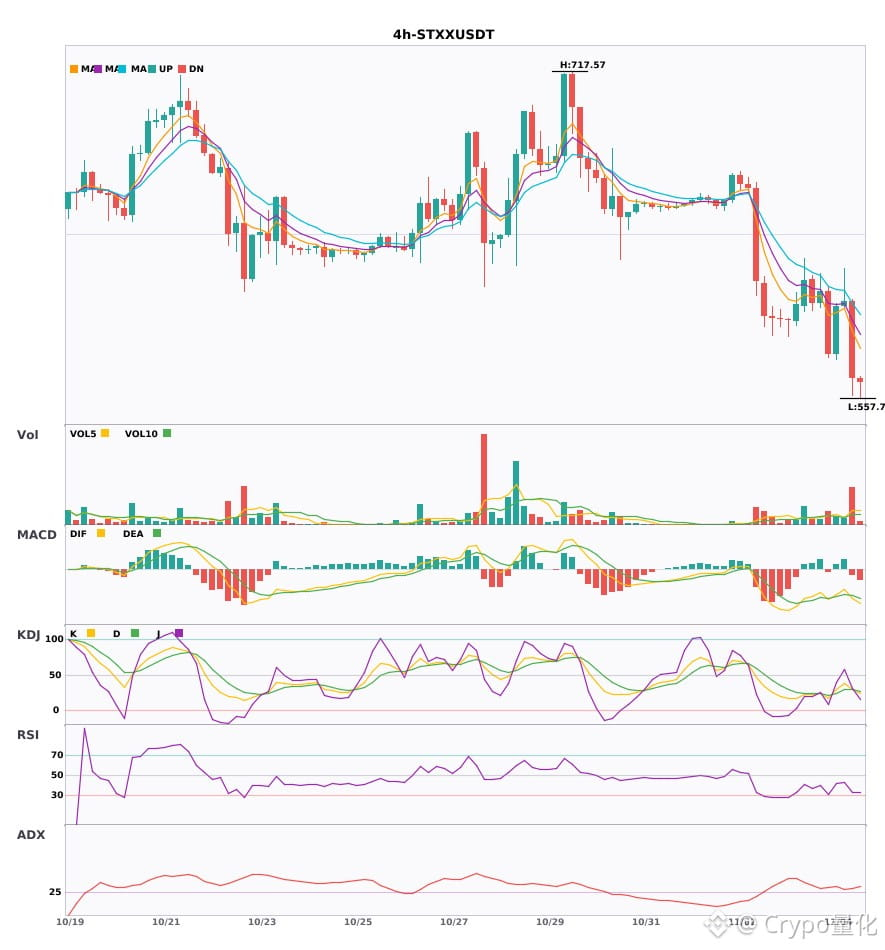
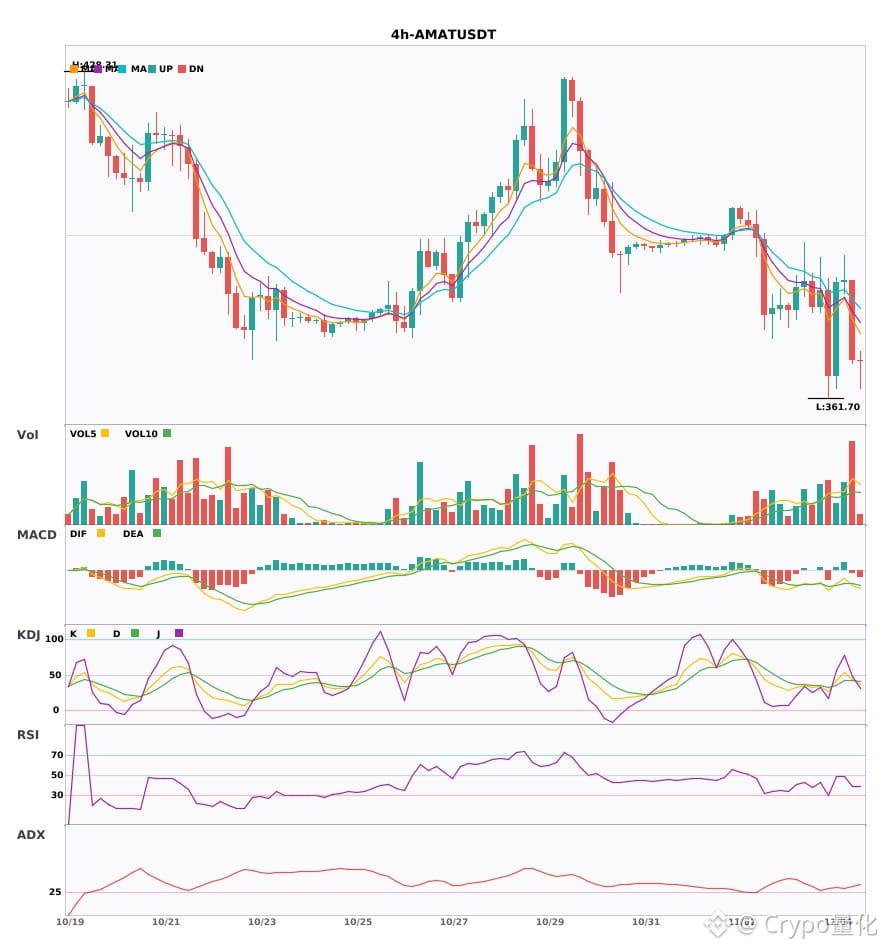
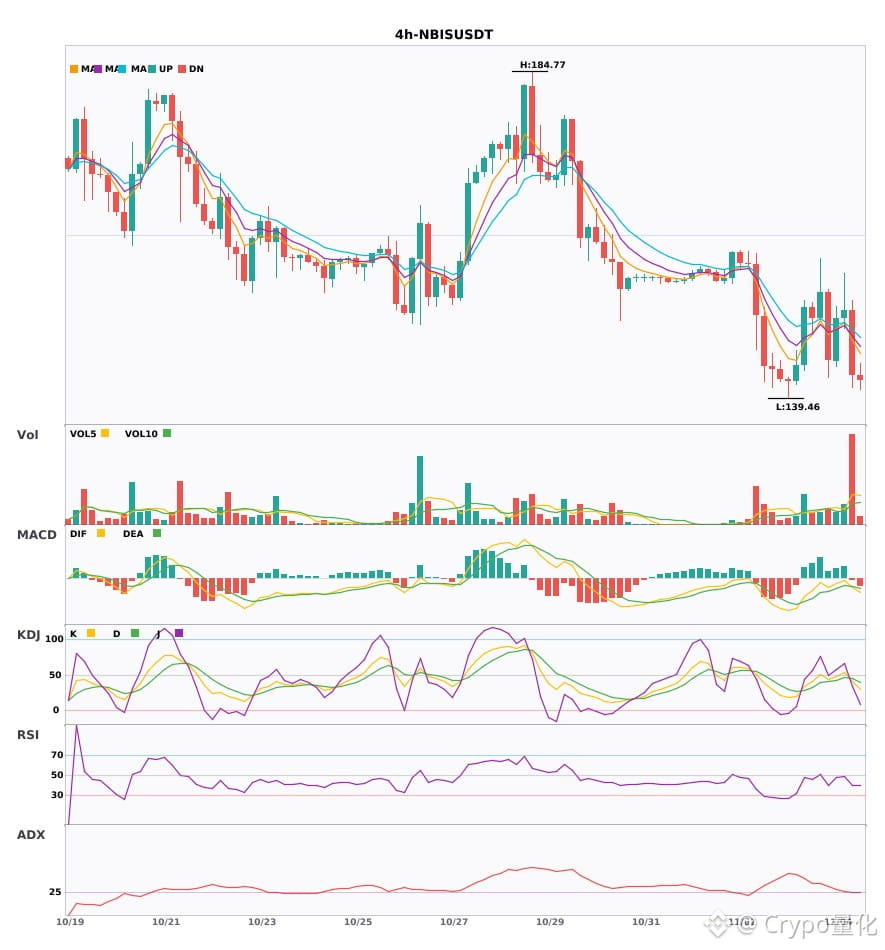
$STXX / $AMAT / $NBIS 4-hour confluence turns bearish; bearish signals appear simultaneously 🔥
════════════════════
🟢 $STXX 4-hour bearish signal
⚠️Technical analysis: ADX(30) Trend is forming; opportunity to participate | MACD bearish cross below zero, bearish momentum accelerating | EMA5 < EMA8 < EMA13, bearish alignment | KDJ weak, bears in control (K: 29.9, D: 29.4) | Volume surge (3.5x)
════════════════════
🟢 $AMAT 4-hour bearish signal
⚠️Technical analysis: ADX(33) Clear trending market | MACD bearish cross below zero, bearish momentum accelerating | EMA5 < EMA8 < EMA13, bearish alignment | KDJ weak, bears in control (K: 44.1, D: 42.5) | Volume increase (2.5x)
════════════════════
🟢 $NBIS 4-hour bearish signal
⚠️Technical analysis: ADX(26) Trend is forming; opportunity to participate | MACD bearish cross below zero, bearish momentum accelerating | EMA5 crosses below EMA8, short-term outlook turns bearish | KDJ bearish cross, short-term outlook bearish (K: 41.0, D: 44.5) | Volume surge (4.2x)
════════════════════
🔔 Follow for first-hand market updates 🔔
#技术分析 #STXX #AMAT #NBIS
📌 When trading, pay attention to whether the candlestick pattern confirms the signal
$STXX / $AMAT / $NBIS 4-hour confluence turns bearish; bearish signals appear simultaneously 🔥
════════════════════
🟢 $STXX 4-hour bearish signal
⚠️Technical analysis: ADX(30) Trend is forming; opportunity to participate | MACD bearish cross below zero, bearish momentum accelerating | EMA5 < EMA8 < EMA13, bearish alignment | KDJ weak, bears in control (K: 29.9, D: 29.4) | Volume surge (3.5x)
════════════════════
🟢 $AMAT 4-hour bearish signal
⚠️Technical analysis: ADX(33) Clear trending market | MACD bearish cross below zero, bearish momentum accelerating | EMA5 < EMA8 < EMA13, bearish alignment | KDJ weak, bears in control (K: 44.1, D: 42.5) | Volume increase (2.5x)
════════════════════
🟢 $NBIS 4-hour bearish signal
⚠️Technical analysis: ADX(26) Trend is forming; opportunity to participate | MACD bearish cross below zero, bearish momentum accelerating | EMA5 crosses below EMA8, short-term outlook turns bearish | KDJ bearish cross, short-term outlook bearish (K: 41.0, D: 44.5) | Volume surge (4.2x)
════════════════════
🔔 Follow for first-hand market updates 🔔
#技术分析 #STXX #AMAT #NBIS
📌 When trading, pay attention to whether the candlestick pattern confirms the signal
════════════════════
🟢 $STXX 4-hour bearish signal
⚠️Technical analysis: ADX(30) Trend is forming; opportunity to participate | MACD bearish cross below zero, bearish momentum accelerating | EMA5 < EMA8 < EMA13, bearish alignment | KDJ weak, bears in control (K: 29.9, D: 29.4) | Volume surge (3.5x)
════════════════════
🟢 $AMAT 4-hour bearish signal
⚠️Technical analysis: ADX(33) Clear trending market | MACD bearish cross below zero, bearish momentum accelerating | EMA5 < EMA8 < EMA13, bearish alignment | KDJ weak, bears in control (K: 44.1, D: 42.5) | Volume increase (2.5x)
════════════════════
🟢 $NBIS 4-hour bearish signal
⚠️Technical analysis: ADX(26) Trend is forming; opportunity to participate | MACD bearish cross below zero, bearish momentum accelerating | EMA5 crosses below EMA8, short-term outlook turns bearish | KDJ bearish cross, short-term outlook bearish (K: 41.0, D: 44.5) | Volume surge (4.2x)
════════════════════
🔔 Follow for first-hand market updates 🔔
#技术分析 #STXX #AMAT #NBIS
📌 When trading, pay attention to whether the candlestick pattern confirms the signal
9

·
--
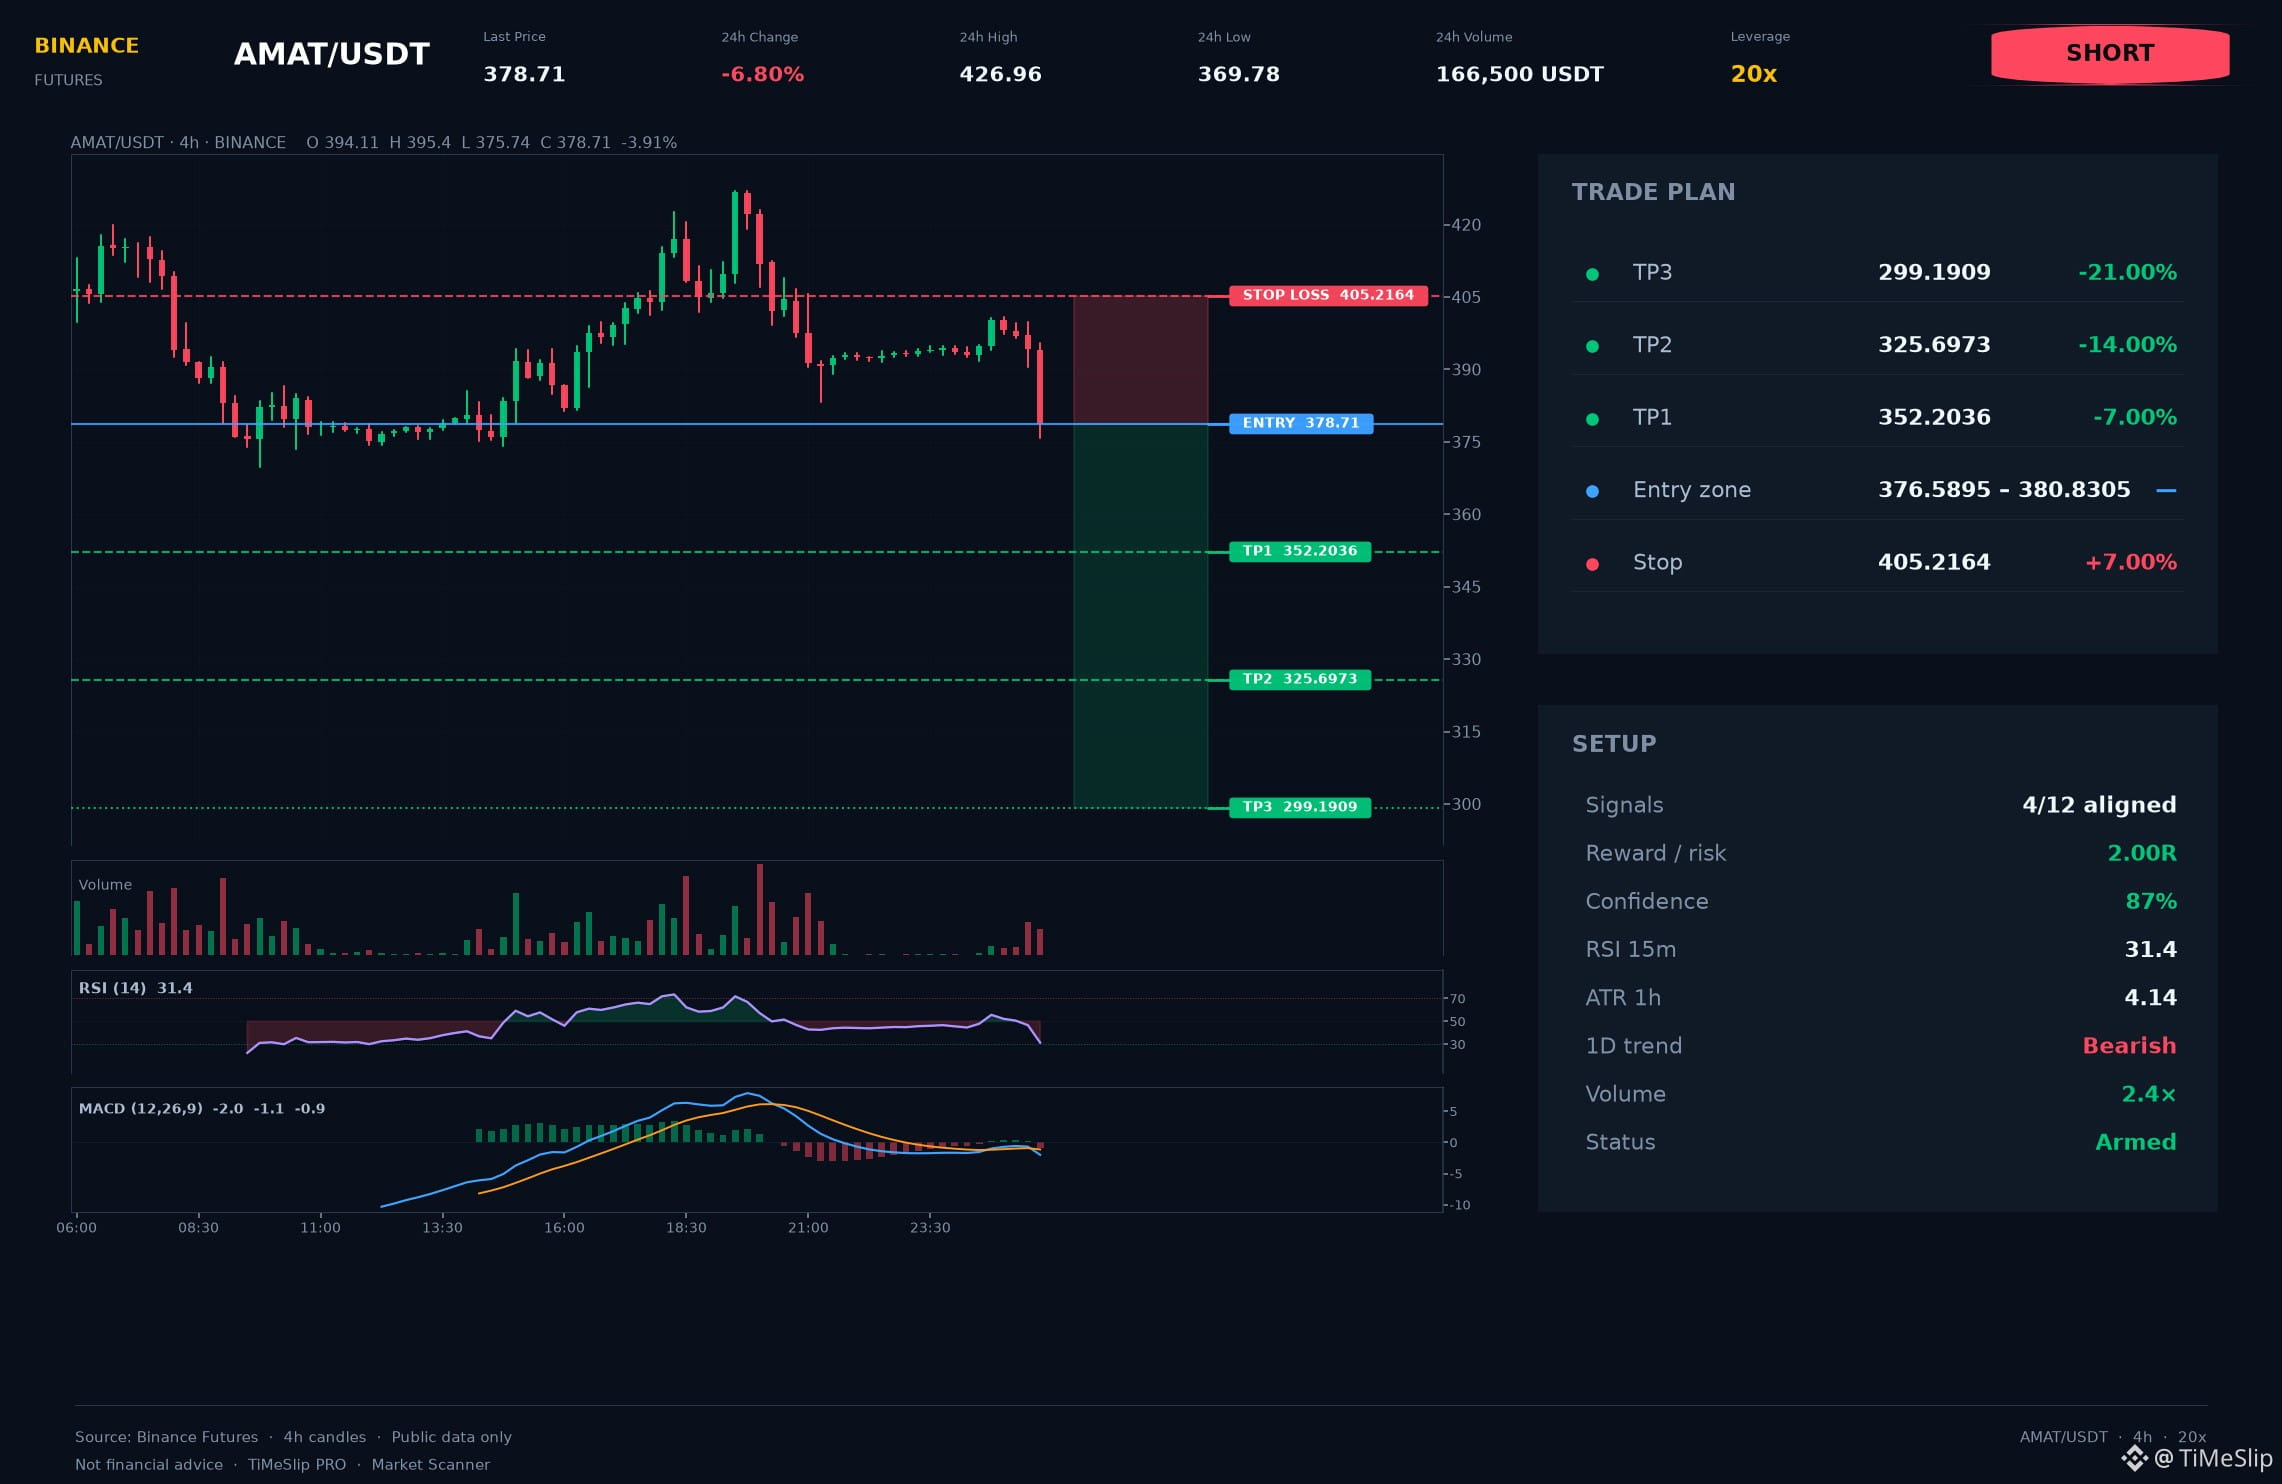
$AMAT 🔴 (Sell)
Entry: 378.710
Stop: 405.216
• TP1: 352.204
• TP2: 325.697
• TP3: 299.191
🛡️ Risk control: Move the stop to entry after TP1.
Sellers got a technical opportunity on AMAT. Judge by whether the level holds, not by the first reaction.
Structure broke: The 393.216 break was confirmed by a retest. Stop risk: 7.00%. Timeframes: 8h, 12h, 1d, 1w. ATR(14): 4.1400.
🔥 Clear volume spike (2.4× above average).
📚 Order Flow: Order book imbalance +51.6%; aggressive buying 35.4%. Overall, the flow is mixed, with no clear direction.
Setup strength: 87/100. The figures indicate probability; risk management comes first. ⚠️ High risk to the stop (7.00%): reduce position size.
📈 Subscribe so you don't miss key entry levels and scenarios!
There is a high risk of capital loss in crypto trading. Always use a protective stop-loss.
#AMAT #AMATNews $AMAT 👈 Tap to trade
$AMAT 🔴 (Sell)
Entry: 378.710
Stop: 405.216
• TP1: 352.204
• TP2: 325.697
• TP3: 299.191
🛡️ Risk control: Move the stop to entry after TP1.
Sellers got a technical opportunity on AMAT. Judge by whether the level holds, not by the first reaction.
Structure broke: The 393.216 break was confirmed by a retest. Stop risk: 7.00%. Timeframes: 8h, 12h, 1d, 1w. ATR(14): 4.1400.
🔥 Clear volume spike (2.4× above average).
📚 Order Flow: Order book imbalance +51.6%; aggressive buying 35.4%. Overall, the flow is mixed, with no clear direction.
Setup strength: 87/100. The figures indicate probability; risk management comes first. ⚠️ High risk to the stop (7.00%): reduce position size.
📈 Subscribe so you don't miss key entry levels and scenarios!
There is a high risk of capital loss in crypto trading. Always use a protective stop-loss.
#AMAT #AMATNews $AMAT 👈 Tap to trade
Entry: 378.710
Stop: 405.216
• TP1: 352.204
• TP2: 325.697
• TP3: 299.191
🛡️ Risk control: Move the stop to entry after TP1.
Sellers got a technical opportunity on AMAT. Judge by whether the level holds, not by the first reaction.
Structure broke: The 393.216 break was confirmed by a retest. Stop risk: 7.00%. Timeframes: 8h, 12h, 1d, 1w. ATR(14): 4.1400.
🔥 Clear volume spike (2.4× above average).
📚 Order Flow: Order book imbalance +51.6%; aggressive buying 35.4%. Overall, the flow is mixed, with no clear direction.
Setup strength: 87/100. The figures indicate probability; risk management comes first. ⚠️ High risk to the stop (7.00%): reduce position size.
📈 Subscribe so you don't miss key entry levels and scenarios!
There is a high risk of capital loss in crypto trading. Always use a protective stop-loss.
#AMAT #AMATNews $AMAT 👈 Tap to trade
24
·
--
$RLC / $AMAT / $ORCL 4-hour confluence turns bearish; bearish signals appear simultaneously 🔥
════════════════════
🟢 $RLC 4-hour bearish signal
⚠️ Technicals: ADX(28): Trend is forming; opportunity to participate | MACD bearish crossover below zero; bearish momentum accelerating | EMA5 crosses below EMA8; short-term outlook turns bearish | KDJ bearish crossover; short-term outlook is bearish (K: 51.4, D: 54.8) | Volume increases (2.1x)
════════════════════
🟢 $AMAT 4-hour bearish signal
⚠️ Technicals: ADX(33): Clear trending market | MACD is bearish; trend is weak and momentum is strengthening | EMA5 < EMA8 < EMA13; bearish alignment | KDJ is weak, with bears in control (K: 17.8, D: 34.9) | Volume increases (1.7x)
════════════════════
🟢 $ORCL 4-hour bearish signal
⚠️ Technicals: ADX(30): Trend is forming; opportunity to participate | MACD is bearish; trend is weak and momentum is strengthening | EMA5 < EMA8 < EMA13; bearish alignment | KDJ is weak, with bears in control (K: 20.1, D: 34.6) | Volume increases (1.9x)
════════════════════
🔔 Follow for breaking market movements 🔔
#技术分析 #RLC #AMAT #ORCL
📌 When trading, watch for whether the candlestick pattern confirms the signal
$RLC / $AMAT / $ORCL 4-hour confluence turns bearish; bearish signals appear simultaneously 🔥
════════════════════
🟢 $RLC 4-hour bearish signal
⚠️ Technicals: ADX(28): Trend is forming; opportunity to participate | MACD bearish crossover below zero; bearish momentum accelerating | EMA5 crosses below EMA8; short-term outlook turns bearish | KDJ bearish crossover; short-term outlook is bearish (K: 51.4, D: 54.8) | Volume increases (2.1x)
════════════════════
🟢 $AMAT 4-hour bearish signal
⚠️ Technicals: ADX(33): Clear trending market | MACD is bearish; trend is weak and momentum is strengthening | EMA5 < EMA8 < EMA13; bearish alignment | KDJ is weak, with bears in control (K: 17.8, D: 34.9) | Volume increases (1.7x)
════════════════════
🟢 $ORCL 4-hour bearish signal
⚠️ Technicals: ADX(30): Trend is forming; opportunity to participate | MACD is bearish; trend is weak and momentum is strengthening | EMA5 < EMA8 < EMA13; bearish alignment | KDJ is weak, with bears in control (K: 20.1, D: 34.6) | Volume increases (1.9x)
════════════════════
🔔 Follow for breaking market movements 🔔
#技术分析 #RLC #AMAT #ORCL
📌 When trading, watch for whether the candlestick pattern confirms the signal
════════════════════
🟢 $RLC 4-hour bearish signal
⚠️ Technicals: ADX(28): Trend is forming; opportunity to participate | MACD bearish crossover below zero; bearish momentum accelerating | EMA5 crosses below EMA8; short-term outlook turns bearish | KDJ bearish crossover; short-term outlook is bearish (K: 51.4, D: 54.8) | Volume increases (2.1x)
════════════════════
🟢 $AMAT 4-hour bearish signal
⚠️ Technicals: ADX(33): Clear trending market | MACD is bearish; trend is weak and momentum is strengthening | EMA5 < EMA8 < EMA13; bearish alignment | KDJ is weak, with bears in control (K: 17.8, D: 34.9) | Volume increases (1.7x)
════════════════════
🟢 $ORCL 4-hour bearish signal
⚠️ Technicals: ADX(30): Trend is forming; opportunity to participate | MACD is bearish; trend is weak and momentum is strengthening | EMA5 < EMA8 < EMA13; bearish alignment | KDJ is weak, with bears in control (K: 20.1, D: 34.6) | Volume increases (1.9x)
════════════════════
🔔 Follow for breaking market movements 🔔
#技术分析 #RLC #AMAT #ORCL
📌 When trading, watch for whether the candlestick pattern confirms the signal


7
·
--
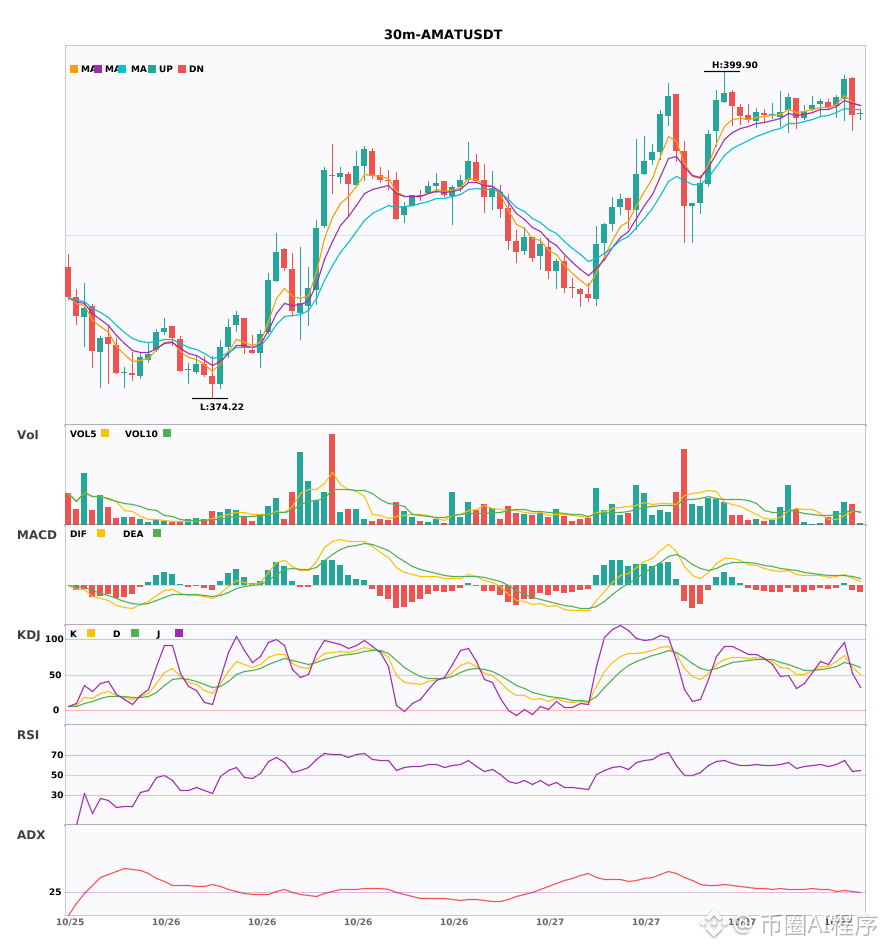
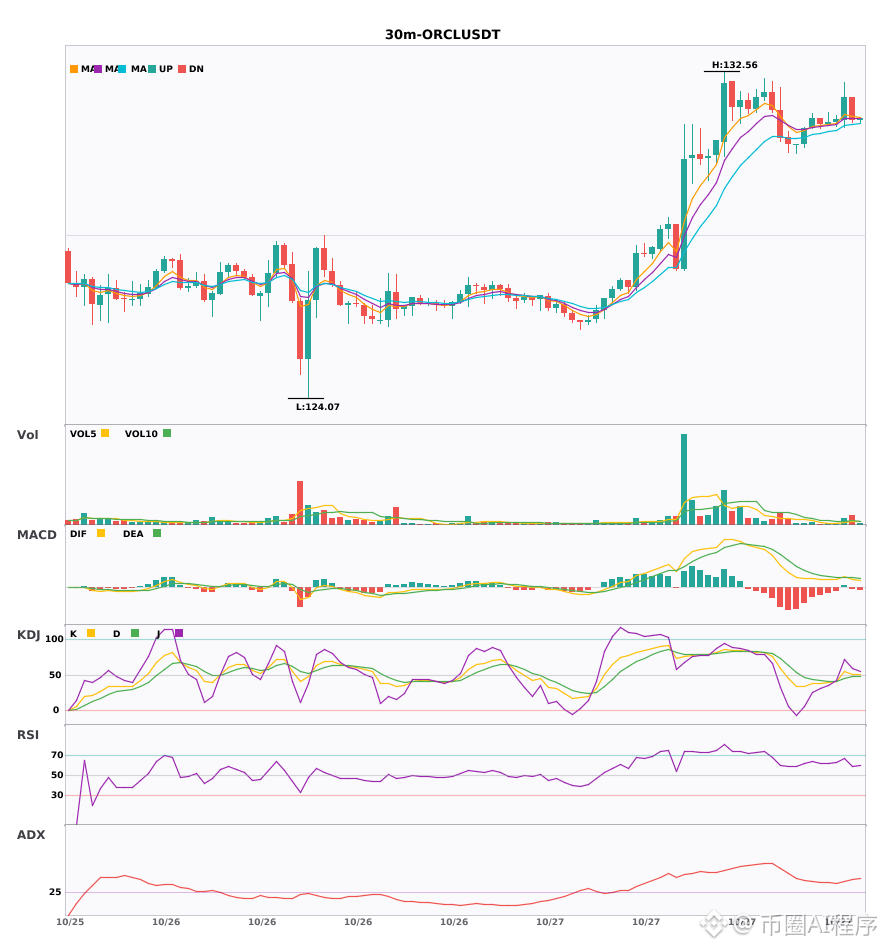
Multi-timeframe confluence: $AMAT / $ORCL 30-minute strength, 4-hour bullish trend confirmed 🔥
════════════════════
🔴 $AMAT 30-minute bullish signal
⚠️ Technicals: 4-hour bullish confluence confirmed | 30-minute entry: MACD golden cross above zero, bullish momentum building | EMA5 > EMA8 > EMA13, bullish alignment | KDJ trending strongly, bulls in control (K: 76.7, D: 67.2) | Volume increased (1.8x)
════════════════════
🔴 $ORCL 30-minute bullish signal
⚠️ Technicals: 4-hour bullish confluence confirmed | 30-minute entry: MACD golden cross above zero, bullish momentum building | EMA5 > EMA8 > EMA13, bullish alignment | Volume increased (1.7x)
════════════════════
🔔 Follow for the latest market activity 🔔
#多周期共振 #AMAT #ORCL
📌 When trading, pay attention to whether the candlestick pattern confirms the signal
Multi-timeframe confluence: $AMAT / $ORCL 30-minute strength, 4-hour bullish trend confirmed 🔥
════════════════════
🔴 $AMAT 30-minute bullish signal
⚠️ Technicals: 4-hour bullish confluence confirmed | 30-minute entry: MACD golden cross above zero, bullish momentum building | EMA5 > EMA8 > EMA13, bullish alignment | KDJ trending strongly, bulls in control (K: 76.7, D: 67.2) | Volume increased (1.8x)
════════════════════
🔴 $ORCL 30-minute bullish signal
⚠️ Technicals: 4-hour bullish confluence confirmed | 30-minute entry: MACD golden cross above zero, bullish momentum building | EMA5 > EMA8 > EMA13, bullish alignment | Volume increased (1.7x)
════════════════════
🔔 Follow for the latest market activity 🔔
#多周期共振 #AMAT #ORCL
📌 When trading, pay attention to whether the candlestick pattern confirms the signal
════════════════════
🔴 $AMAT 30-minute bullish signal
⚠️ Technicals: 4-hour bullish confluence confirmed | 30-minute entry: MACD golden cross above zero, bullish momentum building | EMA5 > EMA8 > EMA13, bullish alignment | KDJ trending strongly, bulls in control (K: 76.7, D: 67.2) | Volume increased (1.8x)
════════════════════
🔴 $ORCL 30-minute bullish signal
⚠️ Technicals: 4-hour bullish confluence confirmed | 30-minute entry: MACD golden cross above zero, bullish momentum building | EMA5 > EMA8 > EMA13, bullish alignment | Volume increased (1.7x)
════════════════════
🔔 Follow for the latest market activity 🔔
#多周期共振 #AMAT #ORCL
📌 When trading, pay attention to whether the candlestick pattern confirms the signal
63
·
--
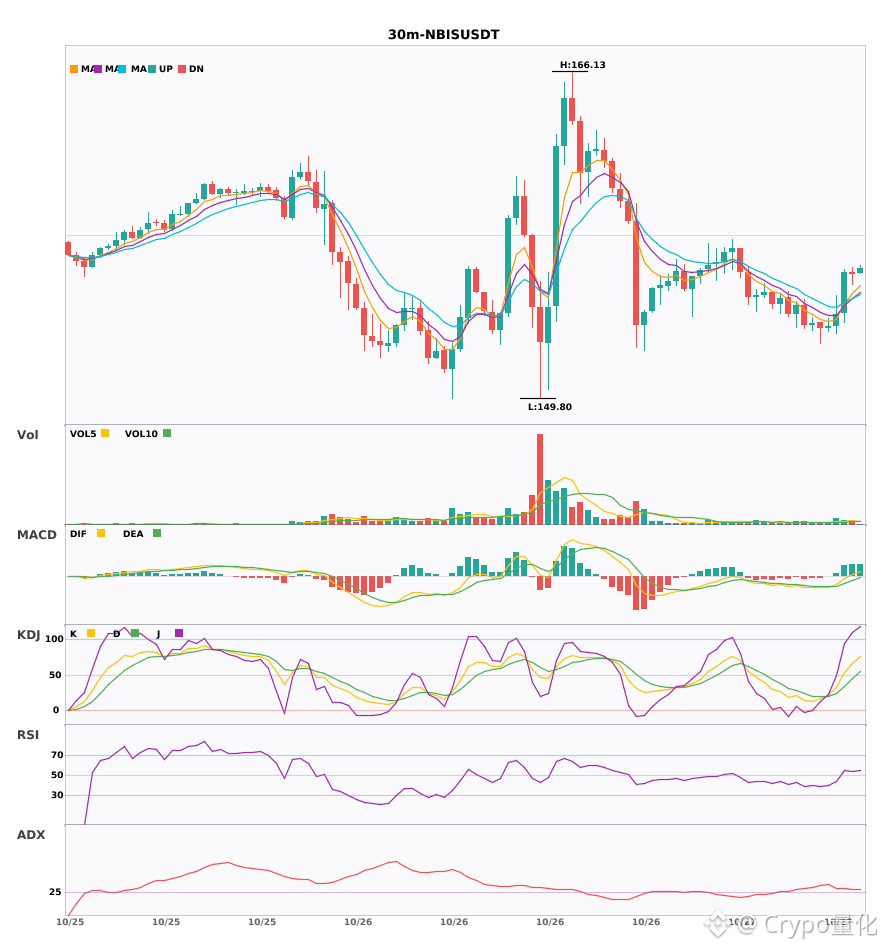
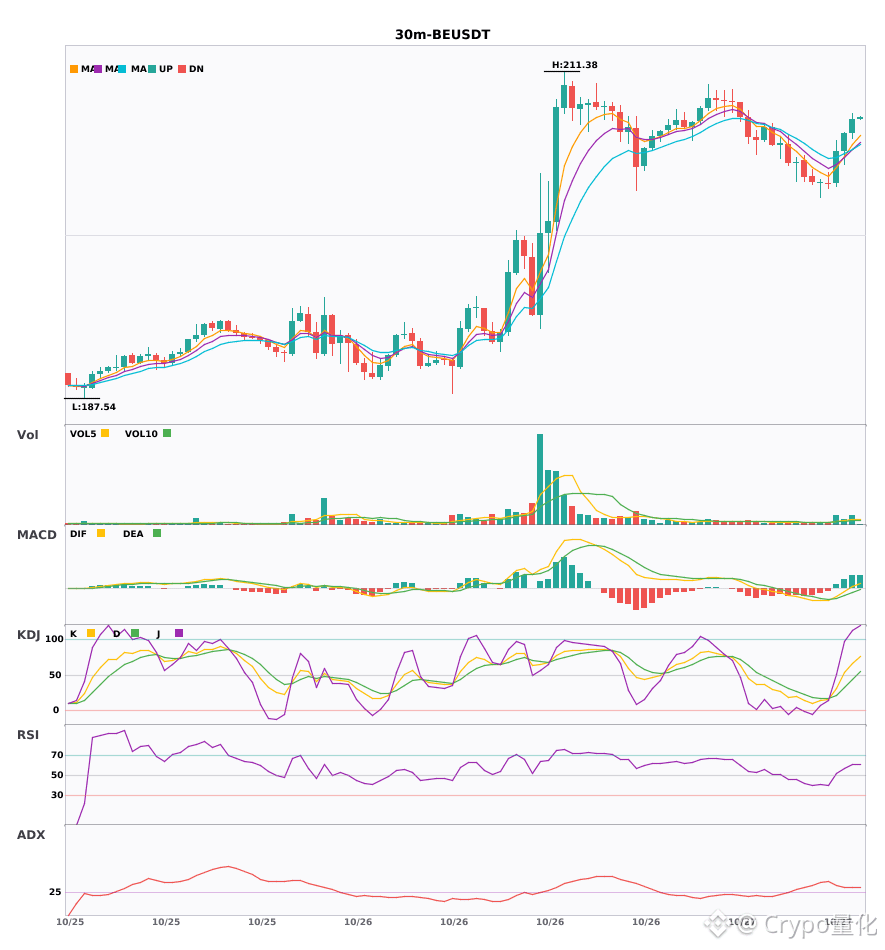
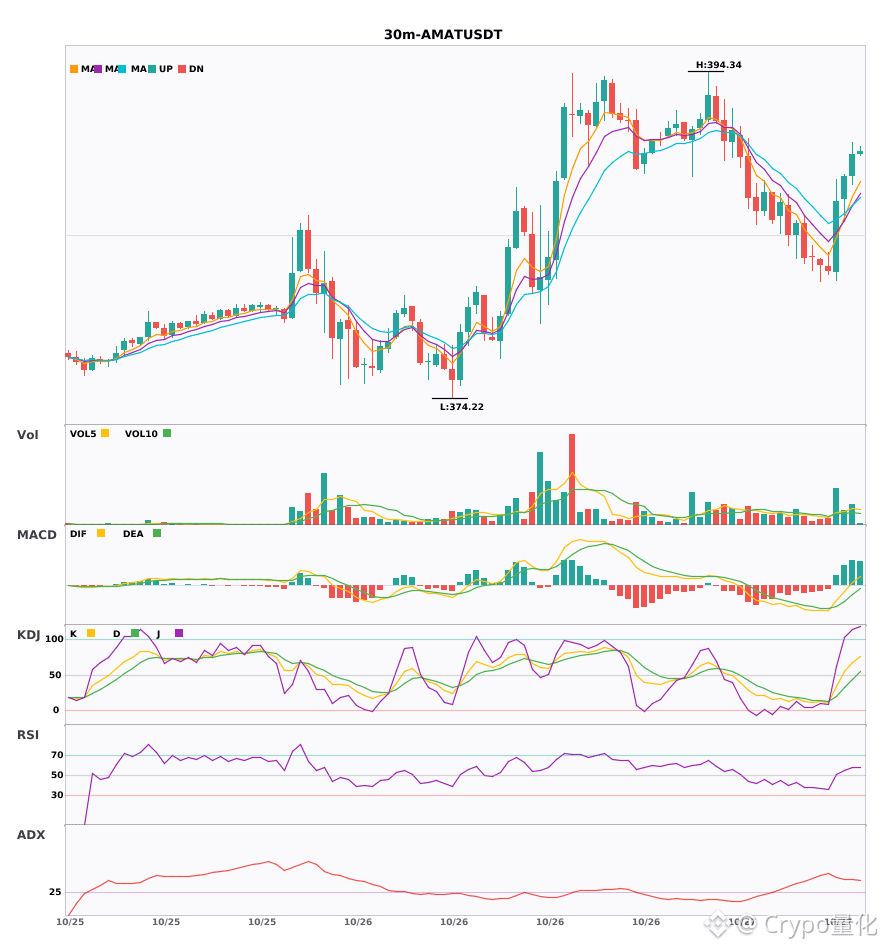
$NBIS / $BE / $AMAT : Technical indicators are strengthening across the board on the 30-minute chart—which has the most breakout potential? 🔥
════════════════════
🔴 $NBIS 30-minute bullish signal
⚠️Technical analysis: ADX(31): clear trending market | MACD DIF breaks above the zero line, signaling a bullish trend | Moving averages are converging and building momentum, with a directional move imminent | Volume increased (1.6x)
════════════════════
🔴 $BE 30-minute bullish signal
⚠️Technical analysis: ADX(35): clear trending market | MACD DIF breaks above the zero line, signaling a bullish trend | Moving averages are converging and building momentum, with a directional move imminent | Volume increased (2.2x)
════════════════════
🔴 $AMAT 30-minute bullish signal
⚠️Technical analysis: ADX(45): clear trending market | MACD DIF breaks above the zero line, signaling a bullish trend | Moving averages are converging and building momentum, with a directional move imminent | Volume increased (1.6x)
════════════════════
🔔 Follow for real-time market updates 🔔
#技术分析 #NBIS #BE #AMAT
📌 When trading, pay attention to whether the candlestick pattern confirms the signal
$NBIS / $BE / $AMAT : Technical indicators are strengthening across the board on the 30-minute chart—which has the most breakout potential? 🔥
════════════════════
🔴 $NBIS 30-minute bullish signal
⚠️Technical analysis: ADX(31): clear trending market | MACD DIF breaks above the zero line, signaling a bullish trend | Moving averages are converging and building momentum, with a directional move imminent | Volume increased (1.6x)
════════════════════
🔴 $BE 30-minute bullish signal
⚠️Technical analysis: ADX(35): clear trending market | MACD DIF breaks above the zero line, signaling a bullish trend | Moving averages are converging and building momentum, with a directional move imminent | Volume increased (2.2x)
════════════════════
🔴 $AMAT 30-minute bullish signal
⚠️Technical analysis: ADX(45): clear trending market | MACD DIF breaks above the zero line, signaling a bullish trend | Moving averages are converging and building momentum, with a directional move imminent | Volume increased (1.6x)
════════════════════
🔔 Follow for real-time market updates 🔔
#技术分析 #NBIS #BE #AMAT
📌 When trading, pay attention to whether the candlestick pattern confirms the signal
════════════════════
🔴 $NBIS 30-minute bullish signal
⚠️Technical analysis: ADX(31): clear trending market | MACD DIF breaks above the zero line, signaling a bullish trend | Moving averages are converging and building momentum, with a directional move imminent | Volume increased (1.6x)
════════════════════
🔴 $BE 30-minute bullish signal
⚠️Technical analysis: ADX(35): clear trending market | MACD DIF breaks above the zero line, signaling a bullish trend | Moving averages are converging and building momentum, with a directional move imminent | Volume increased (2.2x)
════════════════════
🔴 $AMAT 30-minute bullish signal
⚠️Technical analysis: ADX(45): clear trending market | MACD DIF breaks above the zero line, signaling a bullish trend | Moving averages are converging and building momentum, with a directional move imminent | Volume increased (1.6x)
════════════════════
🔔 Follow for real-time market updates 🔔
#技术分析 #NBIS #BE #AMAT
📌 When trading, pay attention to whether the candlestick pattern confirms the signal
7


·
--
Bullish
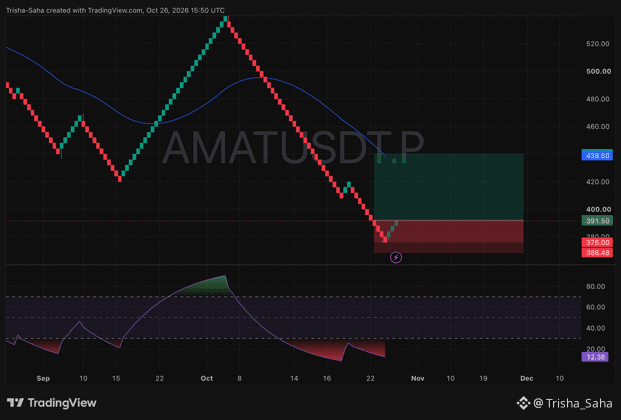
💎 $AMAT IS FLASHING A MAJOR REVERSAL SIGNAL! 🎯⚡
Sellers just ran completely out of steam, and bulls have taken firm control at the lows. This clean bounce is setting us up for an explosive upside run! 🚀🔥
📍 Trade Setup:
• Entry Zone: $385.00 – $391.50
• Stop Loss: $368.48
• Target: $438.80
📌 Chart Analysis:
• Price swept local lows and printed a sharp bullish reaction directly off key support.
• Downward momentum has fully evaporated as buyers step in with heavy accumulation.
• The chart is cleared for a fast liquidity sweep toward our upper target.
🛡️ Risk Protocol:
Protect your capital by shifting your Stop Loss to Break-Even the moment this trade crosses +3% to +4% in profit!
I've already locked in my position. Are you grabbing this breakout or watching from the sidelines? Drop a 🔥 below! 👇
#AMAT #AMATUSDT #CryptoGems #TradingCommunity
{future}(AMATUSDT)
💎 $AMAT IS FLASHING A MAJOR REVERSAL SIGNAL! 🎯⚡
Sellers just ran completely out of steam, and bulls have taken firm control at the lows. This clean bounce is setting us up for an explosive upside run! 🚀🔥
📍 Trade Setup:
• Entry Zone: $385.00 – $391.50
• Stop Loss: $368.48
• Target: $438.80
📌 Chart Analysis:
• Price swept local lows and printed a sharp bullish reaction directly off key support.
• Downward momentum has fully evaporated as buyers step in with heavy accumulation.
• The chart is cleared for a fast liquidity sweep toward our upper target.
🛡️ Risk Protocol:
Protect your capital by shifting your Stop Loss to Break-Even the moment this trade crosses +3% to +4% in profit!
I've already locked in my position. Are you grabbing this breakout or watching from the sidelines? Drop a 🔥 below! 👇
#AMAT #AMATUSDT #CryptoGems #TradingCommunity
Sellers just ran completely out of steam, and bulls have taken firm control at the lows. This clean bounce is setting us up for an explosive upside run! 🚀🔥
📍 Trade Setup:
• Entry Zone: $385.00 – $391.50
• Stop Loss: $368.48
• Target: $438.80
📌 Chart Analysis:
• Price swept local lows and printed a sharp bullish reaction directly off key support.
• Downward momentum has fully evaporated as buyers step in with heavy accumulation.
• The chart is cleared for a fast liquidity sweep toward our upper target.
🛡️ Risk Protocol:
Protect your capital by shifting your Stop Loss to Break-Even the moment this trade crosses +3% to +4% in profit!
I've already locked in my position. Are you grabbing this breakout or watching from the sidelines? Drop a 🔥 below! 👇
#AMAT #AMATUSDT #CryptoGems #TradingCommunity
136
·
--
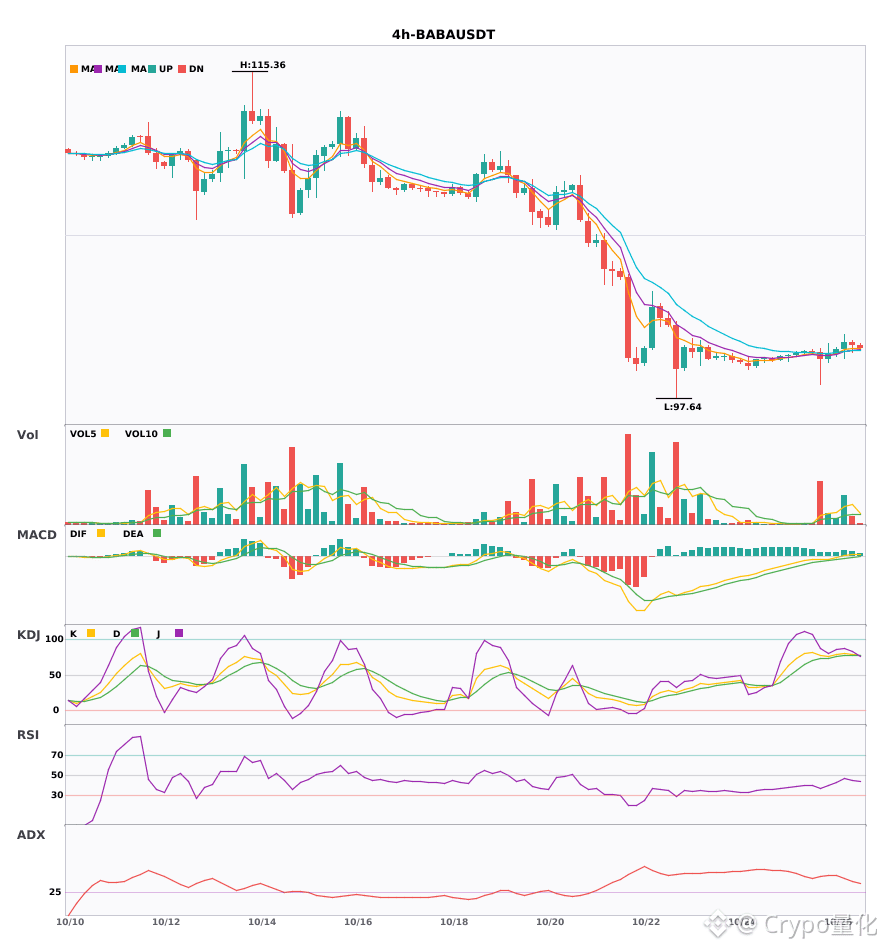
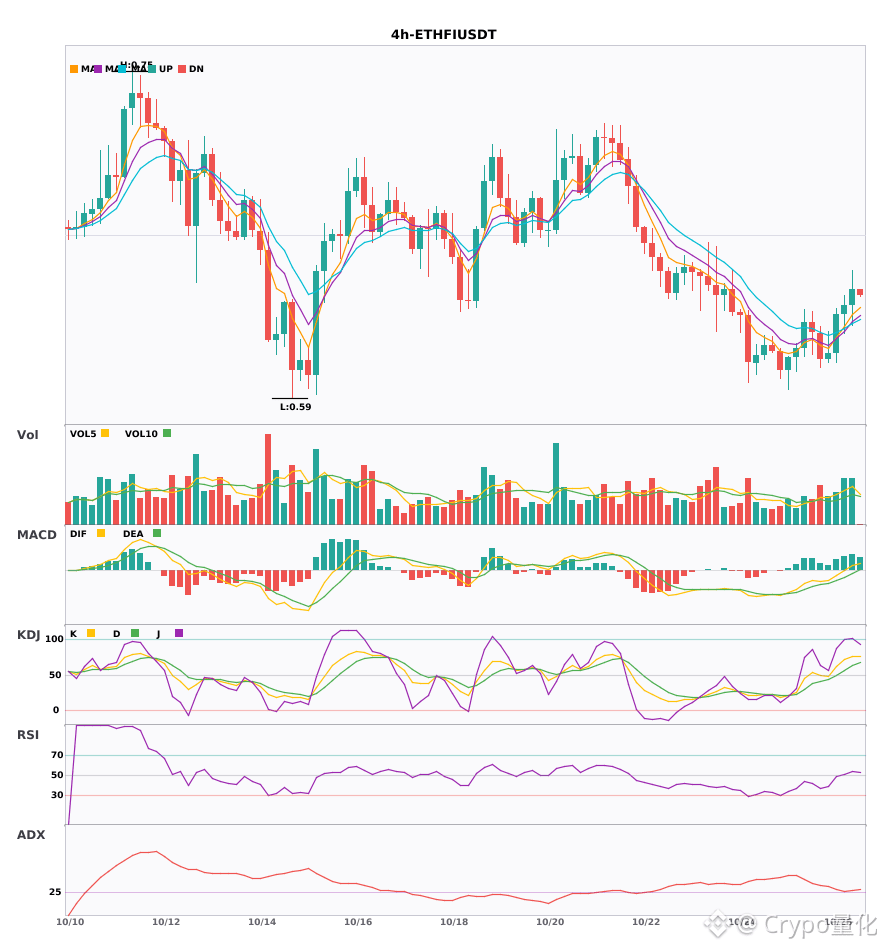
$BABA / $ETHFI / $AMAT are bullish on the 4-hour timeframe, with short-term confluence opportunities 🔥
════════════════════
🔴 $BABA 4-hour bullish signal
⚠️ Technical analysis: ADX (33): clear trending market | MACD is bullish, trend is strong, momentum is weakening | EMA5 > EMA8 > EMA13: bullish alignment | KDJ is strong, with bulls in control (K: 79.4, D: 77.8) | Volume surge (3.0x)
════════════════════
🔴 $ETHFI 4-hour bullish signal
⚠️ Technical analysis: ADX (28): trend is forming; opportunity to participate | MACD is bullish, trend is strong, momentum is strengthening | EMA5 > EMA8 > EMA13: bullish alignment | KDJ is strong, with bulls in control (K: 75.7, D: 63.2) | Volume increase (1.7x)
════════════════════
🔴 $AMAT 4-hour bullish signal
⚠️ Technical analysis: ADX (33): clear trending market | MACD is bullish, trend is strong, momentum is strengthening | EMA5 > EMA8 > EMA13: bullish alignment | KDJ is strong, with bulls in control (K: 65.1, D: 57.1) | Volume surge (4.6x)
════════════════════
🔔 Follow for the latest market updates 🔔
#技术分析 #BABA #ETHFI #AMAT
📌 When trading, check whether the candlestick patterns align
$BABA / $ETHFI / $AMAT are bullish on the 4-hour timeframe, with short-term confluence opportunities 🔥
════════════════════
🔴 $BABA 4-hour bullish signal
⚠️ Technical analysis: ADX (33): clear trending market | MACD is bullish, trend is strong, momentum is weakening | EMA5 > EMA8 > EMA13: bullish alignment | KDJ is strong, with bulls in control (K: 79.4, D: 77.8) | Volume surge (3.0x)
════════════════════
🔴 $ETHFI 4-hour bullish signal
⚠️ Technical analysis: ADX (28): trend is forming; opportunity to participate | MACD is bullish, trend is strong, momentum is strengthening | EMA5 > EMA8 > EMA13: bullish alignment | KDJ is strong, with bulls in control (K: 75.7, D: 63.2) | Volume increase (1.7x)
════════════════════
🔴 $AMAT 4-hour bullish signal
⚠️ Technical analysis: ADX (33): clear trending market | MACD is bullish, trend is strong, momentum is strengthening | EMA5 > EMA8 > EMA13: bullish alignment | KDJ is strong, with bulls in control (K: 65.1, D: 57.1) | Volume surge (4.6x)
════════════════════
🔔 Follow for the latest market updates 🔔
#技术分析 #BABA #ETHFI #AMAT
📌 When trading, check whether the candlestick patterns align
════════════════════
🔴 $BABA 4-hour bullish signal
⚠️ Technical analysis: ADX (33): clear trending market | MACD is bullish, trend is strong, momentum is weakening | EMA5 > EMA8 > EMA13: bullish alignment | KDJ is strong, with bulls in control (K: 79.4, D: 77.8) | Volume surge (3.0x)
════════════════════
🔴 $ETHFI 4-hour bullish signal
⚠️ Technical analysis: ADX (28): trend is forming; opportunity to participate | MACD is bullish, trend is strong, momentum is strengthening | EMA5 > EMA8 > EMA13: bullish alignment | KDJ is strong, with bulls in control (K: 75.7, D: 63.2) | Volume increase (1.7x)
════════════════════
🔴 $AMAT 4-hour bullish signal
⚠️ Technical analysis: ADX (33): clear trending market | MACD is bullish, trend is strong, momentum is strengthening | EMA5 > EMA8 > EMA13: bullish alignment | KDJ is strong, with bulls in control (K: 65.1, D: 57.1) | Volume surge (4.6x)
════════════════════
🔔 Follow for the latest market updates 🔔
#技术分析 #BABA #ETHFI #AMAT
📌 When trading, check whether the candlestick patterns align
7
·
--
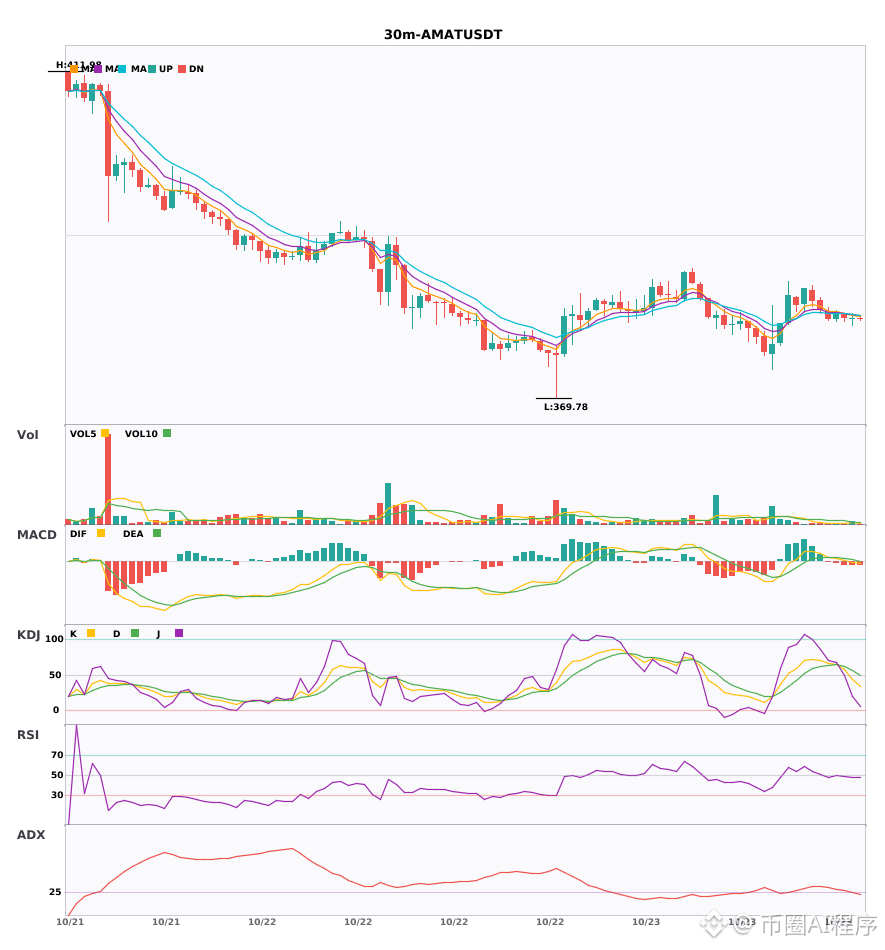
$AMAT 30-minute confluence with the 4-hour bearish trend. Bearish alert—beware of risk 🔥
════════════════════
🟢 $AMAT 30-minute bearish signal
⚠️ Technical analysis: 4-hour bearish confluence confirmed | 30-minute entry: MACDDIF has fallen below the zero line, signaling a bearish trend | EMA5 < EMA8 < EMA13, bearish alignment | Volume normal (1.5x)
════════════════════
🔔 Follow us for the latest market movements 🔔
#多周期共振 #AMAT
📌 When trading, check whether the candlestick pattern confirms the signal
$AMAT 30-minute confluence with the 4-hour bearish trend. Bearish alert—beware of risk 🔥
════════════════════
🟢 $AMAT 30-minute bearish signal
⚠️ Technical analysis: 4-hour bearish confluence confirmed | 30-minute entry: MACDDIF has fallen below the zero line, signaling a bearish trend | EMA5 < EMA8 < EMA13, bearish alignment | Volume normal (1.5x)
════════════════════
🔔 Follow us for the latest market movements 🔔
#多周期共振 #AMAT
📌 When trading, check whether the candlestick pattern confirms the signal
════════════════════
🟢 $AMAT 30-minute bearish signal
⚠️ Technical analysis: 4-hour bearish confluence confirmed | 30-minute entry: MACDDIF has fallen below the zero line, signaling a bearish trend | EMA5 < EMA8 < EMA13, bearish alignment | Volume normal (1.5x)
════════════════════
🔔 Follow us for the latest market movements 🔔
#多周期共振 #AMAT
📌 When trading, check whether the candlestick pattern confirms the signal
10
·
--
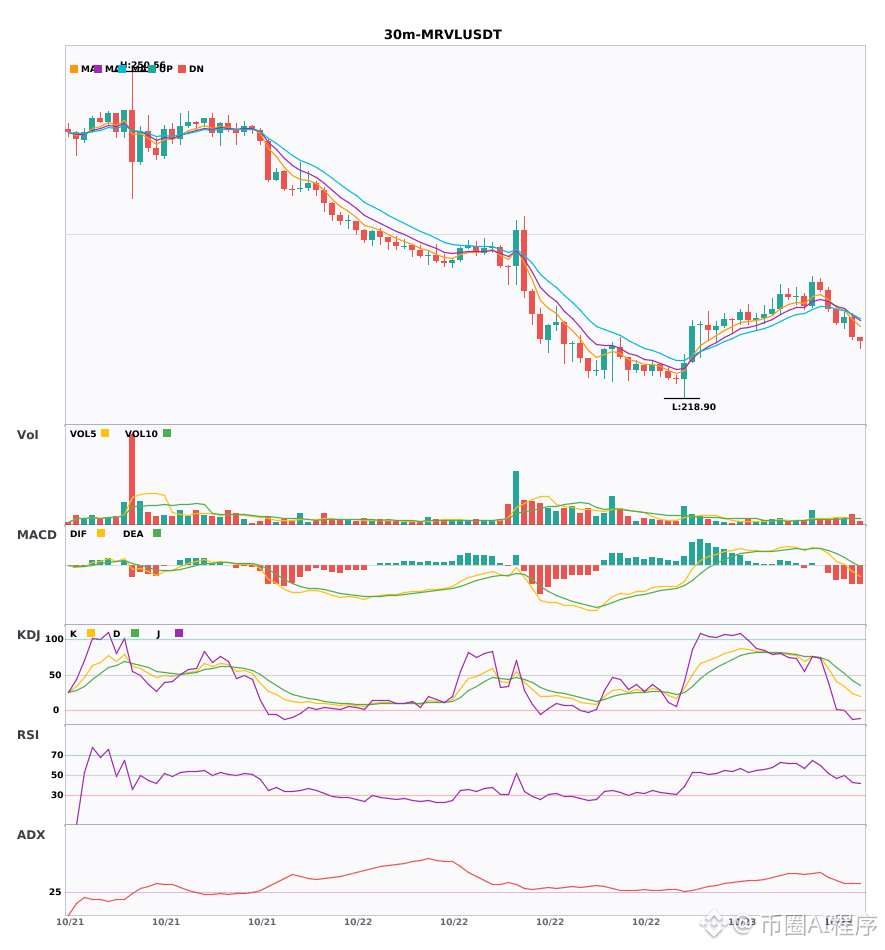
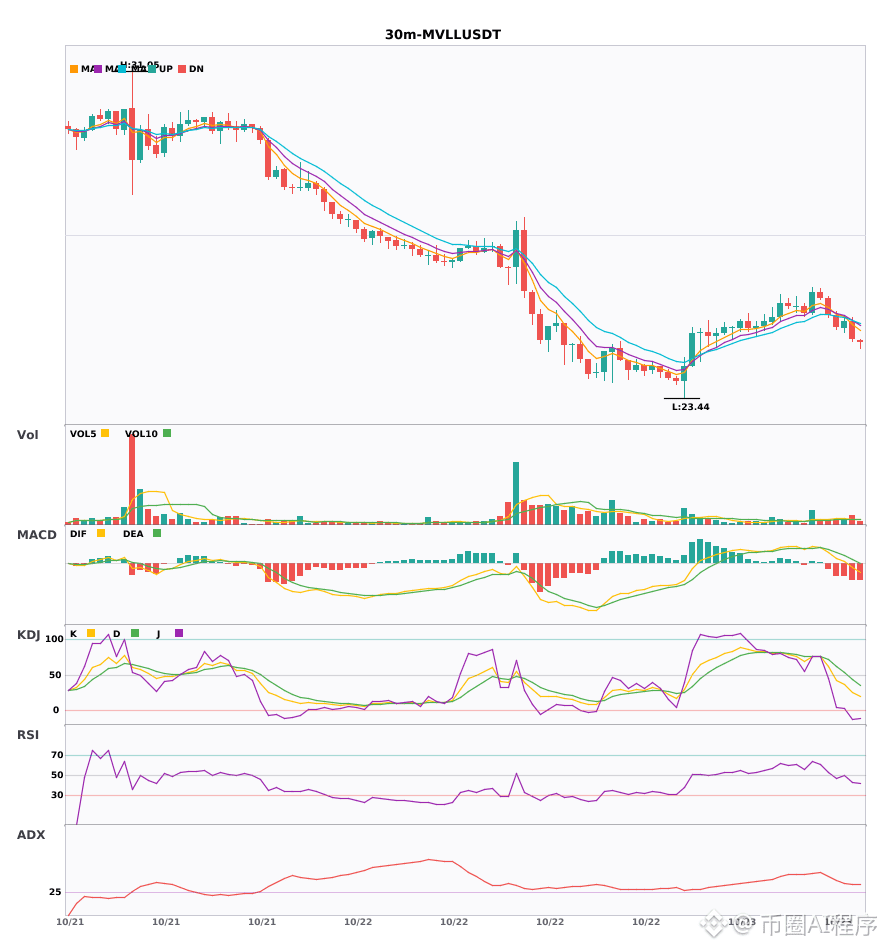
$MRVL / $MVLL / $AMAT 30-minute short signals, with 4-hour bearish trend confirmation 🔥
════════════════════
🟢 $MRVL 30-minute short signal
⚠️Technical analysis: 4-hour bearish confluence confirmed | 30-minute entry: MACD DIF fell below zero, signaling a bearish trend | EMA5 < EMA8 < EMA13, bearish alignment | KDJ is weak, with bears in control (K: 24.5, D: 42.6) | Volume increased (1.6x)
════════════════════
🟢 $MVLL 30-minute short signal
⚠️Technical analysis: 4-hour bearish confluence confirmed | 30-minute entry: MACD DIF fell below zero, signaling a bearish trend | EMA5 < EMA8 < EMA13, bearish alignment | KDJ is weak, with bears in control (K: 25.2, D: 43.9) | Volume increased (1.7x)
════════════════════
🟢 $AMAT 30-minute short signal
⚠️Technical analysis: 4-hour bearish confluence confirmed | 30-minute entry: MACD is bearish; the trend is weak and momentum is strengthening | EMA5 < EMA8 < EMA13, bearish alignment | KDJ is weak, with bears in control (K: 25.5, D: 42.8) | Volume surged (4.2x)
════════════════════
🔔 Follow for the latest market alerts 🔔
#多周期共振 #MRVL #MVLL #AMAT
📌 When trading, watch for candlestick patterns that confirm the signal
$MRVL / $MVLL / $AMAT 30-minute short signals, with 4-hour bearish trend confirmation 🔥
════════════════════
🟢 $MRVL 30-minute short signal
⚠️Technical analysis: 4-hour bearish confluence confirmed | 30-minute entry: MACD DIF fell below zero, signaling a bearish trend | EMA5 < EMA8 < EMA13, bearish alignment | KDJ is weak, with bears in control (K: 24.5, D: 42.6) | Volume increased (1.6x)
════════════════════
🟢 $MVLL 30-minute short signal
⚠️Technical analysis: 4-hour bearish confluence confirmed | 30-minute entry: MACD DIF fell below zero, signaling a bearish trend | EMA5 < EMA8 < EMA13, bearish alignment | KDJ is weak, with bears in control (K: 25.2, D: 43.9) | Volume increased (1.7x)
════════════════════
🟢 $AMAT 30-minute short signal
⚠️Technical analysis: 4-hour bearish confluence confirmed | 30-minute entry: MACD is bearish; the trend is weak and momentum is strengthening | EMA5 < EMA8 < EMA13, bearish alignment | KDJ is weak, with bears in control (K: 25.5, D: 42.8) | Volume surged (4.2x)
════════════════════
🔔 Follow for the latest market alerts 🔔
#多周期共振 #MRVL #MVLL #AMAT
📌 When trading, watch for candlestick patterns that confirm the signal
════════════════════
🟢 $MRVL 30-minute short signal
⚠️Technical analysis: 4-hour bearish confluence confirmed | 30-minute entry: MACD DIF fell below zero, signaling a bearish trend | EMA5 < EMA8 < EMA13, bearish alignment | KDJ is weak, with bears in control (K: 24.5, D: 42.6) | Volume increased (1.6x)
════════════════════
🟢 $MVLL 30-minute short signal
⚠️Technical analysis: 4-hour bearish confluence confirmed | 30-minute entry: MACD DIF fell below zero, signaling a bearish trend | EMA5 < EMA8 < EMA13, bearish alignment | KDJ is weak, with bears in control (K: 25.2, D: 43.9) | Volume increased (1.7x)
════════════════════
🟢 $AMAT 30-minute short signal
⚠️Technical analysis: 4-hour bearish confluence confirmed | 30-minute entry: MACD is bearish; the trend is weak and momentum is strengthening | EMA5 < EMA8 < EMA13, bearish alignment | KDJ is weak, with bears in control (K: 25.5, D: 42.8) | Volume surged (4.2x)
════════════════════
🔔 Follow for the latest market alerts 🔔
#多周期共振 #MRVL #MVLL #AMAT
📌 When trading, watch for candlestick patterns that confirm the signal
18
·
--
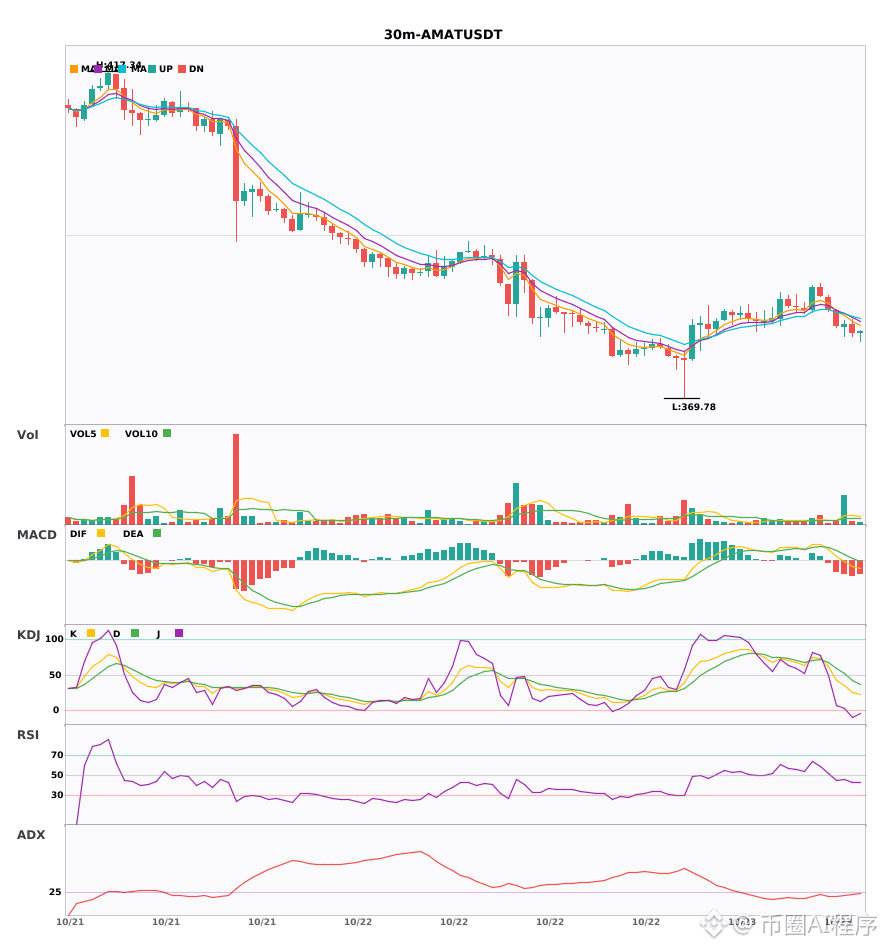
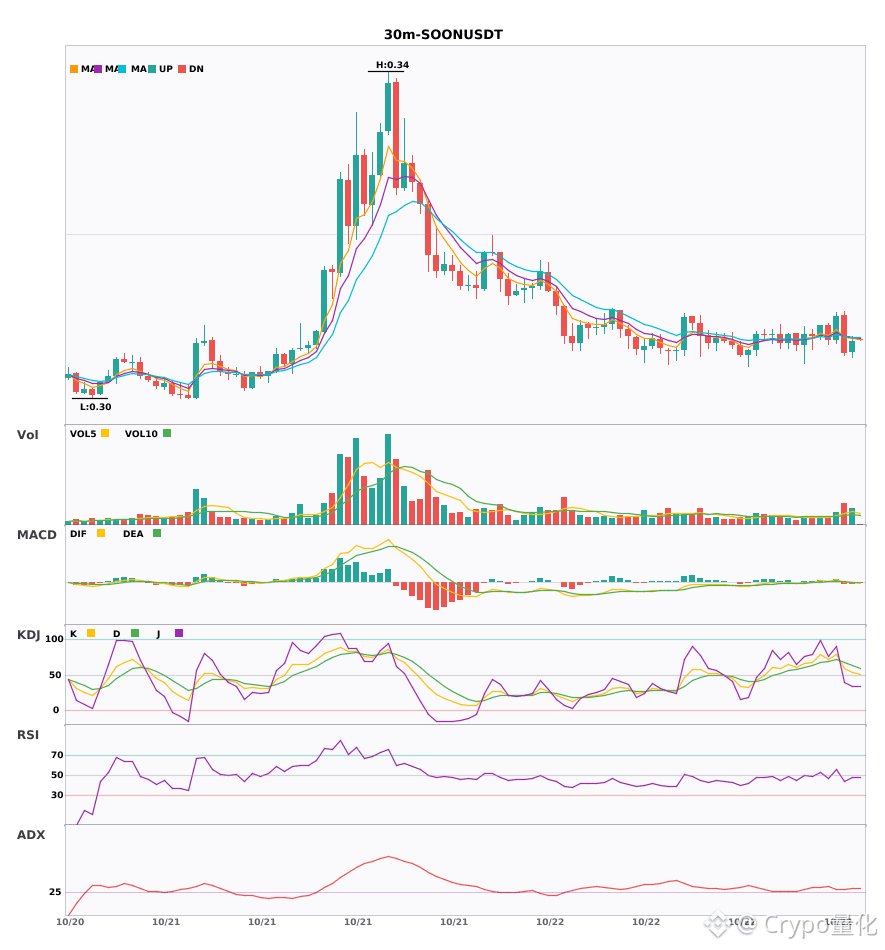
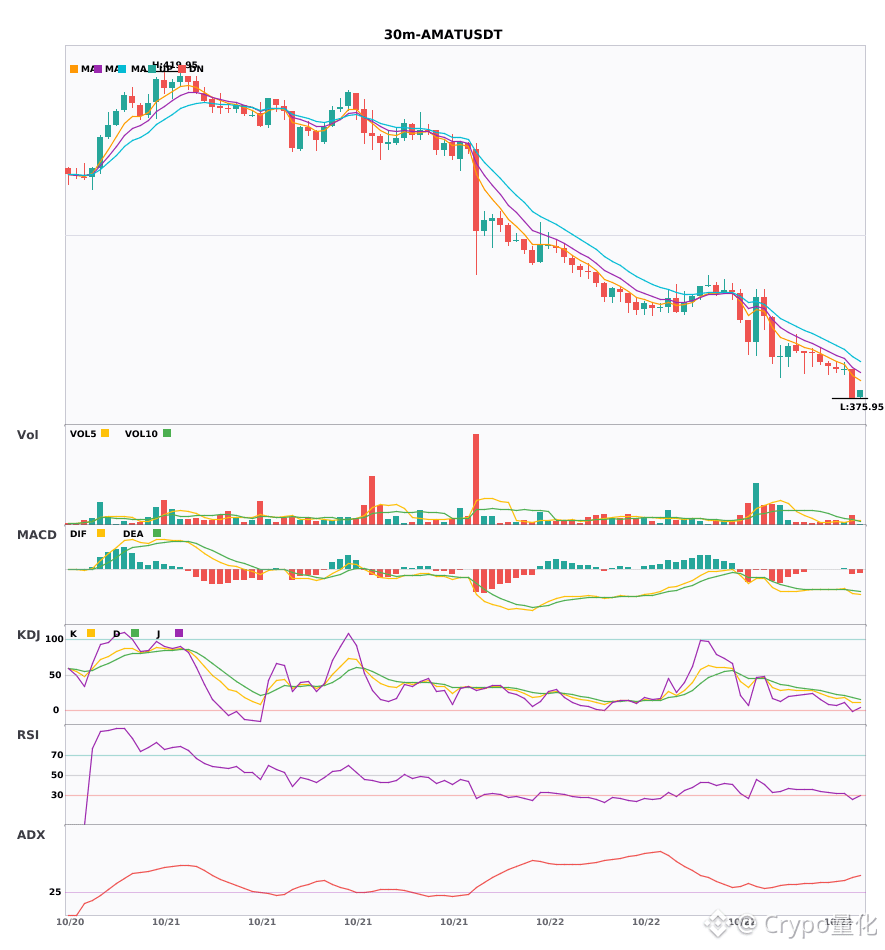
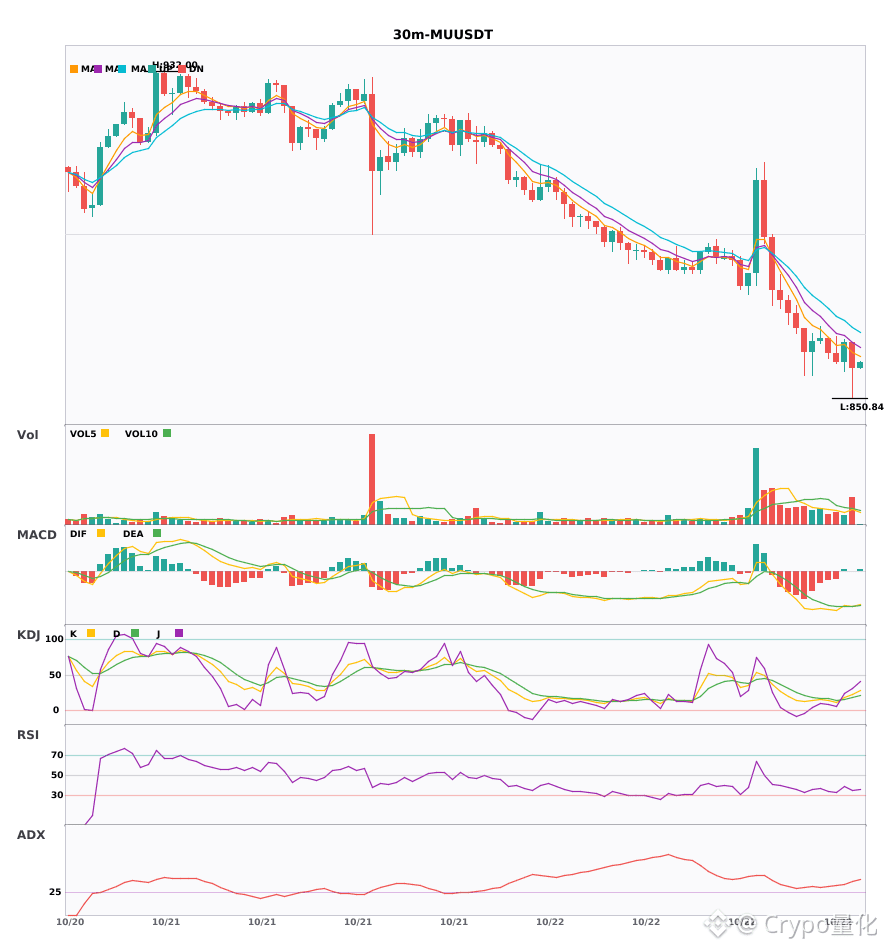
$SOON / $AMAT / $MU 30-minute timeframe bearish, facing short-term pressure 🔥
════════════════════
🟢 $SOON 30-minute bearish signal
⚠️Technical analysis: ADX(29) Trend is forming; potential opportunity to participate | MACD bearish, trend is weak and momentum is fading | EMA5 < EMA8 < EMA13, bearish alignment | KDJ showing strength, bulls in control (K: 53.4, D: 62.8) | Volume increased (2.2x)
════════════════════
🟢 $AMAT 30-minute bearish signal
⚠️Technical analysis: ADX(43) Clear trending market | MACD bearish cross below zero, bearish momentum accelerating | EMA5 < EMA8 < EMA13, bearish alignment | KDJ in oversold territory; watch for a rebound opportunity (K: 11.9, D: 18.1) | Volume increased (1.8x)
════════════════════
🟢 $MU 30-minute bearish signal
⚠️Technical analysis: ADX(39) Clear trending market | MACD bearish cross below zero, bearish momentum accelerating | EMA5 < EMA8 < EMA13, bearish alignment | KDJ showing weakness, bears in control (K: 22.4, D: 18.4) | Volume increased (1.7x)
📢Market update: Binance Will Support Micron Technology (MU) Cash Dividend Distribution via bStocks
════════════════════
🔔 Follow for first-hand market movements 🔔
#技术分析 #SOON #AMAT #MU
📌 When trading, pay attention to whether the candlestick pattern confirms the setup
$SOON / $AMAT / $MU 30-minute timeframe bearish, facing short-term pressure 🔥
════════════════════
🟢 $SOON 30-minute bearish signal
⚠️Technical analysis: ADX(29) Trend is forming; potential opportunity to participate | MACD bearish, trend is weak and momentum is fading | EMA5 < EMA8 < EMA13, bearish alignment | KDJ showing strength, bulls in control (K: 53.4, D: 62.8) | Volume increased (2.2x)
════════════════════
🟢 $AMAT 30-minute bearish signal
⚠️Technical analysis: ADX(43) Clear trending market | MACD bearish cross below zero, bearish momentum accelerating | EMA5 < EMA8 < EMA13, bearish alignment | KDJ in oversold territory; watch for a rebound opportunity (K: 11.9, D: 18.1) | Volume increased (1.8x)
════════════════════
🟢 $MU 30-minute bearish signal
⚠️Technical analysis: ADX(39) Clear trending market | MACD bearish cross below zero, bearish momentum accelerating | EMA5 < EMA8 < EMA13, bearish alignment | KDJ showing weakness, bears in control (K: 22.4, D: 18.4) | Volume increased (1.7x)
📢Market update: Binance Will Support Micron Technology (MU) Cash Dividend Distribution via bStocks
════════════════════
🔔 Follow for first-hand market movements 🔔
#技术分析 #SOON #AMAT #MU
📌 When trading, pay attention to whether the candlestick pattern confirms the setup
════════════════════
🟢 $SOON 30-minute bearish signal
⚠️Technical analysis: ADX(29) Trend is forming; potential opportunity to participate | MACD bearish, trend is weak and momentum is fading | EMA5 < EMA8 < EMA13, bearish alignment | KDJ showing strength, bulls in control (K: 53.4, D: 62.8) | Volume increased (2.2x)
════════════════════
🟢 $AMAT 30-minute bearish signal
⚠️Technical analysis: ADX(43) Clear trending market | MACD bearish cross below zero, bearish momentum accelerating | EMA5 < EMA8 < EMA13, bearish alignment | KDJ in oversold territory; watch for a rebound opportunity (K: 11.9, D: 18.1) | Volume increased (1.8x)
════════════════════
🟢 $MU 30-minute bearish signal
⚠️Technical analysis: ADX(39) Clear trending market | MACD bearish cross below zero, bearish momentum accelerating | EMA5 < EMA8 < EMA13, bearish alignment | KDJ showing weakness, bears in control (K: 22.4, D: 18.4) | Volume increased (1.7x)
📢Market update: Binance Will Support Micron Technology (MU) Cash Dividend Distribution via bStocks
════════════════════
🔔 Follow for first-hand market movements 🔔
#技术分析 #SOON #AMAT #MU
📌 When trading, pay attention to whether the candlestick pattern confirms the setup
15
Log in to explore more content
Join global crypto users on Binance Square
⚡️ Get latest and useful information about crypto.
💬 Trusted by the world’s largest crypto exchange.
👍 Discover real insights from verified creators.
Email / Phone number
Trending Topics
1
#WhoWillSucceedJensenHuangatNvidia?
181,716 views
1,685 Discussing
2
#WhatWillDriveCryptoandStocks’NextRebound?
592,006 views
3,525 Discussing
3
#TradFiForBeginners
740,266 views
4,498 Discussing
4
#BitcoinActiveSupplyInProfitDropsBelow45%
81,239 views
743 Discussing
5
#KavaSaysAbnormalActivityLimitedToKavaLend
45,398 views
412 Discussing
6
#USSpotXRPETFsSeeLargestWeeklyOutflowIn8Months
34,710 views
354 Discussing
7
#USPPIMissMayEaseBTCPressure
311,692 views
2,284 Discussing
8
#WORPTLetsTouristsConvertCryptoToThaiBaht
10,893 views
102 Discussing
9
#TONStrategyReports$23.97MQ3NetLoss
10,912 views
44 Discussing
10
#PolkadotCommunityApprovesNewStrategyWith97%Vote
30,198 views
296 Discussing